Embed Size (px)
Citation preview

Facilitating Agricultural Commodity Price and Weather
Risk Management: Policy Options and Practical Instruments
Alexander SarrisDirector, Trade and Markets Division,
FAOPresentation at the International Conference
on Rural Finance Research, FAO Headquarters, Rome, 19-21 March 2007
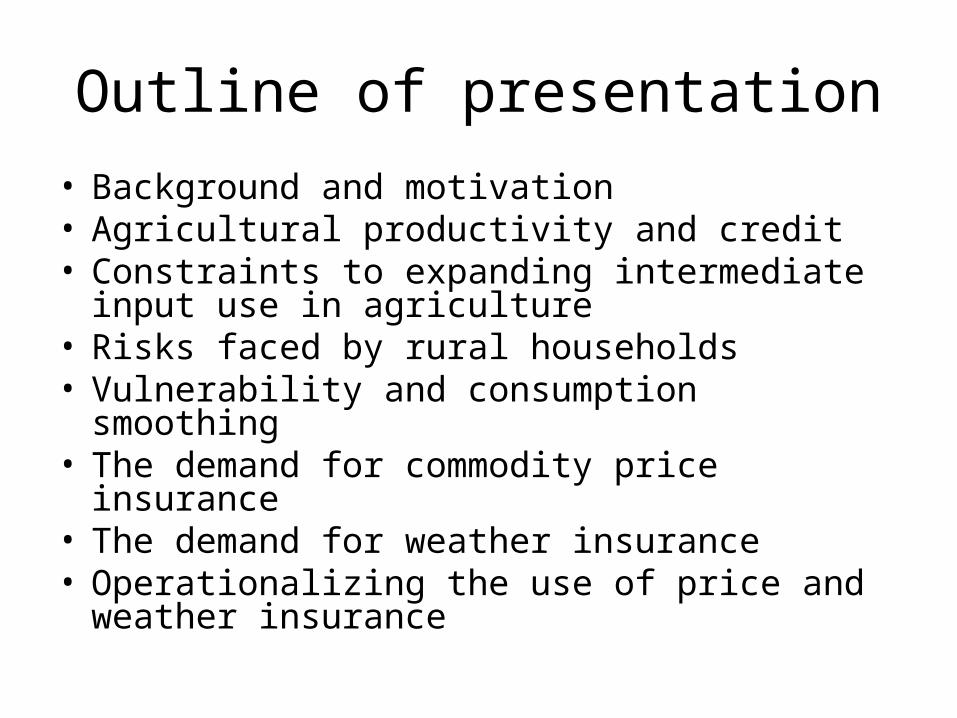
Outline of presentation
• Background and motivation• Agricultural productivity and credit• Constraints to expanding intermediate input use
in agriculture• Risks faced by rural households• Vulnerability and consumption smoothing• The demand for commodity price insurance• The demand for weather insurance• Operationalizing the use of price and weather
insurance
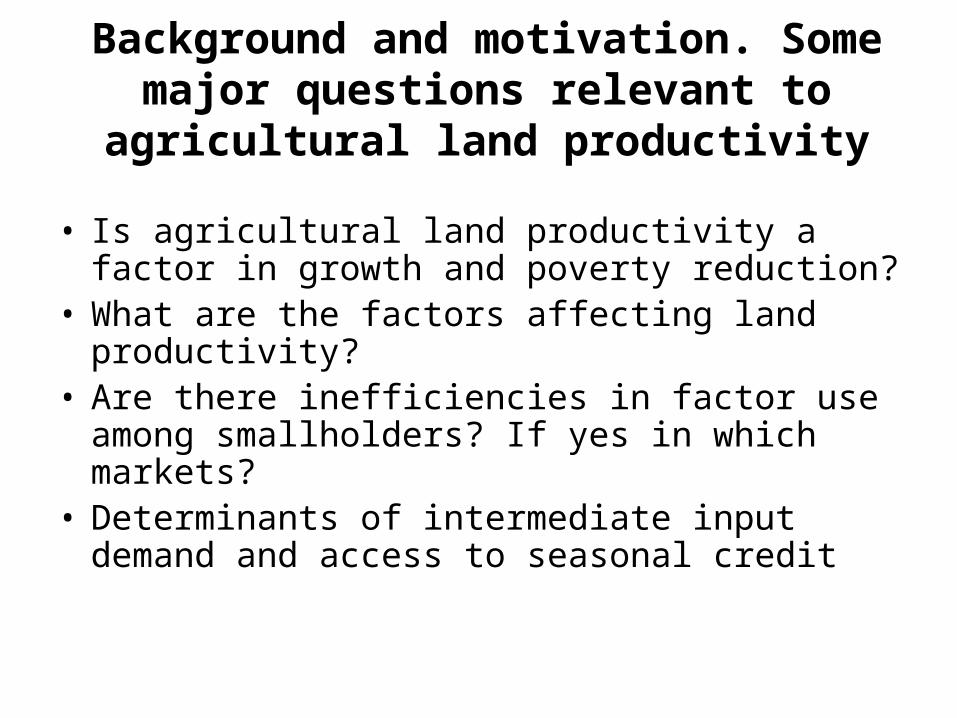
Background and motivation. Some major questions relevant to agricultural
land productivity
• Is agricultural land productivity a factor in growth and poverty reduction?
• What are the factors affecting land productivity?• Are there inefficiencies in factor use among
smallholders? If yes in which markets?• Determinants of intermediate input demand and
access to seasonal credit
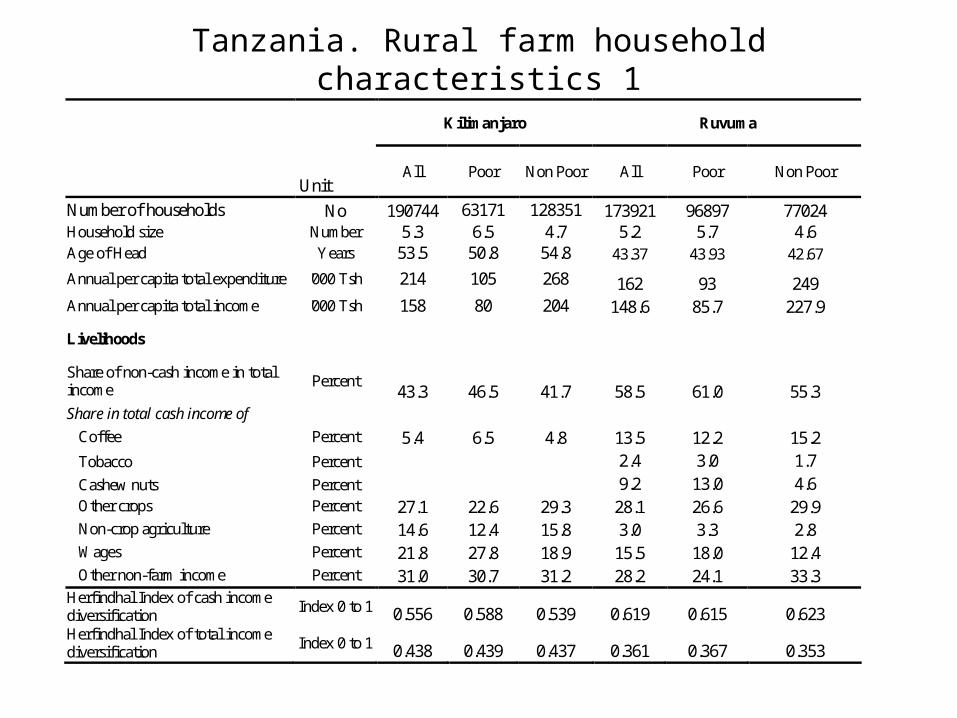
Tanzania. Rural farm household characteristics 1
Kilimanjaro Ruvuma
Unit All Poor Non Poor All Poor Non Poor
Number of households No 190744 63171 128351 173921 96897 77024 Household size Number 5.3 6.5 4.7 5.2 5.7 4.6 Age of Head Years 53.5 50.8 54.8 43.37 43.93 42.67
Annual per capita total expenditure '000 Tsh 214 105 268 162 93 249 Annual per capita total income '000 Tsh 158 80 204 148.6 85.7 227.9
Livelihoods
Share of non-cash income in total income
Percent 43.3 46.5 41.7 58.5 61.0 55.3
Share in total cash income of Coffee Percent 5.4 6.5 4.8 13.5 12.2 15.2 Tobacco Percent 2.4 3.0 1.7 Cashew nuts Percent 9.2 13.0 4.6 Other crops Percent 27.1 22.6 29.3 28.1 26.6 29.9 Non-crop agriculture Percent 14.6 12.4 15.8 3.0 3.3 2.8 Wages Percent 21.8 27.8 18.9 15.5 18.0 12.4 Other non-farm income Percent 31.0 30.7 31.2 28.2 24.1 33.3 Herfindhal Index of cash income diversification
Index 0 to 1 0.556 0.588 0.539 0.619 0.615 0.623 Herfindhal Index of total income diversification
Index 0 to 1 0.438 0.439 0.437 0.361 0.367 0.353
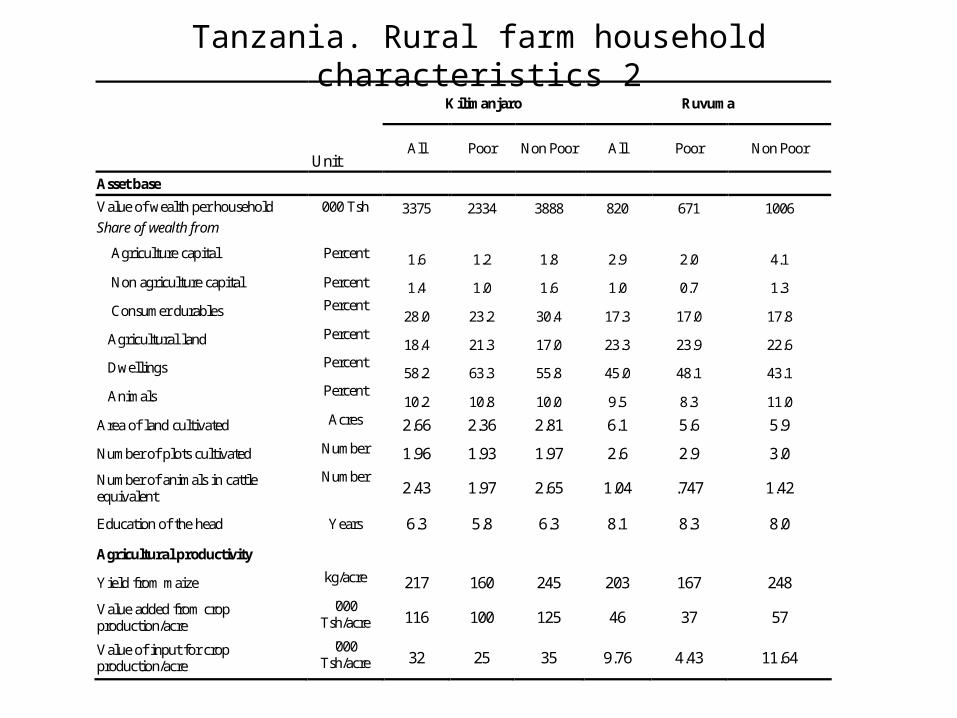
Tanzania. Rural farm household characteristics 2
Kilimanjaro Ruvuma
Unit All Poor Non Poor All Poor Non Poor
Asset base
Value of wealth per household 000 Tsh 3375 2334 3888 820 671 1006 Share of wealth from
Agriculture capital Percent 1.6 1.2 1.8 2.9 2.0 4.1
Non agriculture capital Percent 1.4 1.0 1.6 1.0 0.7 1.3
Consumer durables Percent 28.0 23.2 30.4 17.3 17.0 17.8
Agricultural land Percent 18.4 21.3 17.0 23.3 23.9 22.6
Dwellings Percent 58.2 63.3 55.8 45.0 48.1 43.1
Animals Percent 10.2 10.8 10.0 9.5 8.3 11.0
Area of land cultivated Acres 2.66 2.36 2.81 6.1 5.6 5.9
Number of plots cultivated Number 1.96 1.93 1.97 2.6 2.9 3.0
Number of animals in cattle equivalent
Number 2.43 1.97 2.65 1.04 .747 1.42
Education of the head Years 6.3 5.8 6.3 8.1 8.3 8.0
Agricultural productivity
Yield from maize kg/acre 217 160 245 203 167 248
Value added from crop production/acre
'000 Tsh/acre 116 100 125 46 37 57
Value of input for crop production/acre
'000 Tsh/acre 32 25 35 9.76 4.43 11.64
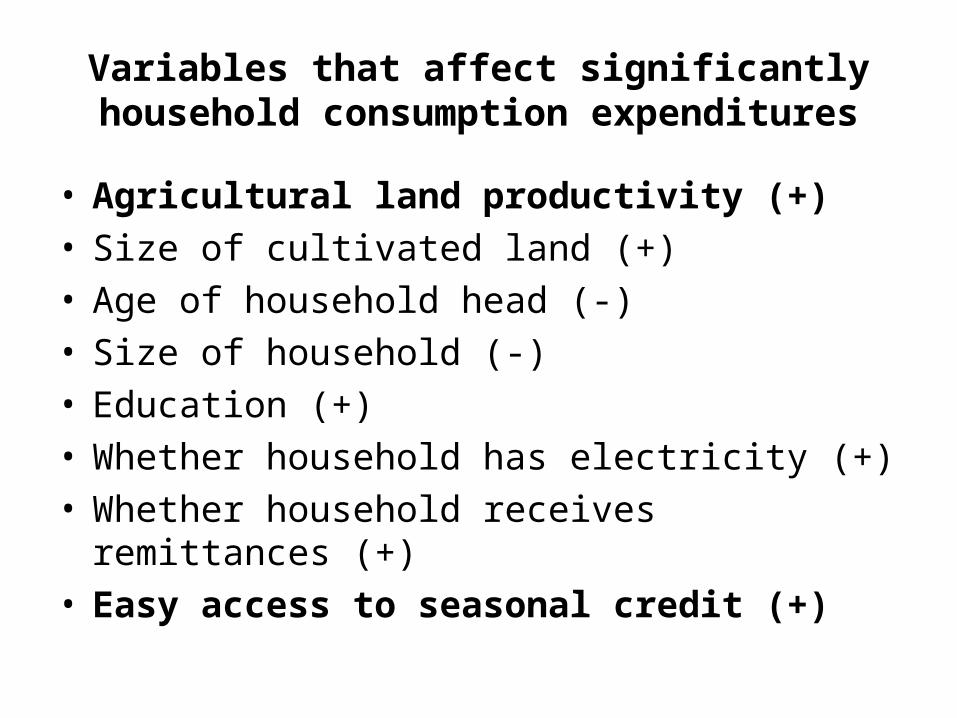
Variables that affect significantly household consumption expenditures
• Agricultural land productivity (+)• Size of cultivated land (+)• Age of household head (-)• Size of household (-)• Education (+)• Whether household has electricity (+)• Whether household receives remittances (+)• Easy access to seasonal credit (+)
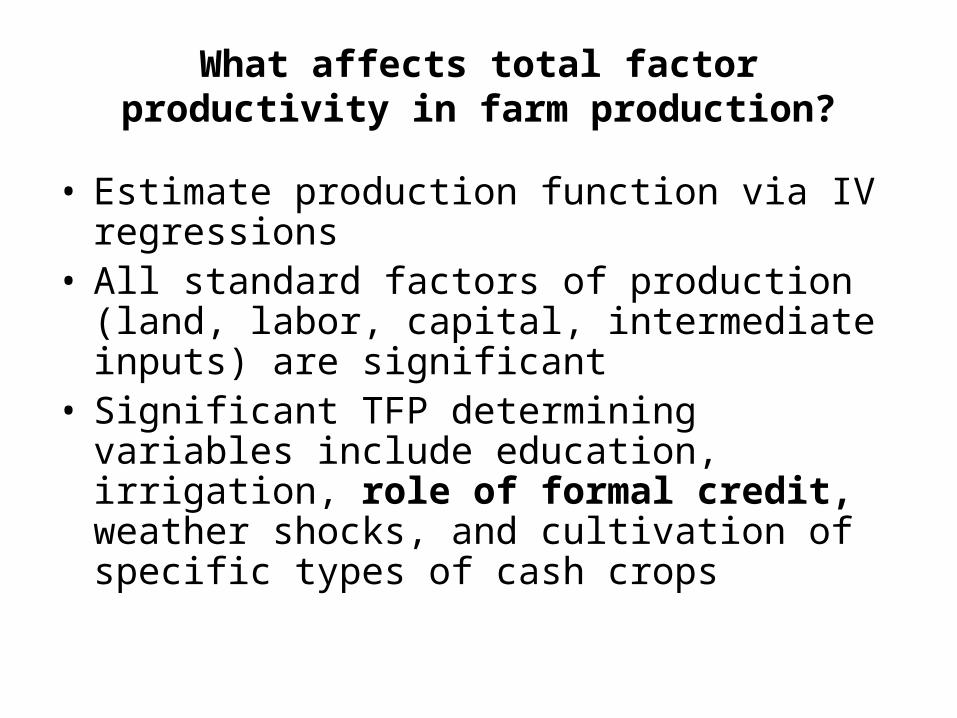
What affects total factor productivity in farm production?
• Estimate production function via IV regressions• All standard factors of production (land, labor,
capital, intermediate inputs) are significant• Significant TFP determining variables include
education, irrigation, role of formal credit, weather shocks, and cultivation of specific types of cash crops
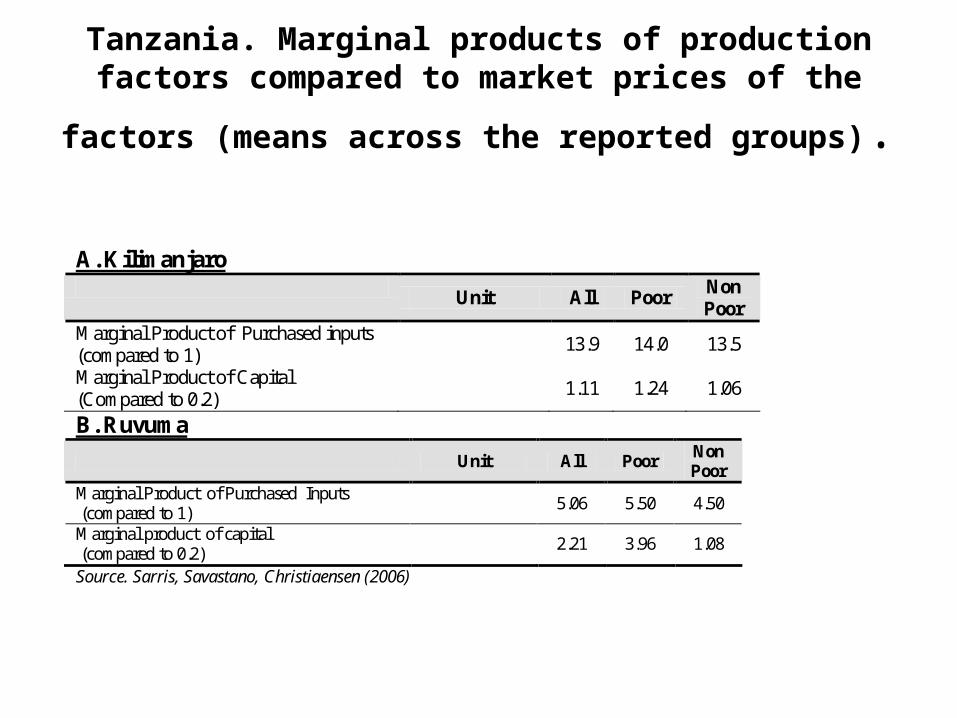
Tanzania. Marginal products of production factors compared to market prices of the factors (means
across the reported groups).
A. Kilimanjaro
Unit All Poor Non Poor
Marginal Product of Purchased inputs (compared to 1)
13.9 14.0 13.5
Marginal Product of Capital (Compared to 0.2)
1.11 1.24 1.06
B. Ruvuma
Unit All Poor Non Poor
Marginal Product of Purchased Inputs (compared to 1)
5.06 5.50 4.50
Marginal product of capital (compared to 0.2)
2.21 3.96 1.08
Source. Sarris, Savastano, Christiaensen (2006)
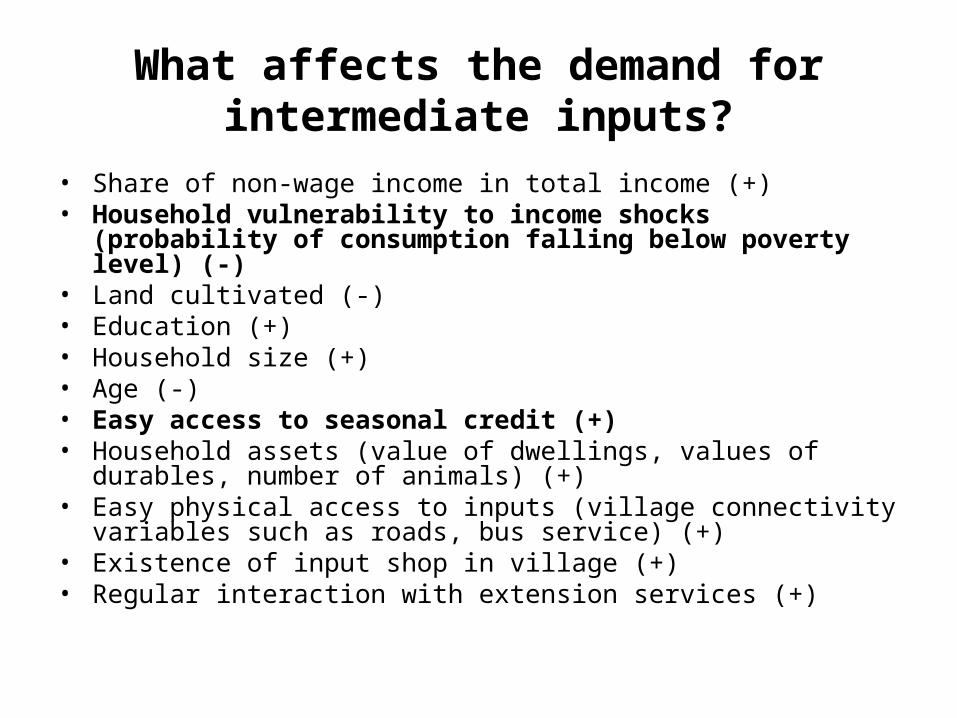
What affects the demand for intermediate inputs?
• Share of non-wage income in total income (+)• Household vulnerability to income shocks (probability of
consumption falling below poverty level) (-)• Land cultivated (-)• Education (+)• Household size (+)• Age (-)• Easy access to seasonal credit (+)• Household assets (value of dwellings, values of durables, number of
animals) (+)• Easy physical access to inputs (village connectivity variables such
as roads, bus service) (+)• Existence of input shop in village (+)• Regular interaction with extension services (+)
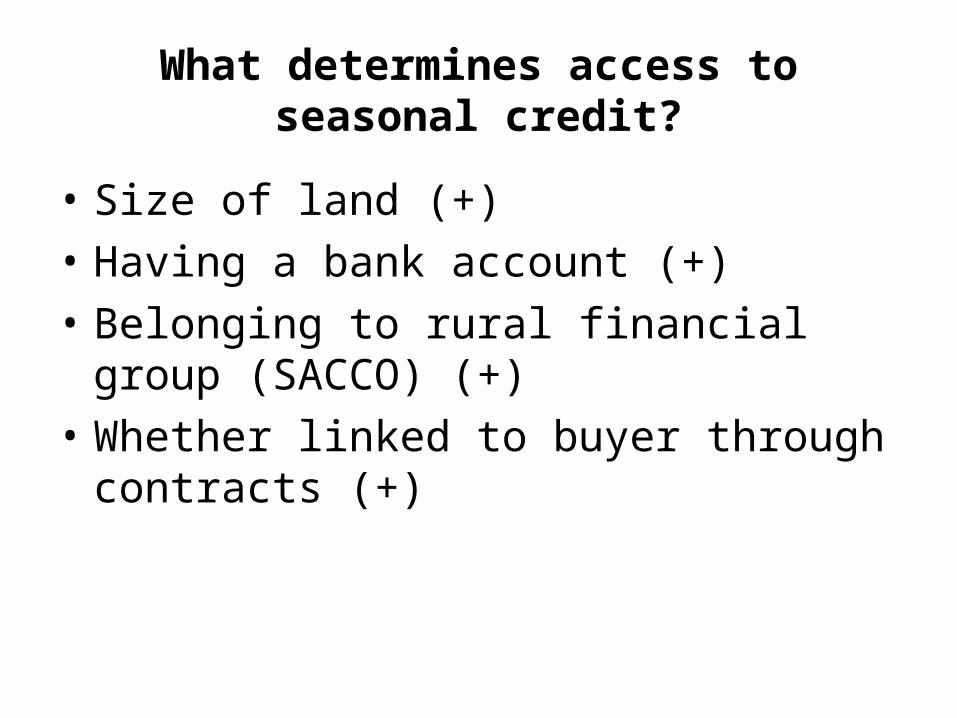
What determines access to seasonal credit?
• Size of land (+)
• Having a bank account (+)
• Belonging to rural financial group (SACCO) (+)
• Whether linked to buyer through contracts (+)
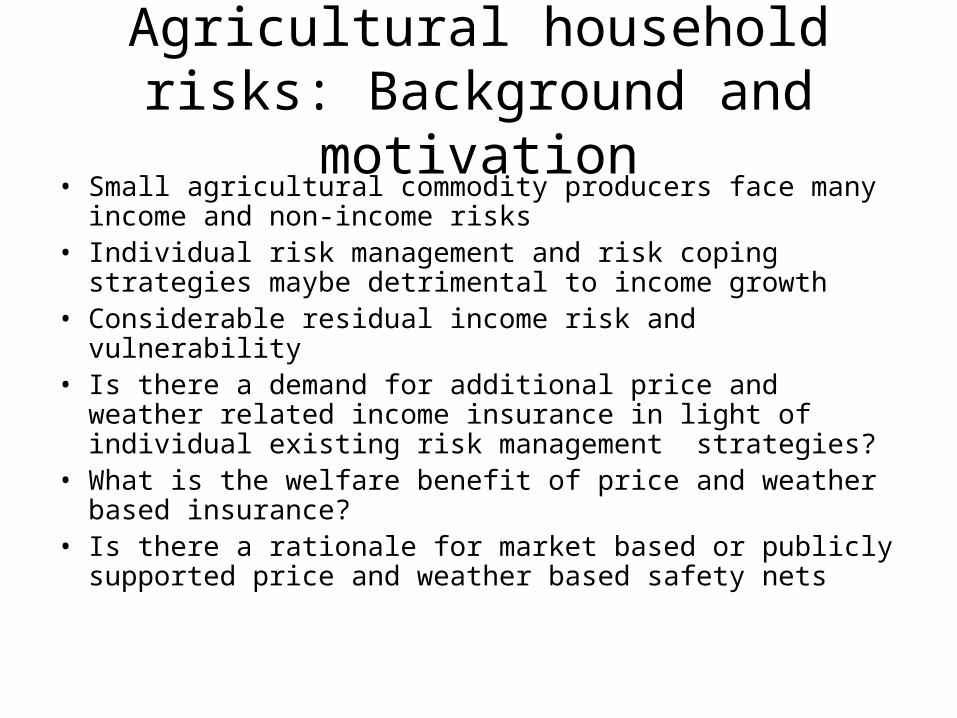
Agricultural household risks: Background and motivation
• Small agricultural commodity producers face many income and non-income risks
• Individual risk management and risk coping strategies maybe detrimental to income growth
• Considerable residual income risk and vulnerability• Is there a demand for additional price and weather
related income insurance in light of individual existing risk management strategies?
• What is the welfare benefit of price and weather based insurance?
• Is there a rationale for market based or publicly supported price and weather based safety nets
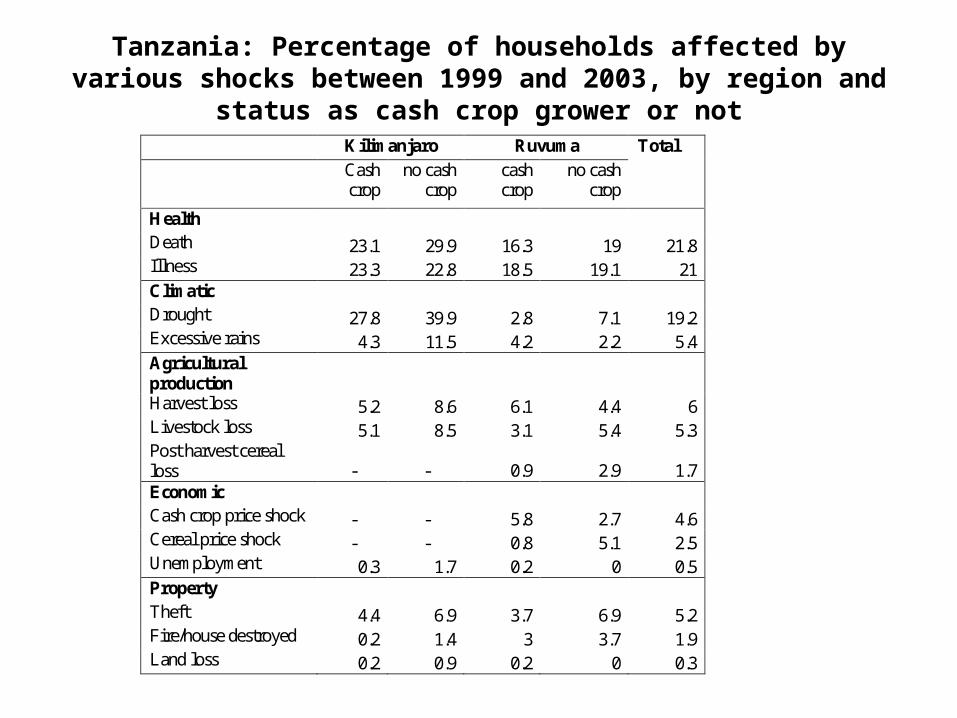
Tanzania: Percentage of households affected by various shocks between 1999 and 2003, by region and status as cash crop grower
or not Kilimanjaro Ruvuma
Cash crop
no cash crop
cash crop
no cash crop
Total
Health Death 23.1 29.9 16.3 19 21.8 Illness 23.3 22.8 18.5 19.1 21 Climatic Drought 27.8 39.9 2.8 7.1 19.2 Excessive rains 4.3 11.5 4.2 2.2 5.4 Agricultural production Harvest loss 5.2 8.6 6.1 4.4 6 Livestock loss 5.1 8.5 3.1 5.4 5.3 Post harvest cereal loss - - 0.9 2.9 1.7 Economic Cash crop price shock - - 5.8 2.7 4.6 Cereal price shock - - 0.8 5.1 2.5 Unemployment 0.3 1.7 0.2 0 0.5 Property Theft 4.4 6.9 3.7 6.9 5.2 Fire/house destroyed 0.2 1.4 3 3.7 1.9 Land loss 0.2 0.9 0.2 0 0.3
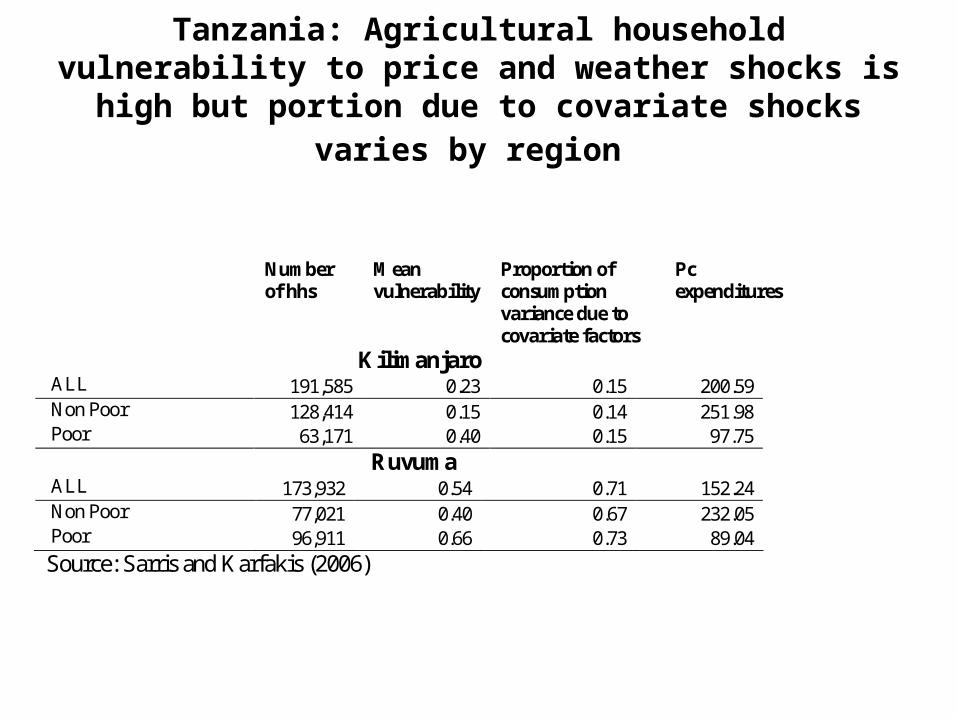
Tanzania: Agricultural household vulnerability to price and weather shocks is high but portion due to
covariate shocks varies by region
Number
of hhs Mean vulnerability
Proportion of consumption variance due to covariate factors
Pc expenditures
Kilimanjaro ALL 191,585 0.23 0.15 200.59 Non Poor 128,414 0.15 0.14 251.98 Poor 63,171 0.40 0.15 97.75
Ruvuma ALL 173,932 0.54 0.71 152.24 Non Poor 77,021 0.40 0.67 232.05 Poor 96,911 0.66 0.73 89.04
Source: Sarris and Karfakis (2006)
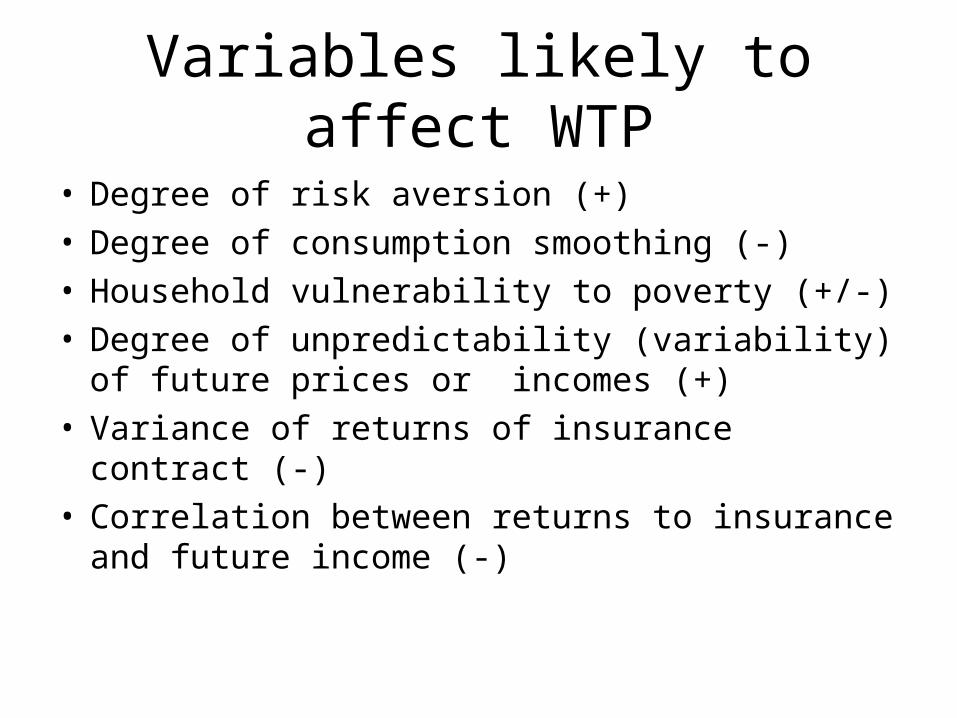
Variables likely to affect WTP
• Degree of risk aversion (+)• Degree of consumption smoothing (-)• Household vulnerability to poverty (+/-)• Degree of unpredictability (variability) of future
prices or incomes (+)• Variance of returns of insurance contract (-)• Correlation between returns to insurance and
future income (-)
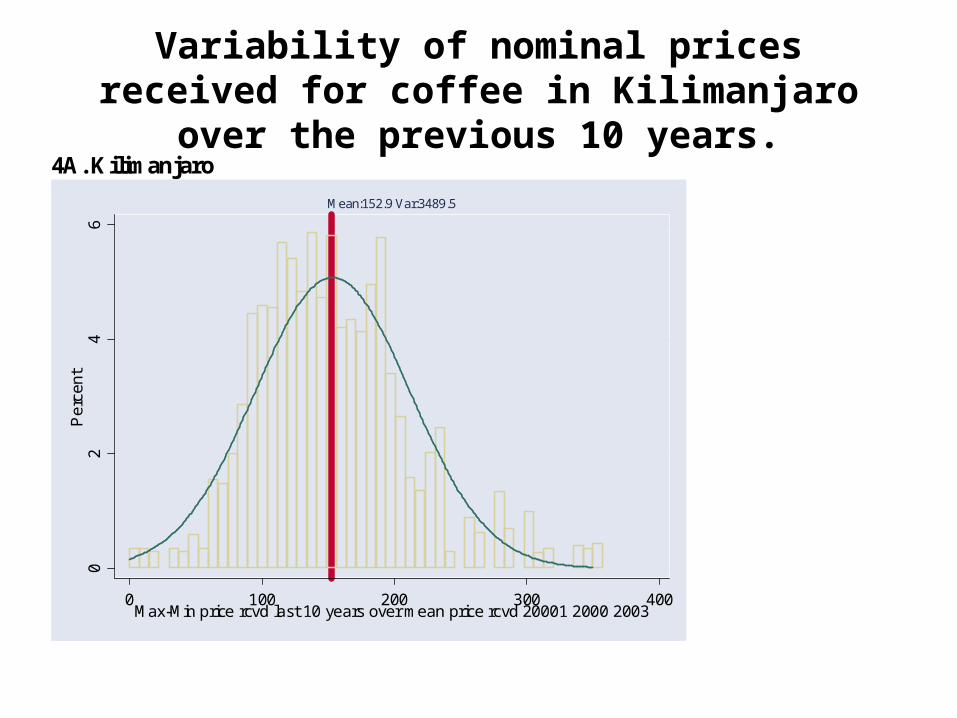
Variability of nominal prices received for coffee in Kilimanjaro over the previous 10 years.
4A. Kilimanjaro
02
46
Pe
rcen
t
0 100 200 300 400Max-Min price rcvd last 10 years over mean price rcvd 20001 2000 2003
Mean:152.9 Var:3489.5
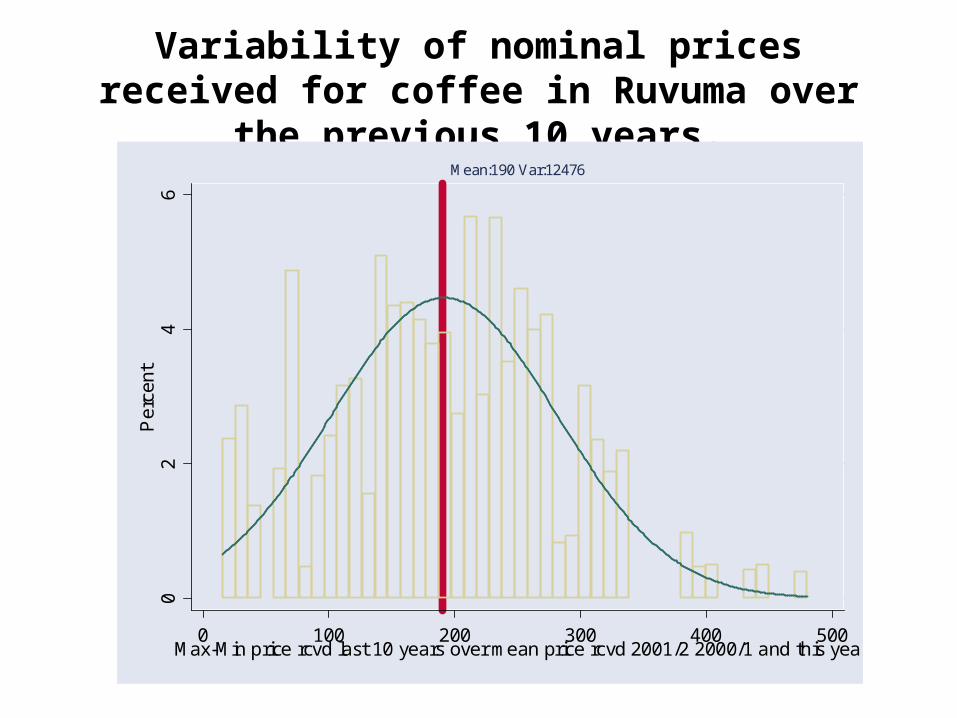
Variability of nominal prices received for coffee in Ruvuma over the previous 10 years.
0
24
6P
erce
nt
0 100 200 300 400 500Max-Min price rcvd last 10 years over mean price rcvd 2001/2 2000/1 and this yea
Mean:190 Var:12476
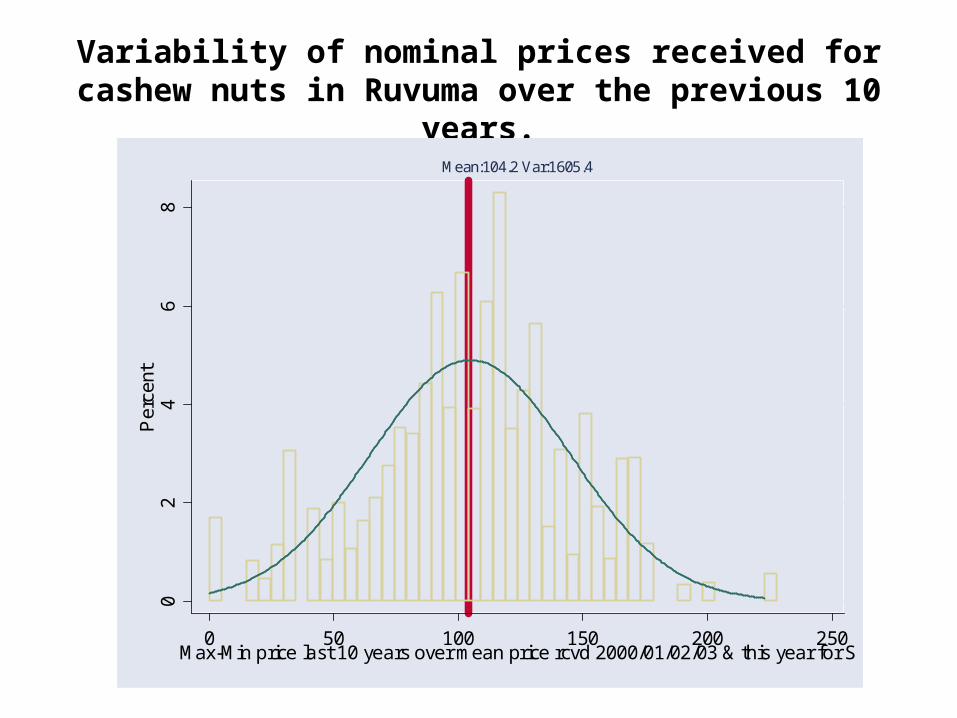
Variability of nominal prices received for cashew nuts in Ruvuma over the previous 10 years.
0
24
68
Per
cent
0 50 100 150 200 250Max-Min price last 10 years over mean price rcvd 2000/01/02/03 & this year for S
Mean:104.2 Var:1605.4
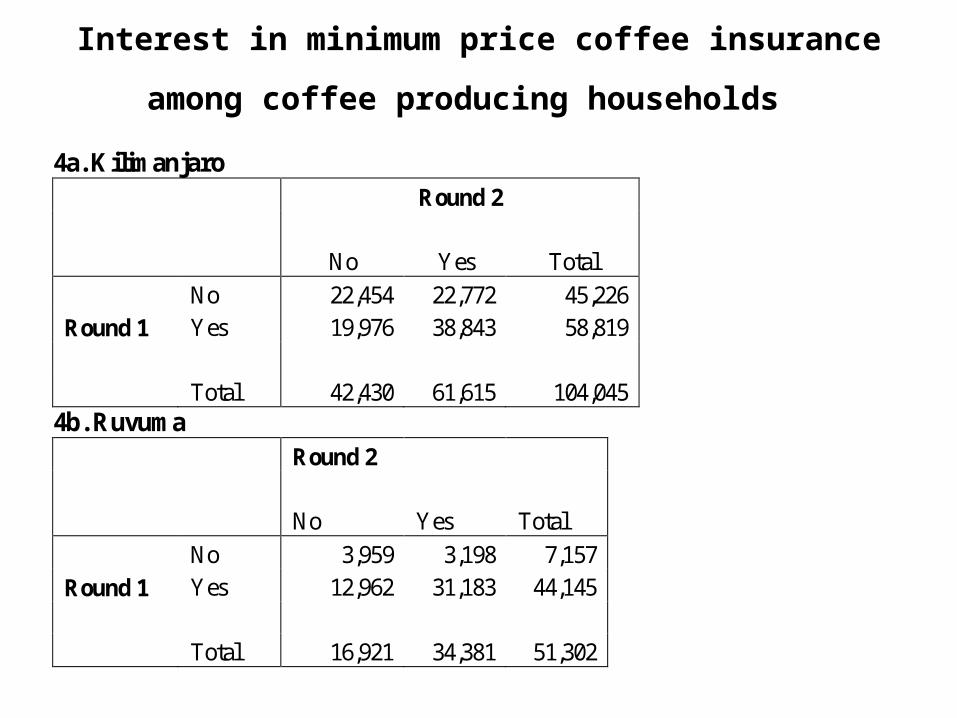
Interest in minimum price coffee insurance among
coffee producing households 4a. Kilimanjaro Round 2
No Yes Total
No 22,454 22,772 45,226 Round 1 Yes 19,976 38,843 58,819 Total 42,430 61,615 104,045
4b. Ruvuma Round 2
No Yes Total
No 3,959 3,198 7,157
Round 1 Yes 12,962 31,183 44,145 Total 16,921 34,381 51,302
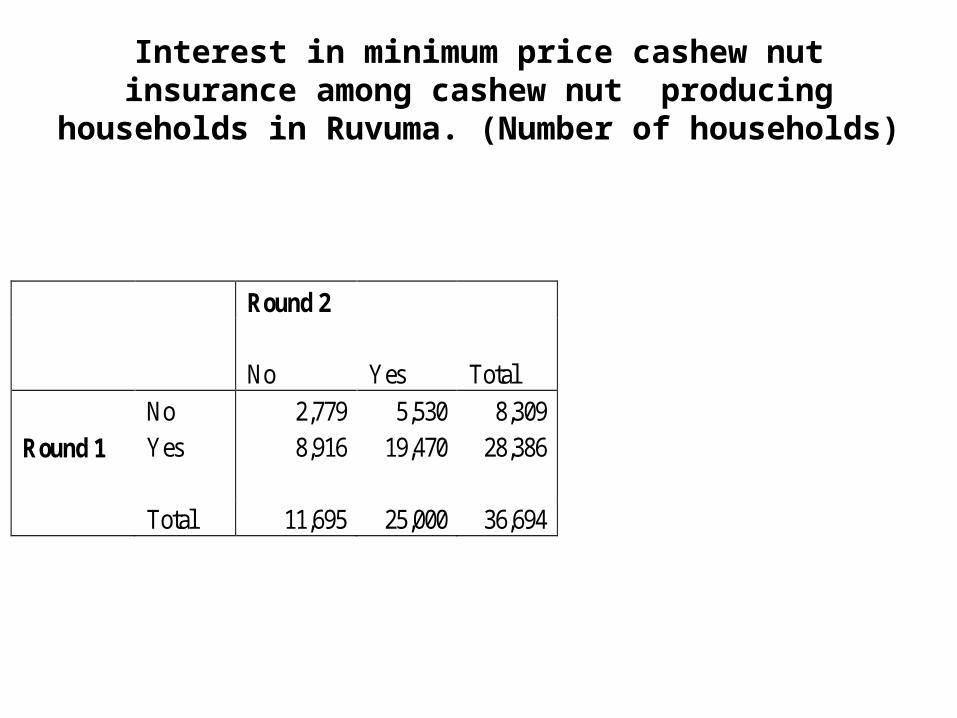
Interest in minimum price cashew nut insurance among cashew nut producing households in Ruvuma.
(Number of households)
Round 2
No Yes Total
No 2,779 5,530 8,309 Round 1 Yes 8,916 19,470 28,386 Total 11,695 25,000 36,694
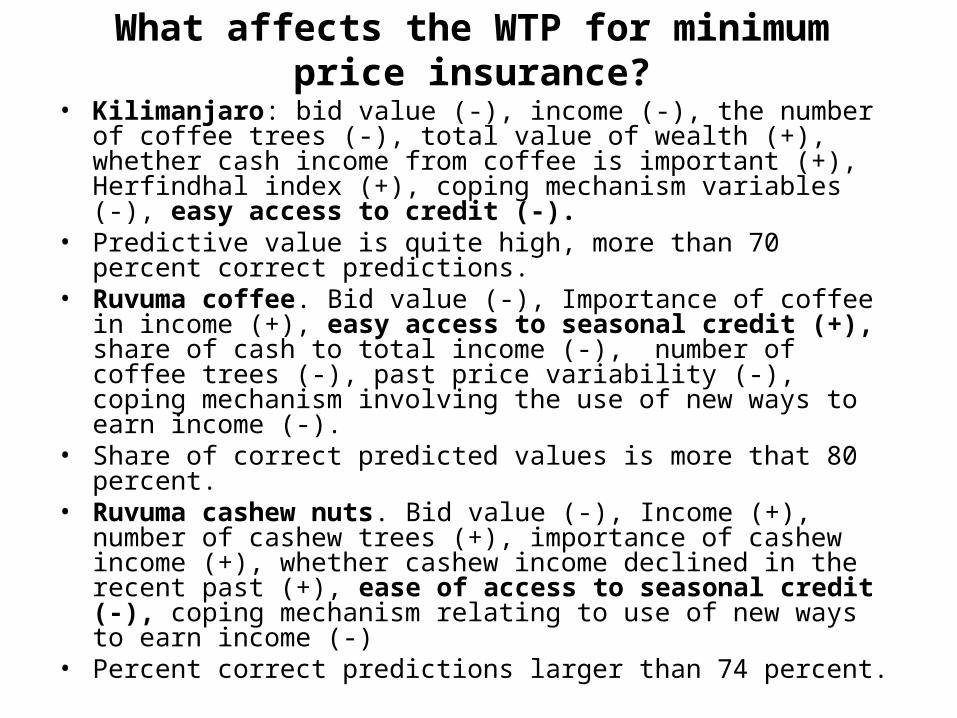
What affects the WTP for minimum price insurance?
• Kilimanjaro: bid value (-), income (-), the number of coffee trees (-), total value of wealth (+), whether cash income from coffee is important (+), Herfindhal index (+), coping mechanism variables (-), easy access to credit (-).
• Predictive value is quite high, more than 70 percent correct predictions.
• Ruvuma coffee. Bid value (-), Importance of coffee in income (+), easy access to seasonal credit (+), share of cash to total income (-), number of coffee trees (-), past price variability (-), coping mechanism involving the use of new ways to earn income (-).
• Share of correct predicted values is more that 80 percent. • Ruvuma cashew nuts. Bid value (-), Income (+), number of
cashew trees (+), importance of cashew income (+), whether cashew income declined in the recent past (+), ease of access to seasonal credit (-), coping mechanism relating to use of new ways to earn income (-)
• Percent correct predictions larger than 74 percent.
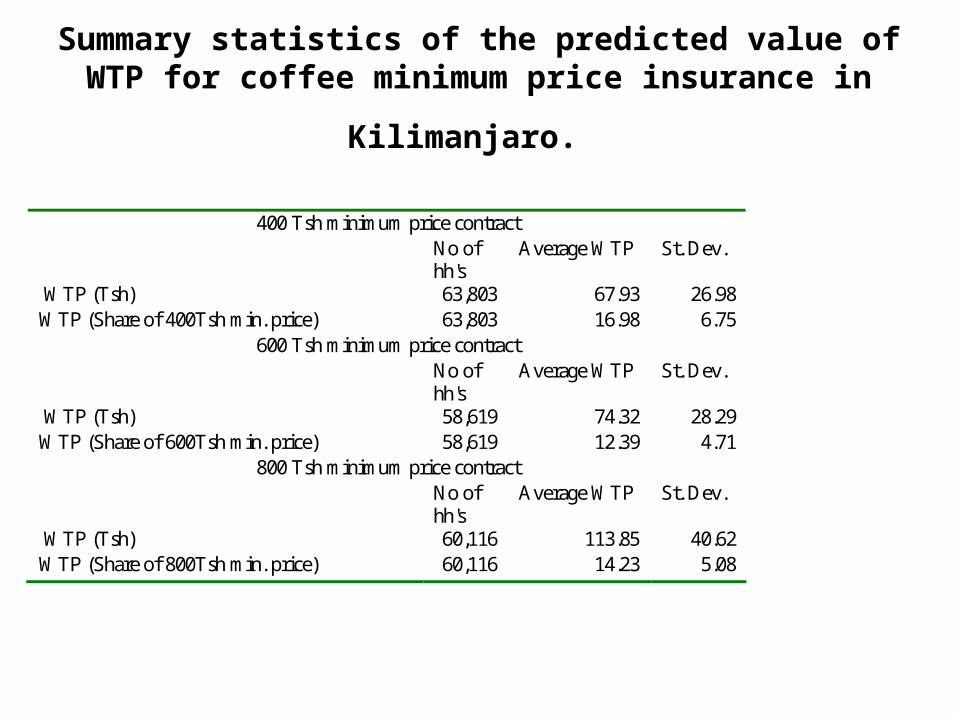
Summary statistics of the predicted value of WTP for
coffee minimum price insurance in Kilimanjaro.
400 Tsh minimum price contract No of
hh's Average WTP St. Dev.
WTP (Tsh) 63,803 67.93 26.98 WTP (Share of 400Tsh min. price) 63,803 16.98 6.75
600 Tsh minimum price contract No of
hh's Average WTP St. Dev.
WTP (Tsh) 58,619 74.32 28.29 WTP (Share of 600Tsh min. price) 58,619 12.39 4.71
800 Tsh minimum price contract No of
hh's Average WTP St. Dev.
WTP (Tsh) 60,116 113.85 40.62 WTP (Share of 800Tsh min. price) 60,116 14.23 5.08
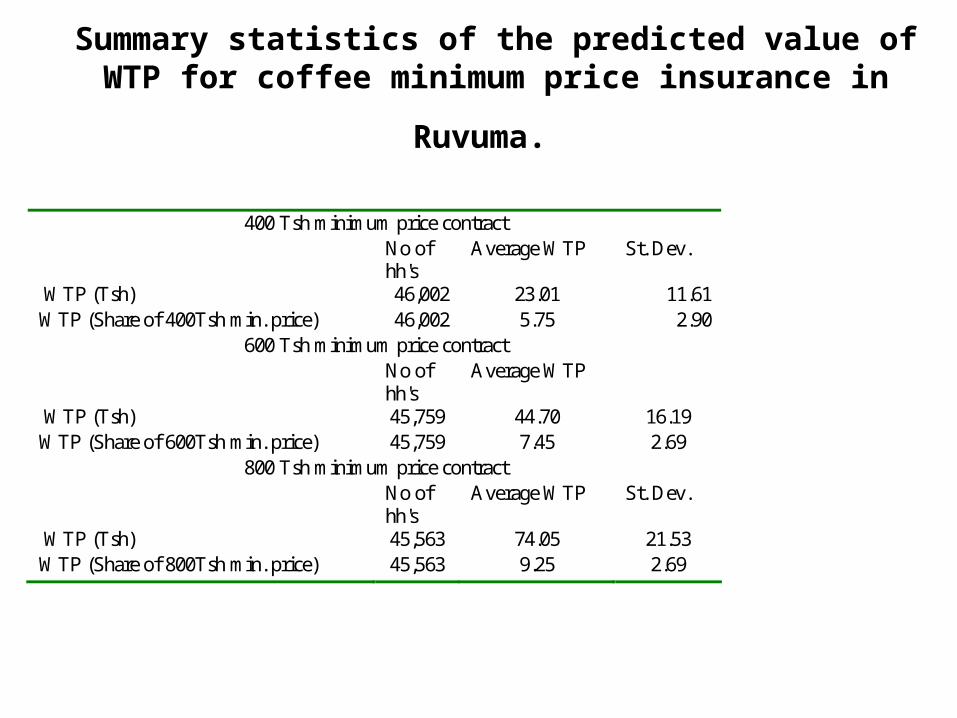
Summary statistics of the predicted value of WTP for
coffee minimum price insurance in Ruvuma.
400 Tsh minimum price contract No of
hh's Average WTP St. Dev.
WTP (Tsh) 46,002 23.01 11.61 WTP (Share of 400Tsh min. price) 46,002 5.75 2.90
600 Tsh minimum price contract No of
hh's Average WTP
WTP (Tsh) 45,759 44.70 16.19 WTP (Share of 600Tsh min. price) 45,759 7.45 2.69
800 Tsh minimum price contract No of
hh's Average WTP St. Dev.
WTP (Tsh) 45,563 74.05 21.53 WTP (Share of 800Tsh min. price) 45,563 9.25 2.69
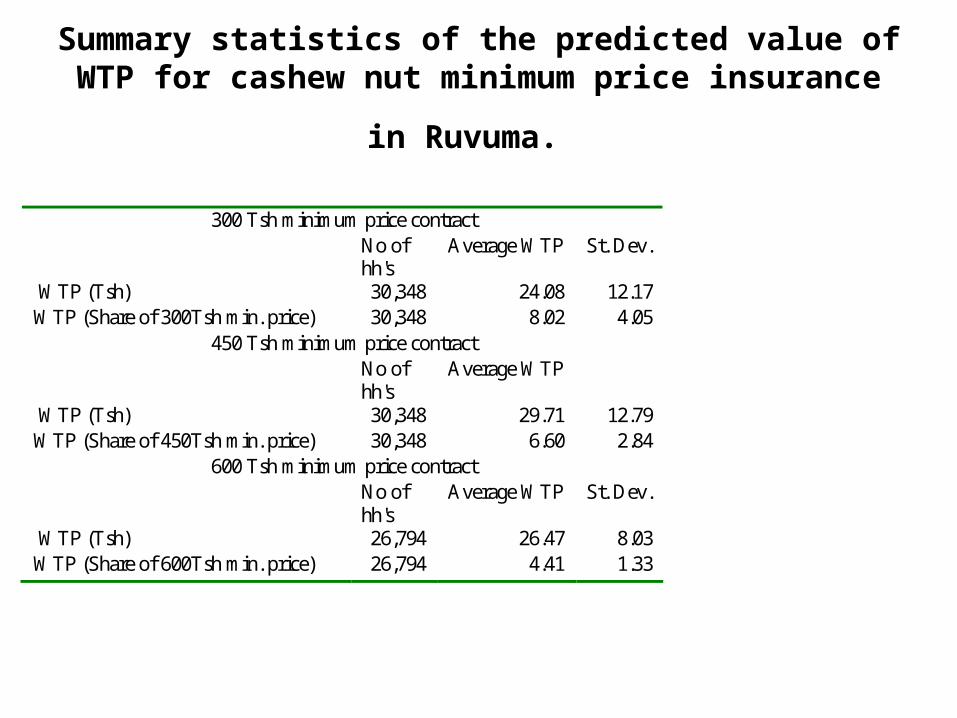
Summary statistics of the predicted value of WTP for
cashew nut minimum price insurance in Ruvuma.
300 Tsh minimum price contract No of
hh's Average WTP St. Dev.
WTP (Tsh) 30,348 24.08 12.17 WTP (Share of 300Tsh min. price) 30,348 8.02 4.05
450 Tsh minimum price contract No of
hh's Average WTP
WTP (Tsh) 30,348 29.71 12.79 WTP (Share of 450Tsh min. price) 30,348 6.60 2.84
600 Tsh minimum price contract No of
hh's Average WTP St. Dev.
WTP (Tsh) 26,794 26.47 8.03 WTP (Share of 600Tsh min. price) 26,794 4.41 1.33
Conclusions and policy implications. Demand for price insurance
• Producer households are affected by a variety of shocks, and prominent among them are health and death related ones, as well as weather induced ones.
• Shocks induce considerable variability of incomes• Most prevalent coping mechanism through own savings and asset
depletion. • There seems to be considerable variability in prices received for the
main cash crops and incomes.• This induces considerable interest in minimum price insurance. • Instability variables contribute positively to the demand for price
insurance, while the existence of coping mechanisms contributes negatively, as expected.
• Large estimated values of individual WTP for coffee and cashew nut price insurance. Higher in Kilimanjaro than Ruvuma
• Considerable welfare benefits (net of costs) of minimum price insurance.
• Market based price insurance viable (premiums comparable to option prices in organized exchanges)
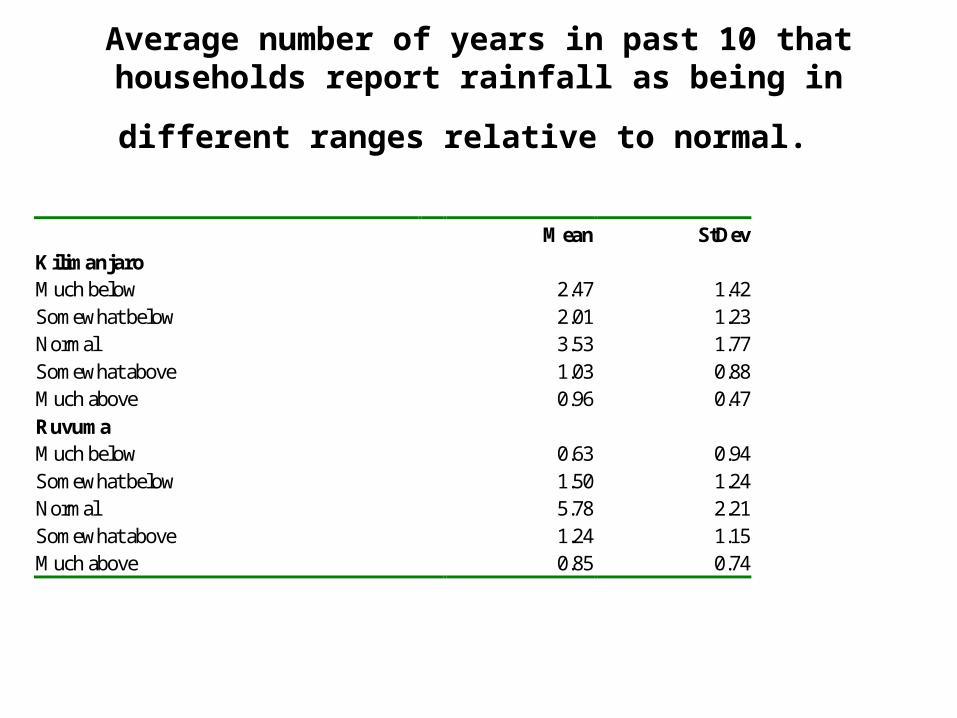
Average number of years in past 10 that households report rainfall as being in different ranges relative to
normal.
Mean StDev Kilimanjaro Much below 2.47 1.42 Somewhat below 2.01 1.23 Normal 3.53 1.77 Somewhat above 1.03 0.88 Much above 0.96 0.47
Ruvuma Much below 0.63 0.94 Somewhat below 1.50 1.24 Normal 5.78 2.21 Somewhat above 1.24 1.15 Much above 0.85 0.74
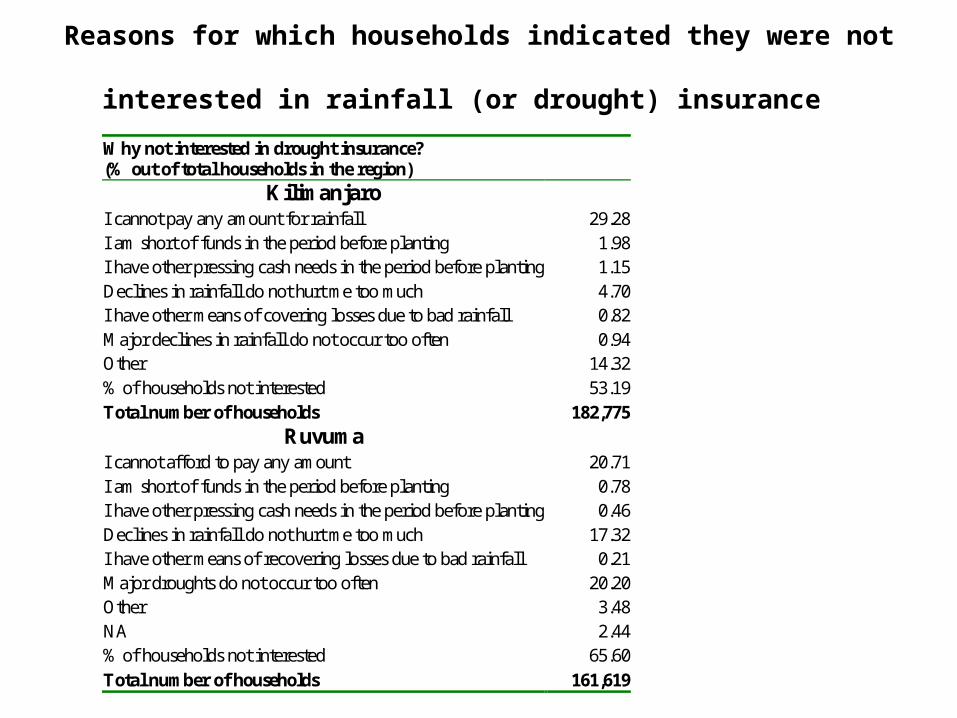
Reasons for which households indicated they were not interested
in rainfall (or drought) insurance Why not interested in drought insurance? (% out of total households in the region)
Kilimanjaro I cannot pay any amount for rainfall 29.28 I am short of funds in the period before planting 1.98 I have other pressing cash needs in the period before planting 1.15 Declines in rainfall do not hurt me too much 4.70 I have other means of covering losses due to bad rainfall 0.82 Major declines in rainfall do not occur too often 0.94 Other 14.32 % of households not interested 53.19 Total number of households 182,775
Ruvuma I cannot afford to pay any amount 20.71 I am short of funds in the period before planting 0.78 I have other pressing cash needs in the period before planting 0.46 Declines in rainfall do not hurt me too much 17.32 I have other means of recovering losses due to bad rainfall 0.21 Major droughts do not occur too often 20.20 Other 3.48 NA 2.44 % of households not interested 65.60
Total number of households 161,619
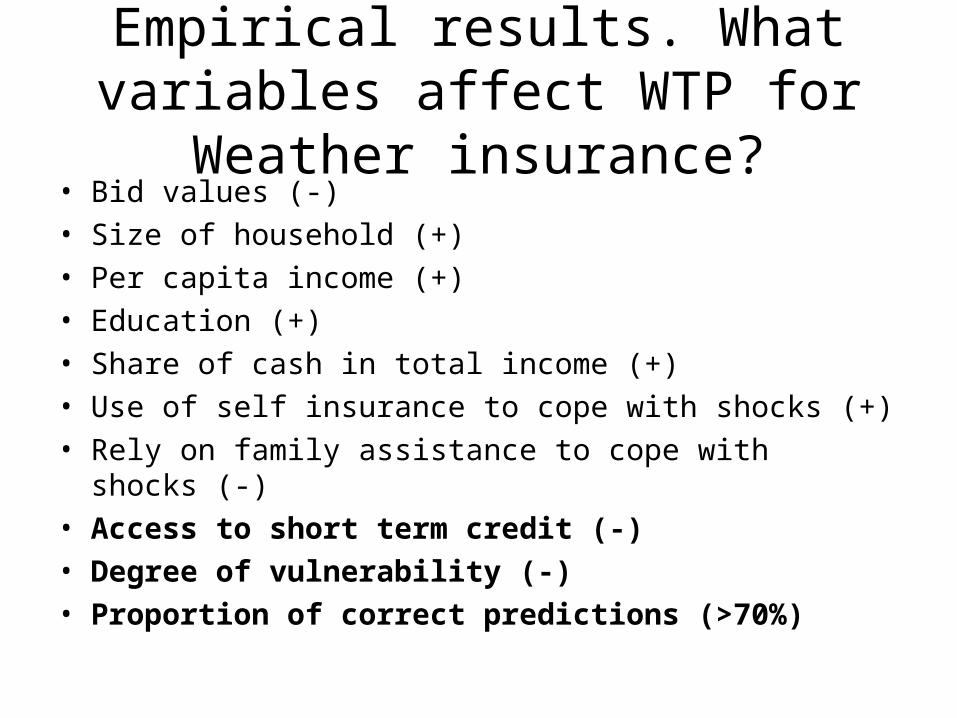
Empirical results. What variables affect WTP for Weather insurance?• Bid values (-)• Size of household (+)• Per capita income (+)• Education (+) • Share of cash in total income (+) • Use of self insurance to cope with shocks (+)• Rely on family assistance to cope with shocks (-) • Access to short term credit (-)• Degree of vulnerability (-)• Proportion of correct predictions (>70%)
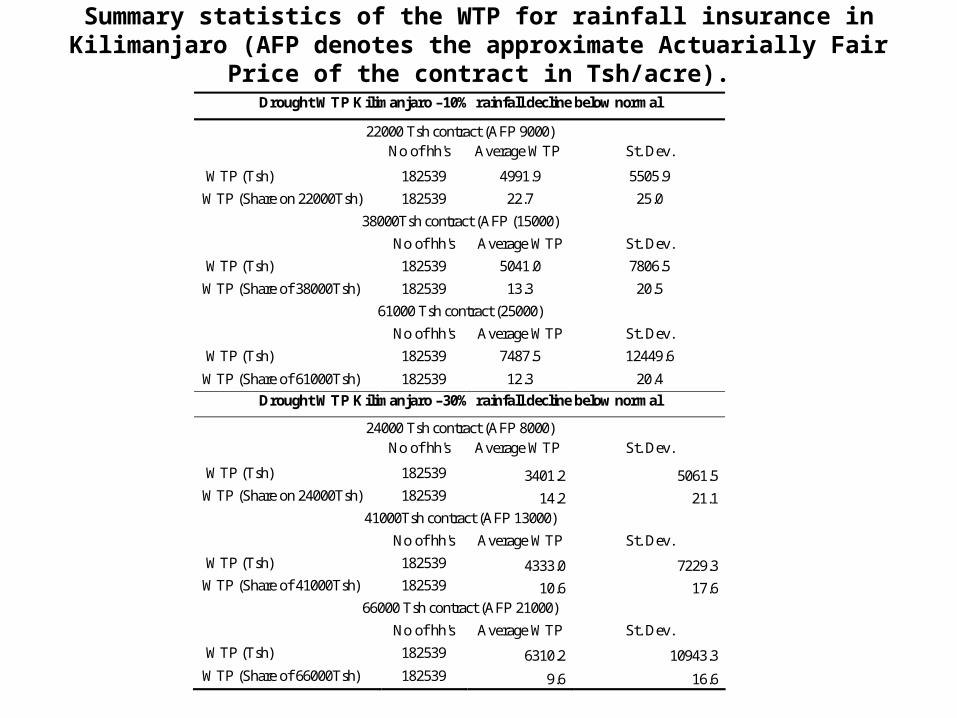
Summary statistics of the WTP for rainfall insurance in Kilimanjaro (AFP denotes the approximate Actuarially Fair Price of the contract in
Tsh/acre).Drought WTP Kilimanjaro –10% rainfall decline below normal
22000 Tsh contract (AFP 9000)
No of hh's Average WTP St. Dev.
WTP (Tsh) 182539 4991.9 5505.9
WTP (Share on 22000Tsh) 182539 22.7 25.0
38000Tsh contract (AFP (15000)
No of hh's Average WTP St. Dev.
WTP (Tsh) 182539 5041.0 7806.5
WTP (Share of 38000Tsh) 182539 13.3 20.5
61000 Tsh contract (25000)
No of hh's Average WTP St. Dev.
WTP (Tsh) 182539 7487.5 12449.6
WTP (Share of 61000Tsh) 182539 12.3 20.4
Drought WTP Kilimanjaro –30% rainfall decline below normal
24000 Tsh contract (AFP 8000)
No of hh's Average WTP St. Dev.
WTP (Tsh) 182539 3401.2 5061.5 WTP (Share on 24000Tsh) 182539 14.2 21.1
41000Tsh contract (AFP 13000)
No of hh's Average WTP St. Dev.
WTP (Tsh) 182539 4333.0 7229.3 WTP (Share of 41000Tsh) 182539 10.6 17.6
66000 Tsh contract (AFP 21000)
No of hh's Average WTP St. Dev.
WTP (Tsh) 182539 6310.2 10943.3 WTP (Share of 66000Tsh) 182539 9.6 16.6
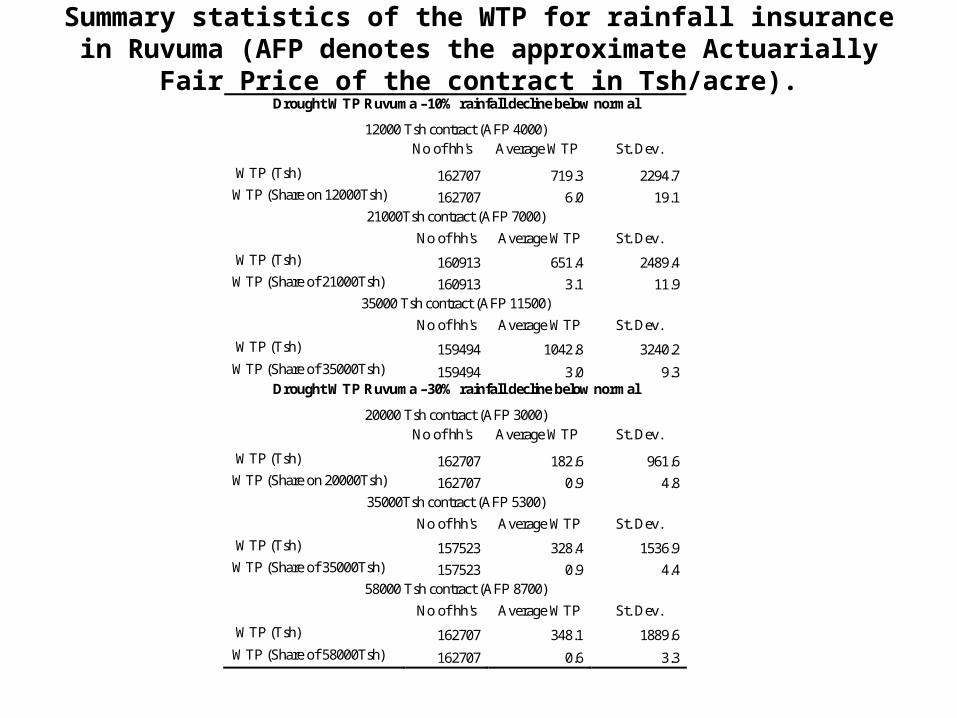
Summary statistics of the WTP for rainfall insurance in Ruvuma (AFP denotes the approximate Actuarially Fair Price of the
contract in Tsh/acre).Drought WTP Ruvuma –10% rainfall decline below normal
12000 Tsh contract (AFP 4000)
No of hh's Average WTP St. Dev.
WTP (Tsh) 162707 719.3 2294.7 WTP (Share on 12000Tsh) 162707 6.0 19.1
21000Tsh contract (AFP 7000)
No of hh's Average WTP St. Dev.
WTP (Tsh) 160913 651.4 2489.4 WTP (Share of 21000Tsh) 160913 3.1 11.9
35000 Tsh contract (AFP 11500)
No of hh's Average WTP St. Dev.
WTP (Tsh) 159494 1042.8 3240.2 WTP (Share of 35000Tsh) 159494 3.0 9.3
Drought WTP Ruvuma –30% rainfall decline below normal
20000 Tsh contract (AFP 3000)
No of hh's Average WTP St. Dev.
WTP (Tsh) 162707 182.6 961.6 WTP (Share on 20000Tsh) 162707 0.9 4.8
35000Tsh contract (AFP 5300)
No of hh's Average WTP St. Dev.
WTP (Tsh) 157523 328.4 1536.9 WTP (Share of 35000Tsh) 157523 0.9 4.4
58000 Tsh contract (AFP 8700)
No of hh's Average WTP St. Dev.
WTP (Tsh) 162707 348.1 1889.6 WTP (Share of 58000Tsh) 162707 0.6 3.3
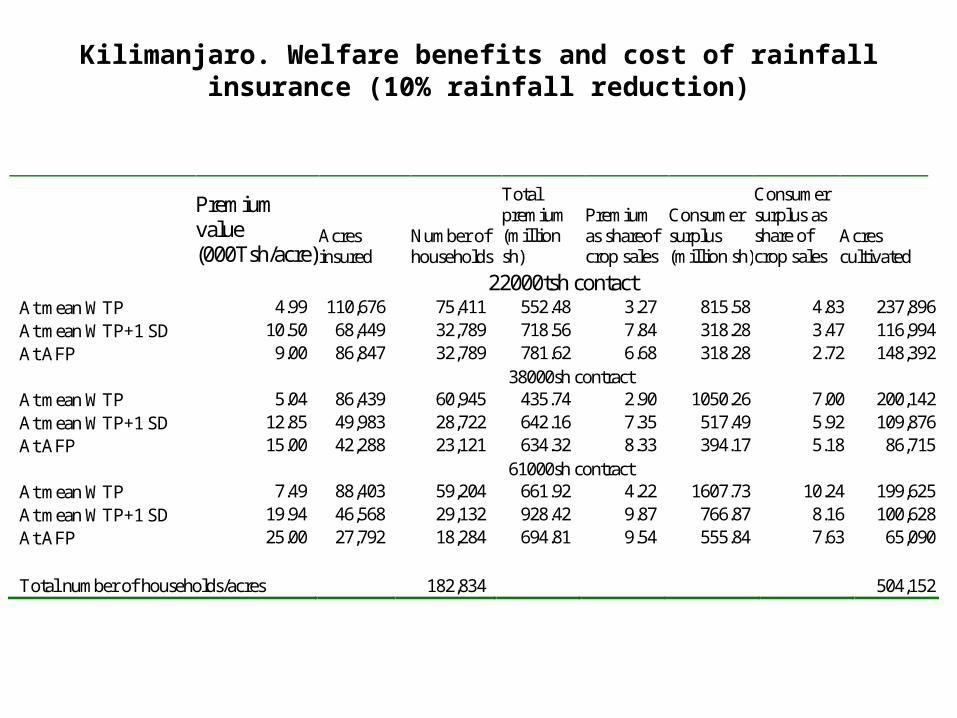
Kilimanjaro. Welfare benefits and cost of rainfall insurance (10% rainfall reduction)
Premium value (000Tsh/acre)
Acres insured
Number of households
Total premium (million sh)
Premium as shareof crop sales
Consumer surplus (million sh)
Consumer surplus as share of crop sales
Acres cultivated
22000tsh contact At mean WTP 4.99 110,676 75,411 552.48 3.27 815.58 4.83 237,896 At mean WTP+1 SD 10.50 68,449 32,789 718.56 7.84 318.28 3.47 116,994 At AFP 9.00 86,847 32,789 781.62 6.68 318.28 2.72 148,392 38000sh contract At mean WTP 5.04 86,439 60,945 435.74 2.90 1050.26 7.00 200,142 At mean WTP+1 SD 12.85 49,983 28,722 642.16 7.35 517.49 5.92 109,876 At AFP 15.00 42,288 23,121 634.32 8.33 394.17 5.18 86,715 61000sh contract At mean WTP 7.49 88,403 59,204 661.92 4.22 1607.73 10.24 199,625 At mean WTP+1 SD 19.94 46,568 29,132 928.42 9.87 766.87 8.16 100,628 At AFP 25.00 27,792 18,284 694.81 9.54 555.84 7.63 65,090
Total number of households/acres 182,834 504,152
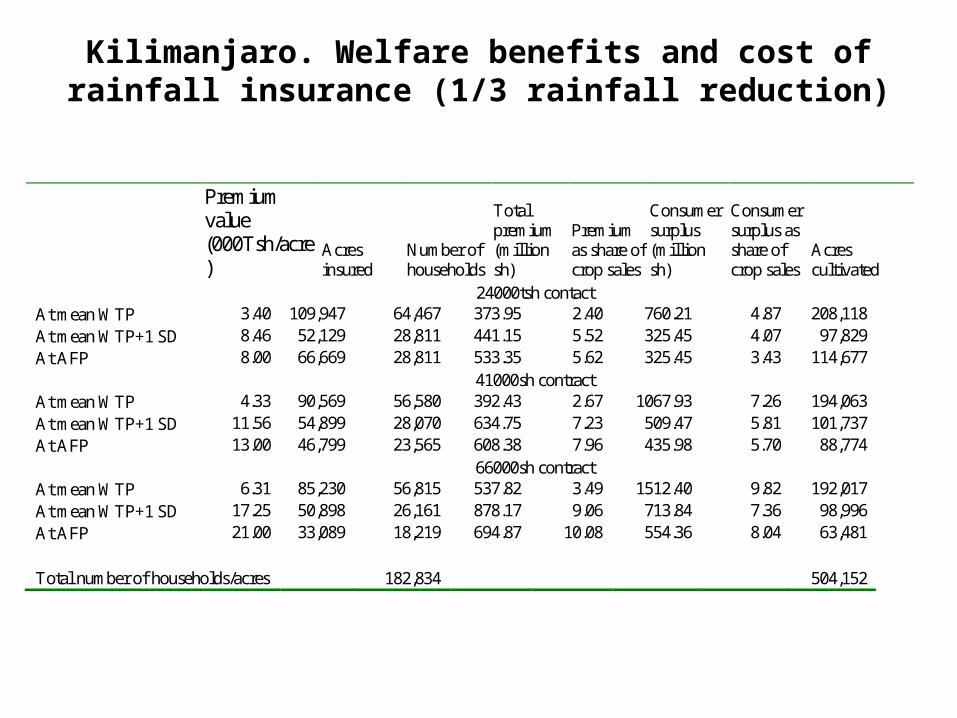
Kilimanjaro. Welfare benefits and cost of rainfall insurance (1/3 rainfall reduction)
Premium value (000Tsh/acre)
Acres insured
Number of households
Total premium (million sh)
Premium as share of crop sales
Consumer surplus (million sh)
Consumer surplus as share of crop sales
Acres cultivated
24000tsh contact At mean WTP 3.40 109,947 64,467 373.95 2.40 760.21 4.87 208,118 At mean WTP+1 SD 8.46 52,129 28,811 441.15 5.52 325.45 4.07 97,829 At AFP 8.00 66,669 28,811 533.35 5.62 325.45 3.43 114,677 41000sh contract At mean WTP 4.33 90,569 56,580 392.43 2.67 1067.93 7.26 194,063 At mean WTP+1 SD 11.56 54,899 28,070 634.75 7.23 509.47 5.81 101,737 At AFP 13.00 46,799 23,565 608.38 7.96 435.98 5.70 88,774 66000sh contract At mean WTP 6.31 85,230 56,815 537.82 3.49 1512.40 9.82 192,017 At mean WTP+1 SD 17.25 50,898 26,161 878.17 9.06 713.84 7.36 98,996 At AFP 21.00 33,089 18,219 694.87 10.08 554.36 8.04 63,481 Total number of households/acres 182,834 504,152
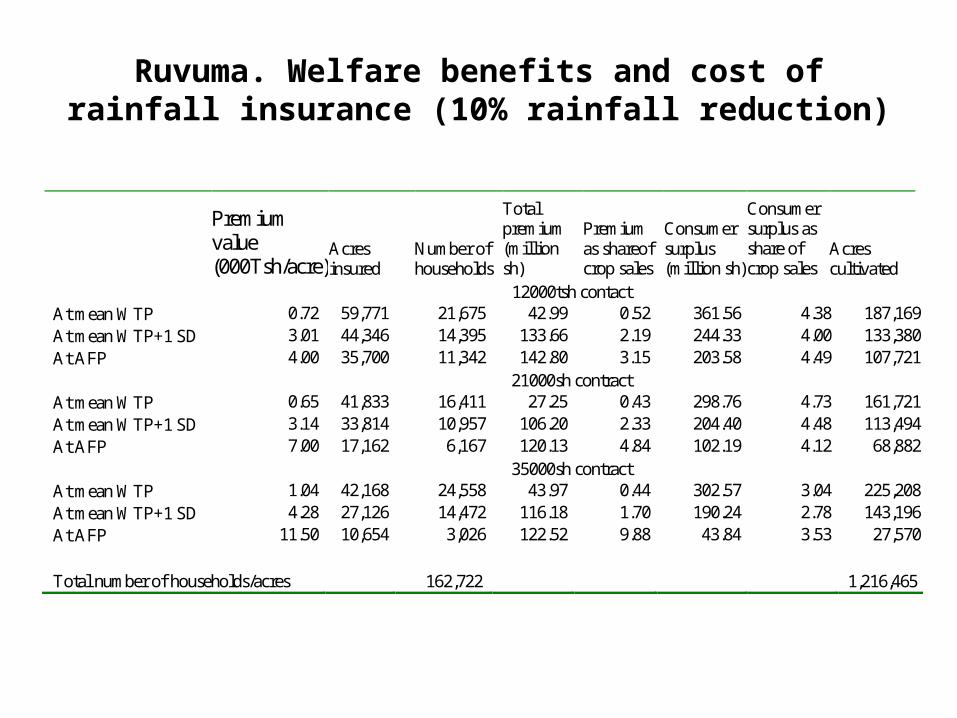
Ruvuma. Welfare benefits and cost of rainfall insurance (10% rainfall reduction)
Premium value (000Tsh/acre)
Acres insured
Number of households
Total premium (million sh)
Premium as shareof crop sales
Consumer surplus (million sh)
Consumer surplus as share of crop sales
Acres cultivated
12000tsh contact At mean WTP 0.72 59,771 21,675 42.99 0.52 361.56 4.38 187,169 At mean WTP+1 SD 3.01 44,346 14,395 133.66 2.19 244.33 4.00 133,380 At AFP 4.00 35,700 11,342 142.80 3.15 203.58 4.49 107,721 21000sh contract At mean WTP 0.65 41,833 16,411 27.25 0.43 298.76 4.73 161,721 At mean WTP+1 SD 3.14 33,814 10,957 106.20 2.33 204.40 4.48 113,494 At AFP 7.00 17,162 6,167 120.13 4.84 102.19 4.12 68,882 35000sh contract At mean WTP 1.04 42,168 24,558 43.97 0.44 302.57 3.04 225,208 At mean WTP+1 SD 4.28 27,126 14,472 116.18 1.70 190.24 2.78 143,196 At AFP 11.50 10,654 3,026 122.52 9.88 43.84 3.53 27,570 Total number of households/acres 162,722 1,216,465
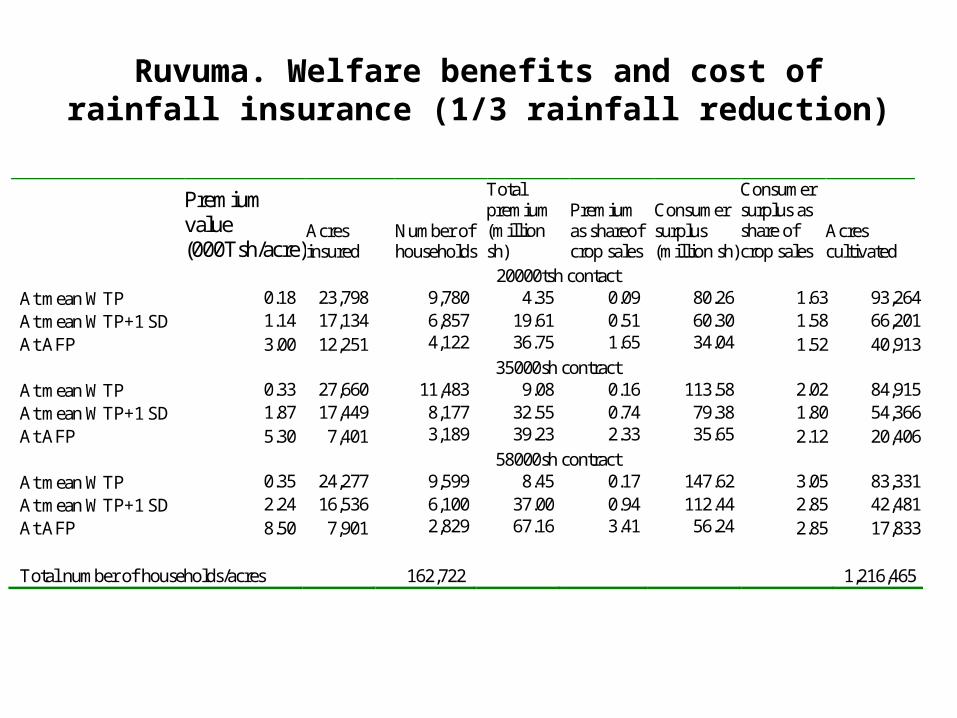
Ruvuma. Welfare benefits and cost of rainfall insurance (1/3 rainfall reduction)
Premium value (000Tsh/acre)
Acres insured
Number of households
Total premium (million sh)
Premium as shareof crop sales
Consumer surplus (million sh)
Consumer surplus as share of crop sales
Acres cultivated
20000tsh contact At mean WTP 0.18 23,798 9,780 4.35 0.09 80.26 1.63 93,264 At mean WTP+1 SD 1.14 17,134 6,857 19.61 0.51 60.30 1.58 66,201 At AFP 3.00 12,251 4,122 36.75 1.65 34.04 1.52 40,913 35000sh contract At mean WTP 0.33 27,660 11,483 9.08 0.16 113.58 2.02 84,915 At mean WTP+1 SD 1.87 17,449 8,177 32.55 0.74 79.38 1.80 54,366 At AFP 5.30 7,401 3,189 39.23 2.33 35.65 2.12 20,406 58000sh contract At mean WTP 0.35 24,277 9,599 8.45 0.17 147.62 3.05 83,331 At mean WTP+1 SD 2.24 16,536 6,100 37.00 0.94 112.44 2.85 42,481 At AFP 8.50 7,901 2,829 67.16 3.41 56.24 2.85 17,833 Total number of households/acres 162,722 1,216,465
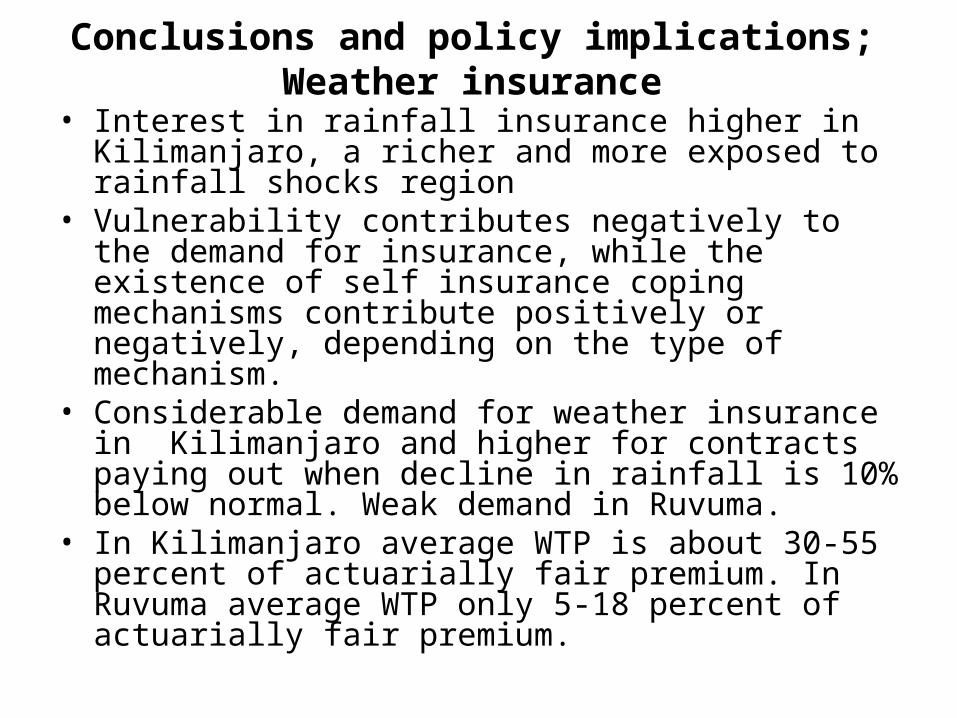
Conclusions and policy implications; Weather insurance
• Interest in rainfall insurance higher in Kilimanjaro, a richer and more exposed to rainfall shocks region
• Vulnerability contributes negatively to the demand for insurance, while the existence of self insurance coping mechanisms contribute positively or negatively, depending on the type of mechanism.
• Considerable demand for weather insurance in Kilimanjaro and higher for contracts paying out when decline in rainfall is 10% below normal. Weak demand in Ruvuma.
• In Kilimanjaro average WTP is about 30-55 percent of actuarially fair premium. In Ruvuma average WTP only 5-18 percent of actuarially fair premium.
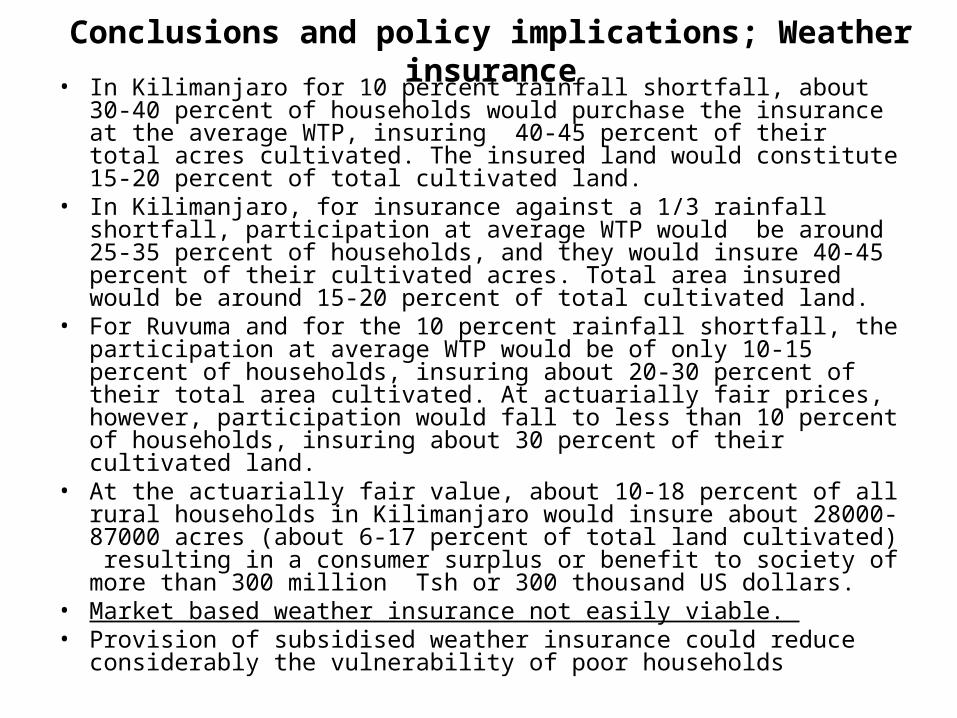
Conclusions and policy implications; Weather insurance• In Kilimanjaro for 10 percent rainfall shortfall, about 30-40 percent of
households would purchase the insurance at the average WTP, insuring 40-45 percent of their total acres cultivated. The insured land would constitute 15-20 percent of total cultivated land.
• In Kilimanjaro, for insurance against a 1/3 rainfall shortfall, participation at average WTP would be around 25-35 percent of households, and they would insure 40-45 percent of their cultivated acres. Total area insured would be around 15-20 percent of total cultivated land.
• For Ruvuma and for the 10 percent rainfall shortfall, the participation at average WTP would be of only 10-15 percent of households, insuring about 20-30 percent of their total area cultivated. At actuarially fair prices, however, participation would fall to less than 10 percent of households, insuring about 30 percent of their cultivated land.
• At the actuarially fair value, about 10-18 percent of all rural households in Kilimanjaro would insure about 28000-87000 acres (about 6-17 percent of total land cultivated) resulting in a consumer surplus or benefit to society of more than 300 million Tsh or 300 thousand US dollars.
• Market based weather insurance not easily viable. • Provision of subsidised weather insurance could reduce
considerably the vulnerability of poor households
Practical instruments• Smallholders are willing to pay for
insurance, but how?• Could be implicitly included in the cost of
formal loans from banks• Banks could provide the price insurance,
so as to recover the loans, and reinsure the risk with market based instruments
• Index based weather insurance could also be provided through banks, as part of their lending programs.


![[Commodity Name] Commodity Strategy](https://img.pdfslide.net/doc/110x75/568135d2550346895d9d3881/commodity-name-commodity-strategy.jpg)