Embed Size (px)
Citation preview

Facilitation through Buffer Saturation: Constraints on EndogenousBuffering Properties
Victor Matveev,*y Robert S. Zucker,z and Arthur Shermany
*Department of Mathematical Sciences, New Jersey Institute of Technology, Newark, New Jersey 07102; yLaboratory of BiologicalModeling, National Institute of Diabetes and Digestive and Kidney Diseases, National Institutes of Health, Bethesda, Maryland 20892;and zMolecular and Cell Biology Department, Neurobiology Division, University of California, Berkeley, California 94720
ABSTRACT Synaptic facilitation (SF) is a ubiquitous form of short-term plasticity, regulating synaptic dynamics on fasttimescales. Although SF is known to depend on the presynaptic accumulation of Ca21, its precise mechanism is still underdebate. Recently it has been shown that at certain central synapses SF results at least in part from the progressive saturation ofan endogenous Ca21 buffer (Blatow et al., 2003), as proposed by Klingauf and Neher (1997). Using computer simulations, westudy the magnitude of SF that can be achieved by a buffer saturation mechanism (BSM), and explore its dependence on theendogenous buffering properties. We find that a high SF magnitude can be obtained either by a global saturation of a highlymobile buffer in the entire presynaptic terminal, or a local saturation of a completely immobilized buffer. A characteristic featureof BSM in both cases is that SF magnitude depends nonmonotonically on the buffer concentration. In agreement with results ofBlatow et al. (2003), we find that SF grows with increasing distance from the Ca21 channel cluster, and increases withincreasing external Ca21, [Ca21]ext, for small levels of [Ca21]ext. We compare our modeling results with the experimentalproperties of SF at the crayfish neuromuscular junction, and find that the saturation of an endogenous mobile buffer can explainthe observed SF magnitude and its supralinear accumulation time course. However, we show that the BSM predicts slowing ofthe SF decay rate in the presence of exogenous Ca21 buffers, contrary to experimental observations at the crayfish neu-romuscular junction. Further modeling and data are required to resolve this aspect of the BSM.
INTRODUCTION
Short-term synaptic facilitation (SF) is the transient increase
of synaptic response that can be elicited by a single action
potential (AP) or a short train of APs, and decays on
timescales from tens to hundreds of milliseconds. It is
observed in a variety of systems, from invertebrate neu-
romuscular junctions to neocortical synapses (reviewed in
Magleby, 1987; Fisher et al., 1997; Zucker, 1994 and 1999;
Zucker and Regehr, 2002). The pioneering work of Katz and
Miledi (1968) and Rahamimoff (1968) showed that SF
depends on the extracellular Ca21. However, there is still no
agreement on the exact nature of the SF mechanism.
Arguably, the simplest explanation is that SF results from
the accumulation of free residual Ca21 ([Ca21]res) in the
presynaptic terminal. This possibility is supported by the
extensive evidence that SF is sensitive to manipulations
reducing the free intracellular Ca21 (reviewed in Zucker and
Regehr, 2002). However, early modeling work (Chad and
Eckert, 1984; Simon and Llinas, 1985; Fogelson and Zucker,
1985; Roberts, 1994) demonstrated that the Ca21 concentra-
tion in the vicinity of an open Ca21 channel ‘‘domain’’ can
reach very high values, from tens to hundreds of mM. This is
much higher than the residual [Ca21] increase caused by
a single AP, believed to range from 10 nM to 1 mM (see
reviews by Stanley, 1997; Neher, 1998b; Zucker, 1996 and
1999; and Zucker and Regehr, 2002). If the Ca21-dependent
release machinery is located in close proximity to a Ca21
channel, as suggested by the evidence of molecular
interactions between the proteins mediating exocytosis and
the Ca21 channel proteins (reviewed in Stanley, 1997; Sheng
et al., 1998; Catterall, 1999; Fisher and Bourque, 2001; Jarvis
and Zamponi, 2001), it is hard to argue that such a small
increase in free Ca21 would lead to significant SF. Even
taking into account several experimental indications that the
Ca21 affinity of the secretory site may be in the 5–20-mM
range rather than the 100-mM range (Delaney and Tank,
1994; Ravin et al., 1999; Bollmann et al., 2000; Schneggen-
burger and Neher, 2000; Ohnuma et al., 2001), it would not
be sufficient to explain the high magnitude of SF observed in
many systems. One way to resolve this problem is to assume
the presence of a separate high-affinity Ca21-sensitive site
responsible for SF, distinct from the main secretory trigger,
and located far enough from a Ca21 channel, where the
residual [Ca21] is comparable to the peak [Ca21] (Tang et al.,
2000). We have recently shown that the properties of SF
observed at the crayfish neuromuscular junction (NMJ) can
be explained by such a model with two Ca21-dependent
release-controlling sites, given a sufficient separation be-
tween the two sites (;150 nm), and under the additional
assumptions of high tortuosity near the active zone and
immobilization of Ca21 buffers by the cytoskeleton (Mat-
veev et al., 2002).
An alternative solution is the bound residual Ca21
hypothesis, which postulates that SF results from the buildup
of Ca21 bound to the vesicle release sensors (Yamada and
Zucker, 1992; Bertram et al., 1996; see also Bennett et al.,
Submitted September 2, 2003, and accepted for publication January 2, 2004.
Address reprint requests to Arthur Sherman, LBM, NIDDK, NIH,
Bethesda, MD 20892-5621. Tel.: 301-496-4325; Fax: 301-402-0535;
E-mail: [email protected].
� 2004 by the Biophysical Society
0006-3495/04/05/2691/19 $2.00
Biophysical Journal Volume 86 May 2004 2691–2709 2691

1997; Dittman et al., 2000). In fact, this possibility had been
suggested in the pioneering studies of Katz and Miledi (1968)
and Rahamimoff (1968). Within this framework, the decay
time course of SF is determined by the kinetics of Ca21
unbinding from the SF sensor. However, without including
the effects of free Ca21 in the model, this possibility is in-
consistent with the above-mentioned evidence that SF is sen-
sitive to manipulations of free intracellular Ca21.
Recently, a third, qualitatively different model of SF was
put forward. It was proposed (Klingauf and Neher, 1997;
Neher 1998a,b) that the fast presynaptic Ca21 transients
elicited by successive depolarizing pulses might themselves
increase, as a result of a gradual reduction in the ability of
endogenous Ca21 buffers to reduce such transients, due to
their progressive saturation (binding) by the residual Ca21
accumulating from pulse to pulse. In this case SF would result
from an increase in the size of AP-induced [Ca21] peaks,
rather than an increase in free [Ca21]res, or an increase in the
Ca21-bound state of the release sensor (Table 1). An ap-
pealing aspect of the buffer saturation mechanism (BSM) is
that it does not assume the presence of a facilitatory Ca21
binding site distinct from the main secretory site, a condition
required by the free residual Ca21 model described above.
Recently BSM has been shown to play a major role in SF at
calbindin-containing neocortical and hippocampal synapses
(Blatow et al., 2003), and was also inferred to contribute to SF
at the calyx of Held synapse, albeit to a smaller degree (Felmy
et al., 2003). The growth of Ca21 transients resulting from
buffer saturation has also been observed in Purkinje cells
(Maeda et al., 1999) and dentate granule cell axons (Jackson
and Redman, 2003). Although the buffer saturation hypoth-
esis has been analyzed in depth by Neher (1998a) using
approximate analytic methods (see also Bennett et al., 2000;
Trommershauser et al., 2003), there has yet been no rigorous
systematic analysis of the conditions necessary to achieve
significant SF within this framework. In this work we use
computer simulations of the presynaptic spatiotemporal Ca21
dynamics to study the properties of the BSM. The numerical
approach allows us to consider the widest range of buffering
conditions, whereas available analytic techniques rely on
approximations that have limited applicability (Neher, 1998a;
Pape et al., 1998; Smith et al., 1996, 2001). Our general
findings are in agreement with the experimentally observed
properties of SF resulting from buffer saturation, as described
by Blatow et al. (2003).
Further, we compare our modeling results with experi-
mental recordings at the crayfish NMJ (Tang et al., 2000), to
determine whether BSM could underlie the pronounced SF
exhibited by this synapse. We find that the saturation of a fast
mobile buffer can indeed successfully reproduce the supra-
linear accumulation time course of SF, as well as the biphasic
decay time course of SF observed at the crayfish NMJ.
However, BSM predicts a reduction in the SF decay rate by
exogenously applied buffers, whereas the opposite effect has
been observed experimentally by Tang et al. (2000). We
conclude that the involvement of buffer saturation in SF at
the crayfish NMJ cannot be established with certainty, until
more experimental data is available on Ca21 homeostasis on
short timescales in this preparation (see Discussion).
METHODS
Geometry
For simplicity, we represent the presynaptic crayfish motor bouton by
a sphere 3 mm in diameter (Fig. 1), which approximates the shape and size of
real boutons (Cooper et al., 1995). The surface of the bouton is covered with
active zones (AZs), with a density of 1 AZ/2.56 mm2 (Cooper et al., 1995;
Tang et al., 2000). It is assumed that all AZs are equivalent, and are
distributed uniformly over the surface of the spherical bouton. This allows us
to restrict our simulations to a conical region 1.8 mm in diameter at its base,
surrounding a single AZ, yielding a cone base area close to 2.56 mm2. We
impose reflective boundary conditions for Ca21 and buffer(s) on the sides of
the cone, thereby assuming that the Ca21 and buffer fluxes flowing into the
cone from the neighboring AZ regions are balanced by the equal fluxes
flowing out of the cone. This simplified geometry allows us to perform
simulations in rotationally symmetric spherical (r, u) coordinates, instead of
solving the problem in full three dimensions. A similar method has been
used by Klingauf and Neher (1997). The reduction from three to two
dimensions significantly reduces the computational intensity of the
simulations, allowing us to study the behavior of facilitation as two
parameters are varied at a time (Figs. 3, 5, 6, 8, 9, and 13). This conical
geometry is a rough approximation because the surface of a sphere cannot be
tiled with disks, but the inaccuracy introduced by this simplification does not
affect the qualitative features of our results.
TABLE 1 Models of synaptic facilitation
Model SF site properties SF decay mechanism Ca21 buffering requirements
*Bound residual Ca21 Proximal, slow Ca21 unbinding from SF site No special requirementsyFree residual Ca21(two-site model) Distant, fast, high-affinity Ca21 diffusion and extrusion Immobile, high concentrationzBuffer saturation (FCT), mobile buffer No specialized SF site Ca21 extrusion High mobility, fast (high kon)zBuffer saturation (FCT), fixed buffer No specialized SF site Ca21 diffusion and extrusion Low mobility, high capacity,
high concentration
Endogenous Ca21 buffers play a crucial role in both the residual free Ca21 model and the BSM.
*Yamada and Zucker (1992), Bertram et al. (1996); see also Regehr et al. (1994), Atluri and Regehr (1996), Bennett et al. (1997), Dittman et al. (2000).yTang et al. (2000), Matveev et al. (2002).zKlingauf and Neher (1997), Neher (1998a,b), Maeda et al. (1999), Blatow et al. (2003); see also Bennett et al. (2000), Rozov et al. (2001), Felmy et al.
(2003), Jackson and Redman (2003), Trommershauser et al. (2003).
2692 Matveev et al.
Biophysical Journal 86(5) 2691–2709

Ultrastructural reconstruction of the crayfish NMJ has shown that the
vesicles are located around the edge of the Ca21 channel cluster (Cooper
et al., 1996; Atwood et al., 1997). Therefore, we are interested in the Ca21
concentration achieved at the periphery of the model AZ, at different lateral
distances from the edge of the channel cluster, and just below the membrane,
as shown in Fig. 1 (top). The Ca21 channels belonging to a single AZ are
lumped together in our simulations, and the Ca21 current is distributed
uniformly over a disk area 160 nm in diameter (Eq. 4; Fig. 1), approximating
the size of a channel cluster in a typical AZ (see Fig. 6, Be and Bf, of Atwood
and Karunanithi, 2002). Vesicles themselves are not included in the
simulations. The described geometry approximates the rectangular three-
dimensional geometry used in the simulations of Tang et al. (2000) and
Matveev et al. (2002), with the difference that the individual Ca21 channels
are not resolved in the current study. Ignoring the point-like nature of Ca21
influx is justified because we are not interested in an accurate description of
the Ca21 concentration profile in the microdomain of a single channel. As
will be shown in Results, sufficient facilitation magnitude is achieved at
distances of at least 40–60 nm away from the edge of the cluster, which is
larger than the average separation between neighboring Ca21 channels. We
expect the effect of the Ca21 influx localization to be small at these
distances, as confirmed by comparing our results with modified simulations
in which Ca21 influx was localized, with half entering exactly at the center
and the rest entering uniformly along the edge of the AZ (i.e., the
circumference of the 160-nm disk). We found that the two simulations
yielded nearly identical results. Thus, we are interested in what has been
previously termed the ‘‘submembrane’’ Ca21 domain (Klingauf and Neher,
1997; Bennett et al., 2000), or an AZ macrodomain. The uniformity
assumption for the current distribution may also be viewed as averaging over
varying positions of Ca21 channels at individual AZs.
Equations describing buffered diffusion of Ca21
For simplicity, in most of our simulations we assume the presence of a single
dominant Ca21 buffer, with the Ca21 binding reaction described by
B1Ca21 #kon
koff
CaB; (1)
where kon and koff are, respectively, the binding and the unbinding rates of
the Ca21-buffer compound. This leads to the following reaction-diffusion
equations for the Ca21 concentration, [Ca21], and the concentration of the
free (unbound) buffer, [B]:
@½Ca21�@t
¼ DCa=2½Ca21� � kon½Ca21�½B�
1 koffðBtotal � ½B�Þ1 1
2FICaðtÞgðuÞdðr � rbÞ (2)
@½B�@t
¼ DB=2½B� � kon½Ca21�½B�1 koffðBtotal � ½B�Þ: (3)
Here DB and DCa are the diffusion coefficients in cytosol of the buffer and
Ca21, respectively. We choose DCa ¼ 0.2 mm2 ms�1 (Allbritton et al.,
1992). Following the standard convention, in Eqs. 2 and 3 we have assumed
that the initial distribution of the buffer is spatially uniform, and that the
diffusion coefficient of the buffer is not affected by the binding of a Ca21
ion. Under these assumptions the sum of the bound and the unbound buffer
concentrations is constant in space and time, and is equal to the total buffer
concentration, Btotal. This allows one to eliminate the equation for the
evolution of the concentration of the bound buffer, [CaB] ¼ Btotal � [B].
Equations 2 and 3 are extended in a straightforward way when simulations
include more than one buffer. In this case, each of the buffers evolves
according to an equation identical to Eq. 3, and Eq. 2 is expanded to include
the binding and the unbinding terms for each of the buffers present (e.g., see
Smith et al., 2001).
The last term in Eq. 2 represents the Ca21 influx, where F is Faraday’s
constant, ICa(t) is the (inward) calcium current per active zone, and d(r� rb)
is the Dirac delta function, with rb ¼ 1.5 mm equal to the bouton radius (this
describes a Ca21 current flowing through the surface membrane). The
surface density function g(u) determines the distribution of the Ca21 current
over the AZ surface; it is assumed to be uniform across disk surface area 160
nm in diameter (SCa), and is zero everywhere else, as illustrated in Fig. 1 (see
justification above). The integral of g(u) over the SCa area should be equal to
one, from which we obtain
FIGURE 1 Model of a presynaptic crayfish motor bouton. The crayfish
motor terminal is approximately represented as a sphere 3 mm in diameter
(bottom), with active zones (AZ) distributed evenly over the spherical
surface. Ca21 diffusion and buffering are only simulated in the conical
region of the sphere surrounding a single AZ. The ring of vesicles around the
model AZ is shown for illustration only, and is not included in the
simulation. Current density g(u) (see Eqs. 2 and 4) is assumed to be
uniformly distributed over a disk surface area 160 nm in diameter (top).
Asterisks mark the locations at which the Ca21 concentration is sampled
during the simulations. These sites represent locations of the putative Ca21
‘‘sensors’’ (possible vesicle locations). We record Ca21 concentration 20
nm below the membrane surface, and at lateral distances of 20, 60, and 100
nm away from the edge of the Ca21 current influx (corresponding sites are
marked 1–3).
Facilitation through Buffer Saturation 2693
Biophysical Journal 86(5) 2691–2709
gðuÞ ¼ 1=SCa ¼ 1=ð2pr2
bð1 � cos aÞÞ;1=ðpr2
ba2Þ
for u#a (4)
gðuÞ ¼ 0 for u.a;
where a is the angle corresponding to the edge of the Ca21 influx area: a ¼80 nm/ rb ¼ 0.0533 rad. ICa(t) is represented as a train of simple 1-ms-long
constant current pulses. Unless otherwise noted, we set ICa magnitude to
11.7 pA. This value is a factor of 2 greater than the estimate of ICa ¼ 5.85 pA
obtained by measuring residual [Ca21] per AP (Yamada and Zucker, 1992;
Tang et al., 2000), and is within the range of ICa ¼ 10–50 pA inferred from
the measurements of [Ca21] rise rate during sustained stimulation (Tank
et al., 1995; both values are translated to a 1-ms-long current pulse). In
Results, we discuss the behavior of the model for variable magnitude of ICa.
Reflective boundary conditions hold for both [Ca21] and [B] at all
boundaries, except for the boundary condition for [Ca21] on the top surface
of the cone, which assumes Ca21 extrusion by surface pumps:
@½Ca21�@r
1M
DCa
½Ca21�½Ca21�1KP
¼ 0: (5)
Here M is the maximal pump rate, and KP is the pump dissociation
constant. We use values of KP ¼ 0.2 mM (Dipolo and Beauge, 1983;
Carafoli, 1987) and M¼ 0.01 mM mm ms�1 (except for Fig. 12, A and B). At
low [Ca21], this yields a Ca21 clearance time constant of t ; (1 1 k0) V KP/
(M S) ¼ 5 s, where V and S are the volume and the surface area of the bouton
(Fig. 1), and k0 ¼ 500 is the resting state endogenous buffering capacity at
the crayfish NMJ (Tank et al., 1995). This agrees with the experimental
value of Ca21 clearance rate obtained by Tank et al. (1995). In Results, we
will discuss the possibility of higher Ca21 extrusion rates. The resting
buffering capacity k0 (also known as the endogenous buffering ratio or the
binding ratio) is an important characteristic of the buffering strength, defined
as (Irving et al., 1990; Neher and Augustine, 1992)
k0 [@½CaB�@½Ca21�
����rest
¼ Brest
KD 1Carest
¼ BtotalKD
ðKD 1CarestÞ2 : (6)
The relevant free parameters in the model are summarized in Table 2.
Instead of the pair of values of koff and kon, we will use either kon and KD
(where KD ¼ koff/kon is the dissociation constant) or koff and KD as the two
independent parameters describing the buffer-Ca21 interaction. Note that for
a fixed KD, kinetic rates kon and koff are proportional to each other, so in the
fixed KD case the value of kon (koff) characterizes the buffer-Ca21
equilibration kinetics, not just the binding (unbinding) rate. The upper
bound of 1 mM�1ms�1 imposed on the magnitude of kon is close to the
theoretical diffusion limit on the maximal achievable forward binding rate
for reactants with diffusion coefficients of 0.2 mm2 ms�1 (Keizer, 1987).
To further simplify the analysis, we assume that the resting Ca21
concentration, Carest, is zero. In this case the expression for the buffering
capacity (Eq. 6) reduces to k0 ¼ Btotal/KD. However, all our results can be
straightforwardly translated to the case of nonzero Carest, as described in the
Appendix. In effect, we subtract out Carest from the total Ca21 concentration
and subtract the initial bound buffer concentration from Btotal, because these
are constant background values that do not affect the dynamics of Ca21
diffusion. Therefore, everywhere in this paper the value of Btotal should be
understood as the initial (resting) total concentration of free buffer, Brest.
Numerical simulations
The reaction-diffusion Eqs. 2–33 were solved using the Calcium Calculator
(CalC) software developed by one of us (V.M.). CalC uses an alternating-
direction implicit finite-difference method, second order accurate in spatial
and temporal resolution (Morton and Mayers, 1994). To preserve the
accuracy of the method in the presence of the buffering term, the equations for
[Ca21] and [B] are solved on separate time grids, shifted with respect to each
other by half a time step (Hines, 1984). CalC uses an adaptive time-step
method; the spatial grid size is adjusted to limit the error tolerance to at most
1–2% (grid of 36 3 36 points in the mobile buffer case, and 70 3 70 in the
fixed buffer case). CalC is freely available from http://web.njit.edu/
;matveev, and runs on Linux, SGI, and Windows/Intel platforms. To ensure
reproducibility of this work, the commented simulation script files generating
the data reported here will be made available on the above web site.
RESULTS
Facilitation of Ca21 transients: an example
Fig. 2 simulates the buffer saturation mechanism of SF,
showing the facilitation of Ca21 transients (FCT) in response
to a train of five equal Ca21 current steps. This growth in
simulated peak [Ca21] transients is caused by the residual
Ca21 accumulating from pulse to pulse and gradually binding
and depleting the free buffer, thereby reducing more and more
the ability of the buffer to shunt the AP-triggered Ca21
transients. Note that the free [Ca21]res is negligibly low (see
the inset), because most of the residual Ca21 is in fact bound to
the buffer, due to a high buffering ratio in our example (k0 ¼Btotal/KD ¼ 1000). In this and most of the following figures,
concentration is shown at a distance of 60 nm from the edge of
the Ca21 influx region (site 2 in Fig. 1); dependence on
distance will be analyzed later on (see Fig. 6).
The buffer included in the simulation is very mobile, with
the diffusion coefficient of DB ¼ 0.2 mm2 ms�1, which is
close to the putative mobility of ATP, for example (Naraghi
and Neher, 1997). As will be shown below, strong mobility
is a crucial requirement for the BSM. Because of high
mobility and fast binding, the Ca21 and the buffer are in
equilibrium with each other and evenly distributed in space
by the end of each 10-ms-long interpulse interval (data not
shown). Therefore, the increase in the fifth Ca21 transient,
P5, over the first Ca21 transient, P1, is completely de-
termined by the reduction in the amount of free buffer
remaining before the last pulse, denoted DB (DB ¼ Btotal �BR). Even at moderate values of the buffering capacity (k0 .
10), almost all of the incoming Ca21 becomes buffer-bound,
so that DB is approximately equal to the total (volume-
averaged) Ca21 influx, and therefore is solely determined by
the magnitude of ICa.
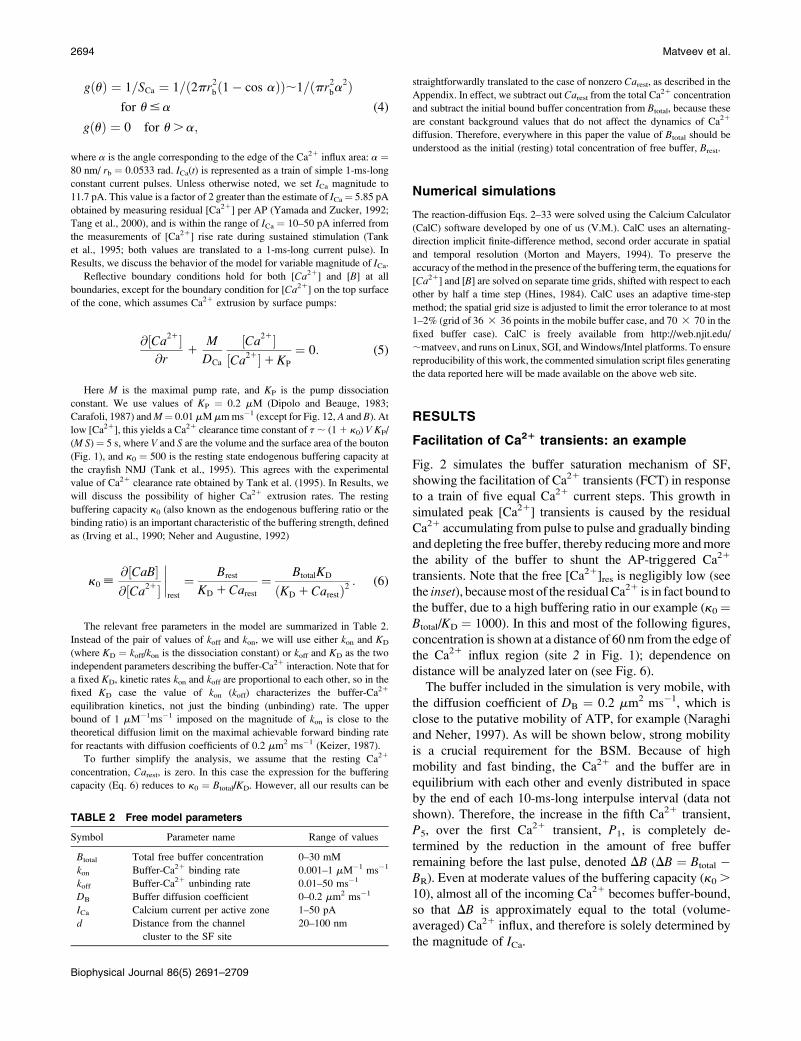
TABLE 2 Free model parameters
Symbol Parameter name Range of values
Btotal Total free buffer concentration 0–30 mM
kon Buffer-Ca21 binding rate 0.001–1 mM�1 ms�1
koff Buffer-Ca21 unbinding rate 0.01–50 ms�1
DB Buffer diffusion coefficient 0–0.2 mm2 ms�1
ICa Calcium current per active zone 1–50 pA
d Distance from the channel
cluster to the SF site
20–100 nm
2694 Matveev et al.
Biophysical Journal 86(5) 2691–2709

The conditions for high FCT
We will quantify FCT by the ratio of the amplitudes of the
fifth and the first peaks in Ca21 concentration:
FCT ¼ P5=P1 ¼ 11DP=P1: (7)
To achieve significant FCT, one needs a large increase in
the Ca21 transient magnitude (DP), and a comparatively
small value of the first Ca21 transient, P1 (see Fig. 2). These
two requirements lead to two different sets of constraints on
model parameters:
1. The requirements for small P1 are straightforward and
include all conditions that increase the buffering
efficiency: i), large Btotal; ii), fast binding (large kon);
iii), high buffer mobility, DB; iv), small ICa.
2. The conditions for large DP are twofold: i), significant
buffer saturation/depletion DB should be achieved before
the fifth pulse; as discussed above, this requires moder-
ately high values of k0 (k0 . 10), and high ICa; ii), for this
reduced buffer availability to make a difference, the buffer
should be close to saturation during the last pulse, as well:
the free buffer remaining at the end of the last pulse, BP,
should be small. In other words, initially the buffer should
be effective in limiting the rise in Ca21, but at the end of
the train, Ca21 transients should be able to strongly
saturate the buffer. This condition is easier to satisfy for
low Btotal and fast Ca21-buffer binding (high kon).
Notice that one requirement in the two groups coincides
(large kon), whereas the conditions on Btotal and ICa are in
contradiction. Therefore, one may expect the FCT to grow
monotonically with increasing kon, but its behavior with
respect to Btotal and ICa may be nonmonotonic. The results
presented below confirm this conclusion.
FCT peaks at a finite value of Btotal, and growsmonotonically with increasing kon
Fig. 3 shows the dependence of the five-pulse FCT, defined
according to Eq. 7, as a function of KD and Btotal, the first two
model parameters in Table 2. In this figure the magnitude of
the unbinding rate koff is kept fixed (koff ¼ 0.4 ms�1 for panel
A, koff ¼ 0.1 ms�1 for panel B), so the value of kon varies
along with the value of KD, according to the relation kon ¼koff/KD. The similarity between FCT values in Fig. 3, A and
B, demonstrates that FCT is only weakly dependent on koff,
and is predominantly determined by the values of kon and
Btotal (note that the range of values of kon, indicated along the
right margin, are equivalent in the two panels). However, the
lower the value of koff, the lower should be KD to achieve
a given FCT magnitude.
In agreement with the conditions formulated in the
previous subsection, Fig. 3 shows that FCT grows mono-
tonically with increasing kon, but depends nonmonotonically
on the value ofBtotal. For any given value of kon (KD), maximal
FCT is achieved at a certain finite value ofBtotal, which we will
denote by B*total (gray curve in Fig. 3). Explaining this
behavior, Fig. 4 shows the Ca21 and buffer concentration time
courses for three values of Btotal that correspond to the 1
labels in Fig. 3 A. The middle 1 marks the optimal value of
B*total (450 mM) for KD ¼ 0.5 mM (Fig. 4 B), corresponding to
the maximal FCT magnitude, whereas the two flanking values
of Btotal yield smaller values of facilitation. For Btotal , B*total
(Fig. 4 A, Btotal ¼ 200 mM), the buffer is completely saturated
during the Ca21 current pulses; even though DP is very large
in this case, the first Ca21 transient is large as well, resulting in
smaller FCT compared to its value for the optimal Btotal ¼B*
total: In contrast, whenBtotal.B*total (Fig. 4C,Btotal¼ 1 mM),
the buffer does not saturate to a sufficient extent, so even
though the value of P1 is much reduced compared to Fig. 4, Aand B, the magnitude of DP is quite small, leading again to
a smaller value of FCT than in the optimal (Btotal¼B*total) case.
FIGURE 2 Demonstration of the facilitation of Ca21 transients caused by
buffer saturation. Ca21 (middle panel) and buffer (bottom panel)
concentration time courses produced in response to a 5-pulse train of
1-ms-long Ca21 current pulses (top panel), as measured at a distance of 60
nm from the edge of the Ca21 channel cluster (site 2 in Fig. 1). The growth in
the Ca21 transient between the fifth and the first Ca21 pulses, DP, depends
on the degree of buffer saturation achieved right before (DB) and during (BP)
the final pulse. See text for details. Parameters are Btotal ¼ 500 mM, KD ¼ 0.5
mM, kon ¼ 0.8 mM�1 ms�1, DB ¼ 0.2 mm2 ms�1, and ICa ¼ 11.7 pA.
Facilitation through Buffer Saturation 2695
Biophysical Journal 86(5) 2691–2709

As the above analysis suggests, the optimal buffer con-
centration B*total should depend on the number of pulses in the
stimulation train. One should expect B*total to increase with
increasing train length, because more buffer is required to
produce the same saturation effect for a greater total calcium
influx, which is proportional to the number of pulses. Our
simulations confirm this conclusion, and show a decrease in
B*total of ;10% when the number of pulses is decreased from
five to three (data not shown).
FCT for a fixed value of buffering ratio
Even though the values of most of the model parameters
summarized in Table 2 are not readily available from
experiment, the rest-state endogenous buffering capacity,
k0 (see Eq. 6), can be estimated experimentally using
fluorescent dye techniques (Neher and Augustine, 1992). For
zero Carest, k0 is given simply by the ratio Btotal/KD. We have
chosen a value of 500, used in Tang et al. (2000) and
Matveev et al. (2002), and close to the estimate of 600 in-
ferred using the fluorescent Ca21 sensitive dye experiments
at the crayfish NMJ by Tank et al. (1995). In Fig. 3, the set of
points corresponding to k0 ¼ 500 lie along the diagonal
lines.
Constraining the value of k0 allows us to eliminate one of
the parameters from the pair {KD, Btotal}. That is, having
restricted ourselves to a constant value of k0 (the diagonal in
Fig. 3), in Fig. 5 we can explore the dependence of FCT on
an independent variation of kon and Btotal (the latter now also
determines KD, because Btotal ¼ k0KD). In the new parameter
space of Fig. 5, the locus of points corresponding to any
given value of koff is a hyperbolic curve. As an example, Fig.
5 A shows the two curves of points that correspond to koff ¼0.4 ms�1 and koff ¼ 0.1 ms�1. These two hyperbolae are the
images of the fixed-k0 diagonal lines in Fig. 3, A and B,
respectively. Thus, Fig. 5 A compresses all the fixed-
k0 information contained in a whole family of figures like
Fig. 3, A and B. Moving vertically from one hyperbolic curve
to the other in Fig. 5, we see that faster buffers would give
greater FCT. Finally, the FCT peak in Fig. 5 A shows that the
maximal magnitude of FCT is still achieved at a certain finite
value of Btotal (¼ 500 KD), even under the fixed k0 constraint.
Interestingly, we find that the dependence of FCT on kon
and Btotal is qualitatively as well as quantitatively similar at
different values of k0. This follows from our earlier result
that FCT is primarily determined by the values of Btotal and
kon (Fig. 3). From the relationship k0 ¼ Btotal/KD ¼ (Btotal
kon)/koff it is clear that increasing koff, which leaves FCT
almost unchanged (Fig. 3), is equivalent to a decrease in k0.
Therefore, lowering the value of k0, say to k0 ¼ 50 (a 10-fold
change), and simultaneously increasing koff 10-fold (10-fold
decrease in KD), results only in a moderate reduction of the
FCT magnitude (cf. Fig. 5, A and B).
Dependence on ICa is redundant
Apart from the value of k0, the value of ICa per action
potential per AZ can also be estimated using fluorescent
Ca21 indicator dye measurements. However, the accuracy of
FIGURE 3 FCT as a function of buffer affinity and total buffer
concentration. FCT is measured as the ratio of the fifth and the first Ca21
transients, P5/P1, at a distance of 60 nm from the edge of the Ca21 channel
cluster (site 2 in Fig. 1); (A) koff ¼ 0.4 ms�1 and (B) koff ¼ 0.1 ms�1. The
remaining parameter values are the same as in Fig. 2 (DB ¼ 0.2 mm2 ms�1,
ICa ¼ 11.7 pA). FCT is constant along the contours separating the differently
shaded bands, and its value is indicated on each of the contours. FCT grows
with decreasing KD (increasing kon). Given a fixed value of KD (kon),
maximal FCT is achieved at some finite value of Btotal, denoted B*total: (1)
The parameter points corresponding to panels A–C in Fig. 4. Note the
similarity between data in panels A and B, and the equal range of kon values
in the two cases (right scale). The diagonal line marks the set of parameter
points corresponding to k0 ¼ Btotal/KD ¼ 500. Increasing (decreasing) ICa is
equivalent to sliding left (right) along this line (see text for details). For
example, the value of FCT for ICa ¼ 5.85 pA, half the value used in this plot,
at the parameter point corresponding to the solid circle (Btotal ¼ 350 mM,
KD ¼ 0.7 mM), is equal to FCT for the doubled values of ICa, Btotal, and KD
(ICa ¼ 11.7 pA, Btotal ¼ 700 mM, KD ¼ 1.4 mM), corresponding to the
open circle, yielding FCT � 1.8.
2696 Matveev et al.
Biophysical Journal 86(5) 2691–2709

the Ca21 influx measurements is not high, because it
depends on the optical calibration of the fluorescent Ca21-
sensitive dye used in the measurements, on the estimates of
its concentration, and on the independent estimate of the
endogenous buffering capacity, k0. Further, one may expect
significant variability in ICa between different AZs, as well as
between different NMJ boutons. Therefore, it is important to
consider how the variation in the value of ICa would affect
FCT.
As it turns out, the dependence of FCT on the magnitude
of Ca21 influx per AP is redundant, because knowing the
dependence of FCT on KD and Btotal, for a given value of koff
(Figs. 3 and 5), gives full information about its behavior with
respect to ICa. This is a consequence of the freedom in
choosing the units of concentration. The FCT magnitude
should not be affected if the three parameters with units of
concentration, KD, Btotal, and ICa (current equals concentra-
tion times volume per unit time), are rescaled by the same
factor. Thus, if the FCT magnitude is calculated for a given
value of the Ca21 current, ICa, then at any other value of the
Ca21 current, ICa, it is given by
FCTð~IICa;Btotal;KD; koffÞ ¼ FCTðICa; a Btotal; a KD; koffÞ;(8)
where a [ ICa/ICa. It follows then that changing the value of
the Ca21 current is equivalent to sliding along the line of
constant Btotal/KD ratio (Figs. 3 and 5).
We have to emphasize that the above redundancy
condition only holds for the FCT, and not the facilitation
of neurotransmitter release. To obtain an expression similar
to Eq. 8 for SF proper, given a particular choice of a Ca21-
dependent exocytosis scheme, the affinity of the release
mechanism to Ca21 would have to be scaled along with ICa,
KD, and Btotal (i.e., it would have to be included in the list of
arguments that are multiplied by factor a on the right-hand
side of Eq. 8). However, we assume a simple power-law
relationship between release and [Ca21], thus avoiding this
complication (see ‘‘Relationship between FCT and facilita-
tion of release’’). A similar caveat concerns the case of
nonzero resting free [Ca21] value, Carest: in general, Carest
would have to be included in the argument list on the left-
and right-hand sides of Eq. 8. However, the procedure of
subtracting out the Carest value, described in the Appendix,
preserves the scaling freedom expressed by Eq. 8 in the case
of nonzero values of Carest (the arguments in Eq. 8 are to be
understood as the ‘‘primed’’ zero-Carest values: see Appen-
dix). Finally, we note that the Ca21 pump dissociation
constant KP (Eq. 5) constitutes yet another concentration
parameter, however it mostly affects the decay time course of
SF (to be discussed below), and has only moderate influence
on the FCT magnitude for short-duration stimulation trains
considered here.
Relationship between FCT and facilitationof release
To compare our simulation results with the magnitude of SF
available from experiment, we have to convert the FCT
values into a measure characterizing facilitation of neuro-
transmitter release. We prefer not to constrain ourselves to
a particular choice of a Ca21-dependent release model,
because doing so would require introduction of additional
parameters into our problem. Instead, we will assume that the
synaptic response is given by the fourth power of [Ca21].
Then, SF is likewise given by the fourth power of FCT:
SF ¼ FacilitationRelease ¼ ðFCTÞ4: (9)
Note that this equation neglects the inevitable saturation of
synaptic response, which would occur at sufficiently high
FIGURE 4 FCT in response to five
Ca21-current steps, for three different
values of the total buffer concentration
(marked by 1 in Fig. 3 A). (A) Btotal ¼200 mM, (B) Btotal ¼ B*
total ¼ 500 mM,
and (C) Btotal ¼ 1000 mM. Shown are
[Ca21] (upper panels), and the buffer
concentration (bottom panels) time
courses. Notice the difference in scale
along the concentration axis. The size of
the first Ca21 peak is scaled to the same
level for easy comparison. FCT
achieved in B is higher than in either
A or C. Buffer affinity is KD ¼ 0.5 mM
(kon ¼ 0.8 mM�1 ms�1), corresponding
to the bottom edge of Fig. 3 A. Other
parameters are the same as in Figs. 2
and 3 A (koff ¼ 0.4 ms�1, DB ¼ 0.2 mm2
ms�1, ICa ¼ 11.7 pA, d ¼ 60 nm). Data
in panel B are the same as in Fig. 2.
Facilitation through Buffer Saturation 2697
Biophysical Journal 86(5) 2691–2709

levels of [Ca21]. Further, the cooperativity value of 4 lies at
the high end of experimental range obtained for the crayfish
NMJ (Lando and Zucker, 1994; Wright et al., 1996; Ravin
et al., 1999; Vyshedskiy and Lin, 2000). Therefore, all
facilitation estimates in this paper are to be understood as
upper bounds on physiologically attainable facilitation.
Based on experimental observations, we require a five-
pulse SF magnitude of ;18–20 (see Figs. 1 C and 2 C of
Tang et al., 2000). This corresponds to FCT of P5/P1 ; 2.1
(because 2.14 ; 19.4). Therefore, in the contour plots of
Figs. 3 and 5, the parameter region yielding physiological
magnitude of SF lies within the area bounded by the contour
of FCT ¼ 2.0.
FCT grows with increasing distance betweenCa21 channel cluster and release site
There is substantial evidence for a close association between
the vesicle release machinery and the presynaptic Ca21
channels, suggesting their mutual proximity at many
synapses (for reviews, see Stanley, 1997; Sheng et al.,
1998; Catterall, 1999; Fisher and Bourque, 2001; Jarvis and
Zamponi, 2001). At the crayfish NMJ, morphological studies
suggest that vesicles are clustered along the edge of the AZ
(Cooper et al., 1996; Atwood et al., 1997; Atwood and
Karunanithi, 2002). However, at certain synapses, like the
calyx of Held, vesicles may be scattered at various distances
from the Ca21 channel cluster (Meinrenken et al., 2002;
Satzler et al., 2002). Further, recent experiments on the sen-
sitivity of phasic response to an application of a fast exo-
genous buffer (1,2-bis(2-aminophenoxy)ethane-N,N,N#,N#-tetraacetic acid (BAPTA)) suggest that there is a significant
separation between Ca21 channels and secretion triggers at
several strongly facilitating, but not at depressing, neocortical
and hippocampal synapses (Rozov et al., 2001; Blatow et al.,
2003). For any synapse type, it is possible that various
obstacles to diffusion (such as vesicles themselves) and the
tortuosity effects associated with the dense cytoskeletal and
protein mesh within the AZ may significantly increase the
effective diffusional distance between the Ca21 channel and
the release-triggering Ca21 sensor. Therefore, we simulated
the Ca21 transients at various distances from the Ca21 influx
region. Fig. 6 A demonstrates that the magnitude of FCT is
increased by an increase in the channel-sensor separation.
This result is easy to understand, because the buffer is able to
bind more Ca21 when it is acting over a longer diffusional
distance (see review by Neher, 1998b), and thereby is more
effective in reducing the first response, P1, leading to higher
FCT. Sufficient SF is achieved at distances of at least 40–60
nm from the Ca21 channel cluster.
Facilitation growth is supralinear
As discussed above, Figs. 5 and 6 A demonstrate that the
physiological magnitude of five-pulse SF can be achieved
within a certain range of values of kon and Btotal (KD).
However, we also need to establish whether BSM can
reproduce the supralinear accumulation time course of SF
observed at the crayfish NMJ (Figs. 1C and 2C of Tang et al.,
2000; Fig. 2 C of Winslow et al., 1994). Traces in Fig. 6 Bshow that the simulated growth of FCT for a chosen parameter
point (marked by an asterisk in Fig. 6A) is indeed supralinear,
at all distances from the Ca21 channel cluster, and therefore
facilitation of release (Eq. 9) grows supralinearly as well, in
agreement with experiment. Fig. 7 A demonstrates the
supralinear time course of SF corresponding to the [Ca21]
FIGURE 5 Dependence of five-pulse FCT on the values of kon and Btotal,
for a fixed value of the buffering ratio. (A) k0 ¼ 500; (B) k0 ¼ 50. Parameter
region corresponding to SF magnitude observed at the crayfish NMJ lies
inside the area bounded by contour FCT ¼ 2.0 (see text for details).
Hyperbolic curves mark parameter points of constant koff. (A) The two
curves correspond to the diagonal lines in Fig. 3, A and B. Increasing
(decreasing) ICa is equivalent to sliding left (right) along these lines. Because
the value of k0 is fixed, KD is determined by the value of Btotal. Other
parameters are the same as in Figs. 2–4 (DB ¼ 0.2 mm2 ms�1, ICa ¼ 11.7 pA,
d ¼ 60 nm).
2698 Matveev et al.
Biophysical Journal 86(5) 2691–2709

trace shown Fig. 6Bb, yielding a physiological SF magnitude.
In fact, we find that, for a mobile buffer, the parameter region
yielding high facilitation coincides with the region of high
supralinearity (data not shown). Therefore, BSM can
successfully reproduce the SF magnitude and its accumula-
tion time course observed experimentally at the crayfish NMJ.
Effect of exogenous buffers on facilitation growth
The experimental observations of the reduction of SF by
exogenously applied buffers were crucial for establishing the
role of residual Ca21 in SF (see review by Zucker and Regehr,
2002), and a successful SF model should reproduce this
property. Fig. 7 A shows the simulated effect of application of
200 mM of Fura-2, a fast and high-affinity mobile buffer, on
SF magnitude, for a set of parameter values marked by an
asterisk in Fig. 6 Ab. These simulation results agree very well
with the experimental results of Tang et al. (2000) (Fig. 7 B).
However, due to the nonmonotonic dependence of FCT on
Btotal, adding a mobile high-affinity buffer may actually in-
crease FCT, and hence SF, under certain conditions. Such
paradoxical effect of exogenous buffers on SF has been
termed ‘‘pseudofacilitation’’ (Neher, 1998a; Rozov et al.,
2001; Blatow et al., 2003; see also Discussion).
FCT at lower buffer mobility
Until now we have assumed that the Ca21 buffer is highly
mobile, with a diffusion coefficient comparable to that of
ATP, BAPTA, or EGTA (Naraghi and Neher, 1997). There
are several studies that agree with such high mobility of
endogenous buffers, for instance the experiments at goldfish
retinal bipolar cells (Burrone et al., 2002), Purkinje cells
(Maeda et al., 1999), and frog saccular hair cells (Roberts,
1993). However, endogenous buffers were found to be im-
mobile or poorly mobile in many other preparations, includ-
ing the calyx of Held (Helmchen et al., 1997), neocortical,
and hippocampal pyramidal cells (Helmchen et al., 1996;
Ohana and Sakmann, 1998; Lee et al., 2000), axons of
Aplysia neurons (Gabso et al., 1997), and bovine adrenal
chromaffin cells (Neher and Augustine, 1992; Zhou and
Neher, 1993; Xu et al., 1997). At the crayfish NMJ, the
mobility of endogenous Ca21 buffers is not known. To study
the dependence of the BSM on buffer mobility, we repeated
our simulations for variable values of Btotal and the DB, the
only parameter in Table 2 yet to be varied, for fixed values of
k0 and kon (k0 ¼ 500, kon ¼ 0.8 mM�1 ms�1). Fig. 8 A shows
that FCT declines dramatically as DB is decreased, which
agrees with the conditions for high FCT that were formulated
in the section entitled ‘‘Facilitation of Ca21 transients: an
FIGURE 6 FCT increases with increasing distance from the Ca21 channel cluster. (A) Five-pulse FCT as a function of Btotal and kon, at distances of (a)
20 nm, (b) 60 nm, and (c) 100 nm away from the edge of the channel cluster (locations marked 1–3 in Fig. 1). Data in panel Ab are the same as in Fig. 5 A.
(B) [Ca21] time course for parameter values corresponding to the points marked with an asterisk in A (Btotal ¼ 700 mM, KD ¼ 1.4 mM, kon ¼ 0.5 mM�1 ms�1).
Note the difference in scale along the concentration axis. Other parameter values are the same as in Figs. 2–5 (DB ¼ 0.2 mm2 ms�1, ICa ¼ 11.7 pA).
Facilitation through Buffer Saturation 2699
Biophysical Journal 86(5) 2691–2709

example.’’ At the same time, there is an increase in the
optimal buffer concentration required to achieve maximal
FCT. This is because a buffer with lower mobility is
saturated much more readily, so greater Btotal is required to
prevent oversaturation. However, we find that the transition
to the fixed buffer case (DB ¼ 0) is nonmonotonic, and FCT
starts increasing as DB drops below ;0.01 mm2 ms�1 (Fig. 8
B), suggesting the existence of a distinct facilitation regime
at very low values of DB.
FCT in the fixed buffer case
At low mobility and high Btotal it becomes possible for the
buffer to absorb most of the Ca21 influx before it reaches the
Ca21 sensor, strongly decreasing the first few responses, and
thereby leading to a high FCT magnitude. This regime is
most pronounced when the buffer is completely immobile; as
Fig. 8 B shows, FCT rapidly decreases even for small
nonzero values of DB. Fig. 9 A illustrates the behavior of
FCT for DB ¼ 0, as a function of kon and Btotal (¼ 500 KD), at
different distances from the Ca21 channel cluster (compare
with the mobile buffer case, Fig. 6). FCT is seen to be rela-
tively weakly dependent on kon, for sufficiently high values
of kon. This is because the effective diffusional distance from
the point of influx to the Ca21 sensor is significantly
increased in the presence of a fixed buffer, assuring that the
Ca21 ions will undergo multiple binding-unbinding steps for
a wide range of kon values. For this reason, FCT is sensitive
to the buffer affinity, KD, and not to kon, as in the mobile
buffer case. Therefore, FCT is also sensitive to the value of
buffering capacity, k0. We find that large k0 is required to
achieve high FCT in the fixed buffer case (data not shown).
The [Ca21] traces shown in Fig. 9 B demonstrate that the
free [Ca21]res makes a more significant contribution to Ca21
peaks, as compared to the case of a mobile buffer (cf. Fig. 6
B). In fact, we find that the regions of high FCT and high free
[Ca21]res significantly overlap (data not shown). When
[Ca21]res is nonnegligible, Eq. 9 should be modified to
include its contribution to facilitation:
FacilitationRelease ¼ ððP5 1R4Þ=P1Þ4
¼ ðFCT1R4=P1Þ4; (10)
where R4 equals [Ca21]res achieved at the end of the fourth
interpulse interval (see Fig. 9 Bb). The R4/P1 ratio should
remain much smaller than one, because the delayed
asynchronous release 10 ms after the fourth pulse is known
to be much smaller than the peak synaptic response achieved
during the first pulse. The contribution of [Ca21]res increases
with increasing Btotal (KD), and with increasing distance from
the Ca21 channel cluster. In fact, for sufficiently high Btotal
values and at large distances, the fast Ca21 transient becomes
completely shunted by the buffer, and the peak in Ca21
concentration is significantly delayed with respect to the end
of the pulse (in Fig. 9 Bc, the delay is 1.5 ms). Under these
conditions the BSM would predict a physiologically un-
realistic latency between the end of the Ca21 influx and the
peak of neurotransmitter release. At a given distance, there is
only a narrow range of Btotal values where the magnitude of
facilitation (Eq. 10) reaches experimentally observed levels,
whereas the free [Ca21]res contribution remains small (R4/P1
# 0.2). For a distance of 60 nm (Fig. 9 Ab), the
corresponding range is ;10–12 mM, approaching unphy-
siologically high concentrations.
Fig. 10 demonstrates the spatial distribution of the Ca21
ions and the buffer at different times after the cessation of an
AP, for a parameter point marked with a 1 in Fig. 9 A.
Contrary to the mobile buffer case, it takes tens of
FIGURE 7 Facilitation grows supralinearly in the mobile buffer case.
Comparison of (A) simulation results with (B) experimental data from Fig. 3
C of Tang et al. (2000), showing SF for a five-pulse 100-Hz train, with and
without Fura-2. In A, simulations are performed for parameter values
corresponding to the point marked by an asterisk in Fig. 6 Ab (distance¼ 60
nm, Btotal ¼ 700 mM, KD ¼ 1.4 mM, kon ¼ 0.5 mM�1 ms�1, DB ¼ 0.2
mm2ms�1, ICa ¼ 11.7 pA). Facilitation is normalized to zero for the first
pulse: ([Ca21]n/[Ca21]1)4 � 1 (Eqs. 11 and 12). The [Ca21] trace
corresponding to the control simulation curve in A is shown in Fig. 6 Bb.
The following parameter values are used for the Fura-2 in A: Btotal ¼ 200
mM, KD ¼ 360 nM, kon ¼ 0.27 mM�1 ms�1, and DB ¼ 0.118 mm2 ms�1
(Tang et al., 2000).
2700 Matveev et al.
Biophysical Journal 86(5) 2691–2709

milliseconds rather than a fraction of one millisecond for the
concentrations to reequilibrate in space, so the free [Ca21]res
elevation and the buffer saturation region are still signifi-
cantly localized by the end of a 10-ms-long interpulse
interval. This illustrates that it is a local rather than global
buffer saturation that underlies FCT in the fixed buffer case.
Further, we find that the accumulation time course of SF is
sublinear for a fixed buffer. Fig. 9 Bb shows the [Ca21] trace,
and Fig. 11 depicts the corresponding SF growth time course
at a distance of 60 nm from the edge of the Ca21 influx
region, for a parameter point marked with a 1 in Fig. 9 Ab.
In fact, we find that the SF accumulation time course remains
sublinear for any choice of parameter values (data not
shown).
Facilitation decay time course and the effect ofFura-2 on facilitation decay
Above we have shown that high buffer mobility is important
for the BSM to explain the experimentally observed
supralinear accumulation time course of SF. For a highly
mobile buffer, the Ca21 concentration rapidly reequilibrates
FIGURE 8 Dependence of FCT on
buffer mobility. Shown is the five-pulse
FCT as a function of the buffer diffusion
coefficient, DB, and Btotal (KD), for k0 ¼500. Panel B extends the data in panel A
into the region of very highBtotal, and uses
logarithmic scale to emphasize the region
of very small DB. Note the two FCT
peaks, one at largeDB and smallBtotal, and
another peak at DB close to zero and very
largeBtotal. Parameter values are kon ¼ 0.8
mM�1 ms�1, ICa ¼ 11.7 pA, and d ¼ 60
nm. The set of points along the top edge of
all panels (DB ¼ 0.2 mm2 ms�1) corre-
spond to the horizontal line kon ¼ 0.8
mM�1 ms�1 in Figs. 5 and 6 Ab).
FIGURE 9 FCT as a function of Btotal and kon in the fixed buffer case, for a constant value of the buffering capacity, k0 ¼ 500. This is the same as Fig. 6,
except that DB ¼ 0. Note that much higher Btotal is required to achieve significant facilitation, and the slower decay of the Ca21 transients, as compared to the
mobile buffer case (cf. Fig. 6).
Facilitation through Buffer Saturation 2701
Biophysical Journal 86(5) 2691–2709

throughout the terminal upon termination of the Ca21 influx
caused by an AP. Therefore, the buffer has to become
saturated globally (i.e., in the entire presynaptic bouton) to
cause significant FCT. The decay time course of facilitation
will therefore be determined by the extrusion of Ca21 by the
plasmalemma transport proteins, with possible contribution
of uptake into internal Ca21 stores. Because we were
interested in establishing an upper bound on maximal SF
magnitude that can be achieved by the BSM, we made
a conservative assumption about the Ca21 extrusion rate in
our simulations, choosing a clearance time estimate of 5 s,
based on the crayfish NMJ measurements of Tank et al.
(1995). This is much longer than the time scales of tens and
hundreds of milliseconds that characterize the two compo-
nents of SF decay observed at this synapse. The above
estimate of Ca21 clearance rate was obtained by tracking
[Ca21] for tens of seconds after cessation of stimulation,
when Ca21 is low and the main mode of extrusion is through
ATP-driven pumps. It is likely that immediately after
stimulation the clearance proceeds at a faster rate, in
particular due to activation of a lower-affinity but higher-
capacity Na1/Ca21 exchanger, or some other low-affinity
Ca21 removal mechanism (e.g., a slow low-affinity buffer).
Indeed, the decay of Ca21 transients induced by AP trains
was recently measured at the crayfish NMJ by Vyshedskiy
and Lin (2000) on a finer time scale, revealing a biphasic
decay with time constants of 84 6 30 and 390 6 153 ms.
These time constants are comparable to the F1 (18 6 5ms)
and F2 (530 6 200 ms) components of facilitation decay at
the crayfish NMJ (Zucker, 1974; Vyshedskiy and Lin, 1997;
Tang et al., 2000). Note that due to the nonlinear dependence
of transmitter release on Ca21, the SF decay times are
expected to be somewhat shorter than the corresponding
Ca21 clearance time constants. Therefore, within the BSM
framework, the decay time course of SF could be explained
by the fast extrusion of Ca21 from the terminal.
To allow for a faster decay of Ca transients, we have
increased the pump dissociation constant from KP ¼ 0.2 mM
to KP ¼ 5 mM, which is comparable to the affinity of the
Na1/Ca21 exchanger (Blaustein and Lederer, 1999; Car-
afoli, 1987; DiPolo and Beauge, 1983), and increased the
maximal extrusion rate from M¼ 0.01 mM mm ms�1 to M¼5 mM mm ms�1 (see Eq. 5). Fig. 12 A shows the resulting SF
decay time course, with and without additional Fura-2. Note
that our simulations predict a slowing of SF decay in the
presence of an exogenous buffer such as Fura-2, contrary to
experimental observations (cf. Fig. 12 C). The slower decay
is explained by the fact that the Ca21 clearance time is
directly proportional to the total intraterminal buffering
capacity (Neher and Augustine, 1992), which is approxi-
mately doubled after addition of 200 mM of Fura-2. We
verified that this effect is maintained if we assume that the
FIGURE 10 Slow spatial reequilibration of Ca21 and
fixed buffer after an action potential. Panels on the left (right)
demonstrate the Ca21 (buffer) concentration profiles, re-
spectively, at different times (indicated on the corresponding
contours) after the cessation of a 1-ms-long Ca21 current
pulse. The profiles are shown along an axis situated 20 nm
below the synaptic membrane, and running parallel to it (dot-
dashed line in Fig. 2). The inset shows [Ca21] profiles on
a finer concentration scale, at later times. The short-dashed
vertical line marks the edge of the Ca21 influx region
(distance of 80 nm), whereas the long-dashed lines corres-
pond to the three sites marked by asterisks in Fig. 1 (distances
of 100 nm, 140 nm, and 180 nm from the AZ center, or 20 nm,
60 nm, and 100 nm from the edge of the influx region).
Parameter values correspond to a point marked by a1 in Fig.
9 A. At the end of the 10-ms-long interpulse interval, there is
still a significant nonuniform (localized) saturation of the
fixed buffer, which is in equilibrium with the locally elevated
residual free Ca21 (inset).
FIGURE 11 Facilitation grows sublinearly in the fixed buffer case.
Shown is the simulated SF in response to a five-pulse 100-Hz AP train,
arising from the saturation of a fixed buffer, with and without Fura-2. Note
the sublinear accumulation time course, contrary to the mobile buffer case
and the experimental data (cf. Fig. 7). Parameter values correspond to a point
marked by 1 in Fig. 9 Ab (Btotal ¼ 11 mM, KD ¼ 22 mM, kon ¼ 0.2 mM�1
ms�1; d¼ 60 nm). Facilitation is normalized to zero for the first pulse. Fura-
2 parameters are the same as in Fig. 7 A. The [Ca21] trace corresponding to
the control simulation curve is shown in Fig. 9 Bb. The residual free Ca21
contributes ;12% to the fifth [Ca21] peak in the control simulation, and
;7% in the Fura-2 simulation.
2702 Matveev et al.
Biophysical Journal 86(5) 2691–2709

Fura-2 is immobilized (Matveev et al., 2002), and in
simulations where decay of Ca21 transients is caused by a
slow endogenous buffer (data not shown).
One may suggest therefore that the observed decay
properties of SF are more consistent with a model relying
on the saturation of a fixed buffer; as discussed above, it is
a local rather than global saturation that causes FCT when
buffers are fixed. Indeed, Figs. 10 and 9 B demonstrate that
in the fixed buffer case the Ca21 transients contain
a gradually decaying (t ; 10 ms) component caused by
the slow spatial reequilibration of Ca21, which is absent in
the case of a mobile buffer (cf. Fig. 6 B). As we have shown
previously (Matveev et al., 2002), this local free [Ca21]res is
responsible for SF in the two-site model of Tang et al.
(2000). In the BSM framework, it partially contributes to SF
by adding to the Ca21 transients (Fig. 9 Bb; Eq. 10).
Therefore, in the presence of fixed buffers the SF decay is
expected to contain a fast (F1-like) phase due to the spatial
reequilibration of Ca21, which should be strongly reduced in
the presence of a mobile high-affinity Ca21 buffer such as
Fura-2, in agreement with experiment (Fig. 12 B). However,
the second decay phase is slowed down in our simulations,
as in the mobile buffer case (cf. Fig. 12 A). Thus, the model
in its present form cannot successfully explain the
experimentally observed effect of exogenous buffers on the
decay time of SF, shown in Fig. 12 C (but see the Discussion
below).
FCT in the presence of two buffers
In this work we have concentrated on the case whereby
a single dominant endogenous buffer is shaping the
intracellular Ca21 dynamics. We believe that a thorough
investigation and understanding of the single-buffer situa-
tion is necessary before considering more complicated
scenarios. However, one cannot exclude the possibility that
several endogenous buffers make a commensurate contri-
bution to the overall buffering capacity at the crayfish NMJ,
as well as at other synapses. In particular, one may propose
that the immobile or poorly mobile buffer with low capacity
(k0 ; 40–50) found in different cell types (references cited
in Results) represents the basal buffer present in all
synapses, whereas only a subset of cell types possess an
additional mobile high-capacity buffer (e.g., calbindin;
Nagerl et al., 2000). Although the data on the properties
of the putative immobile low-capacity buffer is lacking,
evidence from chromaffin cell studies suggest that it may
have low affinity (Xu et al., 1997). Therefore, to analyze
this possibility we performed simulations in which a mobile
buffer with varying Btotal and kon was added to a fixed
concentration of a low-affinity immobile buffer with Btotal ¼750 mM, KD ¼ 15 mM (k0 ¼ 50), and kon ¼ 0.1 mM�1
ms�1 (Fig. 13). Our results show that the FCT is reduced
when the low-affinity buffer is introduced, and that the size
of this reduction depends on the relative capacities of the
FIGURE 12 Experimental and simulated effect of Fura-2 application on
the decay time course of SF. Shown is the SF magnitude for the last pulse
in a 100-Hz five-pulse train, for a variable time interval between the
fourth and the fifth pulses, Dt4-5, for (A) mobile buffer simulation, (B)
fixed buffer simulation, and (C) experimental data from Fig. 3 B of Tang
et al. (2000). SF is computed as in Fig. 7. Parameter values in A are the
same as in Fig. 7 A, except for the faster Ca21 extrusion (see text),
leading to a reduction of SF at Dt4-5 ¼ 10 ms from 19-fold to 14-fold.
Parameter values in B are the same as in Fig. 11. The biexponential fits in
A are given by 9.4 exp(�Dt/57 ms) 1 5.3 exp(�Dt/202 ms) (d), and 3.7
exp(�Dt/111 ms) 1 3.3 exp(�Dt/416 ms) (s). In B, fits are 41 exp(�Dt/
7.9 ms) 1 7.1 exp(�Dt/44 ms) 1 0.29 exp(�Dt/6330 ms) (d), and 21.7
exp(�Dt/7.1 ms) 1 1.16 (s).
Facilitation through Buffer Saturation 2703
Biophysical Journal 86(5) 2691–2709

two buffers. Namely, the maximal achievable FCT is more
significantly reduced when the immobile and mobile buffers
have equal capacities (Fig. 13 B), whereas the FCT
reduction is less dramatic when the capacity of the mobile
buffer is significantly higher than the capacity of the low-
affinity fixed buffer (Fig. 13 A). In general, we could not
find conditions under which a two-buffer system would
yield a higher FCT magnitude as compared to a single
buffer system (data not shown). This puts an additional
emphasis on the point that the FCT magnitude that we
demonstrate is the maximal bound on the FCT that can be
achieved under physiological conditions.
DISCUSSION
Using a computer model of a crayfish motor bouton, we have
explored in detail the phenomenon of facilitation of Ca21
transients resulting from the saturation of an endogenous
Ca21 buffer. We have given an exhaustive characterization
of the dependence of FCT on the endogenous buffering
parameters (Table 2), and have described the conditions
necessary to obtain a sufficiently high SF magnitude, as
summarized below. The requirement of significant distance
between the Ca21 source and the secretion site; our findings
on the nonmonotonic dependence of FCT on buffer concen-
tration; and the increase of FCT with increasing [Ca21]ext,
are all consistent with the experimental results of Blatow
et al. (2003).
Further, we compare our simulation results with the
properties of SF observed at the crayfish NMJ by Tang et al.
(2000). The crayfish NMJ is particularly well suited for the
study of SF, because it displays pronounced SF under
physiological conditions, and the increase of synaptic re-
sponse is not occluded by concomitant synaptic depression,
which is the case in most other systems (reviewed by Zucker
and Regehr, 2002).
FCT and buffer mobility
As we have shown, buffer mobility is a crucial factor in the
BSM. Curiously, we found that to achieve a physiologically
relevant SF magnitude, the buffer has to be either highly
mobile or highly immobilized, with much smaller FCT
achieved for intermediate values of mobility (Fig. 8 B). This
is because the mechanism by which buffer saturation causes
facilitation is different in the high- versus low-mobility
regimes. A highly mobile buffer efficiently carries Ca21 ions
away from the AZ, strongly shunting the response to the first
pulses in a stimulation train, while becoming gradually
saturated in the entire bouton (Fig. 2). This results in large
FCT. A fixed buffer causes facilitation by saturating locally,
rather than globally, which traps Ca21 ions in an area
surrounding the AZ (Fig. 10; Nowycky and Pinter, 1993;
Neher, 1998a). To absorb a significant fraction of the Ca21
influx locally, the buffer has to be completely immobile, and
its concentration has to be much higher than in the mobile
buffer case, extending into the range of unrealistically high
values (Figs. 8 B and 9). Further, achieving high saturation
also requires a significant separation between the Ca21
sensor and the Ca21 source. However, at larger distances and
higher Btotal, the free [Ca21]res becomes comparable in
magnitude to the fast Ca21 transients, providing a greater
contribution to the overall facilitation (Eq. 10). At large
enough values of distance and Btotal, the peak in Ca21
concentration becomes significantly delayed with respect to
FIGURE 13 Dependence of FCT on the properties of a mobile buffer, in
the presence of an immobile low-affinity buffer with fixed characteristics.
Five-pulse FCT is shown as a function of kon and Btotal of the mobile buffer,
for mobile buffering capacity of (A) k0 ¼ 500 and (B) k0 ¼ 50. The buffering
capacity of the immobile low-affinity buffer is kF0 ¼ 50, in both panels. The
properties of the immobile buffer are fixed: Btotal ¼ 750 mM, KD ¼ 15 mM,
and kon ¼ 0.1 mM�1 ms�1. Other parameters are the same as in Figs. 2–4
(DB ¼ 0.2 mm2 ms�1, ICa ¼ 11.7 pA, d ¼ 60 nm). Note that introducing an
immobile low-affinity buffer reduces FCT, as compared to the single-buffer
case (Fig. 5). The magnitude of this reduction is more dramatic when the
capacities of the two buffers are comparable (cf. panel B and Fig. 5 B).
2704 Matveev et al.
Biophysical Journal 86(5) 2691–2709
the end of the Ca21 influx (Fig. 9 Bc), because diffusion is
slowed by the fixed buffer, and the trapped Ca21 ions
undergo multiple binding/unbinding steps before they reach
their secretory target. Under these conditions, a single release
site model is no longer consistent with the transient nature of
the postsynaptic response. Therefore, the model would have
to be expanded to include a proximal secretory trigger, in
addition to the more distal facilitation site, as proposed by
Tang et al. (2000) and explored more recently by Matveev
et al. (2002). The proximal site would preserve the transient
nature of transmitter release, because sufficiently close to the
channel cluster the decay of Ca21 peaks is fast.
In the present simulations, in the fixed buffer case the
mechanism of facilitation undergoes a gradual qualitative
change as the parameters are varied, and at high values of
distance and Btotal, the accumulation of free [Ca21]res
becomes the principle source of facilitation (Fig. 9 Bc). For
intermediate values of parameters, buffer saturation begins to
contribute to the overall facilitation magnitude (Fig. 9 Bb). In
contrast, in the mobile buffer case the FCT through buffer
saturation represents the only mechanism of SF for a wide
range of buffering conditions. These results further illustrate
the opposing effects of fixed and mobile buffers on Ca21
dynamics, elucidated in earlier studies (Junge and McLaugh-
lin, 1987; Sala and Hernandez-Cruz, 1990; Zhou and Neher,
1993; Nowycky and Pinter, 1993; Winslow et al., 1994;
Gabso et al., 1997; Naraghi and Neher, 1997; Neher, 1998a).
Nonmonotonic dependence onbuffer concentration
Most studies show a reduction in SF upon introduction of
exogenous mobile Ca21 buffers, pointing to the importance
of residual Ca21 as the main source of SF (reviewed in
Zucker and Regehr, 2002). Our results suggest that this effect
is consistent with the BSM (Figs. 7, 11, and 12). However,
depending on whether the endogenous buffering conditions
correspond to the ‘‘ascending’’ or the ‘‘descending’’ slope of
the FCT peak in Fig. 3, and depending on the mobility of the
added buffer relative to the endogenous one, one would
predict either an increase or a decrease in the facilitation
magnitude. Further, regardless of the source of SF under
physiological conditions, adding an alien mobile Ca21 buffer
may change the physiological mechanism of facilitation to
that of FCT. Such ‘‘pseudofacilitation’’ (Neher, 1998a) may
turn out to be greater in magnitude than the native facilitation
under control conditions, but as Fig. 3 suggests, it would
inevitably decline as the concentration of the added buffer is
ramped up sufficiently. This agrees completely with the
‘‘pseudofacilitation’’ effect that has been observed at some
neocortical and hippocampal synapses in response to
BAPTA application (see Fig. 9 B in Rozov et al., 2001,
and Fig. 3 B of Blatow et al., 2003). Pseudofacilitation may
also explain the discrepancy between the results of Winslow
et al. (1994), showing the lack of effect of BAPTA-
acetoxymethyl-ester on facilitation at the crayfish NMJ,
and the results of other studies showing that similar
manipulations reduce facilitation in this system. It may be
argued that the particular concentration of BAPTA-acetox-
ymethyl-ester used by Winslow et al. caused a pseudofacili-
tation effect that balanced the concomitant reduction of
facilitation occurring through a different mechanism (see also
Discussion in Bennett et al., 2000).
Dependence on external Ca21 concentration
The dependence of FCT on the buffer concentration (and
hence, on its affinity KD, as well) remains nonmonotonic,
even if the value of k0 is kept fixed (Figs. 5, 6 A, and 9 A). It
follows then that the dependence of FCT on ICa is also
nonmonotonic, because changing the value of ICa is equiv-
alent to a simultaneous rescaling of the parameters Btotal and
KD in the opposite direction (Figs. 3 A and 5 A). A conse-
quence of this fact is that the FCT is an increasing function of
the external Ca21, [Ca21]ext, for small enough values of
[Ca21]ext, assuming that ICa is proportional to [Ca21]ext. This
agrees with the experimental results of Blatow et al. (2003)
and Rozov et al. (2001). However, at sufficiently high values
of [Ca21]ext, the dependence of SF on [Ca21]ext should
reverse. Further, the saturation of the putative secretory site
and the potential emergence of short-term synaptic de-
pression at higher release rates, two effects not included in
our model, would limit the range of [Ca21]ext values for
which SF grows with [Ca21]ext.
Dependence on the properties of therelease mechanism
As discussed above, we have chosen to quantify facilitation
solely in terms of the increase in the Ca21 concentration.
Inclusion of a specific Ca21-dependent vesicle release
scheme would obscure the relationship between the
facilitation magnitude and the Ca21-binding properties of
the buffer. Saturation of the release mechanism at high
[Ca21] would reduce SF estimates calculated according to
Eqs. 9 and 10, especially at low values of Btotal and kon, and
for small separations between the Ca21 channel and the
release site, because these conditions correspond to high
Ca21 concentration. Therefore, saturation effects would
move the FCT peak in parameter sweep plots of Figs. 3, 5, 6,
8, and 9 to higher values of Btotal, and the height of the peak
may be significantly reduced. However, all our conclusions
about the qualitative dependence of FCT on the endogenous
buffering parameters would remain unchanged.
Facilitation accumulation time course
We have found that the saturation of either a very mobile or
a completely immobilized buffer may explain the magnitude
Facilitation through Buffer Saturation 2705
Biophysical Journal 86(5) 2691–2709

of SF observed at the crayfish NMJ (Figs. 7 and 11).
However, the observed supralinear accumulation time course
of SF is only predicted if the endogenous buffer is mobile. In
agreement with our results, experiments of Blatow et al.
(2003) reveal a supralinear SF growth at a hippocampal
mossy fiber synapse that contains a highly mobile calbindin
(see Fig. 5 C therein; properties of calbindin have been
described by Nagerl et al., 2000). Note also that lowering the
assumed Ca21-cooperativity of release from four to three,
and including saturation at high Ca21 levels, would make the
simulated SF growth less steep, favoring even more the
mobile buffer model over the fixed buffer case.
It is important to bear in mind that our results show the
upper bound on the physiologically attainable level of SF.
Therefore, even in the more favorable mobile buffer case, the
parameter region corresponding to the observed magnitude
of SF may be more narrow than our results in Figs. 3, 5, 6,
and 13 suggest, in particular because we assume very high
buffer mobility and a nonsaturating relationship between
transmitter release and [Ca21].
Acceleration of facilitation decay byexogenous buffers
Although saturation of a mobile buffer can successfully
explain the observed magnitude and accumulation time
course of SF, we showed that it is not consistent with the
observed acceleration of decay of SF by fast high-affinity
exogenous buffers (Fig. 12, A and C). In the fixed buffer
case, the faster phase of decay, corresponding to the spatial
reequilibration of the locally elevated residual Ca21, would
be indeed accelerated upon adding a mobile buffer. Still, the
slower decay phase, corresponding to Ca21 clearance, would
be slowed down, as in the mobile buffer case (Fig. 12 B).
However, one may suggest that a slow leak of Ca21 from the
bouton into the axonal compartment, an effect not included
in our model, may make a significant contribution to the
decay of SF. If the mobility of the exogenous buffer is
greater than or equal to the mobility of the endogenous one,
then its addition would accelerate the putative leak of Ca21
into the axon, thereby accelerating SF decay. It is not clear,
however, whether the faster decay of both components of SF
could be explained by this leak mechanism. Further, recent
crayfish NMJ experiments by J.-Y. Lin, Q. Fu, and T. Allana
(in preparation) show that the decay of Ca21 transients on
timescales of tens to hundreds of milliseconds is not sensitive
to the mobility of the Ca21-sensitive dye used to image
[Ca21], arguing against the importance of this leak. The
above study also suggests that the endogenous Ca buffers at
the crayfish opener NMJ are characterized by low mobility.
Therefore, it is unlikely that BSM can explain the observed
properties of SF at the crayfish NMJ. However, further
modeling work that would incorporate this new experimental
data is necessary to reach a definite conclusion. Parenthet-
ically, we note that at the frog NMJ, addition of exogenous
buffer does slow the decay of SF (Robitaille and Charlton,
1991), as predicted by the present model.
We showed previously (Matveev et al., 2002) that both the
growth and the decay properties of SF at the crayfish NMJ
can be explained by a model with a distant facilitation site
proposed by Tang et al. (2000). However, to explain the
supralinear accumulation time course, the two-site model had
to incorporate additional assumptions of a very large se-
paration between the SF sensor and the Ca21 channel array
(.250 nm), or a high degree of tortuosity near the active
zone. The two-site model is similar to the BSM in that both
rely exclusively on the dynamics of Ca21 diffusion and
buffering to explain the observed behavior of SF, in par-
ticular its decay time course. An alternative possibility is that
at least one of the facilitation decay components may result
from the slow unbinding of Ca21 from a release-controlling
Ca21 sensor (Yamada and Zucker, 1992; Bertram et al.,
1996; Bennett et al., 1997; Dittman et al., 2000). In its pure
form, such a bound Ca21 model is inconsistent with experi-
mental data demonstrating the importance of free residual
Ca21 for SF (reviewed in Zucker and Regehr, 2002). Yet it is
possible that a hybrid model, sensitive to free Ca21 but
including a slow unbinding process, could also reproduce the
facilitation behavior observed at the crayfish NMJ. Although
recent experiments have ruled out the existence of a slow
unbinding step at the calyx of Held terminal (Felmy et al.,
2003), it was shown to play a role at a cerebellar granule cell
synapse (Atluri and Regehr, 1996).
Our analysis shows that the buffer saturation mechanism
(better termed the FCT model) and the two-site residual free
Ca21 model can be viewed as being on the opposite sides of
the same spectrum (Fig. 8 B). Whereas the FCT is most
pronounced when a highly mobile buffer saturates globally,
the accumulation of free [Ca21]res is mediated by the local
saturation of (local Ca21 trapping by) a high-concentration
fixed buffer. However, there exists an intermediate parameter
regime, where the accumulation of free [Ca21]res and the
facilitation of Ca21 transients can both contribute to synaptic
facilitation (Fig. 9 Bb).
APPENDIX: THE CASE OF NONZERO RESTINGCA21 CONCENTRATION
Although our simulations assume zero resting Ca21 concentration, Carest,
the results can be straightforwardly translated to the case of nonzero Carest.
The Carest is a constant term not affecting the dynamics of diffusion or
buffering, so its effect is limited to a transformation of model parameters.
Let’s express the total [Ca21] as a sum of Carest and the contribution due to
Ca21 entry during an action potential ([Ca21] [ [Ca21]AP): [Ca21]total ¼Carest 1 [Ca21]. Because the derivative of the constant resting term Carest on
the left- and the right-hand sides of Eq. 2 is zero, the only change is in the
reaction term on the right-hand side of Eqs. 2 and 3:
R ¼ �kon½B�½Ca21�1 koffðBtotal � ½B�Þ: (11)
2706 Matveev et al.
Biophysical Journal 86(5) 2691–2709

Let us now introduce the resting concentration of free buffer, Brest, in
equilibrium with the resting Ca21:
konCarestBrest ¼ koffðBtotal � BrestÞ: (12)
Brest ¼BtotalKD
Carest 1KD
; where KD ¼ koff
kon
: (13)
We can then express the reaction term as
R ¼� kon½B�ðCarest 1 ½Ca21�Þ1 koffðBtotal � BrestÞ1 koffðBrest � ½B�Þ: (14)
Using Eq. 12 to eliminate the second term in above expression, this yields
R¼� kon½B�ðCarest1 ½Ca21�Þ1konCarestBrest1koffðBrest �½B�Þ¼� kon½B�½Ca21�1ðkoff 1konCarestÞðBrest �½B�Þ:
(15)
Now, notice that the reaction term has the same form as in the Carest ¼ 0 case
(Eq. 11), except that Btotal has to be replaced with Brest (given by Eq. 13), and
koff has to be replaced with koff 1 kon Carest, which in turn implies that KD
has to be replaced with KD 1 Carest. Note that this parameter transformation
allows us to recover the expression for the rest-state buffering ratio k0 in the
nonzero Carest case (Eq. 6):
k0 ¼B#total
K#D¼ Brest
KD 1Carest
¼ BtotalKD
ðKD 1CarestÞ2 ; (16)
where the primed parameters correspond to the case of zero Carest. As
expected, the value of the buffering ratio is invariant with respect to this
parameter change.
Thus, to recover the dependence of facilitation on model parameters for
the case of nonzero Carest, the inverse of the above transformations has to be
applied to the parameter values in Figs. 2–13:
Btotal ¼B#total
1 � Carest=K#D;
koff ¼ k#off 1 � Carest
K#D
� �;
KD ¼ K#D � Carest; (17)
where K#D . Carest. Note that the value of kon remains unaltered by this
substitution. The condition K#D . Carest implies that the magnitude of Carest
imposes a constraint on the relevant range of values of K#D. Given a certain
value of Carest, one should ignore those parts of Figs. 3, 5, 6, and 13 that lie
in the region K#D , Carest. The transformations described by Eq. 17 will have
no effect on the results for the fixed buffer case (Fig. 9), because the value of
K#D is much greater than Carest in the relevant parameter range. In the mobile
buffer case, for the fixed-k0 plots showing the dependence of facilitation on
B#total (K#D) and kon (Figs. 5 and 6), these transformations involve a simple
shift to the left by the amount equal to Carest, after the abscissa values are
reinterpreted in terms of K#D instead of B#total. Note that the constant-
k0 proportionality relationship between KD and Btotal no longer holds in this
case, but is determined according to Eq. 6:
Btotal ¼ k0 KDð11Carest=KDÞ2: (18)
Assuming for example Carest ¼ 0.1 mM, the facilitation peak in Figs. 5 A and
6 Ab at fkon ¼ 1 m M�1 ms�1, B#total ¼ 400 mM, K#D ¼ 0.8 mMg corresponds
to fBtotal ¼ 457 mM, KD ¼ 0.7 mMg. In Fig. 3, where the values of B#total and
K#D (k#on) are independently varied, the transformation to the nonzero Carest
would involve a downward shift along the K#D axis by Carest, as well as
a nonhomogenous stretch to the right, shifting the facilitation peak to higher
values of Btotal. The latter shift in the Btotal direction is more significant for
lower values of K#D. Further, the value of koff will not remain constant
throughout panels A and B, due to its dependence on K#D (see Eq. 17). Thus,
the independence of facilitation on the value of koff in the mobile buffer case
(Fig. 3) is only approximate, holding for values of KD � Carest.
REFERENCES
Allbritton, N. L., T. Meyer, and L. Stryer. 1992. Range of messenger actionof calcium ion and inositol 1,4,5-trisphosphate. Science. 258:1812–1815.
Atluri, P. P., and W. G. Regehr. 1996. Determinants of the time course offacilitation at the granule cell to Purkinje cell synapse. J. Neurosci.16:5661–5671.
Atwood, H. L., and S. Karunanithi. 2002. Diversification of synapticstrength: presynaptic elements. Nat. Rev. Neurosci. 3:497–516.
Atwood, H. L., S. Karunanithi, J. Georgiou, and M. P. Charlton. 1997.Strength of synaptic transmission at neuromuscular junctions ofcrustaceans and insects in relation to calcium entry. Invert. Neurosci.3:81–87.
Bennett, M. R., W. G. Gibson, and J. Robinson. 1997. Probabilisticsecretion of quanta and the synaptosecretosome hypothesis: evokedrelease at active zones of varicosities, boutons, and endplates. Biophys. J.73:1815–1829.
Bennett, M. R., L. Farnell, and W. G. Gibson. 2000. The probability ofquantal secretion within an array of calcium channels of an active zone.Biophys. J. 78:2222–2240.
Bertram, R., A. Sherman, and E. Stanley. 1996. The single domain/boundcalcium hypothesis of transmitter release and facilitation. J. Neuro-physiol. 75:1919–1931.
Blatow, M., A. Caputi, N. Burnashev, H. Monyer, and A. Rozov. 2003.Ca21 buffer saturation underlies paired pulse facilitation in calbindin-D28k-containing terminals. Neuron. 38:79–88.
Blaustein, M. P., and W. J. Lederer. 1999. Sodium/calcium exchange: itsphysiological implications. Physiol. Rev. 79:763–854.
Bollmann, J. H., B. Sakmann, and J. G. Borst. 2000. Calcium sensitivity ofglutamate release in a calyx-type terminal. Science. 289:953–957.
Burrone, J., G. Neves, A. Gomis, A. Cooke, and L. Lagnado. 2002.Endogenous calcium buffers regulate fast exocytosis in the synapticterminal of retinal bipolar cells. Neuron. 33:101–112.
Carafoli, E. 1987. Intracellular calcium homeostasis. Annu. Rev. Biochem.56:395–433.
Catterall, W. A. 1999. Interactions of presynaptic Ca21 channels and snareproteins in neurotransmitter release. Ann. N. Y. Acad. Sci. 868:144–159.
Chad, J. E., and R. Eckert. 1984. Calcium domains associated withindividual channels can account for anomalous voltage relations ofCa-dependent responses. Biophys. J. 45:993–999.
Cooper, R. L., L. Marin, and H. L. Atwood. 1995. Synaptic differentiationof a single motor neuron: conjoint definition of transmitter release,presynaptic calcium signals, and ultrastructure. J. Neurosci. 15:4209–4222.
Cooper, R. L., J. L. Winslow, C. K. Govind, and H. L. Atwood. 1996.Synaptic structural complexity as a factor enhancing probability ofcalcium-mediated transmitter release. J. Neurophysiol. 75:2451–2466.
Delaney, K. R., and D. W. Tank. 1994. A quantitative measurement of thedependence of short-term synaptic enhancement on presynaptic residualcalcium. J. Neurosci. 14:5885–5902.
Dipolo, R., and L. Beauge. 1983. The calcium pump and sodium-calciumexchange in squid axons. Annu. Rev. Physiol. 45:313–324.
Dittman, J. S., A. C. Kreitzer, and W. G. Regehr. 2000. Interplay betweenfacilitation, depression, and residual calcium at three presynapticterminals. J. Neurosci. 20:1374–1385.
Felmy, F. E., E. Neher, and R. Schneggenburger. 2003. Probing theintracellular calcium sensitivity of transmitter release during synapticfacilitation. Neuron. 37:801–811.
Facilitation through Buffer Saturation 2707
Biophysical Journal 86(5) 2691–2709

Fisher, S. A., T. M. Fischer, and T. J. Carew. 1997. Multiple overlappingprocesses underlying short-term synaptic enhancement. Trends Neurosci.20:170–177.
Fisher, T. E., and C. W. Bourque. 2001. The function of Ca21 channelsubtypes in exocytotic secretion: new perspectives from synaptic andnon-synaptic release. Prog. Biophys. Mol. Biol. 77:269–303.
Fogelson, A. L., and R. S. Zucker. 1985. Presynaptic calcium diffusionfrom various arrays of single channels. Implications for transmitterrelease and synaptic facilitation. Biophys. J. 48:1003–1017.
Gabso, M., E. Neher, and M. E. Spira. 1997. Low mobility of the Ca21
buffers in axons of cultured Aplysia neurons. Neuron. 18:473–481.
Helmchen, F., J. G. Borst, and B. Sakmann. 1997. Calcium dynamicsassociated with a single action potential in a CNS presynaptic terminal.Biophys. J. 72:1458–1471.
Helmchen, F., K. Imoto, and B. Sakmann. 1996. Ca21 buffering and actionpotential-evoked Ca21 signaling in dendrites of pyramidal neurons.Biophys. J. 70:1069–1081.
Hines, M. 1984. Efficient computation of branched nerve equations. Int. J.Biomed. Comput. 15:69–76.
Irving, M., J. Maylie, N. L. Sizto, and W. K. Chandler. 1990. Intracellulardiffusion in the presence of mobile buffers. Application to protonmovement in muscle. Biophys. J. 57:717–721.
Jackson, M. B., and S. J. Redman. 2003. Calcium dynamics, buffering, andbuffer saturation in the boutons of dentate granule-cell axons in the hilus.J. Neurosci. 23:1612–1621.
Jarvis, S. E., and G. W. Zamponi. 2001. Interactions between presynapticCa21 channels, cytoplasmic messengers and proteins of the synapticvesicle release complex. Trends Pharmacol. Sci. 22:519–525.
Junge, W., and S. McLaughlin. 1987. The role of fixed and mobile buffersin the kinetics of proton movement. Biochim. Biophys. Acta. 890:1–5.
Katz, B., and R. Miledi. 1968. The role of calcium in neuromuscularfacilitation. J. Physiol. 195:481–492.
Keizer, J. 1987. Diffusion effects on rapid bimolecular chemical reactions.Chem. Rev. 87:167–180.
Klingauf, J., and E. Neher. 1997. Modeling buffered Ca21 diffusion nearthe membrane: implications for secretion in neuroendocrine cells.Biophys. J. 72:674–690.
Lando, L., and R. S. Zucker. 1994. Ca21 cooperativity in neurosecretionmeasured using photolabile Ca21 chelators. J. Neurophysiol. 72:825–830.
Lee, S. H., C. Rosenmund, B. Schwaller, and E. Neher. 2000. Differencesin Ca21 buffering properties between excitatory and inhibitoryhippocampal neurons from the rat. J. Physiol. 525:405–418.
Maeda, H., G. C. Ellis-Davies, K. Ito, Y. Miyashita, and H. Kasai. 1999.Supralinear Ca21 signaling by cooperative and mobile Ca21 buffering inPurkinje neurons. Neuron. 24:989–1002.
Magleby, K. L. 1987. Short-term changes in synaptic efficacy. In SynapticFunction. G. Edelman, W. Gall, and W. Cowan, editors. Wiley, NewYork. 21–56.
Matveev, V., A. Sherman, and R. S. Zucker. 2002. New and correctedsimulations of synaptic facilitation. Biophys. J. 83:1368–1373.
Meinrenken, C. J., J. G. Borst, and B. Sakmann. 2002. Calcium secretioncoupling at calyx of Held governed by nonuniform channel-vesicletopography. J. Neurosci. 22:1648–1667.
Morton, K. W., and D. F. Mayers. 1994. Numerical Solution of PartialDifferential Equations: An Introduction. University Press, Cambridge,UK.
Nagerl, U. V., D. Novo, I. Mody, and J. L. Vergara. 2000. Binding kineticsof calbindin-D(28k) determined by flash photolysis of caged Ca21.Biophys. J. 79:3009–3018.
Naraghi, M., and E. Neher. 1997. Linearized buffered Ca21 diffusion inmicrodomains and its implications for calculation of [Ca21] at the mouthof a calcium channel. J. Neurosci. 17:6961–6973.
Neher, E. 1998a. Usefulness and limitations of linear approximations to theunderstanding of Ca11 signals. Cell Calcium. 24:345–357.
Neher, E. 1998b. Vesicle pools and Ca21 microdomains: new tools forunderstanding their roles in neurotransmitter release. Neuron. 20:389–399.
Neher, E., and G. J. Augustine. 1992. Calcium gradients and buffers inbovine chromaffin cells. J. Physiol. 450:273–301.
Nowycky, M. C., and M. J. Pinter. 1993. Time courses of calcium andcalcium-bound buffers following calcium influx in a model cell. Biophys.J. 64:77–91.
Ohana, O., and B. Sakmann. 1998. Transmitter release modulation in nerveterminals of rat neocortical pyramidal cells by intracellular calciumbuffers. J. Physiol. 513:135–148.
Ohnuma, K., M. D. Whim, R. D. Fetter, L. K. Kaczmarek, and R. S.Zucker. 2001. Presynaptic target of Ca21 action on neuropeptide andacetylcholine release in Aplysia californica. J. Physiol. 535:647–662.
Pape, P. C., D.-S. Jong, and W. K. Chandler. 1998. Effects of partialsarcoplasmic reticulum calcium depletion on calcium release in frog cutmuscle fibers equilibrated with 20 mM EGTA. J. Gen. Physiol. 112:263–295.
Rahamimoff, R. 1968. A dual effect of calcium ions on neuromuscularfacilitation. J. Physiol. 195:471–480.
Ravin, R., H. Parnas, M. E. Spira, N. Volfovsky, and I. Parnas. 1999.Simultaneous measurement of evoked release and [Ca21]i in a crayfishrelease bouton reveals high affinity of release to Ca21. J. Neurophysiol.81:634–642.
Regehr, W. G., K. R. Delaney, and D. W. Tank. 1994. The role presynapticcalcium in short-term enhancement at the hippocampal mossy fibersynapse. J. Neurosci. 14:523–537.
Roberts, W. M. 1993. Spatial calcium buffering in saccular hair cells.Nature. 363:74–76.
Roberts, W. M. 1994. Localization of calcium signals by a mobile calciumbuffer in frog saccular hair cells. J. Neurosci. 14:3246–3262.
Robitaille, R., and M. P. Charlton. 1991. Frequency facilitation is notcaused by residual ionized calcium at the frog neuromuscular junction.Ann. N. Y. Acad. Sci. 635:492–494.
Rozov, A., N. Burnashev, B. Sakmann, and E. Neher. 2001. Transmitterrelease modulation by intracellular Ca21 buffers in facilitating anddepressing nerve terminals of pyramidal cells in layer 2/3 of the ratneocortex indicates a target cell-specific difference in presynapticcalcium dynamics. J. Physiol. 531:807–826.
Sala, F., and A. Hernandez-Cruz. 1990. Calcium diffusion modeling ina spherical neuron. Relevance of buffering properties. Biophys. J. 57:313–324.
Satzler, K., L. F. Sohl, J. H. Bollmann, J. G. Borst, M. Frotscher, B.Sakmann, and J. H. Lubke. 2002. Three-dimensional reconstruction ofa calyx of Held and its postsynaptic principal neuron in the medialnucleus of the trapezoid body. J. Neurosci. 22:10567–10579.
Schneggenburger, R., and E. Neher. 2000. Intracellular calcium dependenceof transmitter release rates at a fast central synapse. Nature. 406:889–893.
Sheng, Z. H., R. E. Westenbroek, and W. A. Catterall. 1998. Physical linkand functional coupling of presynaptic calcium channels and the synapticvesicle docking/fusion machinery. J. Bioenerg. Biomembr. 30:335–345.
Simon, S. M., and R. R. Llinas. 1985. Compartmentalization of thesubmembrane calcium activity during calcium influx and its significancein transmitter release. Biophys. J. 48:485–498.
Smith, G. D., L.-X. Dai, R. Miura, and A. Sherman. 2001. Asymptoticanalysis of equations for the buffered diffusion of intracellular calcium.SIAM J. Applied Math. 61:1816–1838.
Smith, G. D., J. Wagner, and J. Keizer. 1996. Validity of the rapid bufferingapproximation near a point source of calcium ions. Biophys. J. 70:2527–2539.
Stanley, E. F. 1997. The calcium channel and the organization of thepresynaptic transmitter release face. Trends Neurosci. 20:404–409.
2708 Matveev et al.
Biophysical Journal 86(5) 2691–2709

Tang, Y., T. Schlumpberger, T. Kim, M. Lueker, and R. S. Zucker. 2000.Effects of mobile buffers on facilitation: experimental and computationalstudies. Biophys. J. 78:2735–2751.
Tank, D. W., W. G. Regehr, and K. R. Delaney. 1995. A quantitativeanalysis of presynaptic calcium dynamics that contribute to short-termenhancement. J. Neurosci. 15:7940–7952.
Trommershauser, J., R. Schneggenburger, A. Zippelius, and E. Neher.2003. Heterogeneous presynaptic release probabilities: functionalrelevance for short-term plasticity. Biophys. J. 84:1563–1579.
Vyshedskiy, A., and J.-W. Lin. 1997. Activation and detection offacilitation as studied by presynaptic voltage control at the inhibitor ofthe crayfish opener muscle. J. Neurophysiol. 77:2300–2315.
Vyshedskiy, A., and J.-W. Lin. 2000. Presynaptic Ca21 influx at theinhibitor of the crayfish neuromuscular junction: a photometric study ata high time resolution. J. Neurophysiol. 83:552–562.
Winslow, J. L., S. N. Duffy, and M. P. Charlton. 1994. Homosynapticfacilitation of transmitter release in crayfish is not affected by mobilecalcium chelators: implications for the residual ionized calciumhypothesis from electrophysiological and computational analyses.J. Neurophysiol. 72:1769–1793.
Wright, S. N., M. S. Brodwick, and G. D. Bittner. 1996. Calcium currents,transmitter release and facilitation of release at voltage-clamped crayfishnerve terminals. J. Physiol. 496:363–378.
Xu, T., M. Naraghi, H. Kang, and E. Neher. 1997. Kinetic studies of Ca21
binding and Ca21 clearance in the cytosol of adrenal chromaffin cells.Biophys. J. 73:532–545.
Yamada, W. M., and R. S. Zucker. 1992. Time course of transmitter releasecalculated from simulations of a calcium diffusion model. Biophys. J.61:671–682.
Zhou, Z., and E. Neher. 1993. Mobile and immobile calcium buffers inbovine adrenal chromaffin cells. J. Physiol. 469:245–273.
Zucker, R. S. 1974. Characteristics of crayfish neuromuscular facilitationand their calcium dependence. J. Physiol. 241:91–110.
Zucker, R. S. 1994. Calcium and short-term synaptic plasticity. Neth. J.Zool. 44:495–512.
Zucker, R. S. 1996. Exocytosis: a molecular and physiological perspective.Neuron. 17:1049–1055.
Zucker, R. S. 1999. Calcium- and activity-dependent synaptic plasticity.Curr. Opin. Neurobiol. 9:305–313.
Zucker, R. S., and W. G. Regehr. 2002. Short-term synaptic plasticity.Annu. Rev. Physiol. 64:355–405.
Facilitation through Buffer Saturation 2709
Biophysical Journal 86(5) 2691–2709