Embed Size (px)
Citation preview
toronto.ca/budget2017
OPERATING PROGRAM SUMMARY
Facilities, Real Estate, Environment & Energy 2017 OPERATING BUDGET OVERVIEW
Facilities, Real Estate, Environment & Energy (FREEE) work across
the City with clients and stakeholders to deliver a comprehensive range
of facility management, real estate services and sustainability
programs in an efficient and effective manner that maximizes the City's
property assets and delivers service excellence.
2017 Operating Budget Highlights
The total cost to deliver these services to Toronto residents is
$194.980 million gross and $67.890 million net as shown below:
Through operational efficiencies and increased leasing revenues, the
Program is able to fully offset $2.523 million in operating budget
pressures arising mainly from inflation in utilities and increases for staff
salaries and benefits while maintaining 2016 service levels for 2017.
$ %
Gross Expenditures 194,264.4 194,979.5 715.1 0.4%
Revenues 124,938.7 127,089.8 2,151.1 1.7%
Net Expenditures 69,325.7 67,889.7 (1,436.0) (2.1%)
(in $000's) Change2017
Budget
2016
Budget
CONTENTS
Overview
1: 2017 – 2019 Service Overview and Plan 5
2: 2017 Operating Budget by Service 15
3: Issues for Discussion 25 Appendices:
1. 2016 Performance 33
2. 2017 Operating Budget by Expenditure Category 34
3. 2017 Organization Chart 35
4. Summary of 2017 Service Changes 36
5. Summary of 2017 New & Enhanced Service Priorities 37
6. Inflows/Outflows to / from Reserves & Reserve Funds 38
7. 2017 User Fee Rate Changes 42
2017 Operating Budget FREEE
toronto.ca/budget2017 Page 2
Fast Facts
Manage over 9.6 million square feet of City-owned
and operated facilities.
Facilities Management complete approximately
45,000 building maintenance work orders annually
for City-owned facilities.
Real Estate Services manage over 5,700 properties
and 26.5 million square feet of building space in an
Asset Portfolio worth $12 billion and manage 1,000+
leases in the portfolio generating over $48 million in
annual lease revenues.
Environment & Energy manages all aspects of
energy supply and consumption on behalf of City
divisions, monitoring 3,500 energy accounts with a
total utilities budget in excess of $30 million.
Trends
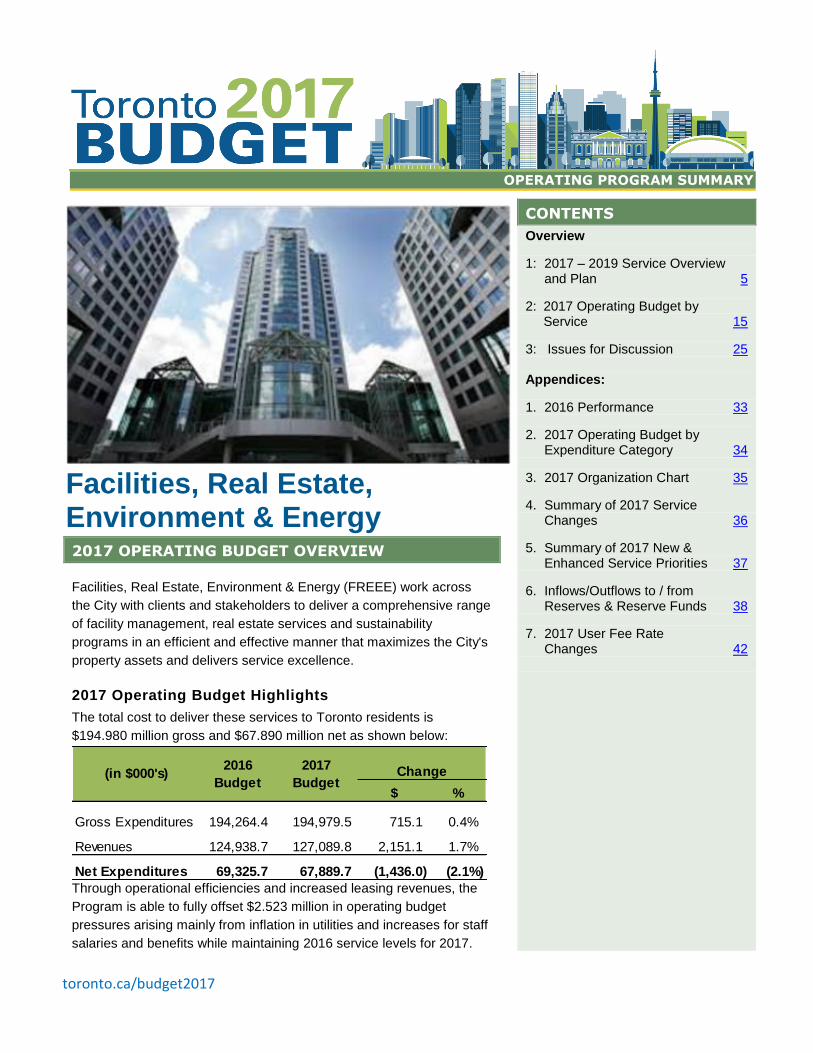
Facilities Management strives to operate efficiently
to maintain a square foot cost allocation that reflects
good value for money in a municipal setting.
The cost/square foot includes custodial, building
repairs & maintenance, security and utilities costs.
Costs have stabilized from the use of a mixed
service model for custodial and maintenance
services, emphasizing a preventive maintenance
plan and realizing energy efficiencies.
Although the division has experienced cost
pressures from economic factors, a number of
efficiency measures have been identified which will
allow the division to maintain the cost/square foot at
the 2016 projected actual level.
Key Service Deliverables for 2017
Facilities, Real Estate, Environment & Energy
protects, maintains and maximizes the City's
investment in its public buildings and real
property.
The 2017 Operating Budget will enable FREEE
to continue to:
Maintain City facilities in a clean, safe, and
accessible manner as per Council approved
maintenance standards.
Ensure the City's property portfolio is
optimal and meets program requirements.
Develop an organizational structure that
optimizes preventative and demand
maintenance with state-of-good-repair plans
and maximizes project delivery.
Reduce energy demand and greenhouse
gases and increase use of renewable
energy technologies and clean energy
generation.
Invest in the growth and development of
staff through talent management, leadership
development, succession planning,
mentorship programs, and by creating a
healthy and positive work space.
Maximize lease revenues by negotiating
optimal leasing arrangements.
Conduct a City-wide Real Estate review to
better coordinate real estate portfolios
across City Divisions, Agencies and
Corporations in order to centralize inventory,
improve service delivery and find operational
efficiencies.
2014Actual
2015Actual
2016Proj
Actual
2017Target
2018Plan
2019Plan
Series1 $12.90 $12.71 $12.91 $12.91 $12.91 $12.91
$10.00
$10.50
$11.00
$11.50
$12.00
$12.50
$13.00
$13.50
$14.00
$14.50
$15.00
Building Operating & Maintenance Cost per rentable sq.ft.
2017 Operating Budget FREEE
toronto.ca/budget2017 Page 3
Our Key Issues & Priority Actions
Improving Resilience to high impact extreme
weather events and ability to mitigate potential
damages and disruption to City Programs and
Agencies.
Two positions were filled in 2015 that are
actively engaged in addressing City
Council's directives on climate change
mitigation and adaptation and the Climate
Change Risk Management Policy. Staff
reports to City Council are planned for the
end of 2016.
Unlocking the Value of the City's real estate
portfolio and maximizing the use of City-owned
space while meeting client program requirements.
Act on opportunities through detailed
review, market research and analysis by
qualified staff to ensure City's Real Estate
portfolio meets the needs of City Programs
and Agencies.
Coordination of preventative maintenance,
SOGR and energy retrofit projects to ensure
minimal impact and the most cost efficient.
The operating impact resulting from the
investment in SAP facilities maintenance
functionality will automate core business
processes related to facility work orders,
scheduled preventative maintenance and
inventory management, while interfacing
with state of good repair plans.
2017 Operating Budget Highlights
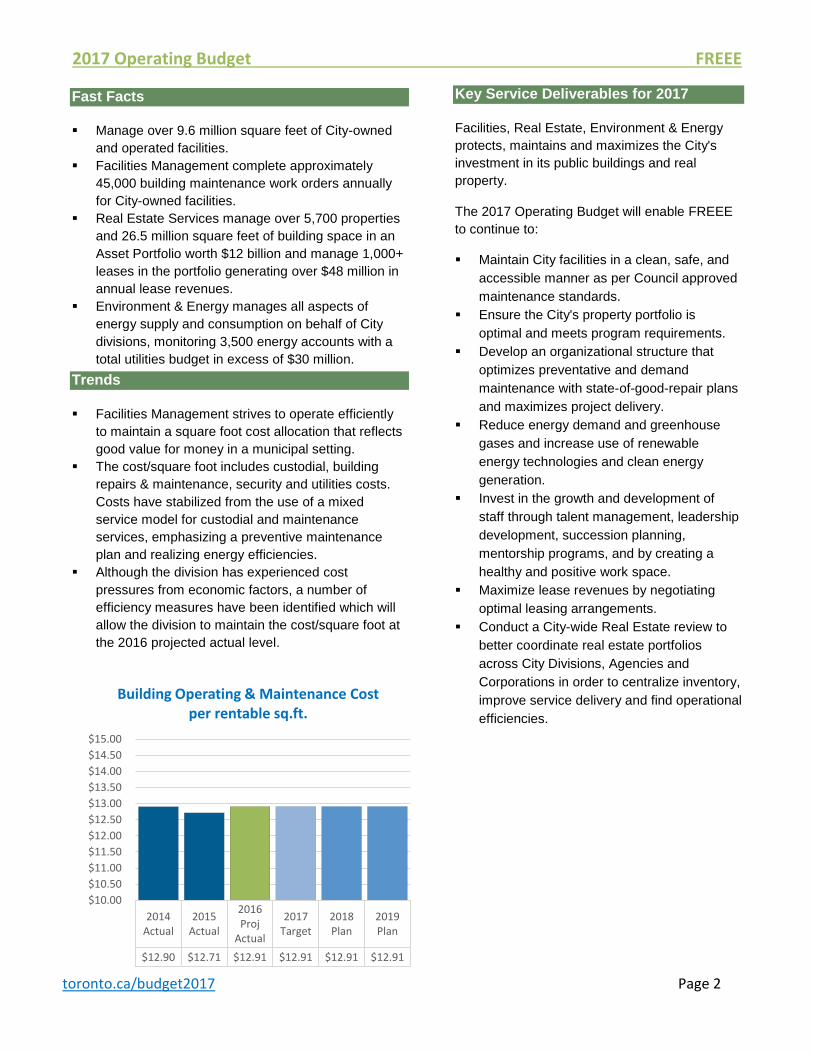
The 2017 Operating Budget for FREEE of
$194.980 million in gross expenditures provides
funding for three services: Facilities
Management, Real Estate and Environment &
Energy.
The Program has achieved a budget reduction of
-2.1% from the 2016 Approved Budget due to the
following measures:
Efficiency savings ($2.375 million)
Increased leasing revenues ($1.891 million)
Inflation user fee increases ($0.027 million)
2016 Service Levels will be maintained.
Where the money comes from:
Interdivisional Recoveries, $49.7 , 25%
Provincial/Federal Subsidies, $0.5 , 0%
User Fees & Donations, $44.4 , 23%
Transfer from Capital Fund,
$9.7 , 5%
Contribution from Reserve/Reserve
Funds, $15.6 , 8%
Sundry & Other Revenues, $7.4 , 4%
Property Tax, $67.9 , 35%
Where the money goes:
Salaries & Benefits,
$95.3 , 49%
Materials & Supplies,
$34.7 , 18%
Equipment, $0.6 , 0%
Services & Rents, $54.0 ,
28%
Contribution to Reserve\Reserve Funds, $2.2 , 1%
Other Expenditures,
$6.2 , 3%Interdivisional
Charges, $1.8 , 1%
2017 Budget by Expenditure Category
$195.0 Million
Facilities Management, $120.0 , 61%
Real Estate, $28.6 , 15%
Environment & Energy,
$46.4 , 24%
2017 Budget by Service
$195.0
Million
$195.0
Million
2017 Operating Budget FREEE
toronto.ca/budget2017 Page 4
Council Approved Budget
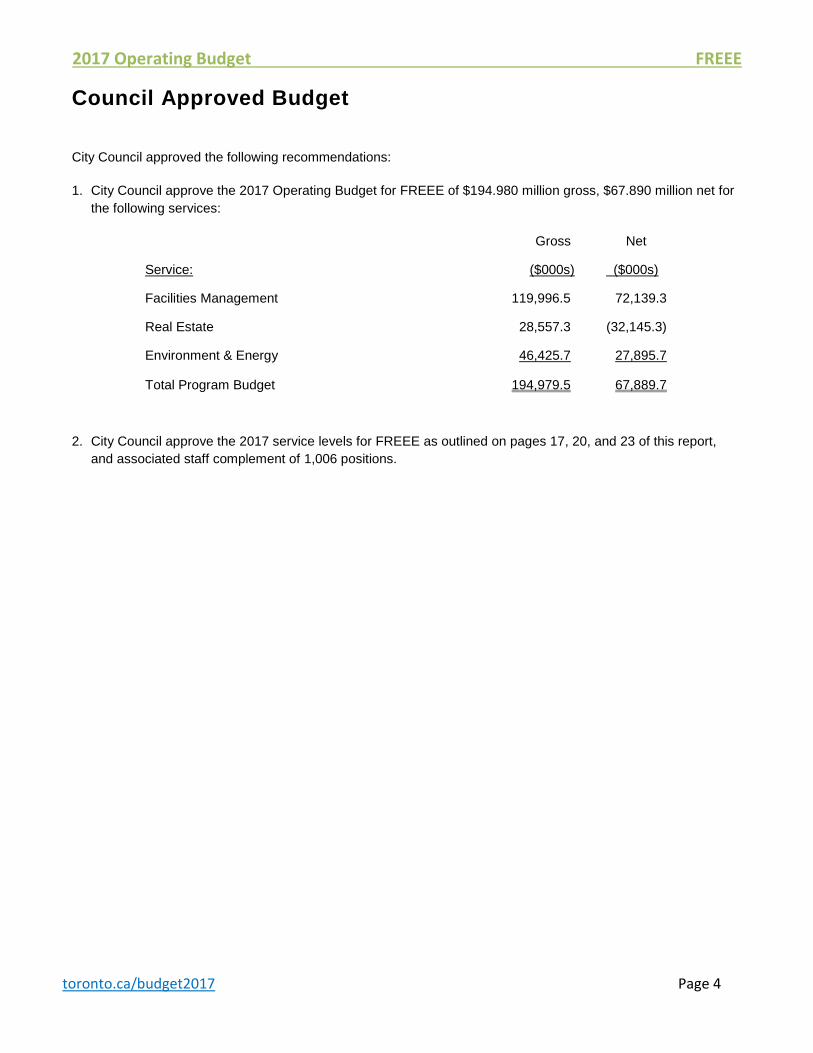
City Council approved the following recommendations:
1. City Council approve the 2017 Operating Budget for FREEE of $194.980 million gross, $67.890 million net for
the following services:
2. City Council approve the 2017 service levels for FREEE as outlined on pages 17, 20, and 23 of this report,
and associated staff complement of 1,006 positions.
Service:
Gross
($000s)
Net
($000s)
Facilities Management
Real Estate
Environment & Energy
119,996.5
28,557.3
46,425.7
72,139.3
(32,145.3)
27,895.7
Total Program Budget 194,979.5 67,889.7
2017 Operating Budget FREEE
toronto.ca/budget2017 Page 5
Part 1: 2017-2019 Service Overview and Plan
2017 Operating Budget FREEE
toronto.ca/budget2017 Page 6
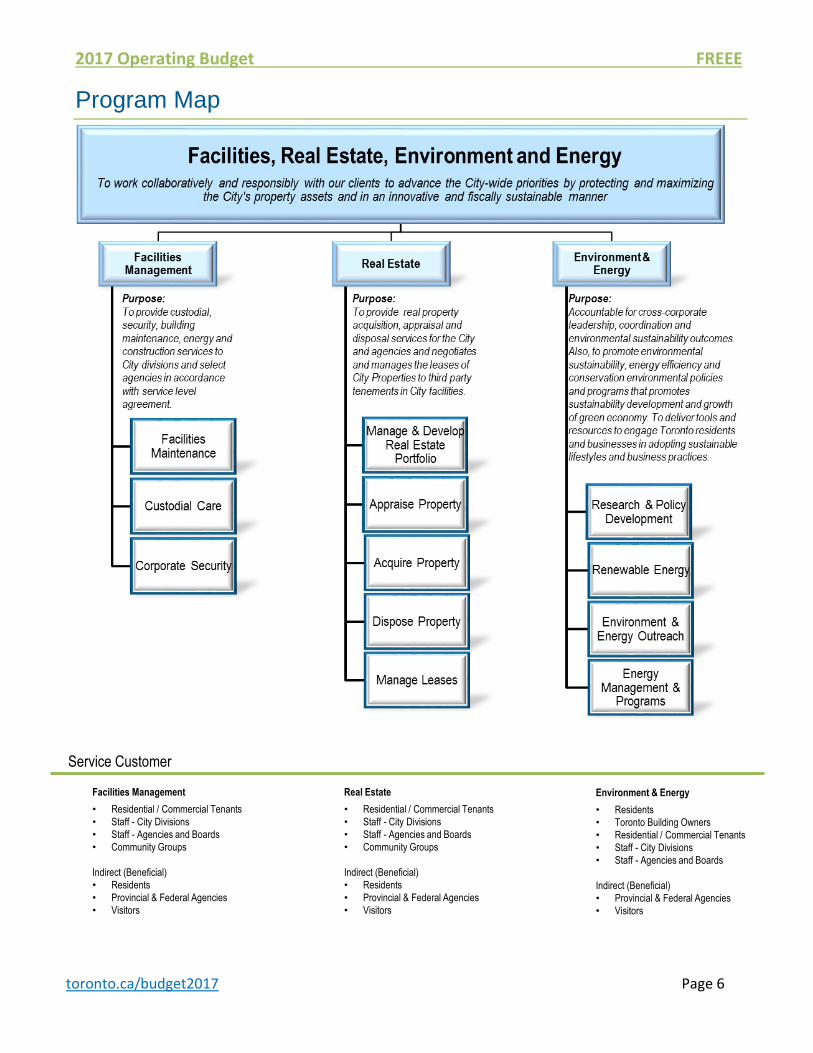
Program Map
Facilities Management
• Residential / Commercial Tenants
• Staff - City Divisions
• Staff - Agencies and Boards
• Community Groups
Indirect (Beneficial)
• Residents
• Provincial & Federal Agencies
• Visitors
Environment & Energy
• Residents
• Toronto Building Owners
• Residential / Commercial Tenants
• Staff - City Divisions
• Staff - Agencies and Boards
Indirect (Beneficial)
• Provincial & Federal Agencies
• Visitors
Service Customer
Real Estate
• Residential / Commercial Tenants
• Staff - City Divisions
• Staff - Agencies and Boards
• Community Groups
Indirect (Beneficial)
• Residents
• Provincial & Federal Agencies
• Visitors
2017 Operating Budget FREEE
toronto.ca/budget2017 Page 7
Table 1
2017 Operating Budget and Plan by Service
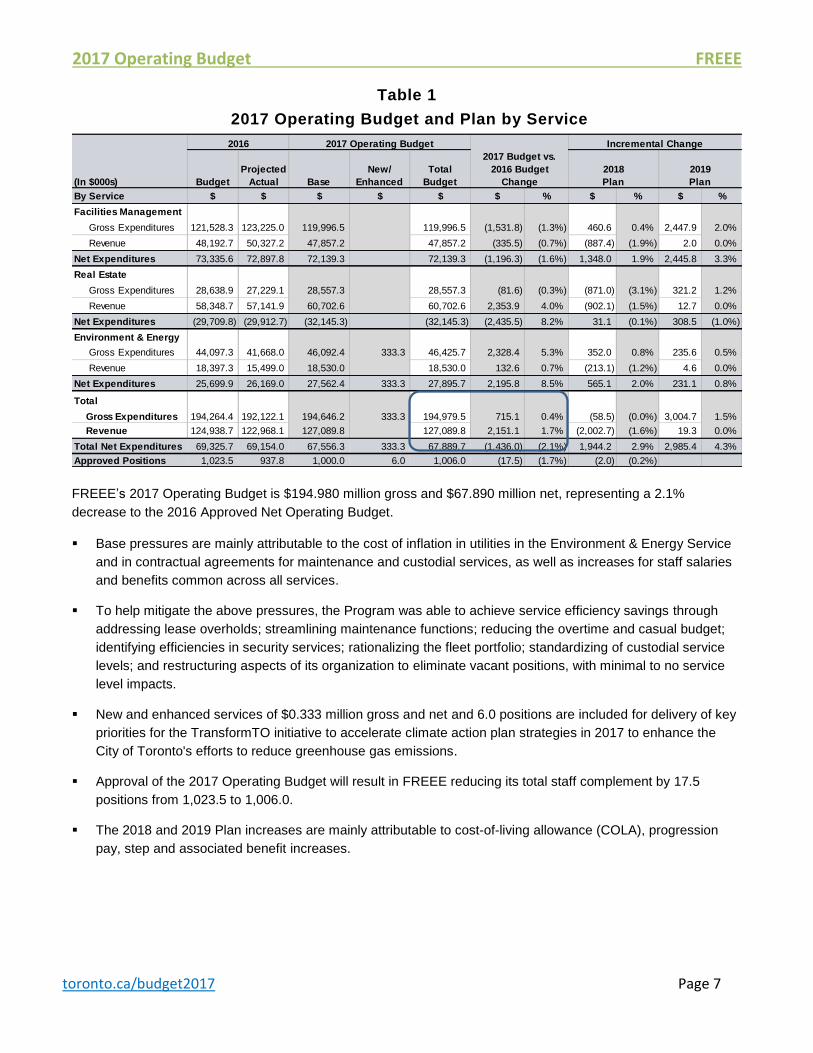
FREEE’s 2017 Operating Budget is $194.980 million gross and $67.890 million net, representing a 2.1%
decrease to the 2016 Approved Net Operating Budget.
Base pressures are mainly attributable to the cost of inflation in utilities in the Environment & Energy Service
and in contractual agreements for maintenance and custodial services, as well as increases for staff salaries
and benefits common across all services.
To help mitigate the above pressures, the Program was able to achieve service efficiency savings through
addressing lease overholds; streamlining maintenance functions; reducing the overtime and casual budget;
identifying efficiencies in security services; rationalizing the fleet portfolio; standardizing of custodial service
levels; and restructuring aspects of its organization to eliminate vacant positions, with minimal to no service
level impacts.
New and enhanced services of $0.333 million gross and net and 6.0 positions are included for delivery of key
priorities for the TransformTO initiative to accelerate climate action plan strategies in 2017 to enhance the
City of Toronto's efforts to reduce greenhouse gas emissions.
Approval of the 2017 Operating Budget will result in FREEE reducing its total staff complement by 17.5
positions from 1,023.5 to 1,006.0.
The 2018 and 2019 Plan increases are mainly attributable to cost-of-living allowance (COLA), progression
pay, step and associated benefit increases.
Incremental Change
(In $000s) Budget
Projected
Actual Base
New/
Enhanced
Total
Budget
By Service $ $ $ $ $ $ % $ % $ %
Facilities Management
Gross Expenditures 121,528.3 123,225.0 119,996.5 119,996.5 (1,531.8) (1.3%) 460.6 0.4% 2,447.9 2.0%
Revenue 48,192.7 50,327.2 47,857.2 47,857.2 (335.5) (0.7%) (887.4) (1.9%) 2.0 0.0%
Net Expenditures 73,335.6 72,897.8 72,139.3 72,139.3 (1,196.3) (1.6%) 1,348.0 1.9% 2,445.8 3.3%
Real Estate
Gross Expenditures 28,638.9 27,229.1 28,557.3 28,557.3 (81.6) (0.3%) (871.0) (3.1%) 321.2 1.2%
Revenue 58,348.7 57,141.9 60,702.6 60,702.6 2,353.9 4.0% (902.1) (1.5%) 12.7 0.0%
Net Expenditures (29,709.8) (29,912.7) (32,145.3) (32,145.3) (2,435.5) 8.2% 31.1 (0.1%) 308.5 (1.0%)
Environment & Energy
Gross Expenditures 44,097.3 41,668.0 46,092.4 333.3 46,425.7 2,328.4 5.3% 352.0 0.8% 235.6 0.5%
Revenue 18,397.3 15,499.0 18,530.0 18,530.0 132.6 0.7% (213.1) (1.2%) 4.6 0.0%
Net Expenditures 25,699.9 26,169.0 27,562.4 333.3 27,895.7 2,195.8 8.5% 565.1 2.0% 231.1 0.8%
Total
Gross Expenditures 194,264.4 192,122.1 194,646.2 333.3 194,979.5 715.1 0.4% (58.5) (0.0%) 3,004.7 1.5%
Revenue 124,938.7 122,968.1 127,089.8 127,089.8 2,151.1 1.7% (2,002.7) (1.6%) 19.3 0.0%
Total Net Expenditures 69,325.7 69,154.0 67,556.3 333.3 67,889.7 (1,436.0) (2.1%) 1,944.2 2.9% 2,985.4 4.3%
Approved Positions 1,023.5 937.8 1,000.0 6.0 1,006.0 (17.5) (1.7%) (2.0) (0.2%)
2016 2017 Operating Budget
2017 Budget vs.
2016 Budget
Change
2018
Plan
2019
Plan
2017 Operating Budget FREEE
toronto.ca/budget2017 Page 8
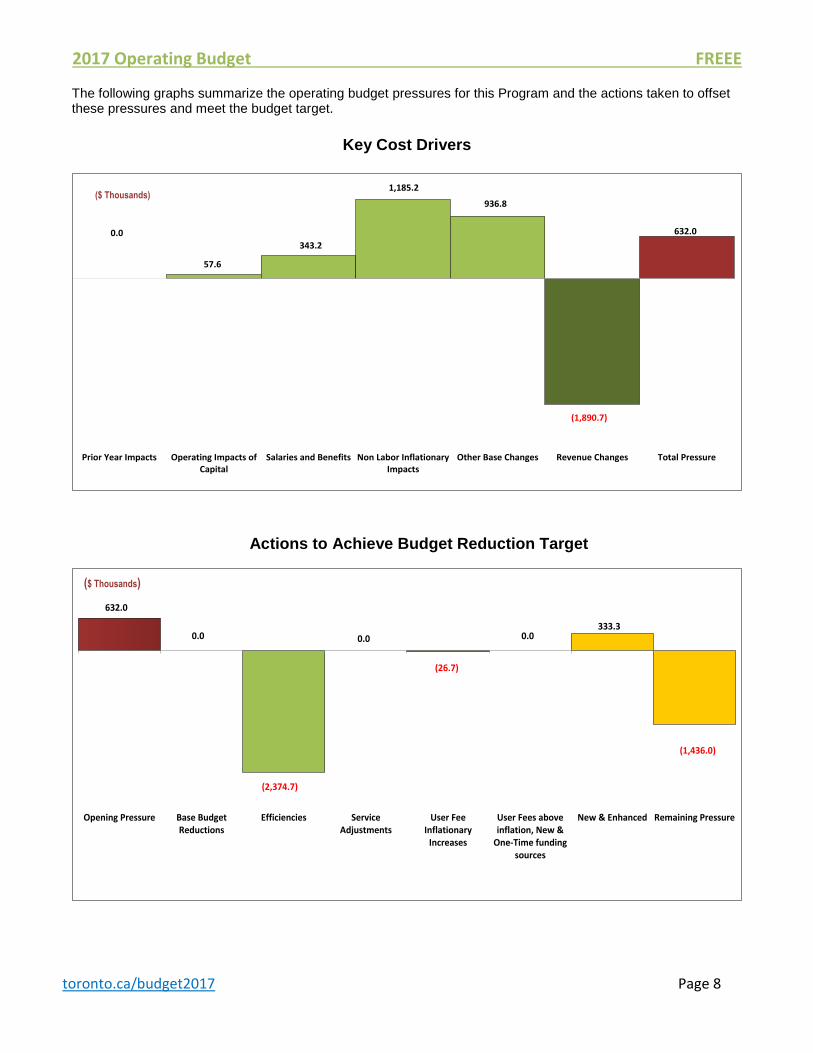
The following graphs summarize the operating budget pressures for this Program and the actions taken to offset these pressures and meet the budget target.
Key Cost Drivers
Actions to Achieve Budget Reduction Target
0.0
57.6
343.2
1,185.2
936.8
(1,890.7)
632.0
Prior Year Impacts Operating Impacts ofCapital
Salaries and Benefits Non Labor InflationaryImpacts
Other Base Changes Revenue Changes Total Pressure
($ Thousands)
632.0
0.0
(2,374.7)
0.0
(26.7)
0.0333.3
(1,436.0)
Opening Pressure Base BudgetReductions
Efficiencies ServiceAdjustments
User FeeInflationary
Increases
User Fees aboveinflation, New &
One-Time fundingsources
New & Enhanced Remaining Pressure
($ Thousands)
2017 Operating Budget FREEE
toronto.ca/budget2017 Page 9
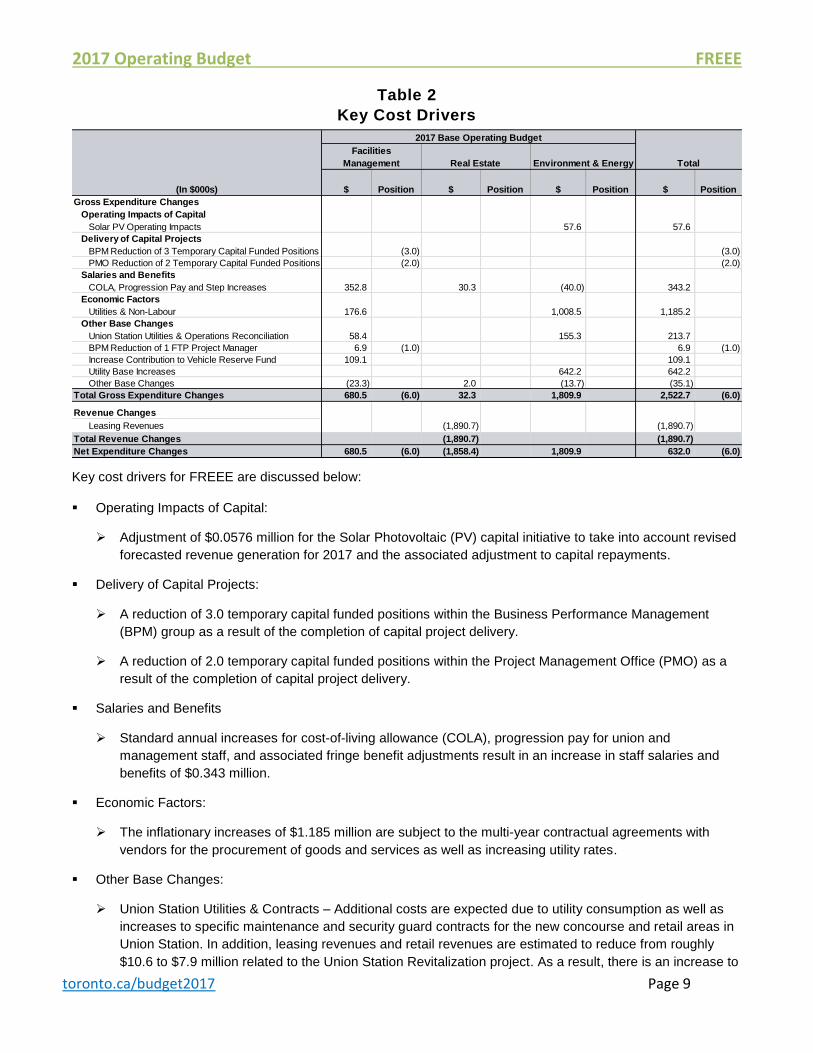
Table 2
Key Cost Drivers
Key cost drivers for FREEE are discussed below:
Operating Impacts of Capital:
Adjustment of $0.0576 million for the Solar Photovoltaic (PV) capital initiative to take into account revised
forecasted revenue generation for 2017 and the associated adjustment to capital repayments.
Delivery of Capital Projects:
A reduction of 3.0 temporary capital funded positions within the Business Performance Management
(BPM) group as a result of the completion of capital project delivery.
A reduction of 2.0 temporary capital funded positions within the Project Management Office (PMO) as a
result of the completion of capital project delivery.
Salaries and Benefits
Standard annual increases for cost-of-living allowance (COLA), progression pay for union and
management staff, and associated fringe benefit adjustments result in an increase in staff salaries and
benefits of $0.343 million.
Economic Factors:
The inflationary increases of $1.185 million are subject to the multi-year contractual agreements with
vendors for the procurement of goods and services as well as increasing utility rates.
Other Base Changes:
Union Station Utilities & Contracts – Additional costs are expected due to utility consumption as well as
increases to specific maintenance and security guard contracts for the new concourse and retail areas in
Union Station. In addition, leasing revenues and retail revenues are estimated to reduce from roughly
$10.6 to $7.9 million related to the Union Station Revitalization project. As a result, there is an increase to
(In $000s) $ Position $ Position $ Position $ Position
Gross Expenditure Changes
Operating Impacts of Capital
Solar PV Operating Impacts 57.6 57.6
Delivery of Capital Projects
BPM Reduction of 3 Temporary Capital Funded Positions (3.0) (3.0)
PMO Reduction of 2 Temporary Capital Funded Positions (2.0) (2.0)
Salaries and Benefits
COLA, Progression Pay and Step Increases 352.8 30.3 (40.0) 343.2
Economic Factors
Utilities & Non-Labour 176.6 1,008.5 1,185.2
Other Base Changes
Union Station Utilities & Operations Reconciliation 58.4 155.3 213.7
BPM Reduction of 1 FTP Project Manager 6.9 (1.0) 6.9 (1.0)
Increase Contribution to Vehicle Reserve Fund 109.1 109.1
Utility Base Increases 642.2 642.2
Other Base Changes (23.3) 2.0 (13.7) (35.1)
Total Gross Expenditure Changes 680.5 (6.0) 32.3 1,809.9 2,522.7 (6.0)
Revenue Changes
Leasing Revenues (1,890.7) (1,890.7)
Total Revenue Changes (1,890.7) (1,890.7)
Net Expenditure Changes 680.5 (6.0) (1,858.4) 1,809.9 632.0 (6.0)
Total
Facilities
Management Real Estate Environment & Energy
2017 Base Operating Budget
2017 Operating Budget FREEE
toronto.ca/budget2017 Page 10
withdrawals from the Union Station reserve to offset the revenue shortfall. The expectation is for revenues
to ramp back up in 2018 once the project is completed and retail outlets are fully operational, which will
replenish the reserve.
Business Performance Management (BPM) reduction of 1.0 temporary, vacant Project Manager, Facilities
Transformation Project (FTP) position that is no longer required within the BPM team. As a part of the
FTP restructure and review of all positions, it was ascertained the tasks and responsibilities associated
with this position could be executed utilizing existing resources within the BPM group.
Contribution to Vehicle Reserve – increase in contributions made for future replacements of vehicles.
Utility Base Increases - Budget increases for non-recoverable facility locations to ensure budget levels
reflect actual usage at these facilities.
Revenue Changes:
Leasing Revenues will increase by $1.891 million to take into account the arbitration decision for 2 Bloor
Street East for annual rent of $4.2 million. The 2017 Operating Budget takes into account $1.710 million
in rent. In addition, a 10% increase was negotiated on leases coming due in 2016 to realize additional
revenues of $0.138 million on the City's lease portfolio.
In order to achieve the budget reduction target, the 2017 service changes for FREEE consists of base revenue
changes of $0.027 million net, service efficiency savings of $2.375 million net and service adjustments within the
Program's current service levels of $0.850 million gross and $0 net, for a total of $2.401 million net as detailed on
following page.
2017 Operating Budget FREEE
toronto.ca/budget2017 Page 11
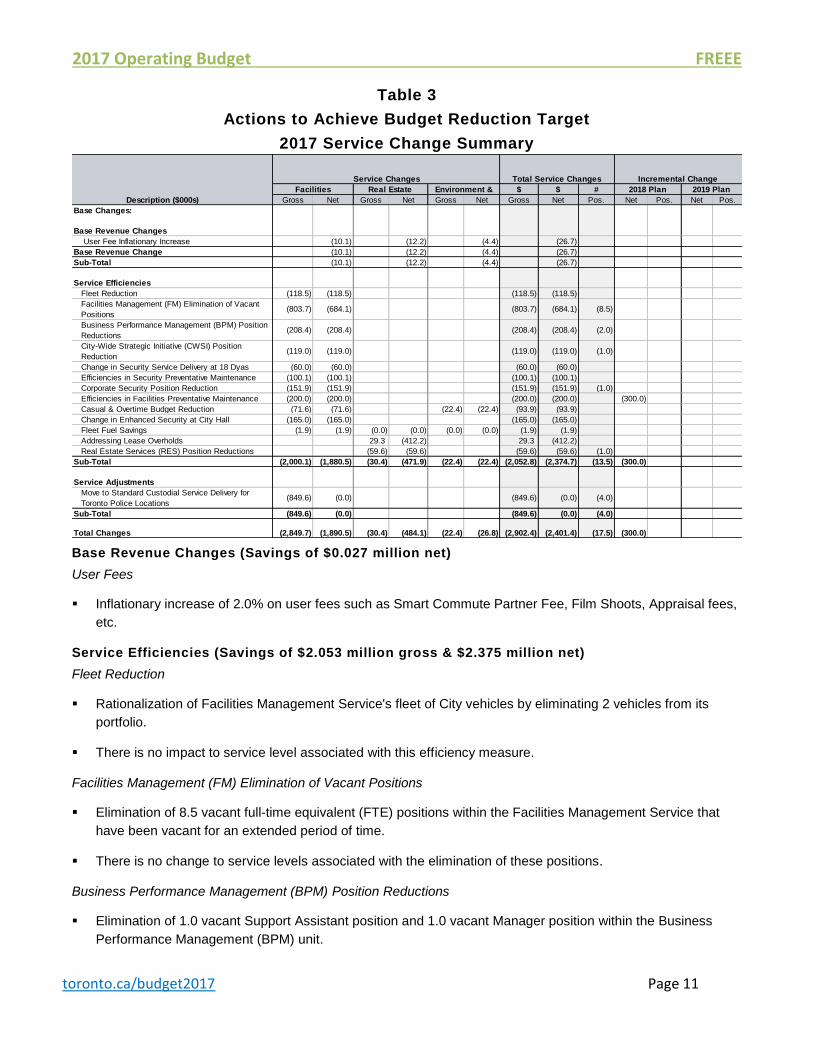
Table 3
Actions to Achieve Budget Reduction Target
2017 Service Change Summary
Base Revenue Changes (Savings of $0.027 million net)
User Fees
Inflationary increase of 2.0% on user fees such as Smart Commute Partner Fee, Film Shoots, Appraisal fees,
etc.
Service Efficiencies (Savings of $2.053 million gross & $2.375 million net)
Fleet Reduction
Rationalization of Facilities Management Service's fleet of City vehicles by eliminating 2 vehicles from its
portfolio.
There is no impact to service level associated with this efficiency measure.
Facilities Management (FM) Elimination of Vacant Positions
Elimination of 8.5 vacant full-time equivalent (FTE) positions within the Facilities Management Service that
have been vacant for an extended period of time.
There is no change to service levels associated with the elimination of these positions.
Business Performance Management (BPM) Position Reductions
Elimination of 1.0 vacant Support Assistant position and 1.0 vacant Manager position within the Business
Performance Management (BPM) unit.
$ $ #
Gross Net Gross Net Gross Net Gross Net Pos. Net Pos. Net Pos.
Base Changes:
Base Revenue Changes
User Fee Inflationary Increase (10.1) (12.2) (4.4) (26.7)
Base Revenue Change (10.1) (12.2) (4.4) (26.7)
Sub-Total (10.1) (12.2) (4.4) (26.7)
Service Efficiencies
Fleet Reduction (118.5) (118.5) (118.5) (118.5)
Facilities Management (FM) Elimination of Vacant
Positions(803.7) (684.1) (803.7) (684.1) (8.5)
Business Performance Management (BPM) Position
Reductions(208.4) (208.4) (208.4) (208.4) (2.0)
City-Wide Strategic Initiative (CWSI) Position
Reduction(119.0) (119.0) (119.0) (119.0) (1.0)
Change in Security Service Delivery at 18 Dyas (60.0) (60.0) (60.0) (60.0)
Efficiencies in Security Preventative Maintenance (100.1) (100.1) (100.1) (100.1)
Corporate Security Position Reduction (151.9) (151.9) (151.9) (151.9) (1.0)
Efficiencies in Facilities Preventative Maintenance (200.0) (200.0) (200.0) (200.0) (300.0)
Casual & Overtime Budget Reduction (71.6) (71.6) (22.4) (22.4) (93.9) (93.9)
Change in Enhanced Security at City Hall (165.0) (165.0) (165.0) (165.0)
Fleet Fuel Savings (1.9) (1.9) (0.0) (0.0) (0.0) (0.0) (1.9) (1.9)
Addressing Lease Overholds 29.3 (412.2) 29.3 (412.2)
Real Estate Services (RES) Position Reductions (59.6) (59.6) (59.6) (59.6) (1.0)
Sub-Total (2,000.1) (1,880.5) (30.4) (471.9) (22.4) (22.4) (2,052.8) (2,374.7) (13.5) (300.0)
Service Adjustments
Move to Standard Custodial Service Delivery for
Toronto Police Locations(849.6) (0.0) (849.6) (0.0) (4.0)
Sub-Total (849.6) (0.0) (849.6) (0.0) (4.0)
Total Changes (2,849.7) (1,890.5) (30.4) (484.1) (22.4) (26.8) (2,902.4) (2,401.4) (17.5) (300.0)
2018 Plan 2019 Plan
Service Changes Total Service Changes
Description ($000s)
Facilities Real Estate Environment &
Incremental Change
2017 Operating Budget FREEE
toronto.ca/budget2017 Page 12
There is no change to service level associated with the elimination of these positions.
City-Wide Strategic Initiative (CWSI) Position Reduction
Elimination of 1.0 vacant Supervisor position within the City-Wide Strategic Initiatives team.
There is no change to service level associated with the elimination of this position.
Change in Security Service Delivery at 18 Dyas
Elimination of a contracted security guard at 18 Dyas Rd location. Instead of an on-site presence, security at
the site will be replaced by mobile patrol.
Efficiencies in Security Preventative Maintenance
Elimination of contracted preventative maintenance work on security systems, to be covered by further
leveraging in-house existing resources to perform this work.
Currently, there is a mixed model of preventative maintenance on security systems which will continue to be
utilized, with a slightly greater reliance on in-house resources.
Corporate Security Position Reduction
The elimination of 1.0 vacant Corporate Security Supervisor position.
There is no change to service level associated with the elimination of this position.
Efficiencies in Facilities Preventative Maintenance
Reduction of the contracted services budget for maintenance work by Facilities Management and optimization
of existing in-house staff to offset this and maintain the same level of service. This is possible due to the
recent reorganization of the Facilities Management Service which allows for a greater pooling and use of in-
house staff resources to perform maintenance functions. In addition, the use of new technology tools, such as
mobile work order management, will allow for this proposal to be successful.
Casual & Overtime Budget Reduction
A reduction in the overtime and casual budget within the FREEE Program is possible through organizational
efficiencies resulting from the reassignment of responsibilities within the existing complement.
There is no impact to service level associated with this efficiency savings.
Change in Enhanced Security at City Hall
A revision of the enhanced security model that was implemented at City Hall since late 2014, is
proposed. This would include the removal of security guards at all entrances, except the main doors, where
access is limited to City staff, Councilors and others with access cards.
There will be no change to the current service level. Access to the public will continue to be available at the
main doors.
Fleet Fuel Savings
A reduction in fuel price per liter passed on by Fleet Services to Facilities Management as part of their 2.6%
Operating Budget reduction.
2017 Operating Budget FREEE
toronto.ca/budget2017 Page 13
Addressing Lease Overholds
Addressing leases that are in an overhold position to bring them up-to-date and ensure the City is realizing
current market rates for these leases. This includes re-purposing a vacant position in the Leasing team to
ensure the necessary resources are available support business requirements to address the overhold leases
on an on-going basis.
Real Estate Services (RES) Position Reductions
Reduction of 1.0 vacant support position within Real Estate Services.
There is no change to service level associated with the elimination of this position.
Service Adjustments (Savings of $0.850 million gross & $0 net)
Move to Standard Custodial Service Delivery for Toronto Police Location
A reduction to the custodial service level currently being delivered at Toronto Police locations will align the
service level to the service standards developed corporately for all City facilities. This change will result in
efficiency savings that will be passed on to Toronto Police Services. Currently, the level of service at Toronto
Police facilities exceeds the corporate standard service levels.
These service level changes will result in a reduction in part time hours for custodial staff that equates to
$0.250 million in savings and a reduction in 4.0 FTEs. In addition, contracted service needs will also be
reduced, resulting in further savings of $0.600 million in 2017.
The key service level changes which will impact Toronto Police employees will be the elimination of the desk
side waste pickup and the introduction of central waste receptacles. The Custodial Standard Service Model
will also introduce a consistent green bin program to help the City meet its environmental commitments on a
go forward basis. Moving to a consistent level of service will enhance Facilities Management's ability to offer
one consistent training and development program for all custodial services across the organization. It will also
be the basis for all quality assurance review for both our in-house staff and contracted services.
Table 4
2017 Preliminary New & Enhanced Service Priorities
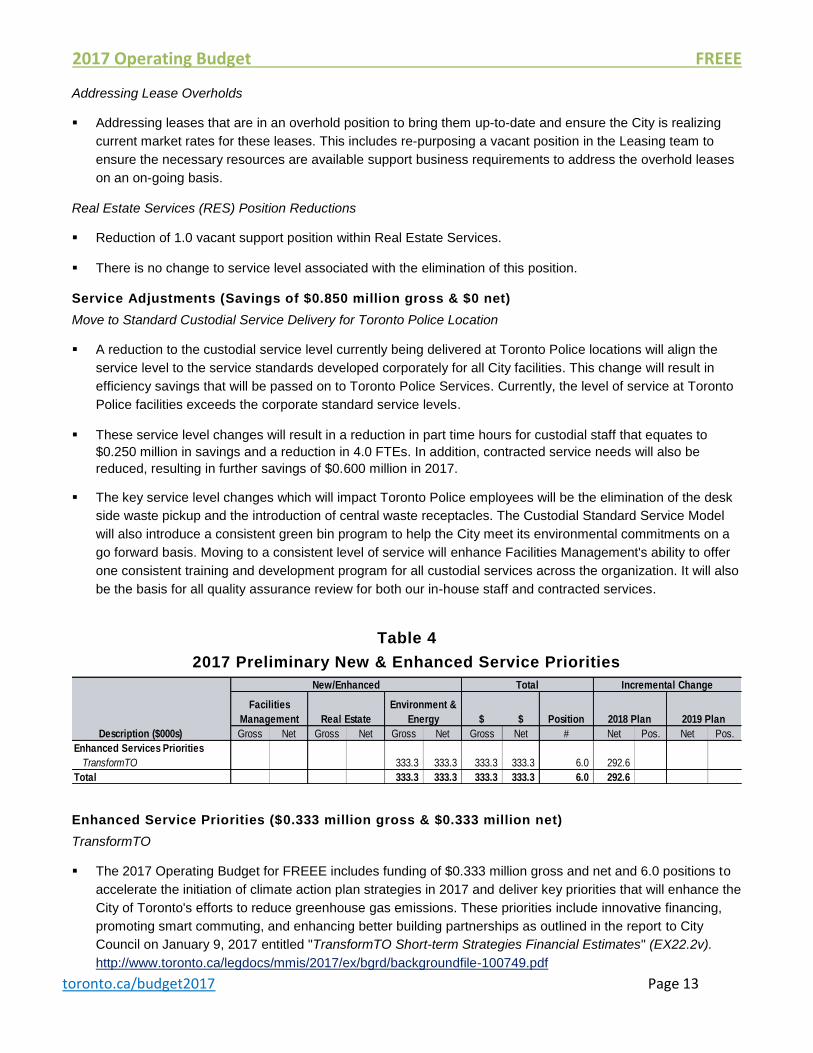
Enhanced Service Priorities ($0.333 million gross & $0.333 million net)
TransformTO
The 2017 Operating Budget for FREEE includes funding of $0.333 million gross and net and 6.0 positions to
accelerate the initiation of climate action plan strategies in 2017 and deliver key priorities that will enhance the
City of Toronto's efforts to reduce greenhouse gas emissions. These priorities include innovative financing,
promoting smart commuting, and enhancing better building partnerships as outlined in the report to City
Council on January 9, 2017 entitled "TransformTO Short-term Strategies Financial Estimates" (EX22.2v).
http://www.toronto.ca/legdocs/mmis/2017/ex/bgrd/backgroundfile-100749.pdf
$ $ Position
Gross Net Gross Net Gross Net Gross Net # Net Pos. Net Pos.
Enhanced Services Priorities
TransformTO 333.3 333.3 333.3 333.3 6.0 292.6
Total 333.3 333.3 333.3 333.3 6.0 292.6
2018 Plan 2019 Plan
New/Enhanced Total Incremental Change
Description ($000s)
Facilities
Management Real Estate
Environment &
Energy
2017 Operating Budget FREEE
toronto.ca/budget2017 Page 14
http://www.toronto.ca/legdocs/mmis/2017/ex/bgrd/backgroundfile-100750.pdf
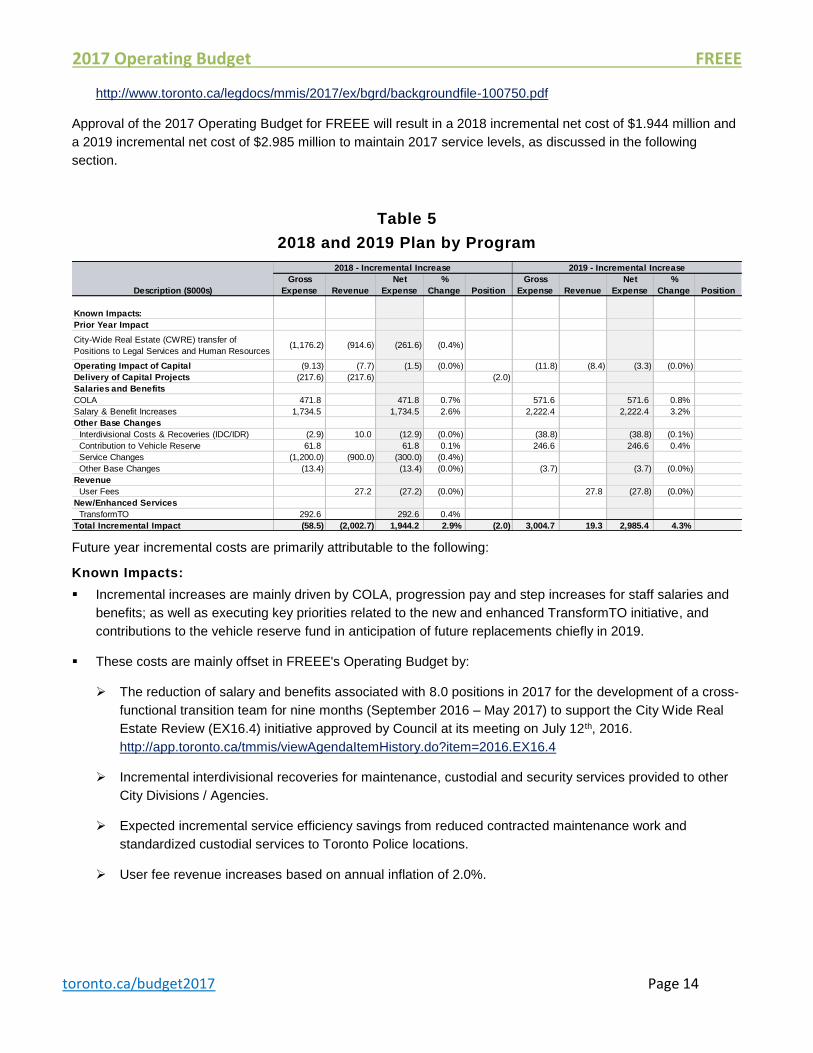
Approval of the 2017 Operating Budget for FREEE will result in a 2018 incremental net cost of $1.944 million and
a 2019 incremental net cost of $2.985 million to maintain 2017 service levels, as discussed in the following
section.
Table 5
2018 and 2019 Plan by Program
Future year incremental costs are primarily attributable to the following:
Known Impacts:
Incremental increases are mainly driven by COLA, progression pay and step increases for staff salaries and
benefits; as well as executing key priorities related to the new and enhanced TransformTO initiative, and
contributions to the vehicle reserve fund in anticipation of future replacements chiefly in 2019.
These costs are mainly offset in FREEE's Operating Budget by:
The reduction of salary and benefits associated with 8.0 positions in 2017 for the development of a cross-
functional transition team for nine months (September 2016 – May 2017) to support the City Wide Real
Estate Review (EX16.4) initiative approved by Council at its meeting on July 12th, 2016.
http://app.toronto.ca/tmmis/viewAgendaItemHistory.do?item=2016.EX16.4
Incremental interdivisional recoveries for maintenance, custodial and security services provided to other
City Divisions / Agencies.
Expected incremental service efficiency savings from reduced contracted maintenance work and
standardized custodial services to Toronto Police locations.
User fee revenue increases based on annual inflation of 2.0%.
Description ($000s)
Gross
Expense Revenue
Net
Expense
%
Change Position
Gross
Expense Revenue
Net
Expense
%
Change Position
Known Impacts:
Prior Year Impact
City-Wide Real Estate (CWRE) transfer of
Positions to Legal Services and Human Resources(1,176.2) (914.6) (261.6) (0.4%)
Operating Impact of Capital (9.13) (7.7) (1.5) (0.0%) (11.8) (8.4) (3.3) (0.0%)
Delivery of Capital Projects (217.6) (217.6) (2.0)
Salaries and Benefits
COLA 471.8 471.8 0.7% 571.6 571.6 0.8%
Salary & Benefit Increases 1,734.5 1,734.5 2.6% 2,222.4 2,222.4 3.2%
Other Base Changes
Interdivisional Costs & Recoveries (IDC/IDR) (2.9) 10.0 (12.9) (0.0%) (38.8) (38.8) (0.1%)
Contribution to Vehicle Reserve 61.8 61.8 0.1% 246.6 246.6 0.4%
Service Changes (1,200.0) (900.0) (300.0) (0.4%)
Other Base Changes (13.4) (13.4) (0.0%) (3.7) (3.7) (0.0%)
Revenue
User Fees 27.2 (27.2) (0.0%) 27.8 (27.8) (0.0%)
New/Enhanced Services
TransformTO 292.6 292.6 0.4%
Total Incremental Impact (58.5) (2,002.7) 1,944.2 2.9% (2.0) 3,004.7 19.3 2,985.4 4.3%
2018 - Incremental Increase 2019 - Incremental Increase
2017 Operating Budget FREEE
toronto.ca/budget2017 Page 15
Part 2: 2017 Operating Budget by Service
2017 Operating Budget FREEE
toronto.ca/budget2017 Page 16
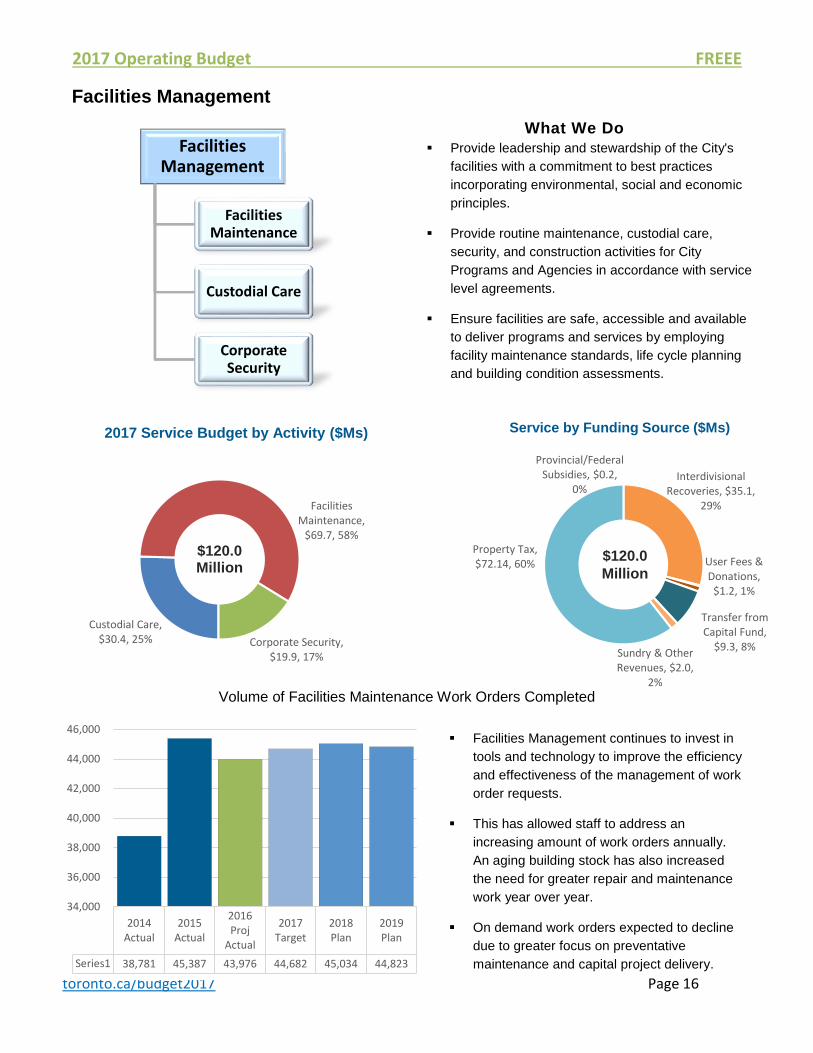
Provide leadership and stewardship of the City's
facilities with a commitment to best practices
incorporating environmental, social and economic
principles.
Provide routine maintenance, custodial care,
security, and construction activities for City
Programs and Agencies in accordance with service
level agreements.
Ensure facilities are safe, accessible and available
to deliver programs and services by employing
facility maintenance standards, life cycle planning
and building condition assessments.
2014Actual
2015Actual
2016Proj
Actual
2017Target
2018Plan
2019Plan
Series1 38,781 45,387 43,976 44,682 45,034 44,823
34,000
36,000
38,000
40,000
42,000
44,000
46,000
Facilities Management
What We Do
Facilities Management
Facilities Maintenance
Custodial Care
Corporate Security
Facilities Management continues to invest in
tools and technology to improve the efficiency
and effectiveness of the management of work
order requests.
This has allowed staff to address an
increasing amount of work orders annually.
An aging building stock has also increased
the need for greater repair and maintenance
work year over year.
On demand work orders expected to decline
due to greater focus on preventative
maintenance and capital project delivery.
Custodial Care, $30.4, 25%
Facilities Maintenance,
$69.7, 58%
Corporate Security, $19.9, 17%
2017 Service Budget by Activity ($Ms)
$120.0 Million
Interdivisional Recoveries, $35.1,
29%
Provincial/Federal Subsidies, $0.2,
0%
User Fees & Donations,
$1.2, 1%
Transfer from Capital Fund,
$9.3, 8%Sundry & Other Revenues, $2.0,
2%
Property Tax, $72.14, 60%
Service by Funding Source ($Ms)
$120.0
Million
Volume of Facilities Maintenance Work Orders Completed
2017 Operating Budget FREEE
toronto.ca/budget2017 Page 17
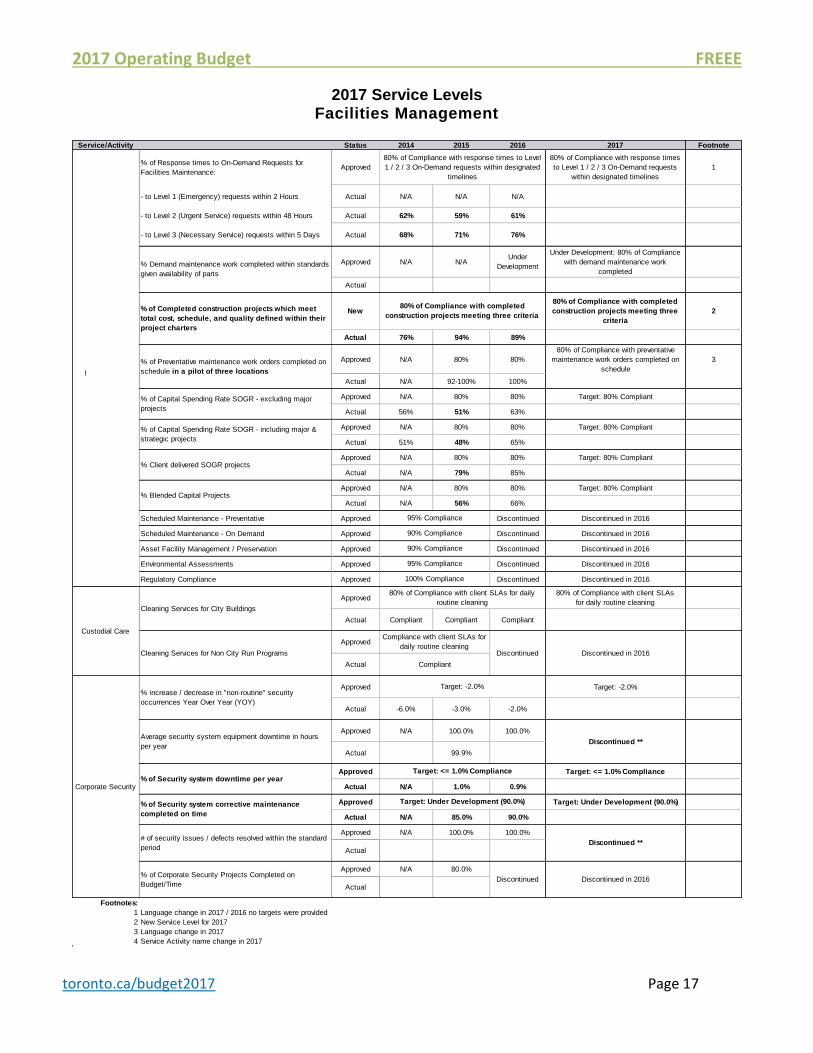
2017 Service Levels Facilities Management
Service/Activity Status 2014 2015 2016 2017 Footnote
% of Response times to On-Demand Requests for
Facilities Maintenance:Approved
80% of Compliance with response times
to Level 1 / 2 / 3 On-Demand requests
within designated timelines
1
- to Level 1 (Emergency) requests within 2 Hours Actual N/A N/A N/A
- to Level 2 (Urgent Service) requests within 48 Hours Actual 62% 59% 61%
- to Level 3 (Necessary Service) requests within 5 Days Actual 68% 71% 76%
Approved N/A N/AUnder
Development
Under Development: 80% of Compliance
with demand maintenance work
completed
Actual
New
80% of Compliance with completed
construction projects meeting three
criteria
2
Actual 76% 94% 89%
Approved N/A 80% 80%
80% of Compliance with preventative
maintenance work orders completed on
schedule
3
Actual N/A 92-100% 100%
Approved N/A 80% 80% Target: 80% Compliant
Actual 56% 51% 63%
Approved N/A 80% 80% Target: 80% Compliant
Actual 51% 48% 65%
Approved N/A 80% 80% Target: 80% Compliant
Actual N/A 79% 85%
Approved N/A 80% 80% Target: 80% Compliant
Actual N/A 56% 66%
Scheduled Maintenance - Preventative Approved Discontinued Discontinued in 2016
Scheduled Maintenance - On Demand Approved Discontinued Discontinued in 2016
Asset Facility Management / Preservation Approved Discontinued Discontinued in 2016
Environmental Assessments Approved Discontinued Discontinued in 2016
Regulatory Compliance Approved Discontinued Discontinued in 2016
Approved80% of Compliance with client SLAs
for daily routine cleaning
Actual Compliant Compliant Compliant
Approved
Actual
Approved Target: -2.0%
Actual -6.0% -3.0% -2.0%
Approved N/A 100.0% 100.0%
Actual 99.9%
Approved Target: <= 1.0% Compliance
Actual N/A 1.0% 0.9%
Approved Target: Under Development (90.0%)
Actual N/A 85.0% 90.0%
Approved N/A 100.0% 100.0%
Actual
Approved N/A 80.0%
Actual
Footnotes:
1 Language change in 2017 / 2016 no targets were provided
2 New Service Level for 2017
3 Language change in 2017
4 Service Activity name change in 2017
% increase / decrease in "non-routine" security
occurrences Year Over Year (YOY)
Target: -2.0%
Average security system equipment downtime in hours
per year
Cleaning Services for Non City Run Programs
Corporate Security
Compliance with client SLAs for
daily routine cleaning
Compliant
Discontinued in 2016
Custodial Care
Discontinued
Cleaning Services for City Buildings
80% of Compliance with client SLAs for daily
routine cleaning
Facilities
Maintenance
% Blended Capital Projects
80% of Compliance with response times to Level
1 / 2 / 3 On-Demand requests within designated
timelines
% Demand maintenance work completed within standards
given availability of parts
% of Completed construction projects which meet
total cost, schedule, and quality defined within their
project charters
80% of Compliance with completed
construction projects meeting three criteria
% of Preventative maintenance work orders completed on
schedule in a pilot of three locations
% of Capital Spending Rate SOGR - excluding major
projects
% of Capital Spending Rate SOGR - including major &
strategic projects
% Client delivered SOGR projects
95% Compliance
90% Compliance
90% Compliance
95% Compliance
100% Compliance
Discontinued **
% of Security system downtime per yearTarget: <= 1.0% Compliance
% of Security system corrective maintenance
completed on time
Target: Under Development (90.0%)
# of security issues / defects resolved within the standard
periodDiscontinued **
% of Corporate Security Projects Completed on
Budget/TimeDiscontinued in 2016Discontinued
2017 Operating Budget FREEE
toronto.ca/budget2017 Page 18
Facilities Management is continuing a review of its service levels, service standards and performance measures.
As a result, there have been some discontinuation of service level and measures considered no longer relevant or
optimal, all in an effort to ensure service levels reported reflect the services being performed by the Program. In
addition, a new service level measure has been added to the Facilities Maintenance activity regarding the rate of
completion of construction projects under the criteria of cost, quality and scheduling to better represent its service
level commitments.
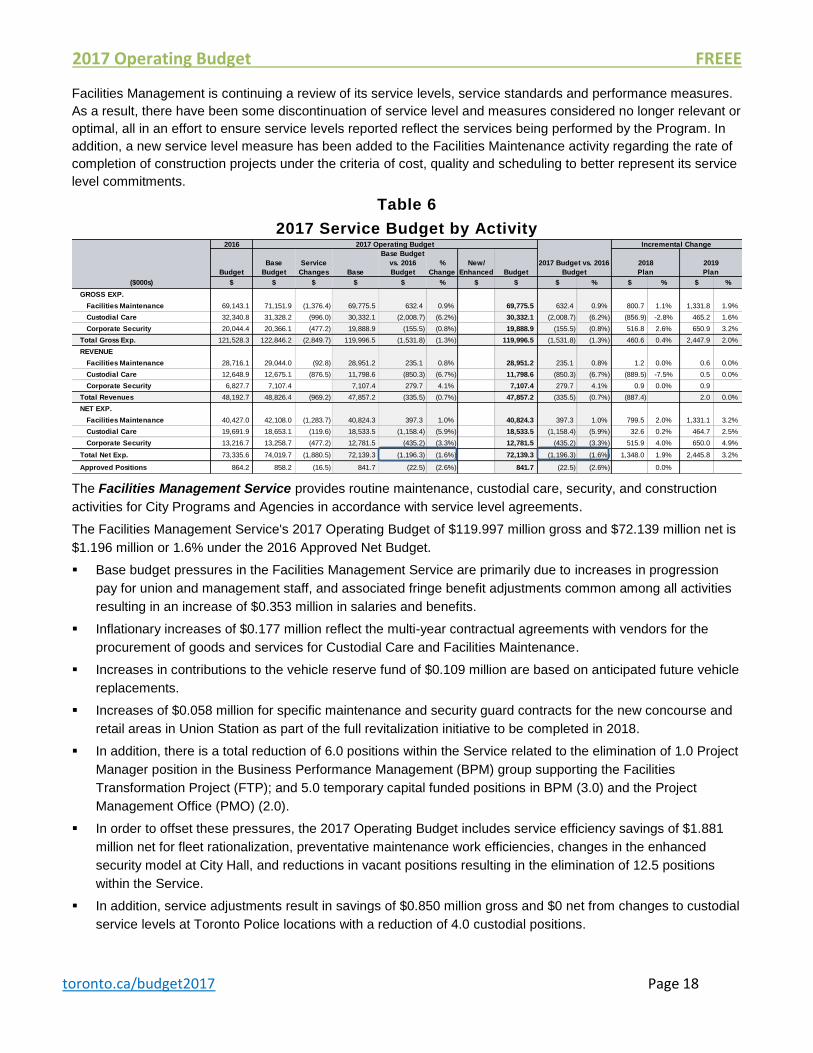
Table 6
2017 Service Budget by Activity
The Facilities Management Service provides routine maintenance, custodial care, security, and construction
activities for City Programs and Agencies in accordance with service level agreements.
The Facilities Management Service's 2017 Operating Budget of $119.997 million gross and $72.139 million net is
$1.196 million or 1.6% under the 2016 Approved Net Budget.
Base budget pressures in the Facilities Management Service are primarily due to increases in progression
pay for union and management staff, and associated fringe benefit adjustments common among all activities
resulting in an increase of $0.353 million in salaries and benefits.
Inflationary increases of $0.177 million reflect the multi-year contractual agreements with vendors for the
procurement of goods and services for Custodial Care and Facilities Maintenance.
Increases in contributions to the vehicle reserve fund of $0.109 million are based on anticipated future vehicle
replacements.
Increases of $0.058 million for specific maintenance and security guard contracts for the new concourse and
retail areas in Union Station as part of the full revitalization initiative to be completed in 2018.
In addition, there is a total reduction of 6.0 positions within the Service related to the elimination of 1.0 Project
Manager position in the Business Performance Management (BPM) group supporting the Facilities
Transformation Project (FTP); and 5.0 temporary capital funded positions in BPM (3.0) and the Project
Management Office (PMO) (2.0).
In order to offset these pressures, the 2017 Operating Budget includes service efficiency savings of $1.881
million net for fleet rationalization, preventative maintenance work efficiencies, changes in the enhanced
security model at City Hall, and reductions in vacant positions resulting in the elimination of 12.5 positions
within the Service.
In addition, service adjustments result in savings of $0.850 million gross and $0 net from changes to custodial
service levels at Toronto Police locations with a reduction of 4.0 custodial positions.
Incremental Change
Budget
Base
Budget
Service
Changes Base
Base Budget
vs. 2016
Budget
%
Change
New/
Enhanced Budget
($000s) $ $ $ $ $ % $ $ $ % $ % $ %
GROSS EXP.
Facilities Maintenance 69,143.1 71,151.9 (1,376.4) 69,775.5 632.4 0.9% 69,775.5 632.4 0.9% 800.7 1.1% 1,331.8 1.9%
Custodial Care 32,340.8 31,328.2 (996.0) 30,332.1 (2,008.7) (6.2%) 30,332.1 (2,008.7) (6.2%) (856.9) -2.8% 465.2 1.6%
Corporate Security 20,044.4 20,366.1 (477.2) 19,888.9 (155.5) (0.8%) 19,888.9 (155.5) (0.8%) 516.8 2.6% 650.9 3.2%
Total Gross Exp. 121,528.3 122,846.2 (2,849.7) 119,996.5 (1,531.8) (1.3%) 119,996.5 (1,531.8) (1.3%) 460.6 0.4% 2,447.9 2.0%
REVENUE
Facilities Maintenance 28,716.1 29,044.0 (92.8) 28,951.2 235.1 0.8% 28,951.2 235.1 0.8% 1.2 0.0% 0.6 0.0%
Custodial Care 12,648.9 12,675.1 (876.5) 11,798.6 (850.3) (6.7%) 11,798.6 (850.3) (6.7%) (889.5) -7.5% 0.5 0.0%
Corporate Security 6,827.7 7,107.4 7,107.4 279.7 4.1% 7,107.4 279.7 4.1% 0.9 0.0% 0.9
Total Revenues 48,192.7 48,826.4 (969.2) 47,857.2 (335.5) (0.7%) 47,857.2 (335.5) (0.7%) (887.4) 2.0 0.0%
NET EXP.
Facilities Maintenance 40,427.0 42,108.0 (1,283.7) 40,824.3 397.3 1.0% 40,824.3 397.3 1.0% 799.5 2.0% 1,331.1 3.2%
Custodial Care 19,691.9 18,653.1 (119.6) 18,533.5 (1,158.4) (5.9%) 18,533.5 (1,158.4) (5.9%) 32.6 0.2% 464.7 2.5%
Corporate Security 13,216.7 13,258.7 (477.2) 12,781.5 (435.2) (3.3%) 12,781.5 (435.2) (3.3%) 515.9 4.0% 650.0 4.9%
Total Net Exp. 73,335.6 74,019.7 (1,880.5) 72,139.3 (1,196.3) (1.6%) 72,139.3 (1,196.3) (1.6%) 1,348.0 1.9% 2,445.8 3.2%
Approved Positions 864.2 858.2 (16.5) 841.7 (22.5) (2.6%) 841.7 (22.5) (2.6%) 0.0%
2016 2017 Operating Budget
2017 Budget vs. 2016
Budget
2018
Plan
2019
Plan
2017 Operating Budget FREEE
toronto.ca/budget2017 Page 19
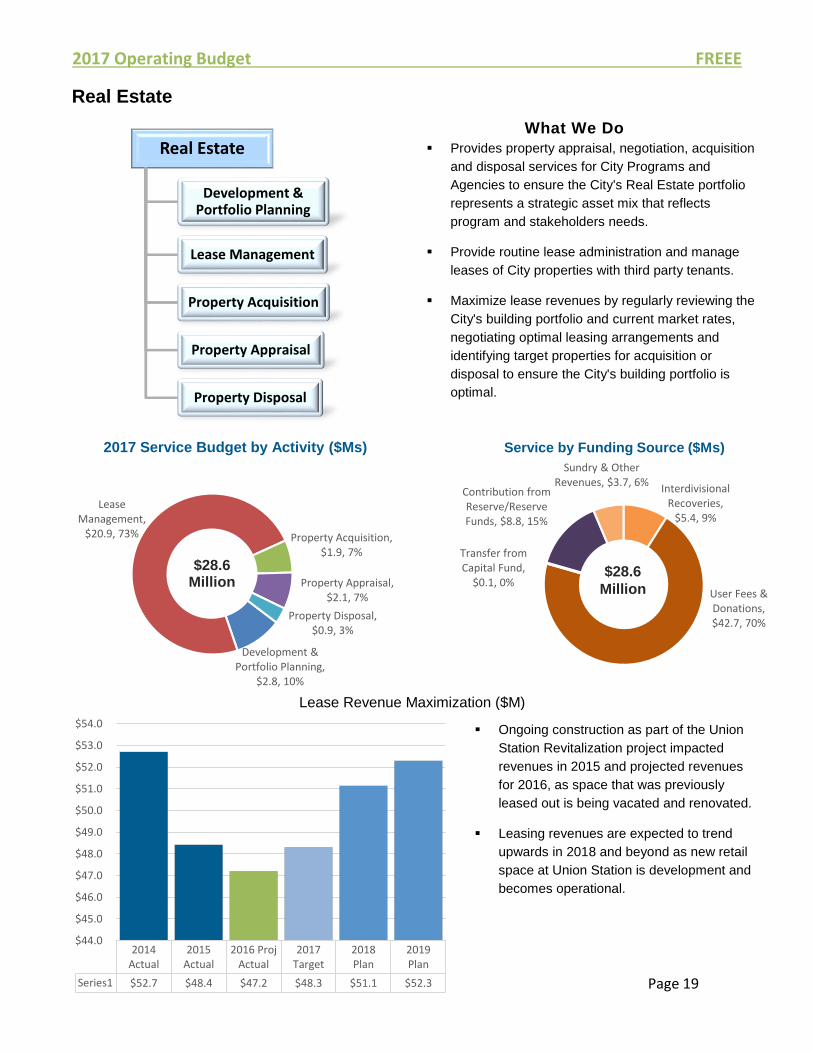
Provides property appraisal, negotiation, acquisition
and disposal services for City Programs and
Agencies to ensure the City's Real Estate portfolio
represents a strategic asset mix that reflects
program and stakeholders needs.
Provide routine lease administration and manage
leases of City properties with third party tenants.
Maximize lease revenues by regularly reviewing the
City's building portfolio and current market rates,
negotiating optimal leasing arrangements and
identifying target properties for acquisition or
disposal to ensure the City's building portfolio is
optimal.
2014Actual
2015Actual
2016 ProjActual
2017Target
2018Plan
2019Plan
Series1 $52.7 $48.4 $47.2 $48.3 $51.1 $52.3
$44.0
$45.0
$46.0
$47.0
$48.0
$49.0
$50.0
$51.0
$52.0
$53.0
$54.0
Real Estate
What We Do
Real Estate
Development & Portfolio Planning
Lease Management
Property Acquisition
Property Appraisal
Property Disposal
Ongoing construction as part of the Union
Station Revitalization project impacted
revenues in 2015 and projected revenues
for 2016, as space that was previously
leased out is being vacated and renovated.
Leasing revenues are expected to trend
upwards in 2018 and beyond as new retail
space at Union Station is development and
becomes operational.
Development & Portfolio Planning,
$2.8, 10%
Lease Management,
$20.9, 73% Property Acquisition, $1.9, 7%
Property Appraisal, $2.1, 7%
Property Disposal, $0.9, 3%
2017 Service Budget by Activity ($Ms)
$28.6 Million
Interdivisional Recoveries,
$5.4, 9%
User Fees & Donations, $42.7, 70%
Transfer from Capital Fund,
$0.1, 0%
Contribution from Reserve/Reserve Funds, $8.8, 15%
Sundry & Other Revenues, $3.7, 6%
Service by Funding Source ($Ms)
$28.6
Million
Lease Revenue Maximization ($M)
2017 Operating Budget FREEE
toronto.ca/budget2017 Page 20
2017 Service Levels
Real Estate
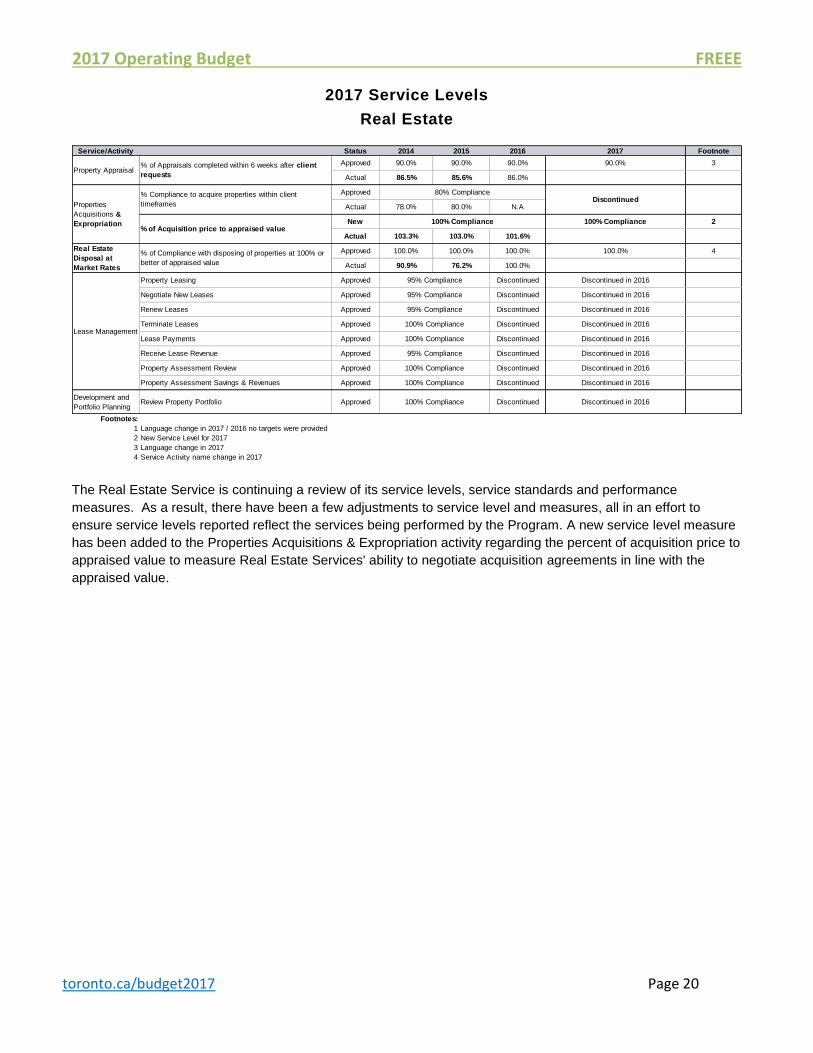
The Real Estate Service is continuing a review of its service levels, service standards and performance
measures. As a result, there have been a few adjustments to service level and measures, all in an effort to
ensure service levels reported reflect the services being performed by the Program. A new service level measure
has been added to the Properties Acquisitions & Expropriation activity regarding the percent of acquisition price to
appraised value to measure Real Estate Services' ability to negotiate acquisition agreements in line with the
appraised value.
Service/Activity Status 2014 2015 2016 2017 Footnote
Approved 90.0% 90.0% 90.0% 90.0% 3
Actual 86.5% 85.6% 86.0%
Approved
Actual 78.0% 80.0% N.A
New 100% Compliance 2
Actual 103.3% 103.0% 101.6%
Approved 100.0% 100.0% 100.0% 100.0% 4
Actual 90.9% 76.2% 100.0%
Property Leasing Approved Discontinued Discontinued in 2016
Negotiate New Leases Approved Discontinued Discontinued in 2016
Renew Leases Approved Discontinued Discontinued in 2016
Terminate Leases Approved Discontinued Discontinued in 2016
Lease Payments Approved Discontinued Discontinued in 2016
Receive Lease Revenue Approved Discontinued Discontinued in 2016
Property Assessment Review Approved Discontinued Discontinued in 2016
Property Assessment Savings & Revenues Approved Discontinued Discontinued in 2016
Development and
Portfolio PlanningReview Property Portfolio Approved Discontinued Discontinued in 2016
Footnotes:
1 Language change in 2017 / 2016 no targets were provided
2 New Service Level for 2017
3 Language change in 2017
4 Service Activity name change in 2017
100% Compliance
100% Compliance
Discontinued
% of Acquisition price to appraised value
100% Compliance
95% Compliance
95% Compliance
95% Compliance
100% Compliance
100% Compliance
Property Appraisal% of Appraisals completed within 6 weeks after client
requests
Properties
Acquisitions &
Expropriation
% Compliance to acquire properties within client
timeframes
80% Compliance
Real Estate
Disposal at
Market Rates
% of Compliance with disposing of properties at 100% or
better of appraised value
Lease Management
95% Compliance
100% Compliance
2017 Operating Budget FREEE
toronto.ca/budget2017 Page 21
Table 7
2017 Service Budget by Activity
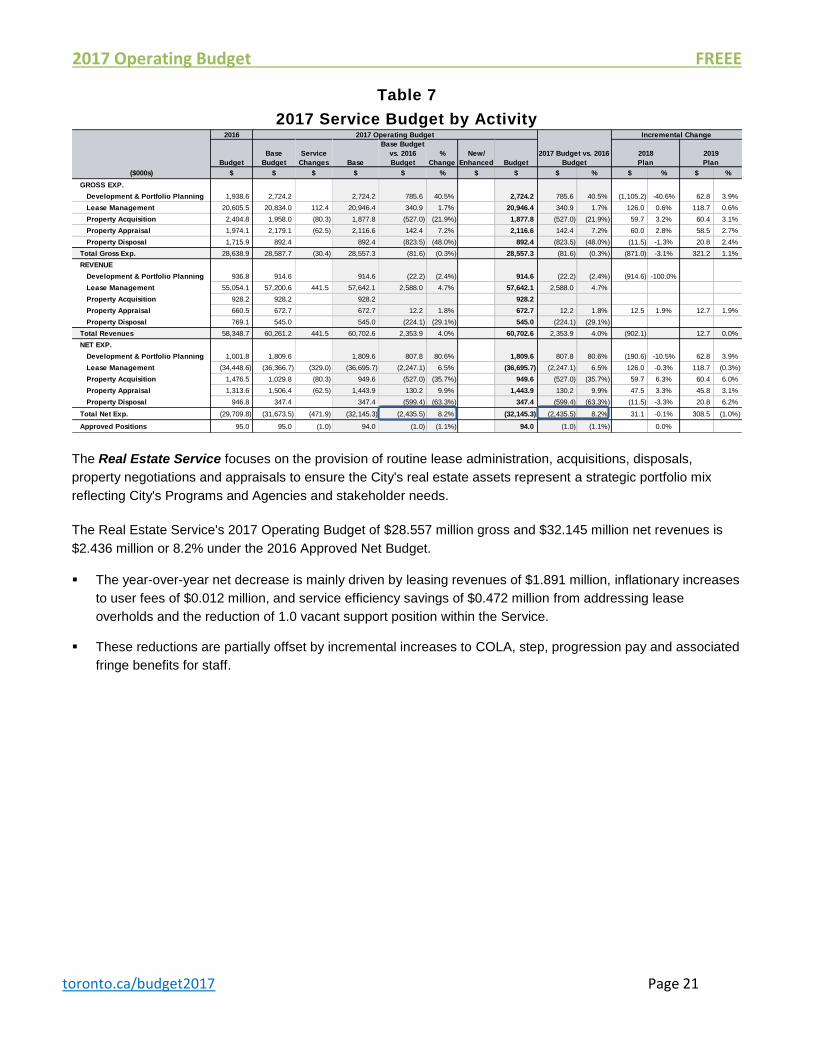
The Real Estate Service focuses on the provision of routine lease administration, acquisitions, disposals,
property negotiations and appraisals to ensure the City's real estate assets represent a strategic portfolio mix
reflecting City's Programs and Agencies and stakeholder needs.
The Real Estate Service's 2017 Operating Budget of $28.557 million gross and $32.145 million net revenues is
$2.436 million or 8.2% under the 2016 Approved Net Budget.
The year-over-year net decrease is mainly driven by leasing revenues of $1.891 million, inflationary increases
to user fees of $0.012 million, and service efficiency savings of $0.472 million from addressing lease
overholds and the reduction of 1.0 vacant support position within the Service.
These reductions are partially offset by incremental increases to COLA, step, progression pay and associated
fringe benefits for staff.
Incremental Change
Budget
Base
Budget
Service
Changes Base
Base Budget
vs. 2016
Budget
%
Change
New/
Enhanced Budget
($000s) $ $ $ $ $ % $ $ $ % $ % $ %
GROSS EXP.
Development & Portfolio Planning 1,938.6 2,724.2 2,724.2 785.6 40.5% 2,724.2 785.6 40.5% (1,105.2) -40.6% 62.8 3.9%
Lease Management 20,605.5 20,834.0 112.4 20,946.4 340.9 1.7% 20,946.4 340.9 1.7% 126.0 0.6% 118.7 0.6%
Property Acquisition 2,404.8 1,958.0 (80.3) 1,877.8 (527.0) (21.9%) 1,877.8 (527.0) (21.9%) 59.7 3.2% 60.4 3.1%
Property Appraisal 1,974.1 2,179.1 (62.5) 2,116.6 142.4 7.2% 2,116.6 142.4 7.2% 60.0 2.8% 58.5 2.7%
Property Disposal 1,715.9 892.4 892.4 (823.5) (48.0%) 892.4 (823.5) (48.0%) (11.5) -1.3% 20.8 2.4%
Total Gross Exp. 28,638.9 28,587.7 (30.4) 28,557.3 (81.6) (0.3%) 28,557.3 (81.6) (0.3%) (871.0) -3.1% 321.2 1.1%
REVENUE
Development & Portfolio Planning 936.8 914.6 914.6 (22.2) (2.4%) 914.6 (22.2) (2.4%) (914.6) -100.0%
Lease Management 55,054.1 57,200.6 441.5 57,642.1 2,588.0 4.7% 57,642.1 2,588.0 4.7%
Property Acquisition 928.2 928.2 928.2 928.2
Property Appraisal 660.5 672.7 672.7 12.2 1.8% 672.7 12.2 1.8% 12.5 1.9% 12.7 1.9%
Property Disposal 769.1 545.0 545.0 (224.1) (29.1%) 545.0 (224.1) (29.1%)
Total Revenues 58,348.7 60,261.2 441.5 60,702.6 2,353.9 4.0% 60,702.6 2,353.9 4.0% (902.1) 12.7 0.0%
NET EXP.
Development & Portfolio Planning 1,001.8 1,809.6 1,809.6 807.8 80.6% 1,809.6 807.8 80.6% (190.6) -10.5% 62.8 3.9%
Lease Management (34,448.6) (36,366.7) (329.0) (36,695.7) (2,247.1) 6.5% (36,695.7) (2,247.1) 6.5% 126.0 -0.3% 118.7 (0.3%)
Property Acquisition 1,476.5 1,029.8 (80.3) 949.6 (527.0) (35.7%) 949.6 (527.0) (35.7%) 59.7 6.3% 60.4 6.0%
Property Appraisal 1,313.6 1,506.4 (62.5) 1,443.9 130.2 9.9% 1,443.9 130.2 9.9% 47.5 3.3% 45.8 3.1%
Property Disposal 946.8 347.4 347.4 (599.4) (63.3%) 347.4 (599.4) (63.3%) (11.5) -3.3% 20.8 6.2%
Total Net Exp. (29,709.8) (31,673.5) (471.9) (32,145.3) (2,435.5) 8.2% (32,145.3) (2,435.5) 8.2% 31.1 -0.1% 308.5 (1.0%)
Approved Positions 95.0 95.0 (1.0) 94.0 (1.0) (1.1%) 94.0 (1.0) (1.1%) 0.0%
2018
Plan
2019
Plan
2016 2017 Operating Budget
2017 Budget vs. 2016
Budget
2017 Operating Budget FREEE
toronto.ca/budget2017 Page 22
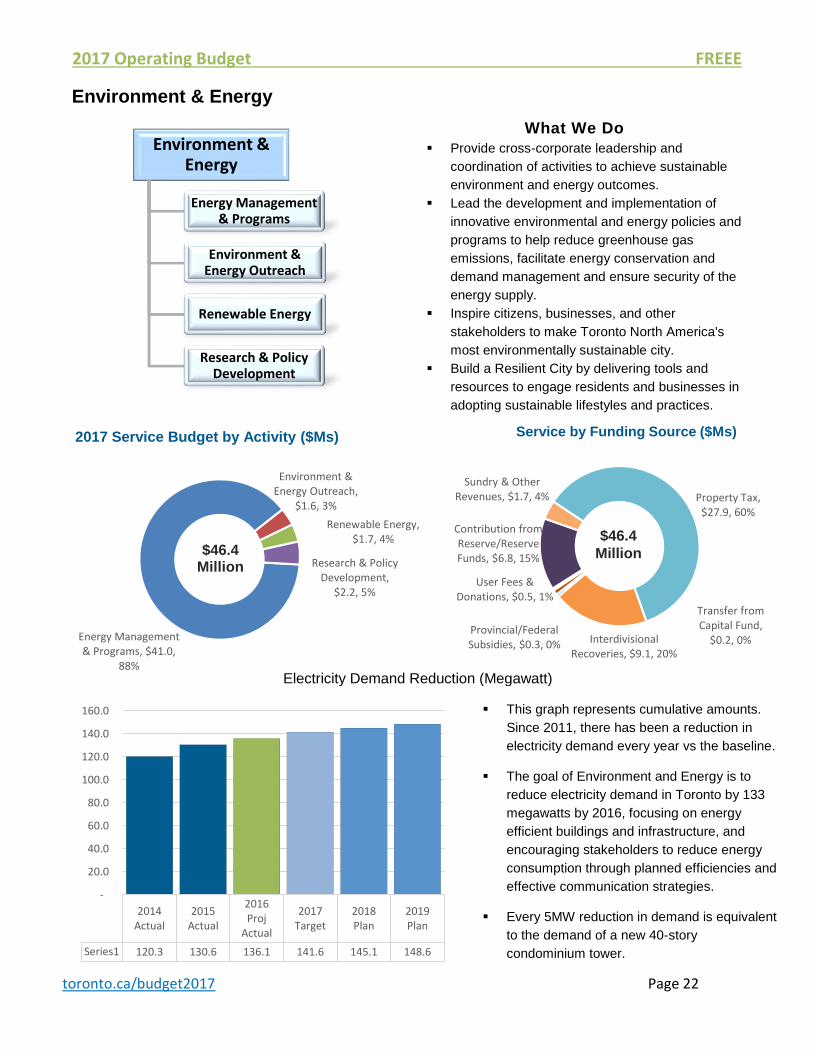
Provide cross-corporate leadership and
coordination of activities to achieve sustainable
environment and energy outcomes.
Lead the development and implementation of
innovative environmental and energy policies and
programs to help reduce greenhouse gas
emissions, facilitate energy conservation and
demand management and ensure security of the
energy supply.
Inspire citizens, businesses, and other
stakeholders to make Toronto North America's
most environmentally sustainable city.
Build a Resilient City by delivering tools and
resources to engage residents and businesses in
adopting sustainable lifestyles and practices.
2014Actual
2015Actual
2016Proj
Actual
2017Target
2018Plan
2019Plan
Series1 120.3 130.6 136.1 141.6 145.1 148.6
-
20.0
40.0
60.0
80.0
100.0
120.0
140.0
160.0
Environment & Energy
What We Do
Environment & Energy
Energy Management & Programs
Environment & Energy Outreach
Renewable Energy
Research & Policy Development
This graph represents cumulative amounts.
Since 2011, there has been a reduction in
electricity demand every year vs the baseline.
The goal of Environment and Energy is to
reduce electricity demand in Toronto by 133
megawatts by 2016, focusing on energy
efficient buildings and infrastructure, and
encouraging stakeholders to reduce energy
consumption through planned efficiencies and
effective communication strategies.
Every 5MW reduction in demand is equivalent
to the demand of a new 40-story
condominium tower.
Energy Management & Programs, $41.0,
88%
Environment & Energy Outreach,
$1.6, 3%
Renewable Energy, $1.7, 4%
Research & Policy Development,
$2.2, 5%
2017 Service Budget by Activity ($Ms)
$46.4 Million
Interdivisional Recoveries, $9.1, 20%
Provincial/Federal Subsidies, $0.3, 0%
User Fees & Donations, $0.5, 1%
Transfer from Capital Fund,
$0.2, 0%
Contribution from Reserve/Reserve Funds, $6.8, 15%
Sundry & Other Revenues, $1.7, 4% Property Tax,
$27.9, 60%
Service by Funding Source ($Ms)
$46.4
Million
Electricity Demand Reduction (Megawatt)
2017 Operating Budget FREEE
toronto.ca/budget2017 Page 23
2017 Service Levels
Environment & Energy
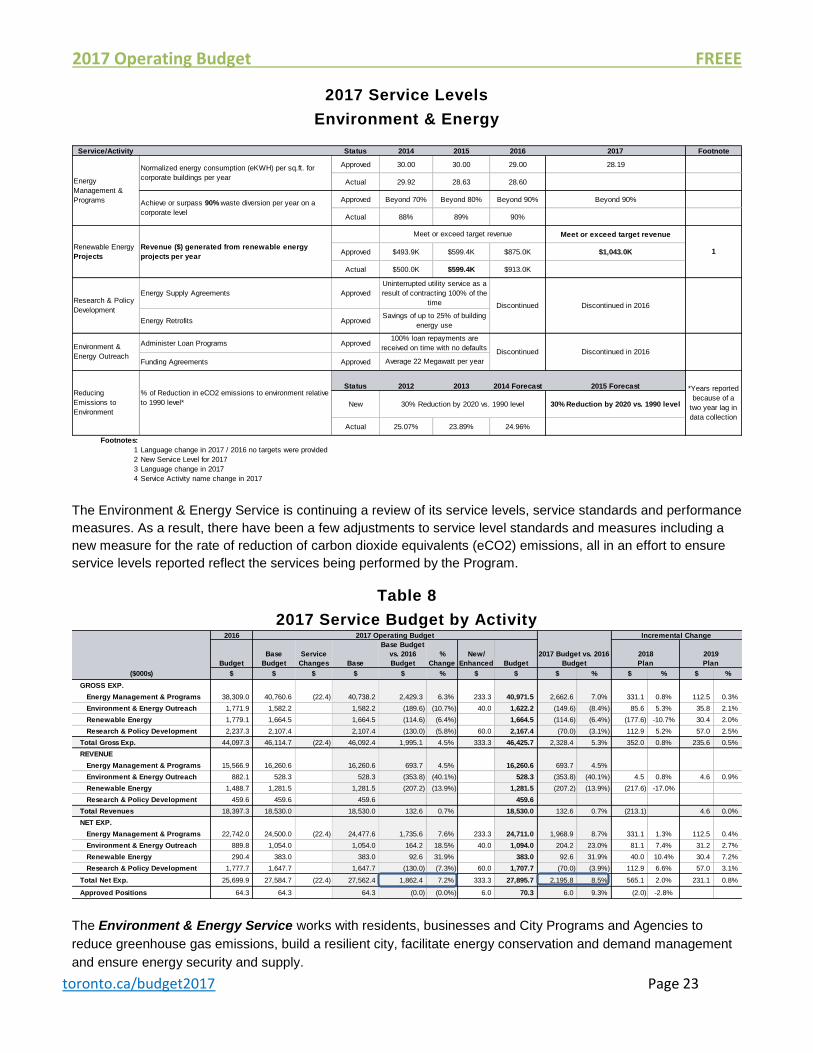
The Environment & Energy Service is continuing a review of its service levels, service standards and performance
measures. As a result, there have been a few adjustments to service level standards and measures including a
new measure for the rate of reduction of carbon dioxide equivalents (eCO2) emissions, all in an effort to ensure
service levels reported reflect the services being performed by the Program.
Table 8
2017 Service Budget by Activity
The Environment & Energy Service works with residents, businesses and City Programs and Agencies to
reduce greenhouse gas emissions, build a resilient city, facilitate energy conservation and demand management
and ensure energy security and supply.
Service/Activity Status 2014 2015 2016 2017 Footnote
Approved 30.00 30.00 29.00 28.19
Actual 29.92 28.63 28.60
Approved Beyond 70% Beyond 80% Beyond 90% Beyond 90%
Actual 88% 89% 90%
Meet or exceed target revenue
Approved $493.9K $599.4K $875.0K $1,043.0K
Actual $500.0K $599.4K $913.0K
Energy Supply Agreements Approved
Energy Retrofits Approved
Administer Loan Programs Approved
Funding Agreements Approved
Status 2012 2013 2014 Forecast 2015 Forecast
New 30% Reduction by 2020 vs. 1990 level
Actual 25.07% 23.89% 24.96%
Footnotes:
1 Language change in 2017 / 2016 no targets were provided
2 New Service Level for 2017
3 Language change in 2017
4 Service Activity name change in 2017
*Years reported
because of a
two year lag in
data collection
1
Discontinued Discontinued in 2016
100% loan repayments are
received on time with no defaults
Average 22 Megawatt per year
Uninterrupted utility service as a
result of contracting 100% of the
time
Savings of up to 25% of building
energy use
Discontinued Discontinued in 2016
Meet or exceed target revenue
Reducing
Emissions to
Environment
% of Reduction in eCO2 emissions to environment relative
to 1990 level* 30% Reduction by 2020 vs. 1990 level
Energy
Management &
Programs
Normalized energy consumption (eKWH) per sq.ft. for
corporate buildings per year
Achieve or surpass 90% waste diversion per year on a
corporate level
Renewable Energy
Projects
Revenue ($) generated from renewable energy
projects per year
Research & Policy
Development
Environment &
Energy Outreach
Incremental Change
Budget
Base
Budget
Service
Changes Base
Base Budget
vs. 2016
Budget
%
Change
New/
Enhanced Budget
($000s) $ $ $ $ $ % $ $ $ % $ % $ %
GROSS EXP.
Energy Management & Programs 38,309.0 40,760.6 (22.4) 40,738.2 2,429.3 6.3% 233.3 40,971.5 2,662.6 7.0% 331.1 0.8% 112.5 0.3%
Environment & Energy Outreach 1,771.9 1,582.2 1,582.2 (189.6) (10.7%) 40.0 1,622.2 (149.6) (8.4%) 85.6 5.3% 35.8 2.1%
Renewable Energy 1,779.1 1,664.5 1,664.5 (114.6) (6.4%) 1,664.5 (114.6) (6.4%) (177.6) -10.7% 30.4 2.0%
Research & Policy Development 2,237.3 2,107.4 2,107.4 (130.0) (5.8%) 60.0 2,167.4 (70.0) (3.1%) 112.9 5.2% 57.0 2.5%
Total Gross Exp. 44,097.3 46,114.7 (22.4) 46,092.4 1,995.1 4.5% 333.3 46,425.7 2,328.4 5.3% 352.0 0.8% 235.6 0.5%
REVENUE
Energy Management & Programs 15,566.9 16,260.6 16,260.6 693.7 4.5% 16,260.6 693.7 4.5%
Environment & Energy Outreach 882.1 528.3 528.3 (353.8) (40.1%) 528.3 (353.8) (40.1%) 4.5 0.8% 4.6 0.9%
Renewable Energy 1,488.7 1,281.5 1,281.5 (207.2) (13.9%) 1,281.5 (207.2) (13.9%) (217.6) -17.0%
Research & Policy Development 459.6 459.6 459.6 459.6
Total Revenues 18,397.3 18,530.0 18,530.0 132.6 0.7% 18,530.0 132.6 0.7% (213.1) 4.6 0.0%
NET EXP.
Energy Management & Programs 22,742.0 24,500.0 (22.4) 24,477.6 1,735.6 7.6% 233.3 24,711.0 1,968.9 8.7% 331.1 1.3% 112.5 0.4%
Environment & Energy Outreach 889.8 1,054.0 1,054.0 164.2 18.5% 40.0 1,094.0 204.2 23.0% 81.1 7.4% 31.2 2.7%
Renewable Energy 290.4 383.0 383.0 92.6 31.9% 383.0 92.6 31.9% 40.0 10.4% 30.4 7.2%
Research & Policy Development 1,777.7 1,647.7 1,647.7 (130.0) (7.3%) 60.0 1,707.7 (70.0) (3.9%) 112.9 6.6% 57.0 3.1%
Total Net Exp. 25,699.9 27,584.7 (22.4) 27,562.4 1,862.4 7.2% 333.3 27,895.7 2,195.8 8.5% 565.1 2.0% 231.1 0.8%
Approved Positions 64.3 64.3 64.3 (0.0) (0.0%) 6.0 70.3 6.0 9.3% (2.0) -2.8%
2018
Plan
2019
Plan
2016 2017 Operating Budget
2017 Budget vs. 2016
Budget
2017 Operating Budget FREEE
toronto.ca/budget2017 Page 24
The Environment & Energy Service's 2017 Operating Budget of $46.426 million gross and $27.896 million net is
$2.196 million or 8.5% over the 2016 Approved Net Budget.
Base budget pressures in Environment & Energy Service are primarily due to inflationary increases of $1.009
million due to rising utility rates, specifically electricity, natural gas and water rates, under Energy
Management & Programs.
Additional costs related to Union Station of $0.155 million due to an expected increase in utilities usage as
well as a reduction in lease and retail revenue forecasts for the new concourse and retail areas in Union
Station that are expected to be fully operational by 2018.
Utility base increases of $0.642 million are included in the Service for costs over and above inflation to align
budgets with expected usage and costs at various corporately funded locations.
Operating impacts of $0.058 million for the Solar Photovoltaic (PV) capital initiative relate to a reduction in
capital repayments of $0.138 million funded from the Sustainable Energy Fund (SEF) and an associated
reduction in revenues of $0.196 million to align with revised forecasts of Solar PV revenues.
New & Enhanced services of $0.333 million related to the TransformTO initiative to deliver key priorities of the
climate action plan in 2017 to accelerate and enhance the City of Toronto's efforts to reduce greenhouse gas
emissions. An increase of 6.0 positions is required to execute these key priorities.
In order to offset these pressures, the 2017 Operating Budget includes service efficiency savings of $0.022
million related to the reduction of the casual and overtime budget.
2017 Operating Budget FREEE
toronto.ca/budget2017 Page 25
Part 3:
Issues for Discussion
2017 Operating Budget FREEE
toronto.ca/budget2017 Page 26
Issues Impacting the 2017 Budget
Budget Reduction Target
At its meeting on July 12, 2016, the "2017 Budget Process: Budget Directions and Schedule" staff report
(EX16.37) was submitted for consideration and adopted by City Council regarding the establishment of the
2017 Budget Process and the scheduling of the review and approval of the Tax and Rate Supported 2017
Operating Budget and 2017-2026 Capital Budget and Plan for the City of Toronto.
(http://www.toronto.ca/legdocs/mmis/2016/ex/bgrd/backgroundfile-94519.pdf)
City Council adopted an across the board budget reduction target of -2.6% net below the 2016 Approved Net
Operating Budgets for all City Programs and Agencies utilizing strategies including but not limited to
controlling expenditures through cost saving measures, and exploring all services for efficiency savings
including opportunities from business process reengineering, streamlining, transformation and innovation to
service delivery.
Facilities Management, Real Estate, Environment & Energy conducted a thorough review of all base
expenditures and revenues to identify areas for cost and efficiency savings with minimal to no impact on
service levels. As a result of these efforts, the Program's 2017 Operating Budget of $194.980 million gross
and $67.890 million net, represents a 2.1% reduction from the 2016 Net Budget including the new/enhanced
TransformTO key prioities for 2017 approved by Council.
The Real Estate Service underwent a review of all leases coming due in 2016 and is expected to realize a
10% increase in revenues on the City's lease portfolio, resulting in additional base revenues of $0.138 million.
To address the issue of unlocking the value of the City’s real estate portfolio and maximizing the use of City-
owned space while meeting client program requirements, it is important that the Program continue to review
and assess the value of its lease agreements including the terms and conditions stipulated, to maximize
revenue potential for the City.
Service efficiency savings of $2.053 million gross and $2.375 million net were also identified through
addressing lease overholds; streamlining maintenance functions; reducing overtime and casual budget;
rationalizing of the fleet portfolio; restructuring aspects of its organization to eliminate vacant positions; and
revising the enhanced security model at City Hall, with an associated complement reduction of 13.5 positions.
In addition, service adjustments of $0.850 million gross and $0 net, with an associated complement reduction
of 4.0 positions was achieved through the standardization of custodial services provided to several Toronto
Police facilities based on a reassessment of service needs.
With increasing budget pressures from salary and benefit and utility costs, it will be difficult for FREEE to
identify ongoing sustainable savings in future years' Operating Budget submissions. The Program is mindful
of the notable expense challenges and resource constraints in the future for the City of Toronto.
FREEE will continue working to make meaningful changes to ensure the City's future financial stability and to
support Council's policy direction to invest in and support the growth of our community.
2017 Operating Budget FREEE
toronto.ca/budget2017 Page 27
Utilities Energy Efficiency, Consumption Benchmarking and Forecasted Pressures
Energy Efficiency
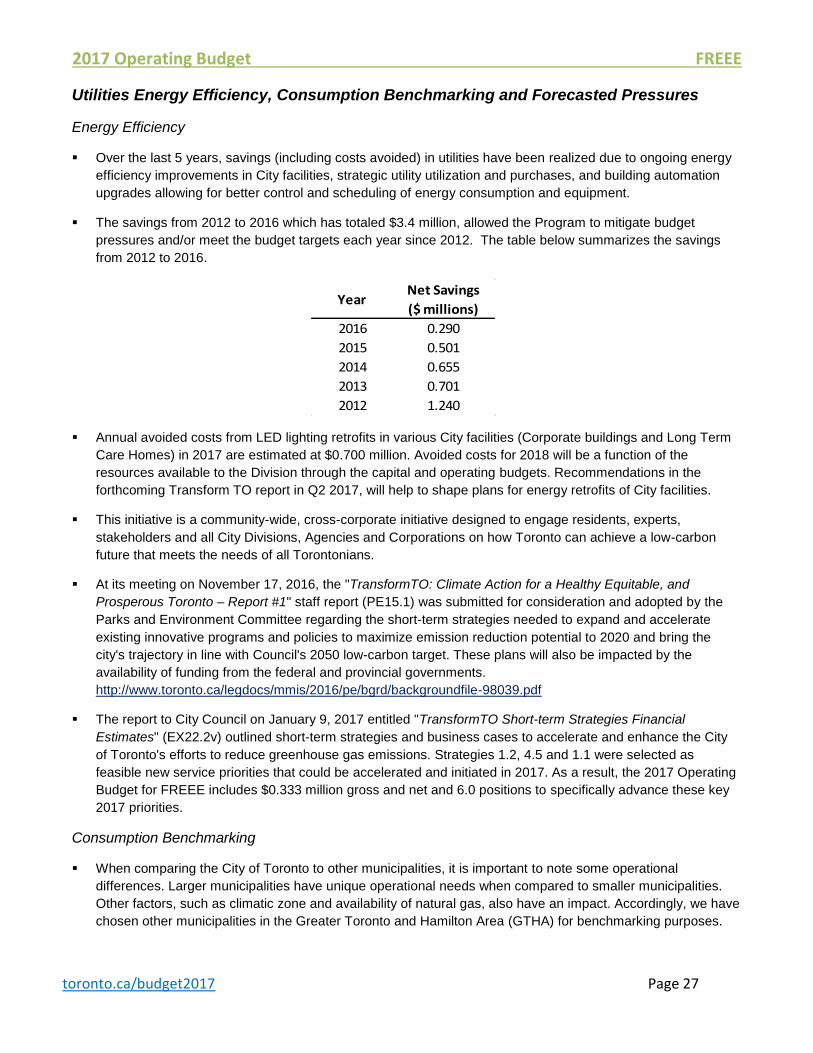
Over the last 5 years, savings (including costs avoided) in utilities have been realized due to ongoing energy
efficiency improvements in City facilities, strategic utility utilization and purchases, and building automation
upgrades allowing for better control and scheduling of energy consumption and equipment.
The savings from 2012 to 2016 which has totaled $3.4 million, allowed the Program to mitigate budget
pressures and/or meet the budget targets each year since 2012. The table below summarizes the savings
from 2012 to 2016.
YearNet Savings
($ millions)
2016 0.290
2015 0.501
2014 0.655
2013 0.701
2012 1.240
Annual avoided costs from LED lighting retrofits in various City facilities (Corporate buildings and Long Term
Care Homes) in 2017 are estimated at $0.700 million. Avoided costs for 2018 will be a function of the
resources available to the Division through the capital and operating budgets. Recommendations in the
forthcoming Transform TO report in Q2 2017, will help to shape plans for energy retrofits of City facilities.
This initiative is a community-wide, cross-corporate initiative designed to engage residents, experts,
stakeholders and all City Divisions, Agencies and Corporations on how Toronto can achieve a low-carbon
future that meets the needs of all Torontonians.
At its meeting on November 17, 2016, the "TransformTO: Climate Action for a Healthy Equitable, and
Prosperous Toronto – Report #1" staff report (PE15.1) was submitted for consideration and adopted by the
Parks and Environment Committee regarding the short-term strategies needed to expand and accelerate
existing innovative programs and policies to maximize emission reduction potential to 2020 and bring the
city's trajectory in line with Council's 2050 low-carbon target. These plans will also be impacted by the
availability of funding from the federal and provincial governments.
http://www.toronto.ca/legdocs/mmis/2016/pe/bgrd/backgroundfile-98039.pdf
The report to City Council on January 9, 2017 entitled "TransformTO Short-term Strategies Financial
Estimates" (EX22.2v) outlined short-term strategies and business cases to accelerate and enhance the City
of Toronto's efforts to reduce greenhouse gas emissions. Strategies 1.2, 4.5 and 1.1 were selected as
feasible new service priorities that could be accelerated and initiated in 2017. As a result, the 2017 Operating
Budget for FREEE includes $0.333 million gross and net and 6.0 positions to specifically advance these key
2017 priorities.
Consumption Benchmarking
When comparing the City of Toronto to other municipalities, it is important to note some operational
differences. Larger municipalities have unique operational needs when compared to smaller municipalities.
Other factors, such as climatic zone and availability of natural gas, also have an impact. Accordingly, we have
chosen other municipalities in the Greater Toronto and Hamilton Area (GTHA) for benchmarking purposes.
2017 Operating Budget FREEE
toronto.ca/budget2017 Page 28
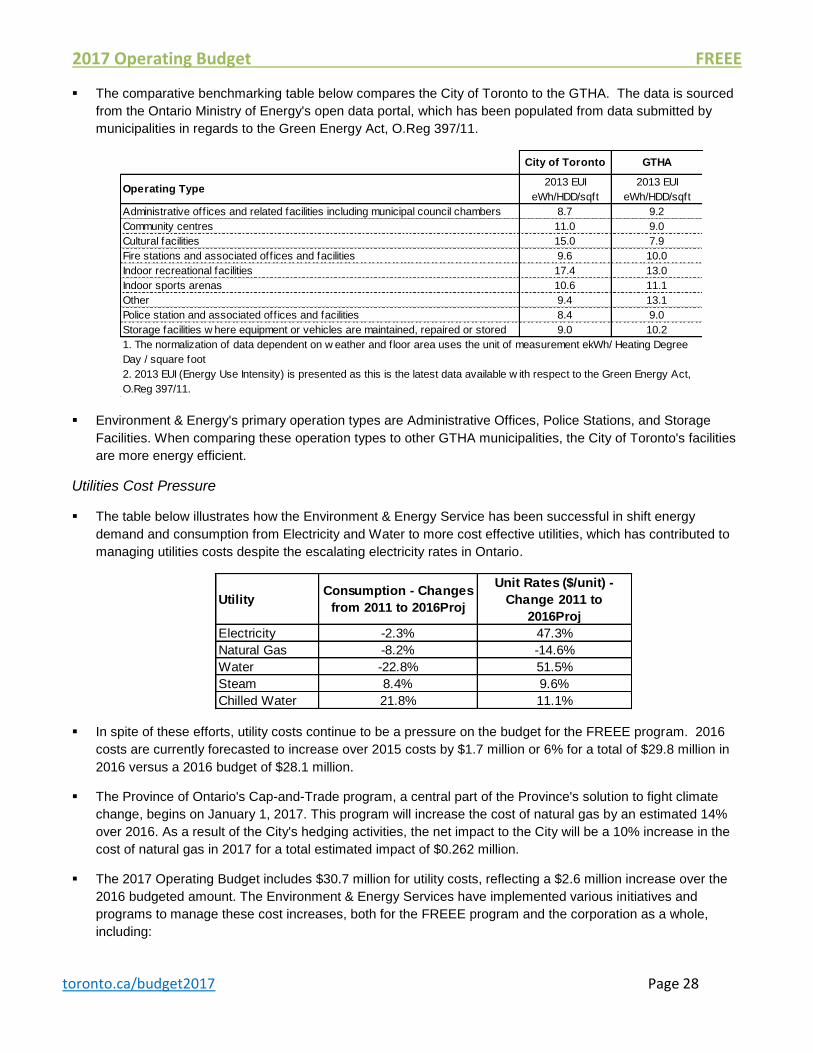
The comparative benchmarking table below compares the City of Toronto to the GTHA. The data is sourced
from the Ontario Ministry of Energy's open data portal, which has been populated from data submitted by
municipalities in regards to the Green Energy Act, O.Reg 397/11.
Environment & Energy's primary operation types are Administrative Offices, Police Stations, and Storage
Facilities. When comparing these operation types to other GTHA municipalities, the City of Toronto's facilities
are more energy efficient.
Utilities Cost Pressure
The table below illustrates how the Environment & Energy Service has been successful in shift energy
demand and consumption from Electricity and Water to more cost effective utilities, which has contributed to
managing utilities costs despite the escalating electricity rates in Ontario.
In spite of these efforts, utility costs continue to be a pressure on the budget for the FREEE program. 2016
costs are currently forecasted to increase over 2015 costs by $1.7 million or 6% for a total of $29.8 million in
2016 versus a 2016 budget of $28.1 million.
The Province of Ontario's Cap-and-Trade program, a central part of the Province's solution to fight climate
change, begins on January 1, 2017. This program will increase the cost of natural gas by an estimated 14%
over 2016. As a result of the City's hedging activities, the net impact to the City will be a 10% increase in the
cost of natural gas in 2017 for a total estimated impact of $0.262 million.
The 2017 Operating Budget includes $30.7 million for utility costs, reflecting a $2.6 million increase over the
2016 budgeted amount. The Environment & Energy Services have implemented various initiatives and
programs to manage these cost increases, both for the FREEE program and the corporation as a whole,
including:
City of Toronto GTHA
Operating Type2013 EUI
eWh/HDD/sqft
2013 EUI
eWh/HDD/sqft
Administrative off ices and related facilities including municipal council chambers 8.7 9.2
Community centres 11.0 9.0
Cultural facilities 15.0 7.9
Fire stations and associated off ices and facilities 9.6 10.0
Indoor recreational facilities 17.4 13.0
Indoor sports arenas 10.6 11.1
Other 9.4 13.1
Police station and associated off ices and facilities 8.4 9.0
Storage facilities w here equipment or vehicles are maintained, repaired or stored 9.0 10.2
1. The normalization of data dependent on w eather and floor area uses the unit of measurement ekWh/ Heating Degree
Day / square foot
2. 2013 EUI (Energy Use Intensity) is presented as this is the latest data available w ith respect to the Green Energy Act,
O.Reg 397/11.
Utility
Consumption - Changes
from 2011 to 2016Proj
Unit Rates ($/unit) -
Change 2011 to
2016Proj
Electricity -2.3% 47.3%
Natural Gas -8.2% -14.6%
Water -22.8% 51.5%
Steam 8.4% 9.6%
Chilled Water 21.8% 11.1%
2017 Operating Budget FREEE
toronto.ca/budget2017 Page 29
Through the Sustainable Energy Plan capital program, the Conservation and Demand Management
Program outlines capital and operational improvements to City facilities to be fully repaid through energy
savings and incentives from the Operating Budgets of City Programs and Agencies as a result of lower
spending in utilities costs.
Building Automation System (BAS) installations to centralize and integrate various building controls,
including environmental controls, scheduled activities during off peak hours and limiting certain activities
during peak hours where possible in order to reduce energy and maintenance costs and optimize building
operating efficiencies.
Renewable energy installation for all City-owned buildings as part of Toronto Green Standard update.
This is one component of an overall plan to increase renewable energy usage in City's facilities through
new buildings or retrofitting and renovating existing facilities.
Strategic energy purchasing and hedging to mitigate the impact of energy price fluctuations on the utilities
budget and spending.
The Environment & Energy Services will continue to deliver on these programs in an effort to manage utility
usage and costs in an environment of rising energy prices.
City Wide Real Estate Review
At its meeting on July 12, 2016, the "City-Wide Real Estate Review" staff report (EX16.4) was submitted for
consideration and adopted by City Council regarding the direction to move to a centralized real estate
operating model, and the development of a transition strategy and implementation plan for a new real estate
entity. http://app.toronto.ca/tmmis/viewAgendaItemHistory.do?item=2016.EX16.4
The City of Toronto, including all its divisions, corporations and agencies, has one of the most significant real
estate portfolios in the country, with holdings conservatively valued at $27 billion including: 6,976 buildings;
106.3 million square feet (9.87 million square metres); and 28,882 acres of leased and owned land.
The City Manager had retained third-party expertise from Deloitte LLP (Deloitte) to conduct a review of city-
wide real estate management and operations. Key findings by Deloitte were:
There is an opportunity for the City to align its real estate operations by creating a new leading edge
centralized real estate entity that consolidates all core real estate and facilities management functions.
A comprehensive plan is required to co-ordinate all City-owned real estate assets and ensure value for
money.
The status quo will not provide the appropriate framework to unlock land value potential and ensure the
strategic use of land and building assets.
The City Manager appointed a Transition team to develop a strategy and a detailed implementation plan,
including new policies and practices, for Council consideration in Q2 2017.
This process includes critical engagement with senior executives and key stakeholders in order to develop a
mandate that considers public policy objectives such as affordable housing, public realm, public transit and
economic development.
Facilities Management Transformation
The Chief Corporate Officer Organization has developed a business model that will enable the City to pursue
new service delivery opportunities. Facilities Management’s reorganization is a part of this new business
model. The previous organizational design was based on a historical district model, and was segregated by
2017 Operating Budget FREEE
toronto.ca/budget2017 Page 30
functional roles and responsibilities, including facilities maintenance/operations, custodial services and capital
project management and delivery. Over time this led to inefficiencies and inconsistencies in service delivery,
as well as redundancy of resources.
The new model that has been established is more client-focused and follows industry best practices. Facilities
Management has been structured in a way that will improve coordination of resources, consistency in service
delivery, and customer service and accountability in delivering maintenance and custodial services.
The creation of the Project Management Office (PMO) will enable the City to provide project management
oversight and expertise across the City. This transformation will also allow for greater ownership and
accountability in achieving service standards by improving reporting and performance measurement.
One of the key challenges faced by Facilities Management while implementing this new business model is
ensuring that service delivery and client satisfaction are not impacted.
Over the last few months, this initiative has been gradually implemented with the client-focused structure in
place. New roles have been defined and created and the leadership team is in place. Facilities Management
is still in the process of transitioning the team in the new client-focused organizational structure and expects
this transformation, and the full benefits of these changes, to be realized by the end of Q1 2018.
Attracting and Retaining Talent
Attracting, developing and retaining staff in a competitive market for talent and managing the loss of
institutional knowledge continues to be a challenge for the FREEE program. The program has put an
emphasis on filing vacancies with a focus on developing internal talent. In an effort to further address this
issue, FREEE, as part of the CCOO, will be investing in developing tools and resources related to employee
recognition and motivation, talent management, career development, succession planning and mentorship
programs.
The FREEE program continues to work with the corporate HR team on innovative and streamlined processes
to attract talent and fill vacancies in the most efficient and effective ways possible. This will be a continued
focus for all units within the FREEE program in 2017.
Issues Impacting Future Years
Resilience to High Impact Extreme Weather Events
Climate change is already impacting built and natural systems across the planet. It is anticipated to impact
key economic sectors and services, water resources, food security and food production systems, human
health, human security, and livelihoods. The broad ranging and often unpredictable impacts of climate change
will have global, regional and ultimately, local consequences.
The Future Weather and Climate Drivers Study, commissioned by the City in 2011, predicts that Toronto will
experience an increase in extreme weather events ranging from more heat waves, more intense rain events
and higher average annual and maximum temperatures.
Toronto has, and is seeing these impacts. For example, the estimated direct cost to the City from the July 8,
2013 rainstorm was just over $70 million, while the Insurance Bureau of Canada reported about $1 billion in
insurance claims.

2017 Operating Budget FREEE
toronto.ca/budget2017 Page 31
It is imperative that the City, it's Agencies and Corporations, private and broader public sector service
providers, businesses and residents continue to work together to address climate change risk and to minimize
the costs and impacts associated with extreme weather events.
At its meeting on November 17, 2016, the "Resilient City - Preparing for a Changing Climate - Status Update
and Next Steps" staff report (PE15.2) was submitted for consideration and adopted by the Parks and
Environment Committee regarding an update on the adoption of a Climate Change Risk Management Policy
by key City Agencies and Corporations, as directed by Council in 2014, to improve Toronto's resilience to
extreme weather for the purposes of reducing or mitigating the risk of damage, injury and emergency
situations. Funding requirements for additional resources will be included in future Operating Budget
submissions of FREEE for Council consideration to deliver on activities associated with the implementation of
the Resilient City initiative, as outlined in the report. These plans will also be impacted by the availability of
funding from the federal and provincial governments.
http://www.toronto.ca/legdocs/mmis/2016/pe/bgrd/backgroundfile-98049.pdf
E&E is leading the production of the TransformTO and Resilient City initiatives. Both reports put forth for
consideration are the result of significant cross-divisional input, community contribution, and expert advice.
District Energy – Development of Low-carbon Thermal Energy Networks
The Province's cap-and-trade legislation will put a price on carbon emissions while generating revenues for
redistribution for investment in projects that reduce carbon emission. The use of low-carbon or renewable
thermal energy networks is a transformational strategy that the City can deploy to help attain its climate
change targets. The City must move forward with a strategy to develop these networks as the province
formulates the rules regarding the dissemination of funds created by the cap-and-trade rules.
The City needs to identify appropriate partners having relevant district energy, renewable energy and Ontario
energy market experience to assist in the advancement of this opportunity. The City intends to identify how to
maximize the value of the opportunity to the City and to describe the structure of any business arrangements
that may emerge from this evaluation
2017 Operating Budget FREEE
toronto.ca/budget2017 Page 32
Appendices
2017 Operating Budget FREEE
toronto.ca/budget2017 Page 33
Appendix 1
2016 Service Performance
Key Service Accomplishments
In 2016, FREEE accomplished the following:
Project Tracking Portal - Launched portal that provides up-to-date project information on scope, schedule,
budget, expenditures and milestones, as well operational and executive reports to manage the FREEE
capital program.
FM Transformation – Implemented new business model, including Project Management Office, which will
enable the City to pursue new service delivery opportunities and provide oversight, management and
expertise for the City in regards to Project Management.
St. Lawrence Market – Continued operations of the farmers market at temporary location while the north
market building is redeveloped
Continued development of the future retail plans at Union Station, with plans to make the Station a
destination for commuters and the local community, post-revitalization. A Summer Market was successfully
launched – creating a cultural hub on Sir John A. Macdonald Square.
Climate change leadership - Working through Council and with the help and cooperation of the Mayor's office
and the C40 organization, facilitated the Mayor’s participation in the C40/COP21 (Climate Change Summit)
in Paris
Rockefeller Foundation's 100 Resilient Cities - Up to $1 million awarded for the creation of a Chief Resilience
Officer and access to tools and other partners to develop a strategy and action plans to increase the
resilience of the City to physical, social and economic challenges.
Clean Toronto Together – 195,000 community participants in Clean Toronto Together, the City’s annual
spring clean-up.
Customer Centre of Excellence - Developed channel and counter strategy, critical for service modernization
and operational effectiveness.
Security Magazine's Top 500 Security Ranking - City of Toronto recognized for the 6th year as one of the top
500 security enterprises; not only rated as the highest Canadian City, but also the highest government entity
in Canada.
City Wide Real Estate Review – Working through the City Manager, developed the report to Council which
outlines the opportunity for the City to align its real estate operations by creating a new leading edge
centralized real estate entity in an effort to consolidate and optimize all core real estate and facilities
management operations and functions over the next two to four years.
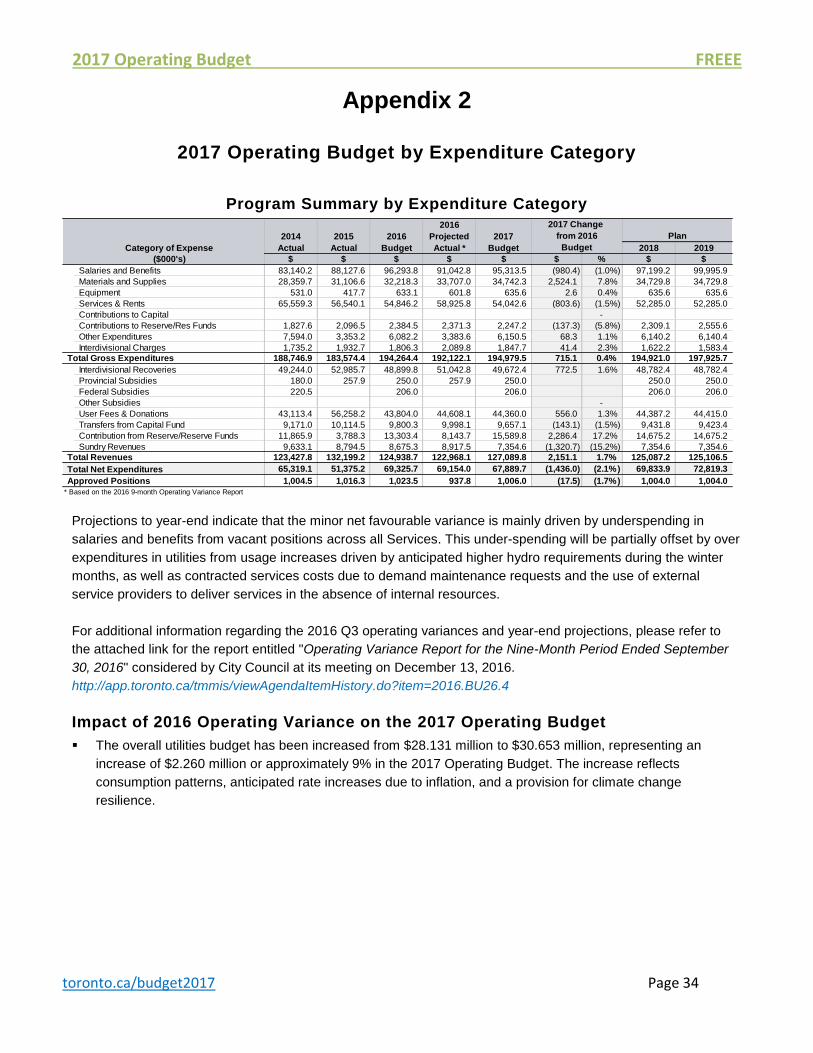
2017 Operating Budget FREEE
toronto.ca/budget2017 Page 34
Appendix 2
2017 Operating Budget by Expenditure Category
Program Summary by Expenditure Category
Projections to year-end indicate that the minor net favourable variance is mainly driven by underspending in
salaries and benefits from vacant positions across all Services. This under-spending will be partially offset by over
expenditures in utilities from usage increases driven by anticipated higher hydro requirements during the winter
months, as well as contracted services costs due to demand maintenance requests and the use of external
service providers to deliver services in the absence of internal resources.
For additional information regarding the 2016 Q3 operating variances and year-end projections, please refer to
the attached link for the report entitled "Operating Variance Report for the Nine-Month Period Ended September
30, 2016" considered by City Council at its meeting on December 13, 2016.
http://app.toronto.ca/tmmis/viewAgendaItemHistory.do?item=2016.BU26.4
Impact of 2016 Operating Variance on the 2017 Operating Budget
The overall utilities budget has been increased from $28.131 million to $30.653 million, representing an
increase of $2.260 million or approximately 9% in the 2017 Operating Budget. The increase reflects
consumption patterns, anticipated rate increases due to inflation, and a provision for climate change
resilience.
2016
2014 2015 2016 Projected 2017
Category of Expense Actual Actual Budget Actual * Budget 2018 2019
($000's) $ $ $ $ $ $ % $ $
Salaries and Benefits 83,140.2 88,127.6 96,293.8 91,042.8 95,313.5 (980.4) (1.0%) 97,199.2 99,995.9
Materials and Supplies 28,359.7 31,106.6 32,218.3 33,707.0 34,742.3 2,524.1 7.8% 34,729.8 34,729.8
Equipment 531.0 417.7 633.1 601.8 635.6 2.6 0.4% 635.6 635.6
Services & Rents 65,559.3 56,540.1 54,846.2 58,925.8 54,042.6 (803.6) (1.5%) 52,285.0 52,285.0
Contributions to Capital -
Contributions to Reserve/Res Funds 1,827.6 2,096.5 2,384.5 2,371.3 2,247.2 (137.3) (5.8%) 2,309.1 2,555.6
Other Expenditures 7,594.0 3,353.2 6,082.2 3,383.6 6,150.5 68.3 1.1% 6,140.2 6,140.4
Interdivisional Charges 1,735.2 1,932.7 1,806.3 2,089.8 1,847.7 41.4 2.3% 1,622.2 1,583.4
Total Gross Expenditures 188,746.9 183,574.4 194,264.4 192,122.1 194,979.5 715.1 0.4% 194,921.0 197,925.7
Interdivisional Recoveries 49,244.0 52,985.7 48,899.8 51,042.8 49,672.4 772.5 1.6% 48,782.4 48,782.4
Provincial Subsidies 180.0 257.9 250.0 257.9 250.0 250.0 250.0
Federal Subsidies 220.5 206.0 206.0 206.0 206.0
Other Subsidies -
User Fees & Donations 43,113.4 56,258.2 43,804.0 44,608.1 44,360.0 556.0 1.3% 44,387.2 44,415.0
Transfers from Capital Fund 9,171.0 10,114.5 9,800.3 9,998.1 9,657.1 (143.1) (1.5%) 9,431.8 9,423.4
Contribution from Reserve/Reserve Funds 11,865.9 3,788.3 13,303.4 8,143.7 15,589.8 2,286.4 17.2% 14,675.2 14,675.2
Sundry Revenues 9,633.1 8,794.5 8,675.3 8,917.5 7,354.6 (1,320.7) (15.2%) 7,354.6 7,354.6
Total Revenues 123,427.8 132,199.2 124,938.7 122,968.1 127,089.8 2,151.1 1.7% 125,087.2 125,106.5
Total Net Expenditures 65,319.1 51,375.2 69,325.7 69,154.0 67,889.7 (1,436.0) (2.1%) 69,833.9 72,819.3
Approved Positions 1,004.5 1,016.3 1,023.5 937.8 1,006.0 (17.5) (1.7%) 1,004.0 1,004.0
* Based on the 2016 9-month Operating Variance Report
2017 Change
from 2016
Budget
Plan
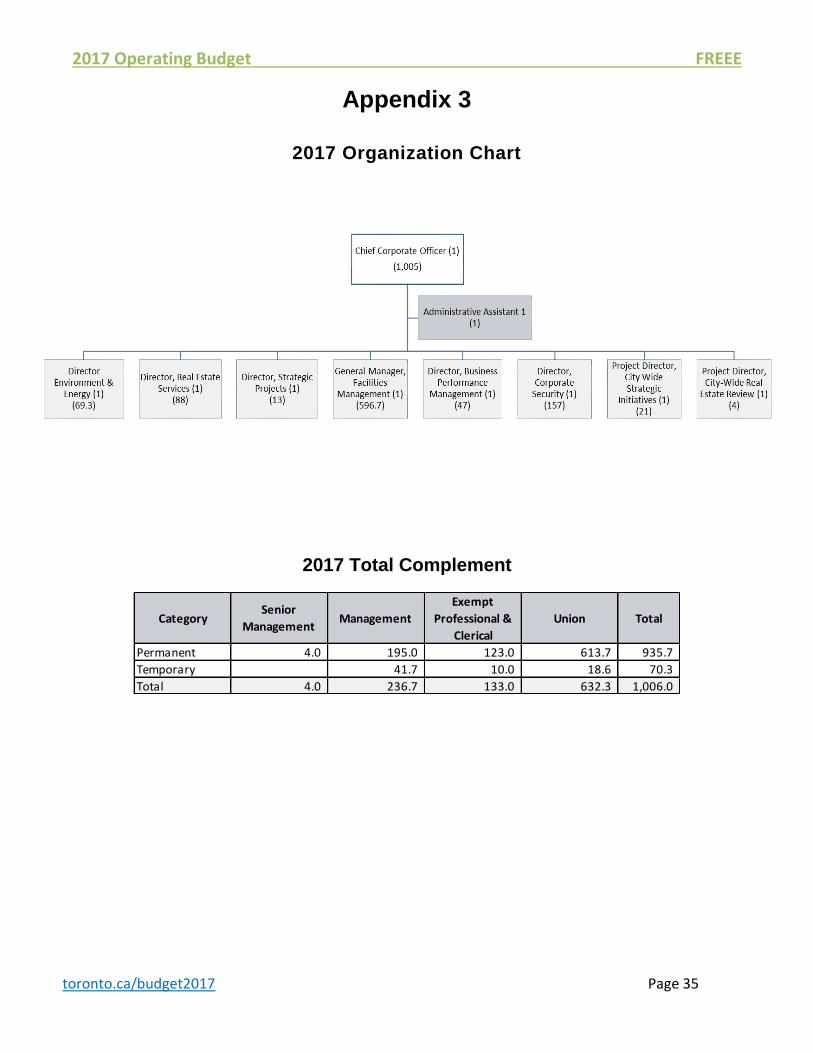
2017 Operating Budget FREEE
toronto.ca/budget2017 Page 35
Appendix 3
2017 Organization Chart
2017 Total Complement
CategorySenior
Management Management
Exempt
Professional &
Clerical
Union Total
Permanent 4.0 195.0 123.0 613.7 935.7
Temporary 41.7 10.0 18.6 70.3
Total 4.0 236.7 133.0 632.3 1,006.0
2017 Operating Budget FREEE
toronto.ca/budget2017 Page 36
Appendix 4
Summary of 2017 Service Changes
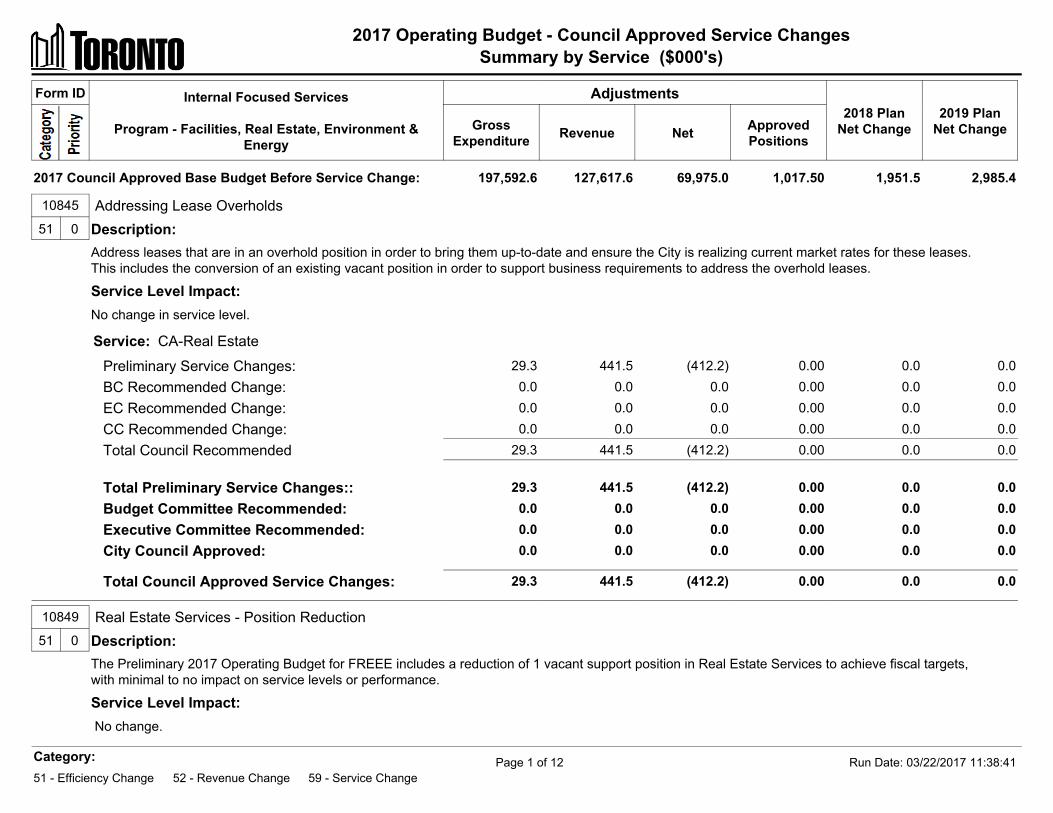
2017 Operating Budget - Council Approved Service ChangesSummary by Service ($000's)
470.76 Service: CA-Real Estate
Preliminary Service Changes: 29.3 441.5 (412.2) 0.00 0.0 0.0 BC Recommended Change: 0.0 0.0 0.0 0.00 0.0 0.0 EC Recommended Change: 0.0 0.0 0.0 0.00 0.0 0.0 CC Recommended Change: 0.0 0.0 0.0 0.00 0.0 0.0 Total Council Recommended 29.3 441.5 (412.2) 0.00 0.0 0.0
10845 Addressing Lease Overholds51 0 Description:
Address leases that are in an overhold position in order to bring them up-to-date and ensure the City is realizing current market rates for these leases.This includes the conversion of an existing vacant position in order to support business requirements to address the overhold leases.
Service Level Impact:No change in service level.
Total Preliminary Service Changes:: 29.3 441.5 (412.2) 0.00 0.0 0.0 Budget Committee Recommended: 0.0 0.0 0.0 0.00 0.0 0.0 Executive Committee Recommended: 0.0 0.0 0.0 0.00 0.0 0.0 City Council Approved: 0.0 0.0 0.0 0.00 0.0 0.0
Total Council Approved Service Changes: 29.3 441.5 (412.2) 0.00 0.0 0.0
10849 Real Estate Services - Position Reduction51 0 Description:
The Preliminary 2017 Operating Budget for FREEE includes a reduction of 1 vacant support position in Real Estate Services to achieve fiscal targets,with minimal to no impact on service levels or performance.
Service Level Impact: No change.
Form ID Internal Focused Services
Program - Facilities, Real Estate, Environment &Energy
Adjustments2018 Plan
Net Change2019 Plan
Net ChangeGrossExpenditure Revenue Net Approved
Positions
2017 Council Approved Base Budget Before Service Change: 197,592.6 127,617.6 69,975.0 1,017.50 1,951.5 2,985.4
Category:51 - Efficiency Change 52 - Revenue Change 59 - Service Change
Run Date: 03/22/2017 11:38:41Page 1 of 12
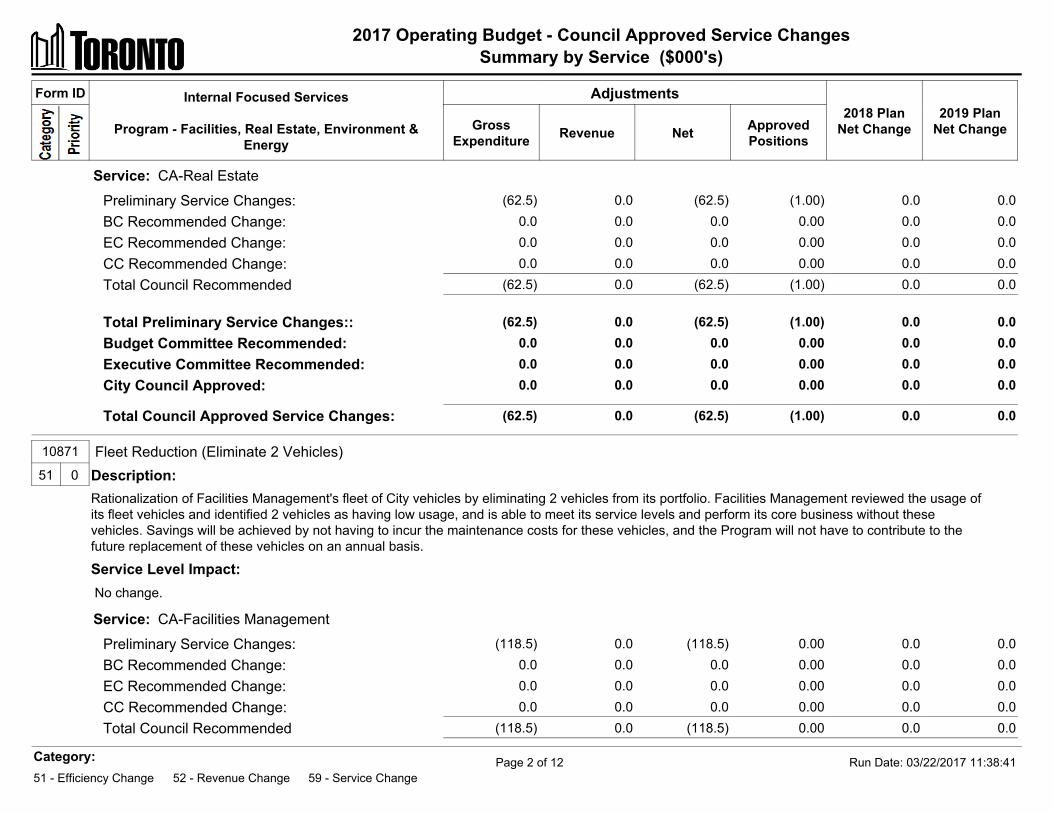
2017 Operating Budget - Council Approved Service ChangesSummary by Service ($000's)
-63.55 Service: CA-Real Estate
Preliminary Service Changes: (62.5) 0.0 (62.5) (1.00) 0.0 0.0 BC Recommended Change: 0.0 0.0 0.0 0.00 0.0 0.0 EC Recommended Change: 0.0 0.0 0.0 0.00 0.0 0.0 CC Recommended Change: 0.0 0.0 0.0 0.00 0.0 0.0 Total Council Recommended (62.5) 0.0 (62.5) (1.00) 0.0 0.0
Total Preliminary Service Changes:: (62.5) 0.0 (62.5) (1.00) 0.0 0.0 Budget Committee Recommended: 0.0 0.0 0.0 0.00 0.0 0.0 Executive Committee Recommended: 0.0 0.0 0.0 0.00 0.0 0.0 City Council Approved: 0.0 0.0 0.0 0.00 0.0 0.0
Total Council Approved Service Changes: (62.5) 0.0 (62.5) (1.00) 0.0 0.0
-118.49 Service: CA-Facilities Management
Preliminary Service Changes: (118.5) 0.0 (118.5) 0.00 0.0 0.0 BC Recommended Change: 0.0 0.0 0.0 0.00 0.0 0.0 EC Recommended Change: 0.0 0.0 0.0 0.00 0.0 0.0 CC Recommended Change: 0.0 0.0 0.0 0.00 0.0 0.0 Total Council Recommended (118.5) 0.0 (118.5) 0.00 0.0 0.0
10871 Fleet Reduction (Eliminate 2 Vehicles)51 0 Description:
Rationalization of Facilities Management's fleet of City vehicles by eliminating 2 vehicles from its portfolio. Facilities Management reviewed the usage ofits fleet vehicles and identified 2 vehicles as having low usage, and is able to meet its service levels and perform its core business without thesevehicles. Savings will be achieved by not having to incur the maintenance costs for these vehicles, and the Program will not have to contribute to thefuture replacement of these vehicles on an annual basis.
Service Level Impact: No change.
Form ID Internal Focused Services
Program - Facilities, Real Estate, Environment &Energy
Adjustments2018 Plan
Net Change2019 Plan
Net ChangeGrossExpenditure Revenue Net Approved
Positions
Category:51 - Efficiency Change 52 - Revenue Change 59 - Service Change
Run Date: 03/22/2017 11:38:41Page 2 of 12
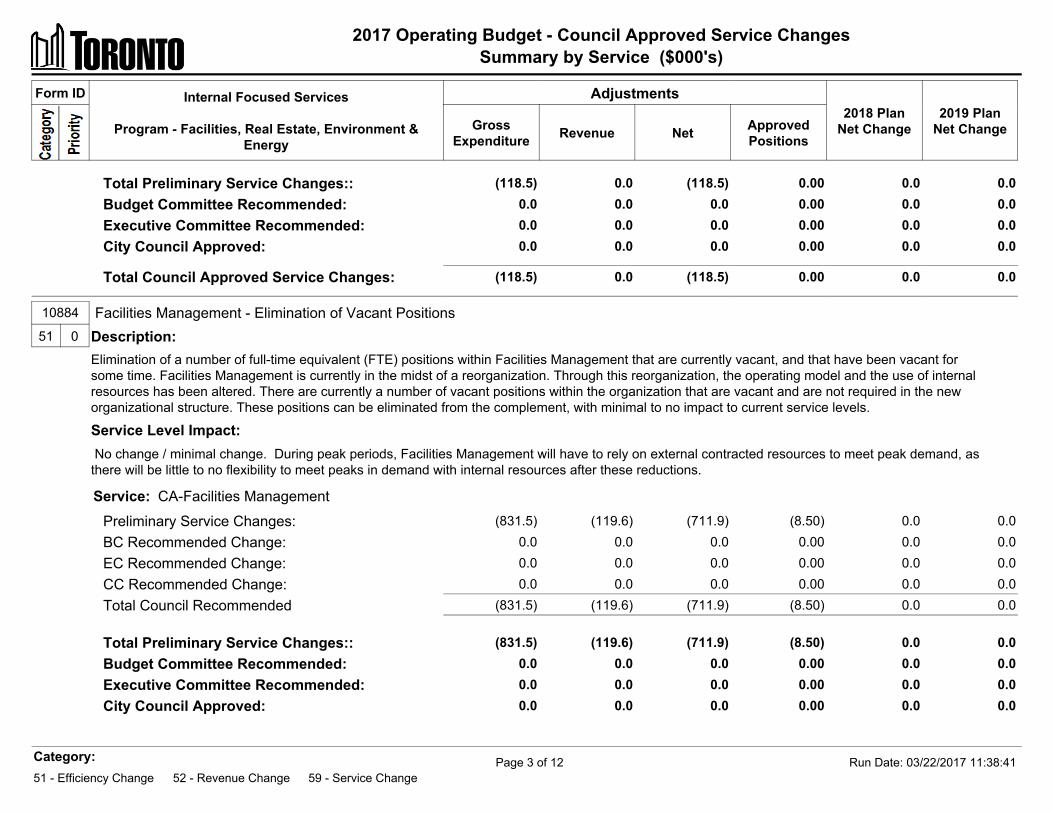
2017 Operating Budget - Council Approved Service ChangesSummary by Service ($000's)
Total Preliminary Service Changes:: (118.5) 0.0 (118.5) 0.00 0.0 0.0 Budget Committee Recommended: 0.0 0.0 0.0 0.00 0.0 0.0 Executive Committee Recommended: 0.0 0.0 0.0 0.00 0.0 0.0 City Council Approved: 0.0 0.0 0.0 0.00 0.0 0.0
Total Council Approved Service Changes: (118.5) 0.0 (118.5) 0.00 0.0 0.0
-959.57 Service: CA-Facilities Management
Preliminary Service Changes: (831.5) (119.6) (711.9) (8.50) 0.0 0.0 BC Recommended Change: 0.0 0.0 0.0 0.00 0.0 0.0 EC Recommended Change: 0.0 0.0 0.0 0.00 0.0 0.0 CC Recommended Change: 0.0 0.0 0.0 0.00 0.0 0.0 Total Council Recommended (831.5) (119.6) (711.9) (8.50) 0.0 0.0
10884 Facilities Management - Elimination of Vacant Positions51 0 Description:
Elimination of a number of full-time equivalent (FTE) positions within Facilities Management that are currently vacant, and that have been vacant forsome time. Facilities Management is currently in the midst of a reorganization. Through this reorganization, the operating model and the use of internalresources has been altered. There are currently a number of vacant positions within the organization that are vacant and are not required in the neworganizational structure. These positions can be eliminated from the complement, with minimal to no impact to current service levels.
Service Level Impact: No change / minimal change. During peak periods, Facilities Management will have to rely on external contracted resources to meet peak demand, asthere will be little to no flexibility to meet peaks in demand with internal resources after these reductions.
Total Preliminary Service Changes:: (831.5) (119.6) (711.9) (8.50) 0.0 0.0 Budget Committee Recommended: 0.0 0.0 0.0 0.00 0.0 0.0 Executive Committee Recommended: 0.0 0.0 0.0 0.00 0.0 0.0 City Council Approved: 0.0 0.0 0.0 0.00 0.0 0.0
Form ID Internal Focused Services
Program - Facilities, Real Estate, Environment &Energy
Adjustments2018 Plan
Net Change2019 Plan
Net ChangeGrossExpenditure Revenue Net Approved
Positions
Category:51 - Efficiency Change 52 - Revenue Change 59 - Service Change
Run Date: 03/22/2017 11:38:41Page 3 of 12
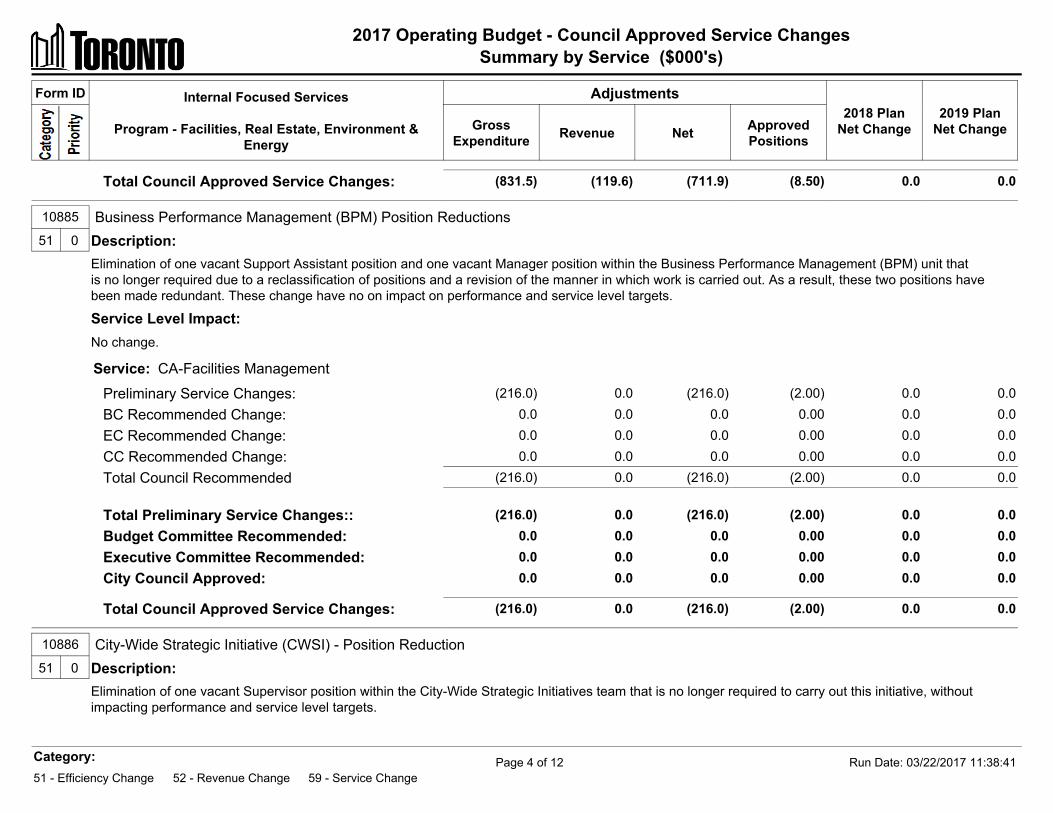
2017 Operating Budget - Council Approved Service ChangesSummary by Service ($000's)
Total Council Approved Service Changes: (831.5) (119.6) (711.9) (8.50) 0.0 0.0
-218 Service: CA-Facilities Management
Preliminary Service Changes: (216.0) 0.0 (216.0) (2.00) 0.0 0.0 BC Recommended Change: 0.0 0.0 0.0 0.00 0.0 0.0 EC Recommended Change: 0.0 0.0 0.0 0.00 0.0 0.0 CC Recommended Change: 0.0 0.0 0.0 0.00 0.0 0.0 Total Council Recommended (216.0) 0.0 (216.0) (2.00) 0.0 0.0
10885 Business Performance Management (BPM) Position Reductions51 0 Description:
Elimination of one vacant Support Assistant position and one vacant Manager position within the Business Performance Management (BPM) unit thatis no longer required due to a reclassification of positions and a revision of the manner in which work is carried out. As a result, these two positions havebeen made redundant. These change have no on impact on performance and service level targets.
Service Level Impact:No change.
Total Preliminary Service Changes:: (216.0) 0.0 (216.0) (2.00) 0.0 0.0 Budget Committee Recommended: 0.0 0.0 0.0 0.00 0.0 0.0 Executive Committee Recommended: 0.0 0.0 0.0 0.00 0.0 0.0 City Council Approved: 0.0 0.0 0.0 0.00 0.0 0.0
Total Council Approved Service Changes: (216.0) 0.0 (216.0) (2.00) 0.0 0.0
10886 City-Wide Strategic Initiative (CWSI) - Position Reduction51 0 Description:
Elimination of one vacant Supervisor position within the City-Wide Strategic Initiatives team that is no longer required to carry out this initiative, withoutimpacting performance and service level targets.
Form ID Internal Focused Services
Program - Facilities, Real Estate, Environment &Energy
Adjustments2018 Plan
Net Change2019 Plan
Net ChangeGrossExpenditure Revenue Net Approved
Positions
Category:51 - Efficiency Change 52 - Revenue Change 59 - Service Change
Run Date: 03/22/2017 11:38:41Page 4 of 12
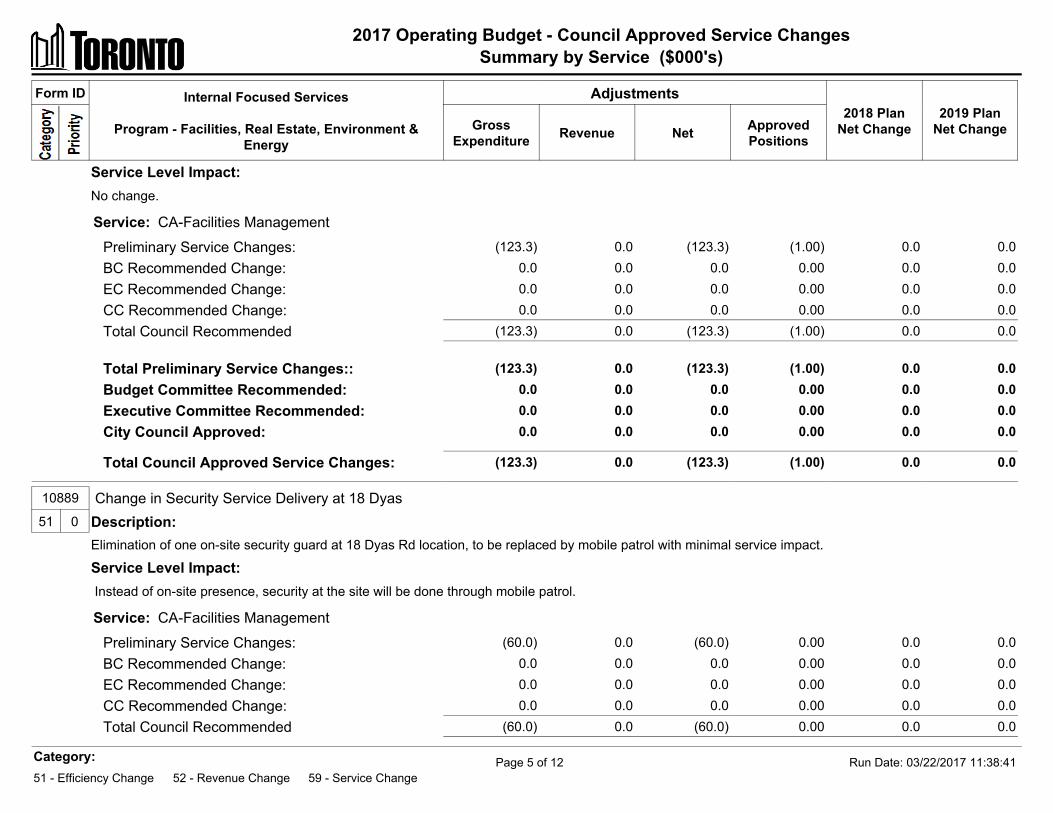
2017 Operating Budget - Council Approved Service ChangesSummary by Service ($000's)
-124.32 Service: CA-Facilities Management
Preliminary Service Changes: (123.3) 0.0 (123.3) (1.00) 0.0 0.0 BC Recommended Change: 0.0 0.0 0.0 0.00 0.0 0.0 EC Recommended Change: 0.0 0.0 0.0 0.00 0.0 0.0 CC Recommended Change: 0.0 0.0 0.0 0.00 0.0 0.0 Total Council Recommended (123.3) 0.0 (123.3) (1.00) 0.0 0.0
Service Level Impact:No change.
Total Preliminary Service Changes:: (123.3) 0.0 (123.3) (1.00) 0.0 0.0 Budget Committee Recommended: 0.0 0.0 0.0 0.00 0.0 0.0 Executive Committee Recommended: 0.0 0.0 0.0 0.00 0.0 0.0 City Council Approved: 0.0 0.0 0.0 0.00 0.0 0.0
Total Council Approved Service Changes: (123.3) 0.0 (123.3) (1.00) 0.0 0.0
-60 Service: CA-Facilities Management
Preliminary Service Changes: (60.0) 0.0 (60.0) 0.00 0.0 0.0 BC Recommended Change: 0.0 0.0 0.0 0.00 0.0 0.0 EC Recommended Change: 0.0 0.0 0.0 0.00 0.0 0.0 CC Recommended Change: 0.0 0.0 0.0 0.00 0.0 0.0 Total Council Recommended (60.0) 0.0 (60.0) 0.00 0.0 0.0
10889 Change in Security Service Delivery at 18 Dyas51 0 Description:
Elimination of one on-site security guard at 18 Dyas Rd location, to be replaced by mobile patrol with minimal service impact.
Service Level Impact: Instead of on-site presence, security at the site will be done through mobile patrol.
Form ID Internal Focused Services
Program - Facilities, Real Estate, Environment &Energy
Adjustments2018 Plan
Net Change2019 Plan
Net ChangeGrossExpenditure Revenue Net Approved
Positions
Category:51 - Efficiency Change 52 - Revenue Change 59 - Service Change
Run Date: 03/22/2017 11:38:41Page 5 of 12
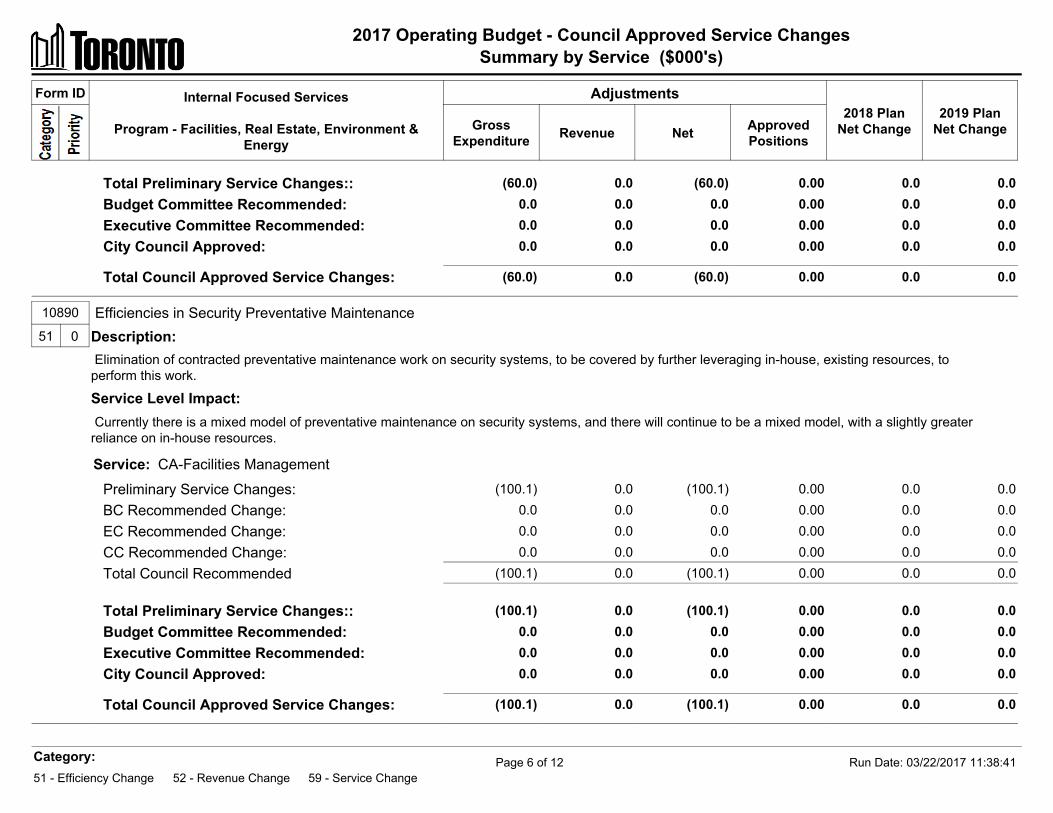
2017 Operating Budget - Council Approved Service ChangesSummary by Service ($000's)
Total Preliminary Service Changes:: (60.0) 0.0 (60.0) 0.00 0.0 0.0 Budget Committee Recommended: 0.0 0.0 0.0 0.00 0.0 0.0 Executive Committee Recommended: 0.0 0.0 0.0 0.00 0.0 0.0 City Council Approved: 0.0 0.0 0.0 0.00 0.0 0.0
Total Council Approved Service Changes: (60.0) 0.0 (60.0) 0.00 0.0 0.0
-100.11 Service: CA-Facilities Management
Preliminary Service Changes: (100.1) 0.0 (100.1) 0.00 0.0 0.0 BC Recommended Change: 0.0 0.0 0.0 0.00 0.0 0.0 EC Recommended Change: 0.0 0.0 0.0 0.00 0.0 0.0 CC Recommended Change: 0.0 0.0 0.0 0.00 0.0 0.0 Total Council Recommended (100.1) 0.0 (100.1) 0.00 0.0 0.0
10890 Efficiencies in Security Preventative Maintenance51 0 Description:
Elimination of contracted preventative maintenance work on security systems, to be covered by further leveraging in-house, existing resources, toperform this work.
Service Level Impact: Currently there is a mixed model of preventative maintenance on security systems, and there will continue to be a mixed model, with a slightly greaterreliance on in-house resources.
Total Preliminary Service Changes:: (100.1) 0.0 (100.1) 0.00 0.0 0.0 Budget Committee Recommended: 0.0 0.0 0.0 0.00 0.0 0.0 Executive Committee Recommended: 0.0 0.0 0.0 0.00 0.0 0.0 City Council Approved: 0.0 0.0 0.0 0.00 0.0 0.0
Total Council Approved Service Changes: (100.1) 0.0 (100.1) 0.00 0.0 0.0
Form ID Internal Focused Services
Program - Facilities, Real Estate, Environment &Energy
Adjustments2018 Plan
Net Change2019 Plan
Net ChangeGrossExpenditure Revenue Net Approved
Positions
Category:51 - Efficiency Change 52 - Revenue Change 59 - Service Change
Run Date: 03/22/2017 11:38:41Page 6 of 12
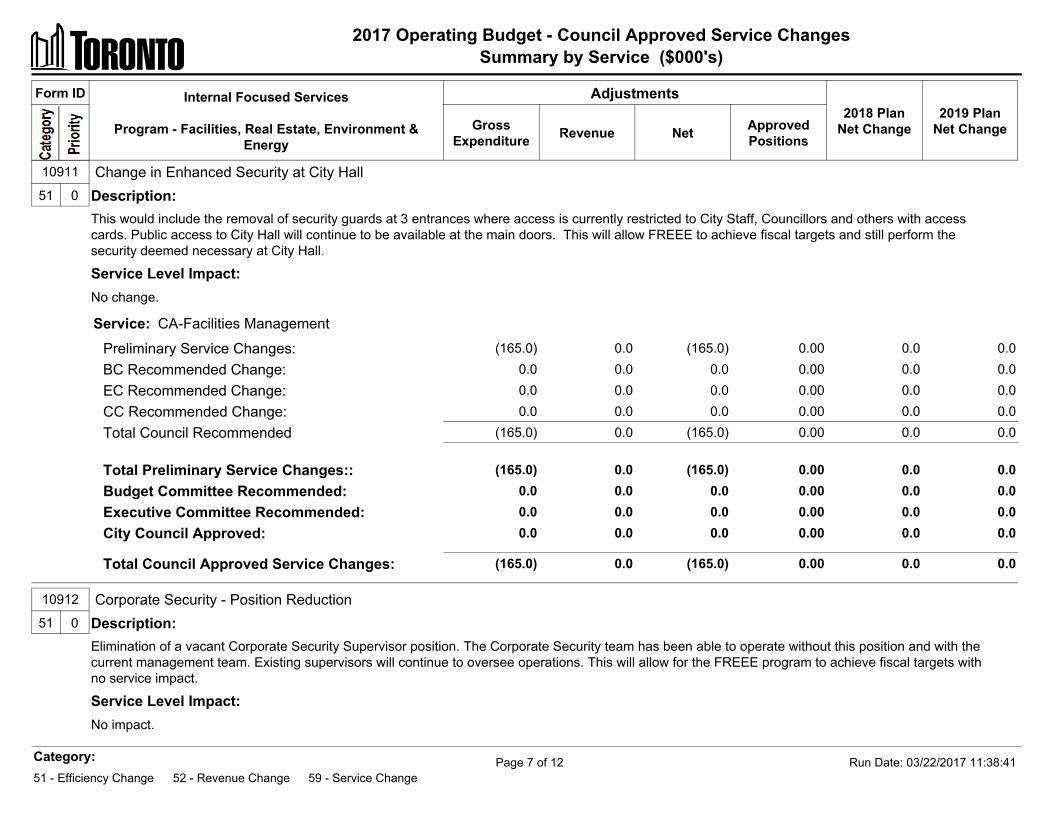
2017 Operating Budget - Council Approved Service ChangesSummary by Service ($000's)
-165 Service: CA-Facilities Management
Preliminary Service Changes: (165.0) 0.0 (165.0) 0.00 0.0 0.0 BC Recommended Change: 0.0 0.0 0.0 0.00 0.0 0.0 EC Recommended Change: 0.0 0.0 0.0 0.00 0.0 0.0 CC Recommended Change: 0.0 0.0 0.0 0.00 0.0 0.0 Total Council Recommended (165.0) 0.0 (165.0) 0.00 0.0 0.0
10911 Change in Enhanced Security at City Hall51 0 Description:
This would include the removal of security guards at 3 entrances where access is currently restricted to City Staff, Councillors and others with accesscards. Public access to City Hall will continue to be available at the main doors. This will allow FREEE to achieve fiscal targets and still perform thesecurity deemed necessary at City Hall.
Service Level Impact:No change.
Total Preliminary Service Changes:: (165.0) 0.0 (165.0) 0.00 0.0 0.0 Budget Committee Recommended: 0.0 0.0 0.0 0.00 0.0 0.0 Executive Committee Recommended: 0.0 0.0 0.0 0.00 0.0 0.0 City Council Approved: 0.0 0.0 0.0 0.00 0.0 0.0
Total Council Approved Service Changes: (165.0) 0.0 (165.0) 0.00 0.0 0.0
10912 Corporate Security - Position Reduction51 0 Description:
Elimination of a vacant Corporate Security Supervisor position. The Corporate Security team has been able to operate without this position and with thecurrent management team. Existing supervisors will continue to oversee operations. This will allow for the FREEE program to achieve fiscal targets withno service impact.
Service Level Impact:No impact.
Form ID Internal Focused Services
Program - Facilities, Real Estate, Environment &Energy
Adjustments2018 Plan
Net Change2019 Plan
Net ChangeGrossExpenditure Revenue Net Approved
Positions
Category:51 - Efficiency Change 52 - Revenue Change 59 - Service Change
Run Date: 03/22/2017 11:38:41Page 7 of 12
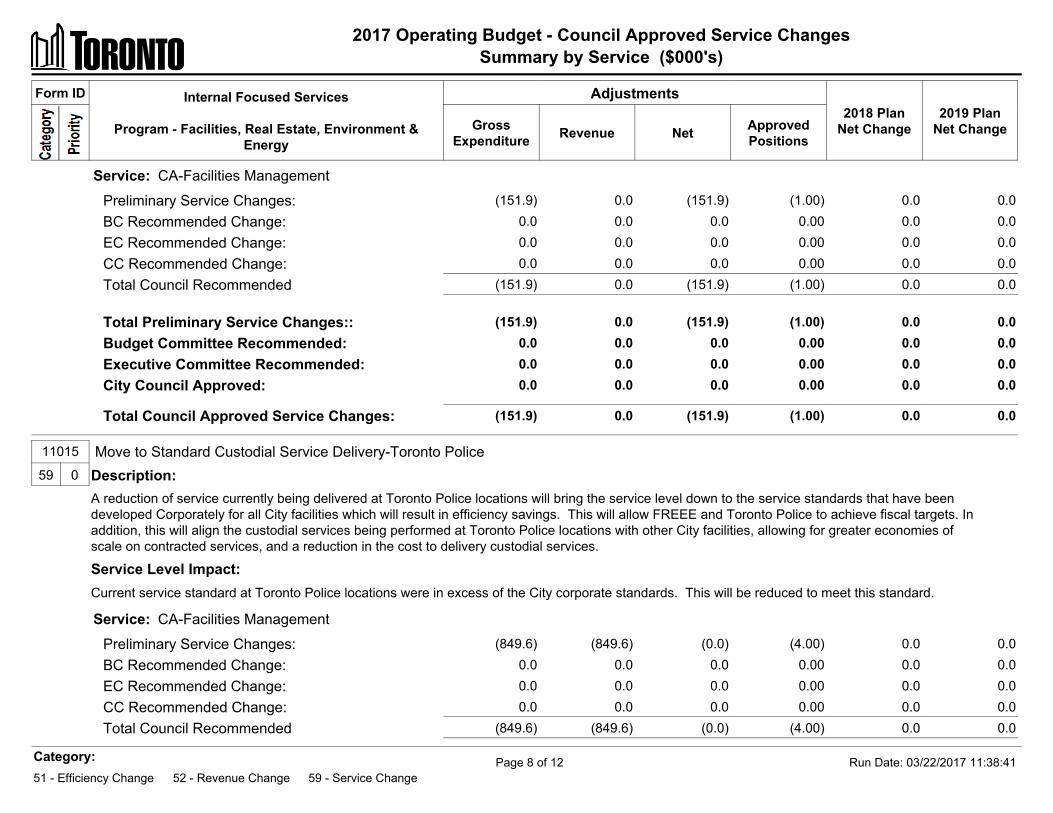
2017 Operating Budget - Council Approved Service ChangesSummary by Service ($000's)
-152.93 Service: CA-Facilities Management
Preliminary Service Changes: (151.9) 0.0 (151.9) (1.00) 0.0 0.0 BC Recommended Change: 0.0 0.0 0.0 0.00 0.0 0.0 EC Recommended Change: 0.0 0.0 0.0 0.00 0.0 0.0 CC Recommended Change: 0.0 0.0 0.0 0.00 0.0 0.0 Total Council Recommended (151.9) 0.0 (151.9) (1.00) 0.0 0.0
Total Preliminary Service Changes:: (151.9) 0.0 (151.9) (1.00) 0.0 0.0 Budget Committee Recommended: 0.0 0.0 0.0 0.00 0.0 0.0 Executive Committee Recommended: 0.0 0.0 0.0 0.00 0.0 0.0 City Council Approved: 0.0 0.0 0.0 0.00 0.0 0.0
Total Council Approved Service Changes: (151.9) 0.0 (151.9) (1.00) 0.0 0.0
-1,703.2 Service: CA-Facilities Management
Preliminary Service Changes: (849.6) (849.6) (0.0) (4.00) 0.0 0.0 BC Recommended Change: 0.0 0.0 0.0 0.00 0.0 0.0 EC Recommended Change: 0.0 0.0 0.0 0.00 0.0 0.0 CC Recommended Change: 0.0 0.0 0.0 0.00 0.0 0.0 Total Council Recommended (849.6) (849.6) (0.0) (4.00) 0.0 0.0
11015 Move to Standard Custodial Service Delivery-Toronto Police59 0 Description:
A reduction of service currently being delivered at Toronto Police locations will bring the service level down to the service standards that have beendeveloped Corporately for all City facilities which will result in efficiency savings. This will allow FREEE and Toronto Police to achieve fiscal targets. Inaddition, this will align the custodial services being performed at Toronto Police locations with other City facilities, allowing for greater economies ofscale on contracted services, and a reduction in the cost to delivery custodial services.
Service Level Impact:Current service standard at Toronto Police locations were in excess of the City corporate standards. This will be reduced to meet this standard.
Form ID Internal Focused Services
Program - Facilities, Real Estate, Environment &Energy
Adjustments2018 Plan
Net Change2019 Plan
Net ChangeGrossExpenditure Revenue Net Approved
Positions
Category:51 - Efficiency Change 52 - Revenue Change 59 - Service Change
Run Date: 03/22/2017 11:38:41Page 8 of 12
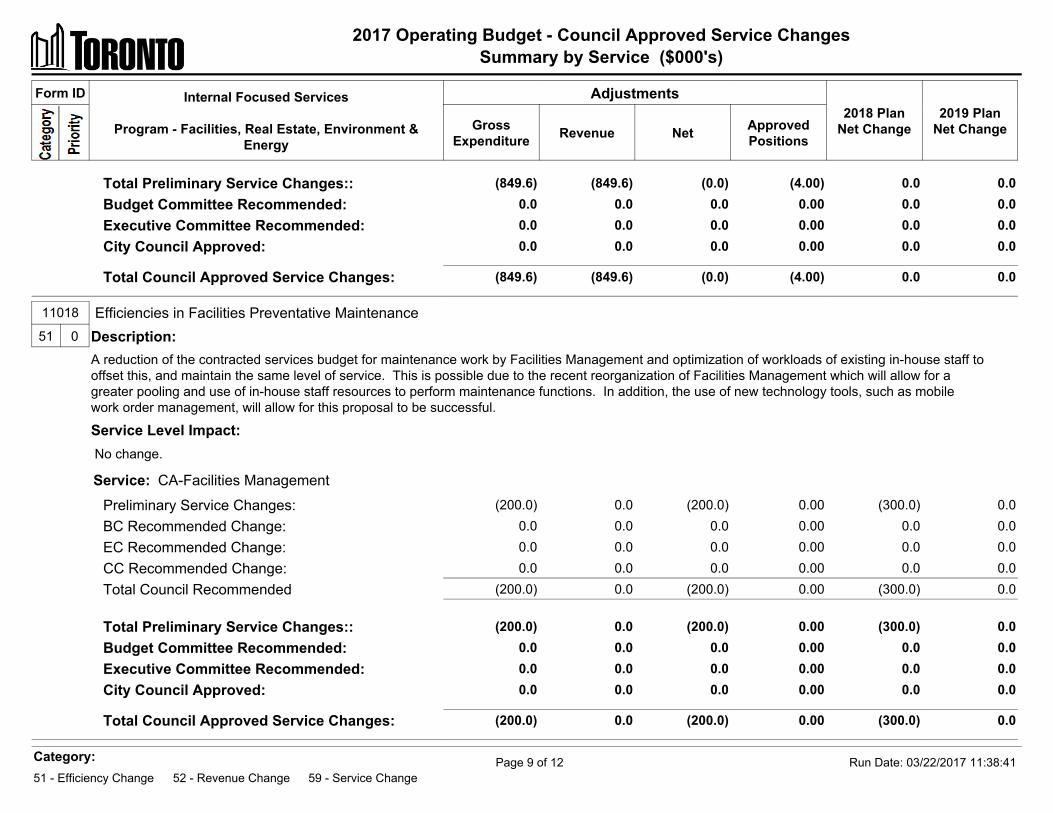
2017 Operating Budget - Council Approved Service ChangesSummary by Service ($000's)
Total Preliminary Service Changes:: (849.6) (849.6) (0.0) (4.00) 0.0 0.0 Budget Committee Recommended: 0.0 0.0 0.0 0.00 0.0 0.0 Executive Committee Recommended: 0.0 0.0 0.0 0.00 0.0 0.0 City Council Approved: 0.0 0.0 0.0 0.00 0.0 0.0
Total Council Approved Service Changes: (849.6) (849.6) (0.0) (4.00) 0.0 0.0
-500 Service: CA-Facilities Management
Preliminary Service Changes: (200.0) 0.0 (200.0) 0.00 (300.0) 0.0 BC Recommended Change: 0.0 0.0 0.0 0.00 0.0 0.0 EC Recommended Change: 0.0 0.0 0.0 0.00 0.0 0.0 CC Recommended Change: 0.0 0.0 0.0 0.00 0.0 0.0 Total Council Recommended (200.0) 0.0 (200.0) 0.00 (300.0) 0.0
11018 Efficiencies in Facilities Preventative Maintenance51 0 Description:
A reduction of the contracted services budget for maintenance work by Facilities Management and optimization of workloads of existing in-house staff tooffset this, and maintain the same level of service. This is possible due to the recent reorganization of Facilities Management which will allow for agreater pooling and use of in-house staff resources to perform maintenance functions. In addition, the use of new technology tools, such as mobilework order management, will allow for this proposal to be successful.
Service Level Impact: No change.
Total Preliminary Service Changes:: (200.0) 0.0 (200.0) 0.00 (300.0) 0.0 Budget Committee Recommended: 0.0 0.0 0.0 0.00 0.0 0.0 Executive Committee Recommended: 0.0 0.0 0.0 0.00 0.0 0.0 City Council Approved: 0.0 0.0 0.0 0.00 0.0 0.0
Total Council Approved Service Changes: (200.0) 0.0 (200.0) 0.00 (300.0) 0.0
Form ID Internal Focused Services
Program - Facilities, Real Estate, Environment &Energy
Adjustments2018 Plan
Net Change2019 Plan
Net ChangeGrossExpenditure Revenue Net Approved
Positions
Category:51 - Efficiency Change 52 - Revenue Change 59 - Service Change
Run Date: 03/22/2017 11:38:41Page 9 of 12
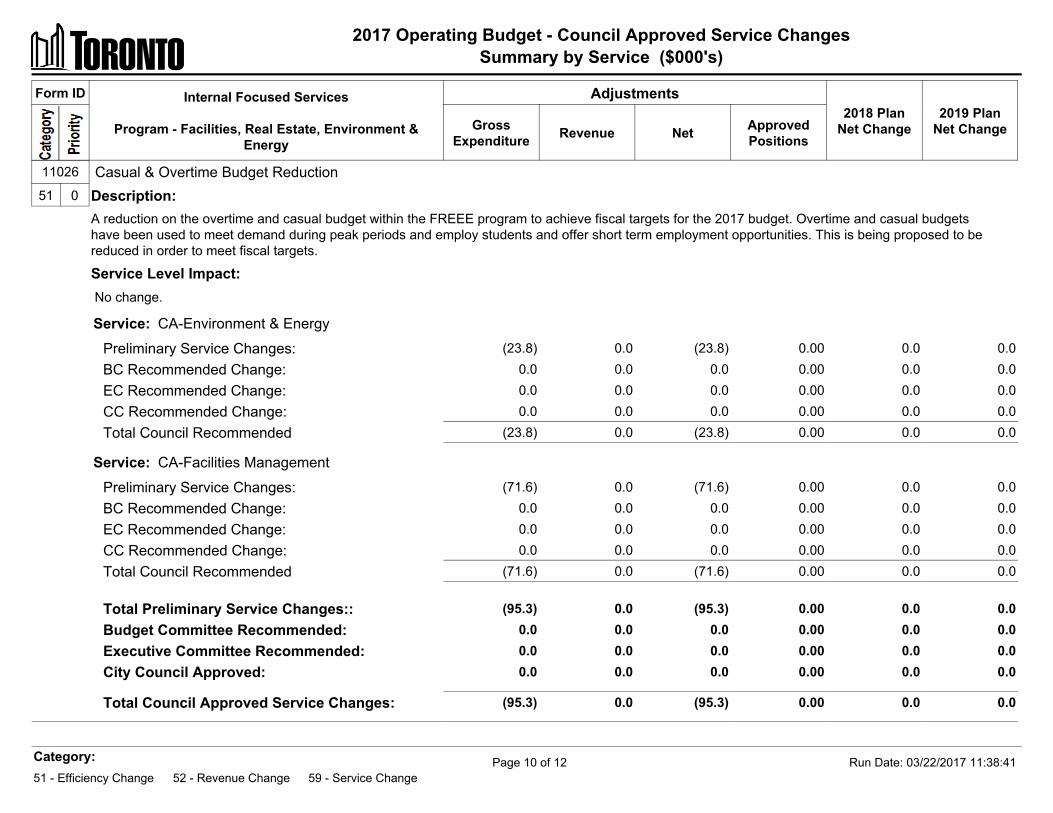
2017 Operating Budget - Council Approved Service ChangesSummary by Service ($000's)
-23.77 Service: CA-Environment & Energy
Preliminary Service Changes: (23.8) 0.0 (23.8) 0.00 0.0 0.0 BC Recommended Change: 0.0 0.0 0.0 0.00 0.0 0.0 EC Recommended Change: 0.0 0.0 0.0 0.00 0.0 0.0 CC Recommended Change: 0.0 0.0 0.0 0.00 0.0 0.0 Total Council Recommended (23.8) 0.0 (23.8) 0.00 0.0 0.0
-71.56 Service: CA-Facilities Management
Preliminary Service Changes: (71.6) 0.0 (71.6) 0.00 0.0 0.0 BC Recommended Change: 0.0 0.0 0.0 0.00 0.0 0.0 EC Recommended Change: 0.0 0.0 0.0 0.00 0.0 0.0 CC Recommended Change: 0.0 0.0 0.0 0.00 0.0 0.0 Total Council Recommended (71.6) 0.0 (71.6) 0.00 0.0 0.0
11026 Casual & Overtime Budget Reduction51 0 Description:
A reduction on the overtime and casual budget within the FREEE program to achieve fiscal targets for the 2017 budget. Overtime and casual budgetshave been used to meet demand during peak periods and employ students and offer short term employment opportunities. This is being proposed to bereduced in order to meet fiscal targets.
Service Level Impact: No change.
Total Preliminary Service Changes:: (95.3) 0.0 (95.3) 0.00 0.0 0.0 Budget Committee Recommended: 0.0 0.0 0.0 0.00 0.0 0.0 Executive Committee Recommended: 0.0 0.0 0.0 0.00 0.0 0.0 City Council Approved: 0.0 0.0 0.0 0.00 0.0 0.0
Total Council Approved Service Changes: (95.3) 0.0 (95.3) 0.00 0.0 0.0
Form ID Internal Focused Services
Program - Facilities, Real Estate, Environment &Energy
Adjustments2018 Plan
Net Change2019 Plan
Net ChangeGrossExpenditure Revenue Net Approved
Positions
Category:51 - Efficiency Change 52 - Revenue Change 59 - Service Change
Run Date: 03/22/2017 11:38:41Page 10 of 12
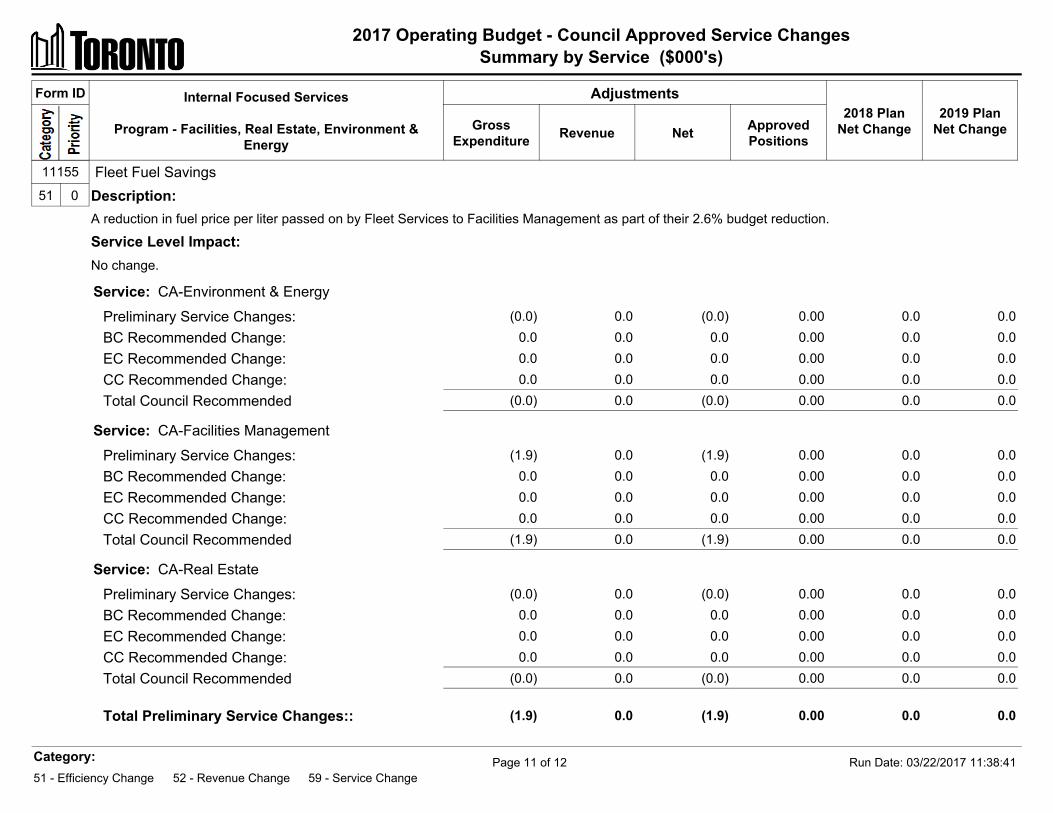
2017 Operating Budget - Council Approved Service ChangesSummary by Service ($000's)
0 Service: CA-Environment & Energy
Preliminary Service Changes: (0.0) 0.0 (0.0) 0.00 0.0 0.0 BC Recommended Change: 0.0 0.0 0.0 0.00 0.0 0.0 EC Recommended Change: 0.0 0.0 0.0 0.00 0.0 0.0 CC Recommended Change: 0.0 0.0 0.0 0.00 0.0 0.0 Total Council Recommended (0.0) 0.0 (0.0) 0.00 0.0 0.0
-1.9 Service: CA-Facilities Management
Preliminary Service Changes: (1.9) 0.0 (1.9) 0.00 0.0 0.0 BC Recommended Change: 0.0 0.0 0.0 0.00 0.0 0.0 EC Recommended Change: 0.0 0.0 0.0 0.00 0.0 0.0 CC Recommended Change: 0.0 0.0 0.0 0.00 0.0 0.0 Total Council Recommended (1.9) 0.0 (1.9) 0.00 0.0 0.0
-0.01 Service: CA-Real Estate
Preliminary Service Changes: (0.0) 0.0 (0.0) 0.00 0.0 0.0 BC Recommended Change: 0.0 0.0 0.0 0.00 0.0 0.0 EC Recommended Change: 0.0 0.0 0.0 0.00 0.0 0.0 CC Recommended Change: 0.0 0.0 0.0 0.00 0.0 0.0 Total Council Recommended (0.0) 0.0 (0.0) 0.00 0.0 0.0
11155 Fleet Fuel Savings51 0 Description:
A reduction in fuel price per liter passed on by Fleet Services to Facilities Management as part of their 2.6% budget reduction.
Service Level Impact:No change.
Total Preliminary Service Changes:: (1.9) 0.0 (1.9) 0.00 0.0 0.0
Form ID Internal Focused Services
Program - Facilities, Real Estate, Environment &Energy
Adjustments2018 Plan
Net Change2019 Plan
Net ChangeGrossExpenditure Revenue Net Approved
Positions
Category:51 - Efficiency Change 52 - Revenue Change 59 - Service Change
Run Date: 03/22/2017 11:38:41Page 11 of 12
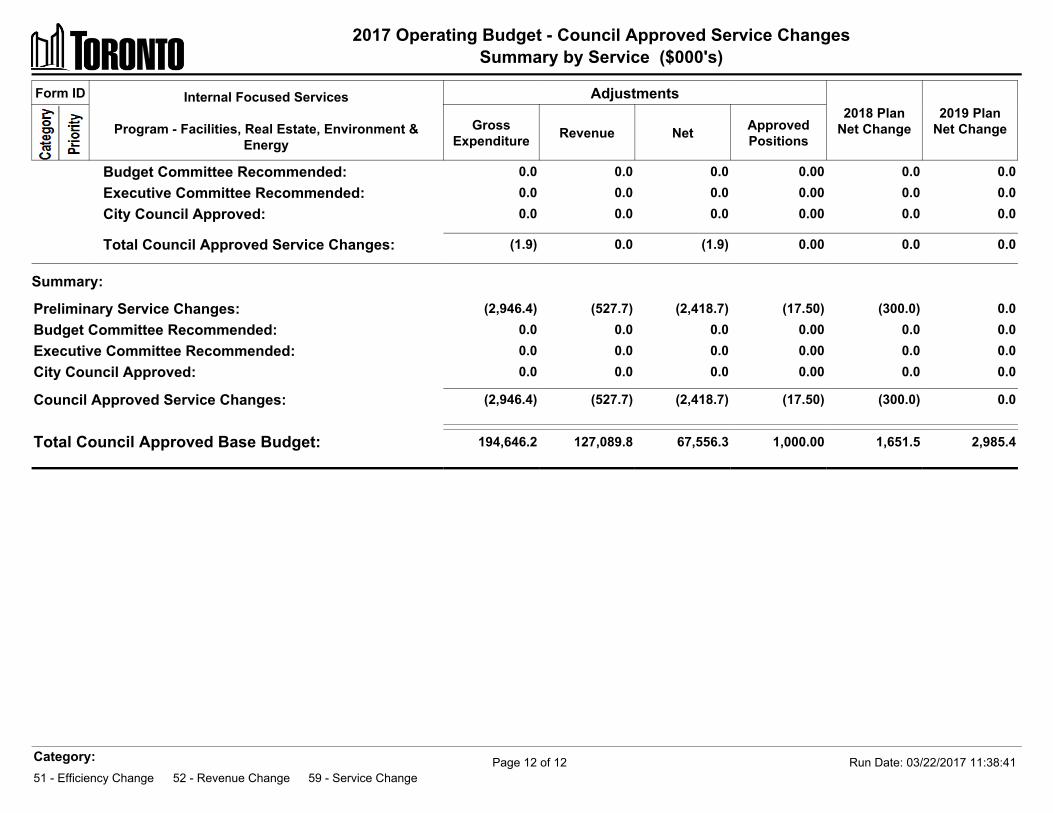
2017 Operating Budget - Council Approved Service ChangesSummary by Service ($000's)
Budget Committee Recommended: 0.0 0.0 0.0 0.00 0.0 0.0 Executive Committee Recommended: 0.0 0.0 0.0 0.00 0.0 0.0 City Council Approved: 0.0 0.0 0.0 0.00 0.0 0.0
Total Council Approved Service Changes: (1.9) 0.0 (1.9) 0.00 0.0 0.0
Form ID Internal Focused Services
Program - Facilities, Real Estate, Environment &Energy
Adjustments2018 Plan
Net Change2019 Plan
Net ChangeGrossExpenditure Revenue Net Approved
Positions
Summary:
Preliminary Service Changes: (2,946.4) (527.7) (2,418.7) (17.50) (300.0) 0.0Budget Committee Recommended: 0.0 0.0 0.0 0.00 0.0 0.0Executive Committee Recommended: 0.0 0.0 0.0 0.00 0.0 0.0City Council Approved: 0.0 0.0 0.0 0.00 0.0 0.0
Council Approved Service Changes: (2,946.4) (527.7) (2,418.7) (17.50) (300.0) 0.0
Total Council Approved Base Budget: 194,646.2 127,089.8 67,556.3 1,000.00 1,651.5 2,985.4
Category:51 - Efficiency Change 52 - Revenue Change 59 - Service Change
Run Date: 03/22/2017 11:38:41Page 12 of 12
2017 Operating Budget FREEE
toronto.ca/budget2017 Page 37
Appendix 5
Summary of 2017 New / Enhanced Service Priorities
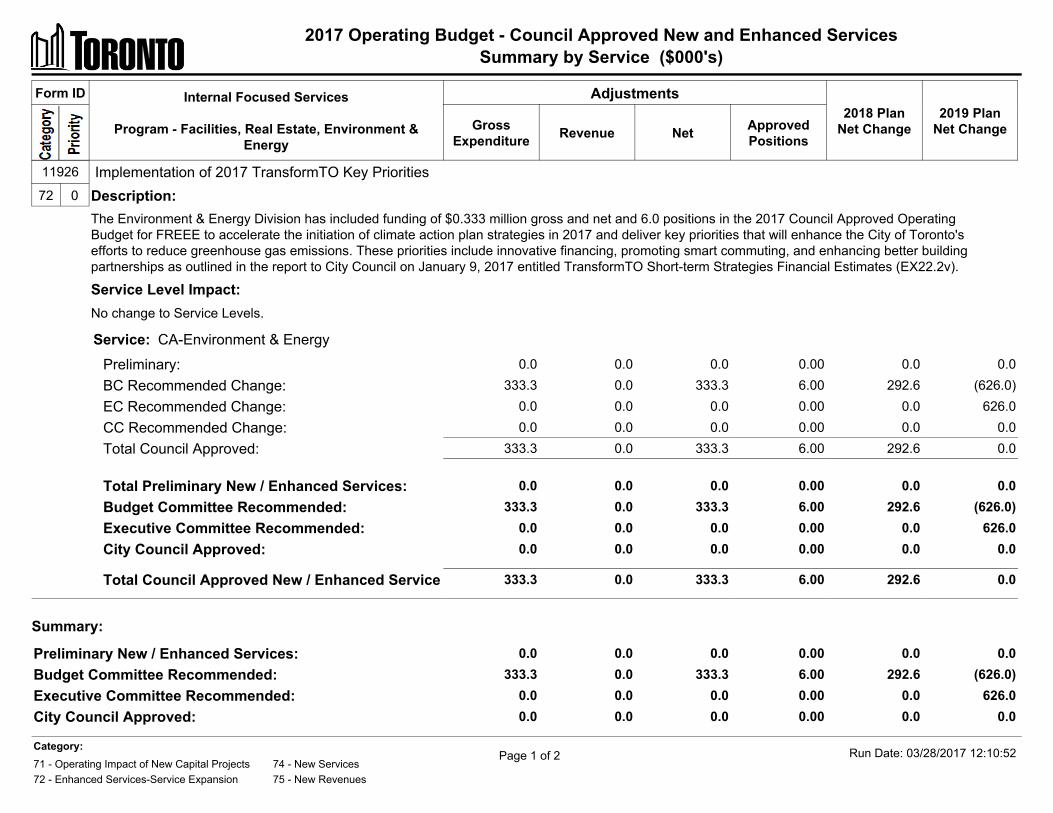
2017 Operating Budget - Council Approved New and Enhanced ServicesSummary by Service ($000's)
631.98 Service: CA-Environment & Energy
Preliminary: 0.0 0.0 0.0 0.00 0.0 0.0 BC Recommended Change: 333.3 0.0 333.3 6.00 292.6 (626.0) EC Recommended Change: 0.0 0.0 0.0 0.00 0.0 626.0 CC Recommended Change: 0.0 0.0 0.0 0.00 0.0 0.0 Total Council Approved: 333.3 0.0 333.3 6.00 292.6 0.0
11926 Implementation of 2017 TransformTO Key Priorities72 0 Description:
The Environment & Energy Division has included funding of $0.333 million gross and net and 6.0 positions in the 2017 Council Approved OperatingBudget for FREEE to accelerate the initiation of climate action plan strategies in 2017 and deliver key priorities that will enhance the City of Toronto'sefforts to reduce greenhouse gas emissions. These priorities include innovative financing, promoting smart commuting, and enhancing better buildingpartnerships as outlined in the report to City Council on January 9, 2017 entitled TransformTO Short-term Strategies Financial Estimates (EX22.2v).
Service Level Impact:No change to Service Levels.
Total Preliminary New / Enhanced Services: 0.0 0.0 0.0 0.00 0.0 0.0 Budget Committee Recommended: 333.3 0.0 333.3 6.00 292.6 (626.0) Executive Committee Recommended: 0.0 0.0 0.0 0.00 0.0 626.0 City Council Approved: 0.0 0.0 0.0 0.00 0.0 0.0
Total Council Approved New / Enhanced Service 333.3 0.0 333.3 6.00 292.6 0.0
Form ID Internal Focused Services
Program - Facilities, Real Estate, Environment &Energy
Adjustments2018 Plan
Net Change2019 Plan
Net ChangeGrossExpenditure Revenue Net Approved
Positions
Summary:
Preliminary New / Enhanced Services: 0.0 0.0 0.0 0.00 0.0 0.0Budget Committee Recommended: 333.3 0.0 333.3 6.00 292.6 (626.0)Executive Committee Recommended: 0.0 0.0 0.0 0.00 0.0 626.0City Council Approved: 0.0 0.0 0.0 0.00 0.0 0.0
Run Date: 03/28/2017 12:10:52Page 1 of 2Category:71 - Operating Impact of New Capital Projects 74 - New Services72 - Enhanced Services-Service Expansion 75 - New Revenues
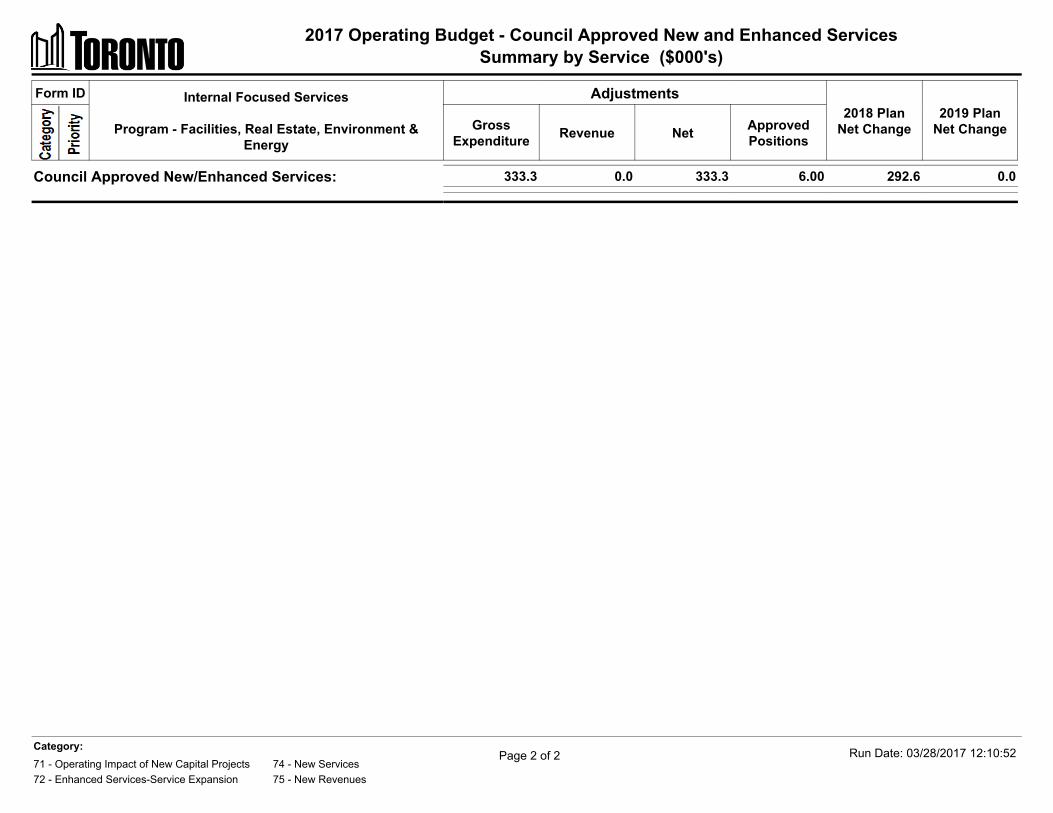
2017 Operating Budget - Council Approved New and Enhanced ServicesSummary by Service ($000's)
Form ID Internal Focused Services
Program - Facilities, Real Estate, Environment &Energy
Adjustments2018 Plan
Net Change2019 Plan
Net ChangeGrossExpenditure Revenue Net Approved
Positions
Council Approved New/Enhanced Services: 333.3 0.0 333.3 6.00 292.6 0.0
Run Date: 03/28/2017 12:10:52Page 2 of 2Category:71 - Operating Impact of New Capital Projects 74 - New Services72 - Enhanced Services-Service Expansion 75 - New Revenues
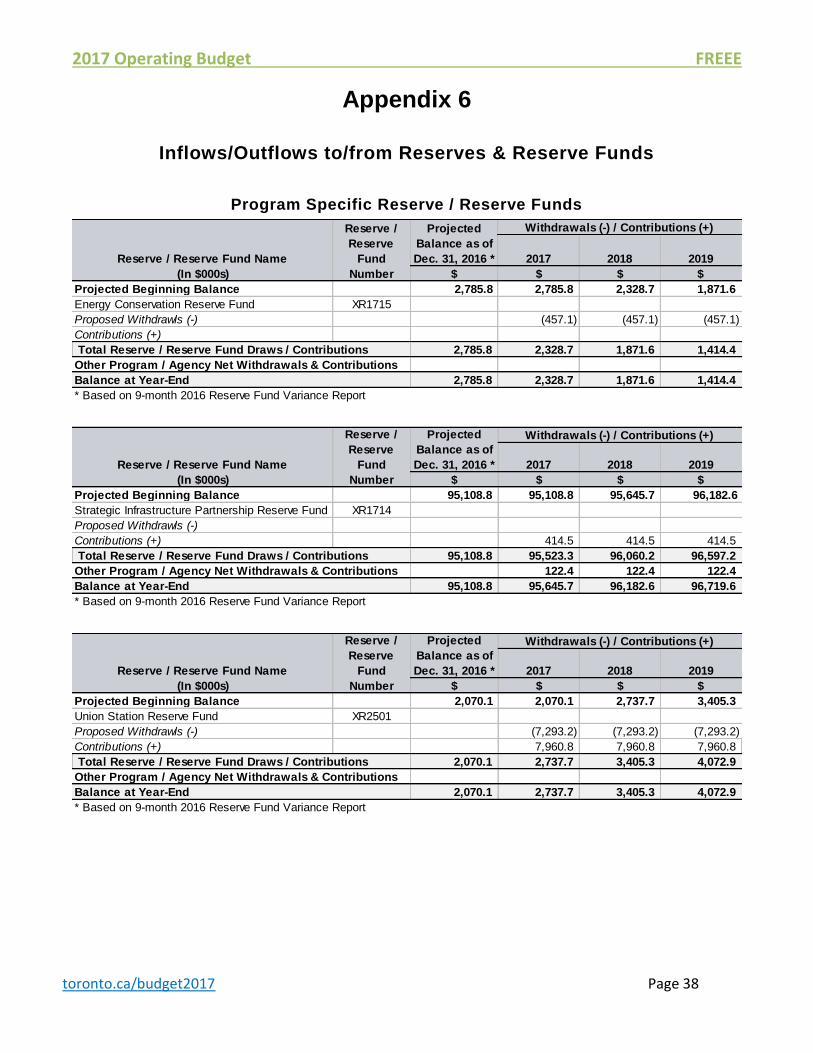
2017 Operating Budget FREEE
toronto.ca/budget2017 Page 38
Appendix 6
Inflows/Outflows to/from Reserves & Reserve Funds
Program Specific Reserve / Reserve Funds
2017 2018 2019
$ $ $ $
Projected Beginning Balance 2,785.8 2,785.8 2,328.7 1,871.6
Energy Conservation Reserve Fund XR1715
Proposed Withdrawls (-) (457.1) (457.1) (457.1)
Contributions (+)
Total Reserve / Reserve Fund Draws / Contributions 2,785.8 2,328.7 1,871.6 1,414.4
Other Program / Agency Net Withdrawals & Contributions
Balance at Year-End 2,785.8 2,328.7 1,871.6 1,414.4
* Based on 9-month 2016 Reserve Fund Variance Report
Reserve /
Reserve
Fund
Number
Projected
Balance as of
Dec. 31, 2016 *
Withdrawals (-) / Contributions (+)
Reserve / Reserve Fund Name
(In $000s)
2017 2018 2019
$ $ $ $
Projected Beginning Balance 95,108.8 95,108.8 95,645.7 96,182.6
Strategic Infrastructure Partnership Reserve Fund XR1714
Proposed Withdrawls (-)
Contributions (+) 414.5 414.5 414.5
Total Reserve / Reserve Fund Draws / Contributions 95,108.8 95,523.3 96,060.2 96,597.2
Other Program / Agency Net Withdrawals & Contributions 122.4 122.4 122.4
Balance at Year-End 95,108.8 95,645.7 96,182.6 96,719.6
* Based on 9-month 2016 Reserve Fund Variance Report
Reserve /
Reserve
Fund
Number
Projected
Balance as of
Dec. 31, 2016 *
Withdrawals (-) / Contributions (+)
Reserve / Reserve Fund Name
(In $000s)
2017 2018 2019
$ $ $ $
Projected Beginning Balance 2,070.1 2,070.1 2,737.7 3,405.3
Union Station Reserve Fund XR2501
Proposed Withdrawls (-) (7,293.2) (7,293.2) (7,293.2)
Contributions (+) 7,960.8 7,960.8 7,960.8
Total Reserve / Reserve Fund Draws / Contributions 2,070.1 2,737.7 3,405.3 4,072.9
Other Program / Agency Net Withdrawals & Contributions
Balance at Year-End 2,070.1 2,737.7 3,405.3 4,072.9
* Based on 9-month 2016 Reserve Fund Variance Report
Reserve /
Reserve
Fund
Number
Projected
Balance as of
Dec. 31, 2016 *
Withdrawals (-) / Contributions (+)
Reserve / Reserve Fund Name
(In $000s)
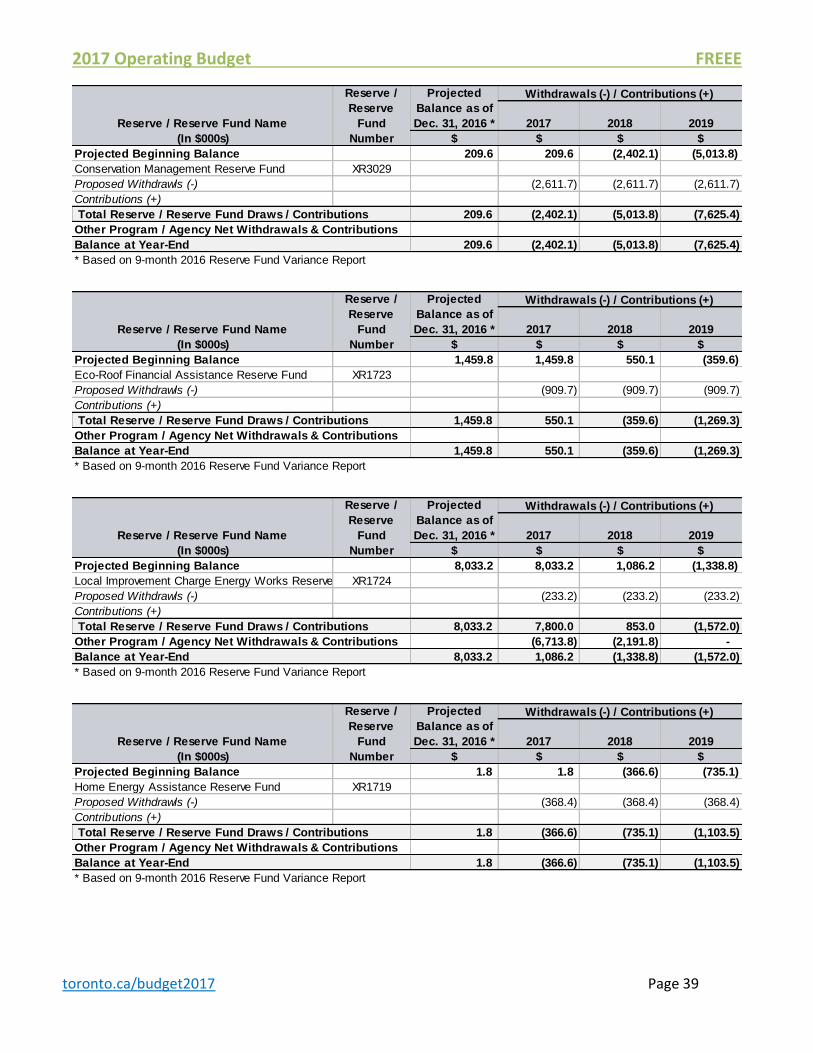
2017 Operating Budget FREEE
toronto.ca/budget2017 Page 39
2017 2018 2019
$ $ $ $
Projected Beginning Balance 209.6 209.6 (2,402.1) (5,013.8)
Conservation Management Reserve Fund XR3029
Proposed Withdrawls (-) (2,611.7) (2,611.7) (2,611.7)
Contributions (+)
Total Reserve / Reserve Fund Draws / Contributions 209.6 (2,402.1) (5,013.8) (7,625.4)
Other Program / Agency Net Withdrawals & Contributions
Balance at Year-End 209.6 (2,402.1) (5,013.8) (7,625.4)
* Based on 9-month 2016 Reserve Fund Variance Report
Reserve /
Reserve
Fund
Number
Projected
Balance as of
Dec. 31, 2016 *
Withdrawals (-) / Contributions (+)
Reserve / Reserve Fund Name
(In $000s)
2017 2018 2019
$ $ $ $
Projected Beginning Balance 1,459.8 1,459.8 550.1 (359.6)
Eco-Roof Financial Assistance Reserve Fund XR1723
Proposed Withdrawls (-) (909.7) (909.7) (909.7)
Contributions (+)
Total Reserve / Reserve Fund Draws / Contributions 1,459.8 550.1 (359.6) (1,269.3)
Other Program / Agency Net Withdrawals & Contributions
Balance at Year-End 1,459.8 550.1 (359.6) (1,269.3)
* Based on 9-month 2016 Reserve Fund Variance Report
Reserve /
Reserve
Fund
Number
Projected
Balance as of
Dec. 31, 2016 *
Withdrawals (-) / Contributions (+)
Reserve / Reserve Fund Name
(In $000s)
2017 2018 2019
$ $ $ $
Projected Beginning Balance 8,033.2 8,033.2 1,086.2 (1,338.8)
Local Improvement Charge Energy Works Reserve FundXR1724
Proposed Withdrawls (-) (233.2) (233.2) (233.2)
Contributions (+)
Total Reserve / Reserve Fund Draws / Contributions 8,033.2 7,800.0 853.0 (1,572.0)
Other Program / Agency Net Withdrawals & Contributions (6,713.8) (2,191.8) -
Balance at Year-End 8,033.2 1,086.2 (1,338.8) (1,572.0)
* Based on 9-month 2016 Reserve Fund Variance Report
Reserve /
Reserve
Fund
Number
Projected
Balance as of
Dec. 31, 2016 *
Withdrawals (-) / Contributions (+)
Reserve / Reserve Fund Name
(In $000s)
2017 2018 2019
$ $ $ $
Projected Beginning Balance 1.8 1.8 (366.6) (735.1)
Home Energy Assistance Reserve Fund XR1719
Proposed Withdrawls (-) (368.4) (368.4) (368.4)
Contributions (+)
Total Reserve / Reserve Fund Draws / Contributions 1.8 (366.6) (735.1) (1,103.5)
Other Program / Agency Net Withdrawals & Contributions
Balance at Year-End 1.8 (366.6) (735.1) (1,103.5)
* Based on 9-month 2016 Reserve Fund Variance Report
Reserve /
Reserve
Fund
Number
Projected
Balance as of
Dec. 31, 2016 *
Withdrawals (-) / Contributions (+)
Reserve / Reserve Fund Name
(In $000s)
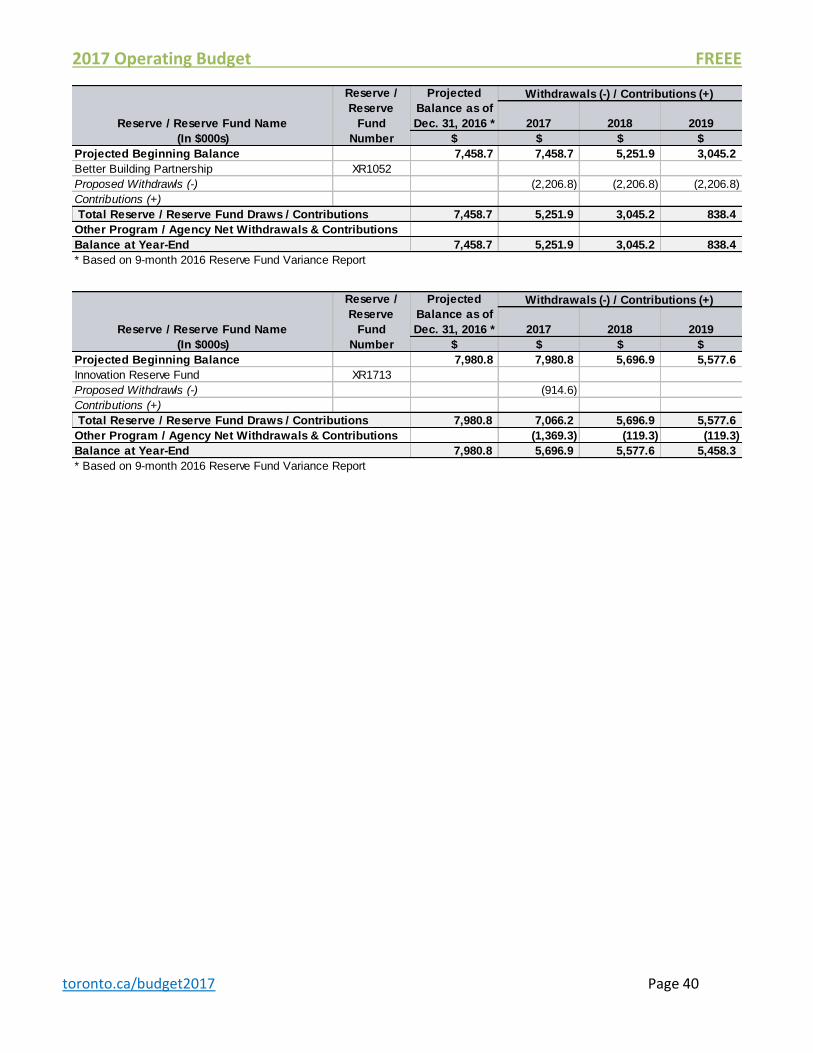
2017 Operating Budget FREEE
toronto.ca/budget2017 Page 40
2017 2018 2019
$ $ $ $
Projected Beginning Balance 7,458.7 7,458.7 5,251.9 3,045.2
Better Building Partnership XR1052
Proposed Withdrawls (-) (2,206.8) (2,206.8) (2,206.8)
Contributions (+)
Total Reserve / Reserve Fund Draws / Contributions 7,458.7 5,251.9 3,045.2 838.4
Other Program / Agency Net Withdrawals & Contributions
Balance at Year-End 7,458.7 5,251.9 3,045.2 838.4
* Based on 9-month 2016 Reserve Fund Variance Report
Reserve /
Reserve
Fund
Number
Projected
Balance as of
Dec. 31, 2016 *
Withdrawals (-) / Contributions (+)
Reserve / Reserve Fund Name
(In $000s)
2017 2018 2019
$ $ $ $
Projected Beginning Balance 7,980.8 7,980.8 5,696.9 5,577.6
Innovation Reserve Fund XR1713
Proposed Withdrawls (-) (914.6)
Contributions (+)
Total Reserve / Reserve Fund Draws / Contributions 7,980.8 7,066.2 5,696.9 5,577.6
Other Program / Agency Net Withdrawals & Contributions (1,369.3) (119.3) (119.3)
Balance at Year-End 7,980.8 5,696.9 5,577.6 5,458.3
* Based on 9-month 2016 Reserve Fund Variance Report
Reserve /
Reserve
Fund
Number
Projected
Balance as of
Dec. 31, 2016 *
Withdrawals (-) / Contributions (+)
Reserve / Reserve Fund Name
(In $000s)
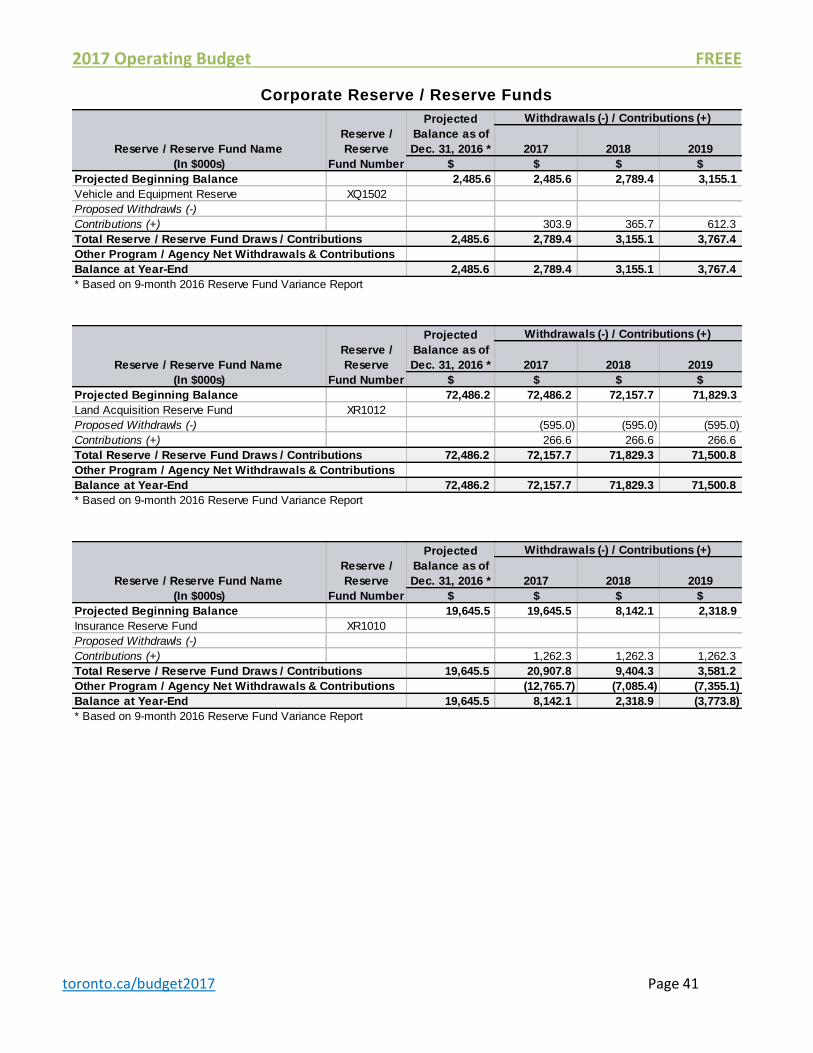
2017 Operating Budget FREEE
toronto.ca/budget2017 Page 41
Corporate Reserve / Reserve Funds
2017 2018 2019
$ $ $ $
Projected Beginning Balance 2,485.6 2,485.6 2,789.4 3,155.1
Vehicle and Equipment Reserve XQ1502
Proposed Withdrawls (-)
Contributions (+) 303.9 365.7 612.3
Total Reserve / Reserve Fund Draws / Contributions 2,485.6 2,789.4 3,155.1 3,767.4
Other Program / Agency Net Withdrawals & Contributions
Balance at Year-End 2,485.6 2,789.4 3,155.1 3,767.4
* Based on 9-month 2016 Reserve Fund Variance Report
Reserve /
Reserve
Fund Number
Projected
Balance as of
Dec. 31, 2016 *
Withdrawals (-) / Contributions (+)
Reserve / Reserve Fund Name
(In $000s)
2017 2018 2019
$ $ $ $
Projected Beginning Balance 72,486.2 72,486.2 72,157.7 71,829.3
Land Acquisition Reserve Fund XR1012
Proposed Withdrawls (-) (595.0) (595.0) (595.0)
Contributions (+) 266.6 266.6 266.6
Total Reserve / Reserve Fund Draws / Contributions 72,486.2 72,157.7 71,829.3 71,500.8
Other Program / Agency Net Withdrawals & Contributions
Balance at Year-End 72,486.2 72,157.7 71,829.3 71,500.8
* Based on 9-month 2016 Reserve Fund Variance Report
Reserve /
Reserve
Fund Number
Projected
Balance as of
Dec. 31, 2016 *
Withdrawals (-) / Contributions (+)
Reserve / Reserve Fund Name
(In $000s)
2017 2018 2019
$ $ $ $
Projected Beginning Balance 19,645.5 19,645.5 8,142.1 2,318.9
Insurance Reserve Fund XR1010
Proposed Withdrawls (-)
Contributions (+) 1,262.3 1,262.3 1,262.3
Total Reserve / Reserve Fund Draws / Contributions 19,645.5 20,907.8 9,404.3 3,581.2
Other Program / Agency Net Withdrawals & Contributions (12,765.7) (7,085.4) (7,355.1)
Balance at Year-End 19,645.5 8,142.1 2,318.9 (3,773.8)
* Based on 9-month 2016 Reserve Fund Variance Report
Reserve /
Reserve
Fund Number
Projected
Balance as of
Dec. 31, 2016 *
Withdrawals (-) / Contributions (+)
Reserve / Reserve Fund Name
(In $000s)
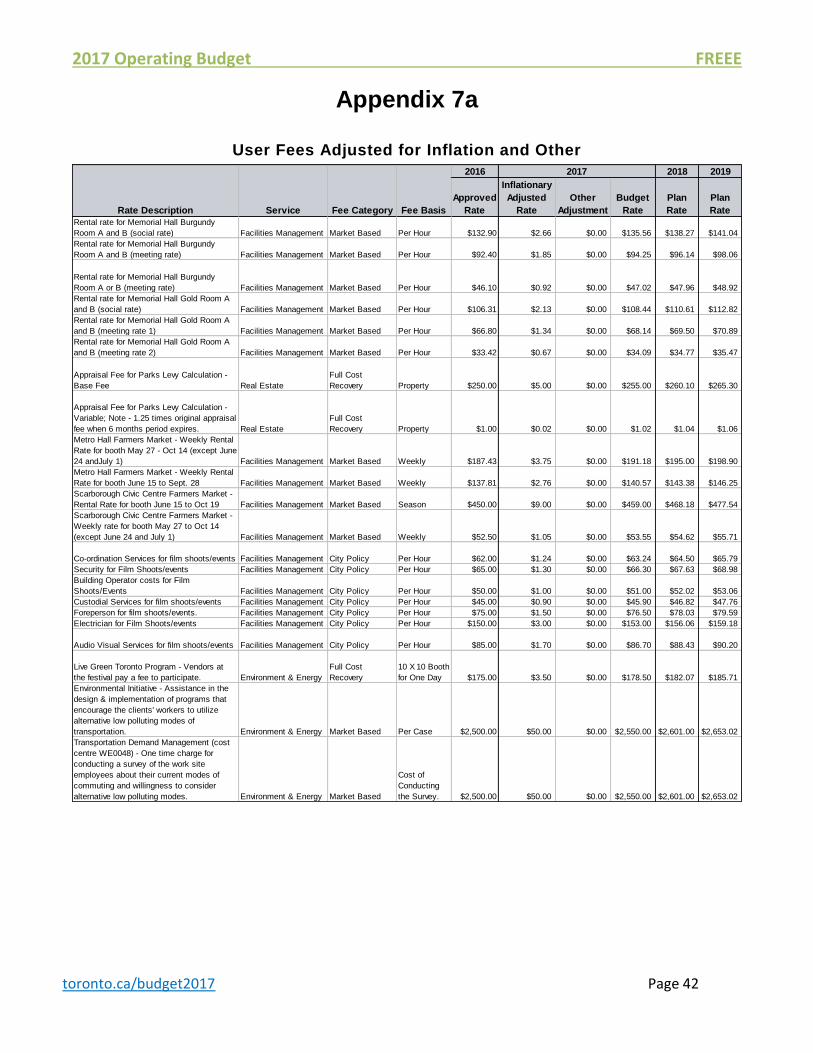
2017 Operating Budget FREEE
toronto.ca/budget2017 Page 42
Appendix 7a
User Fees Adjusted for Inflation and Other
2016 2018 2019
Approved
Rate
Inflationary
Adjusted
Rate
Other
Adjustment
Budget
Rate
Plan
Rate
Plan
Rate
Rental rate for Memorial Hall Burgundy
Room A and B (social rate) Facilities Management Market Based Per Hour $132.90 $2.66 $0.00 $135.56 $138.27 $141.04
Rental rate for Memorial Hall Burgundy
Room A and B (meeting rate) Facilities Management Market Based Per Hour $92.40 $1.85 $0.00 $94.25 $96.14 $98.06
Rental rate for Memorial Hall Burgundy
Room A or B (meeting rate) Facilities Management Market Based Per Hour $46.10 $0.92 $0.00 $47.02 $47.96 $48.92
Rental rate for Memorial Hall Gold Room A
and B (social rate) Facilities Management Market Based Per Hour $106.31 $2.13 $0.00 $108.44 $110.61 $112.82
Rental rate for Memorial Hall Gold Room A
and B (meeting rate 1) Facilities Management Market Based Per Hour $66.80 $1.34 $0.00 $68.14 $69.50 $70.89
Rental rate for Memorial Hall Gold Room A
and B (meeting rate 2) Facilities Management Market Based Per Hour $33.42 $0.67 $0.00 $34.09 $34.77 $35.47
Appraisal Fee for Parks Levy Calculation -
Base Fee Real Estate
Full Cost
Recovery Property $250.00 $5.00 $0.00 $255.00 $260.10 $265.30
Appraisal Fee for Parks Levy Calculation -
Variable; Note - 1.25 times original appraisal
fee when 6 months period expires. Real Estate
Full Cost
Recovery Property $1.00 $0.02 $0.00 $1.02 $1.04 $1.06
Metro Hall Farmers Market - Weekly Rental
Rate for booth May 27 - Oct 14 (except June
24 andJuly 1) Facilities Management Market Based Weekly $187.43 $3.75 $0.00 $191.18 $195.00 $198.90
Metro Hall Farmers Market - Weekly Rental
Rate for booth June 15 to Sept. 28 Facilities Management Market Based Weekly $137.81 $2.76 $0.00 $140.57 $143.38 $146.25
Scarborough Civic Centre Farmers Market -
Rental Rate for booth June 15 to Oct 19 Facilities Management Market Based Season $450.00 $9.00 $0.00 $459.00 $468.18 $477.54
Scarborough Civic Centre Farmers Market -
Weekly rate for booth May 27 to Oct 14
(except June 24 and July 1) Facilities Management Market Based Weekly $52.50 $1.05 $0.00 $53.55 $54.62 $55.71
Co-ordination Services for film shoots/events Facilities Management City Policy Per Hour $62.00 $1.24 $0.00 $63.24 $64.50 $65.79
Security for Film Shoots/events Facilities Management City Policy Per Hour $65.00 $1.30 $0.00 $66.30 $67.63 $68.98
Building Operator costs for Film
Shoots/Events Facilities Management City Policy Per Hour $50.00 $1.00 $0.00 $51.00 $52.02 $53.06
Custodial Services for film shoots/events Facilities Management City Policy Per Hour $45.00 $0.90 $0.00 $45.90 $46.82 $47.76
Foreperson for film shoots/events. Facilities Management City Policy Per Hour $75.00 $1.50 $0.00 $76.50 $78.03 $79.59
Electrician for Film Shoots/events Facilities Management City Policy Per Hour $150.00 $3.00 $0.00 $153.00 $156.06 $159.18
Audio Visual Services for film shoots/events Facilities Management City Policy Per Hour $85.00 $1.70 $0.00 $86.70 $88.43 $90.20
Live Green Toronto Program - Vendors at
the festival pay a fee to participate. Environment & Energy
Full Cost
Recovery
10 X 10 Booth
for One Day $175.00 $3.50 $0.00 $178.50 $182.07 $185.71
Environmental Initiative - Assistance in the
design & implementation of programs that
encourage the clients' workers to utilize
alternative low polluting modes of
transportation. Environment & Energy Market Based Per Case $2,500.00 $50.00 $0.00 $2,550.00 $2,601.00 $2,653.02
Transportation Demand Management (cost
centre WE0048) - One time charge for
conducting a survey of the work site
employees about their current modes of
commuting and willingness to consider
alternative low polluting modes. Environment & Energy Market Based
Cost of
Conducting
the Survey. $2,500.00 $50.00 $0.00 $2,550.00 $2,601.00 $2,653.02
2017
Rate Description Service Fee Category Fee Basis