Embed Size (px)
Citation preview
Facing Forward:
Schooling for Learning
in AfricaRegional Study on the Quality of Basic Education
Brookings Institute, Washington D.C.
19 April 2018

Purpose and scope of the study
Scope• All sub-Saharan African countries have committed to Sustainable Development Goal 4• Prioritize basic education of quality (grades 1-9)
Focus• Science: “What works” • Service delivery: “How to implement” • Countries can learn from each other• Should develop the culture of continuous improvements
Audience • Ministries of Finance; Ministries of Education • Development partners

What can we learn from this study?
Compares countries by education progress and learning
Four focus areas: student progression, teachers, budgets, capacity gaps
What are the implications for the region?
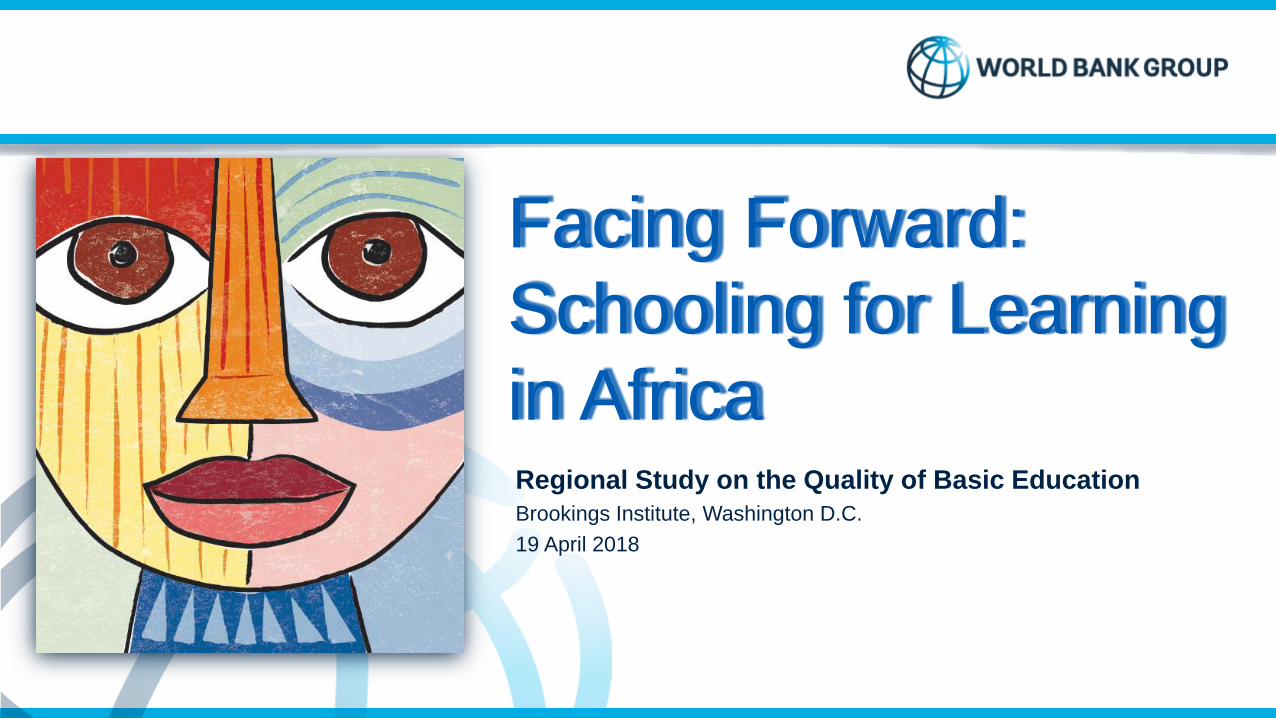
Real GDP per capita and Primary-School Enrollment in Sub-Saharan Africa, 1960–2014
1st Oil Price Shock Jomtien
GDP pc at 1974 level
0
20
40
60
80
100
120
140
160
1000
1100
1200
1300
1400
1500
1600
1700To
tal Enro
llme
nt In
Prim
ary
Millions of students
Re
al G
DP
pe
r ca
pit
aUS$ at 2010
prices
81
42
Delayed
108
55
Emerging
117
55
Emerged
110
87
Established
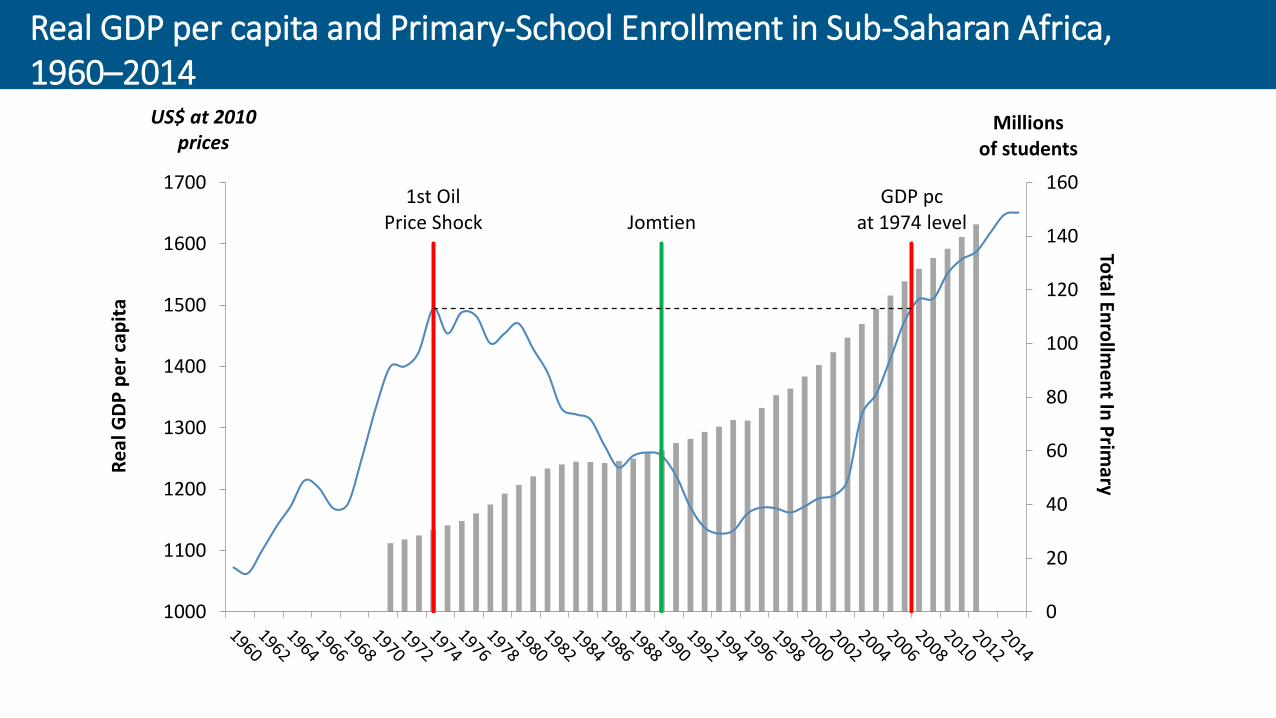
Four Country Groups: Geographical spread
Primary
GER
Lower
Secondary
GER
Country
Groupings
Countries
Group 1 Established
Group 2 Emerged
Group 3 Emerging
Group 4 Delayed
0
20
40
60
80
100
120
140
160So
uth
Afr
ica
Zim
bab
we
Mau
riti
us
Gh
ana
Co
ngo
, Rep
.B
ots
wan
aK
enya
Leso
tho
Cab
o V
erd
eN
amib
iaSã
o T
om
é an
d P
rin
cip
eSw
azila
nd
Gab
on
Co
ngo
, Dem
. Rep
.Ta
nza
nia
Co
mo
ros
Cam
ero
on
Uga
nd
aTo
goR
wan
da
Mal
awi
Nig
eria
Gam
bia
, Th
eC
ôte
d'Iv
oir
eM
auri
tan
iaEt
hio
pia
Zam
bia
Mo
zam
biq
ue
Gu
inea
-Bis
sau
Be
nin
Bu
run
di
Mad
agas
car
An
gola
Erit
rea
Nig
erSu
dan
Mal
iSe
neg
alEq
uat
ori
al G
uin
eaB
urk
ina
Faso
Gu
inea
Cen
tral
Afr
ican
Rep
ub
licLi
ber
iaC
had
Pe
rce
nta
ge
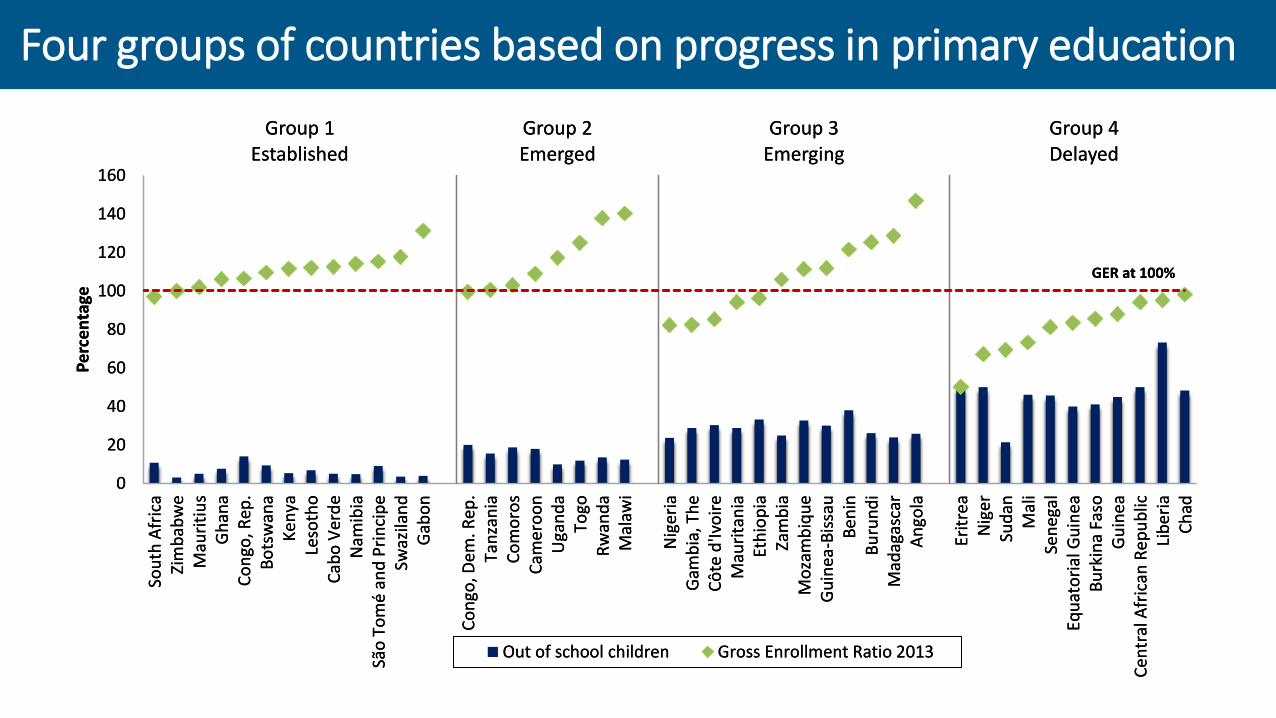
Out of school children Gross Enrollment Ratio 2013
GER at 100%
Group 1 Established
Group 2 Emerged
Group 3 Emerging
Group 4 Delayed
0
20
40
60
80
100
120
140
160So
uth
Afr
ica
Zim
bab
we
Mau
riti
us
Gh
ana
Co
ngo
, Rep
.B
ots
wan
aK
enya
Leso
tho
Cab
o V
erd
eN
amib
iaSã
o T
om
é an
d P
rin
cip
eSw
azila
nd
Gab
on
Co
ngo
, Dem
. Rep
.Ta
nza
nia
Co
mo
ros
Cam
ero
on
Uga
nd
aTo
goR
wan
da
Mal
awi
Nig
eria
Gam
bia
, Th
eC
ôte
d'Iv
oir
eM
auri
tan
iaEt
hio
pia
Zam
bia
Mo
zam
biq
ue
Gu
inea
-Bis
sau
Be
nin
Bu
run
di
Mad
agas
car
An
gola
Erit
rea
Nig
erSu
dan
Mal
iSe
neg
alEq
uat
ori
al G
uin
eaB
urk
ina
Faso
Gu
inea
Cen
tral
Afr
ican
Rep
ub
licLi
ber
iaC
had
Pe
rce
nta
ge
Out of school children Gross Enrollment Ratio 2013
GER at 100%
Four groups of countries based on progress in primary education

GER 100%
0
20
40
60
80
100
120
Co
ngo
, Rep
.
Leso
tho
Swaz
ilan
d
Gh
ana
Zim
bab
we
Cab
o V
erd
e
Mau
riti
us
Bo
tsw
ana
Nam
ibia
Sou
th A
fric
a
Tan
zan
ia
Cam
ero
on
Co
mo
ros
Uga
nd
a
Mal
awi
Togo
Bu
run
di
Mo
zam
biq
ue
Mad
agas
car
Eth
iop
ia
Guinea
-…
Mau
rita
nia
Cô
te d
'Ivo
ire
Be
nin
Gam
bia
Zam
bia
Nig
eria
Nig
er
Ch
ad
Bu
rkin
a Fa
so
Sen
egal
Gu
inea
Mal
i
Eq. G
uin
ea
2000 Most Recent Year
GER 100%
0
20
40
60
80
100
120C
on
go, R
ep.
Leso
tho
Swaz
ilan
d
Gh
ana
Zim
bab
we
Cab
o V
erd
e
Mau
riti
us
Bo
tsw
ana
Nam
ibia
Sou
th A
fric
a
Tan
zan
ia
Cam
ero
on
Co
mo
ros
Uga
nd
a
Mal
awi
Togo
Bu
run
di
Mo
zam
biq
ue
Mad
agas
car
Eth
iop
ia
Gu
inea
-Bis
sau
Mau
rita
nia
Cô
te d
'Ivo
ire
Be
nin
Gam
bia
Zam
bia
Nig
eria
Nig
er
Ch
ad
Bu
rkin
a Fa
so
Sen
egal
Gu
inea
Mal
i
Eq. G
uin
ea
Group 1Established
Group 2Emerged
Group 3Emerging
Group 4Delayed
2000 Most Recent Year
Progress towards Lower secondary education (GER)

Learning assessments: Sources of data and country coverage

Countries in Group 1 and Burundi perform better(each dot represents an international or regional assessment in Reading, Math, and Science from early grade to lower secondary, and adult literacy)
Few students reach minimum proficiency levels in reading or math
<25%
25- 49%
50 -74%
>=75%M
auri
tiu
s
Bo
tsw
ana
Ken
ya
Sou
th A
fric
a
Co
ngo
, Rep
.
Swaz
ilan
d
Seyc
hel
les
Leso
tho
Nam
ibia
Zim
bab
we
Gh
ana
Togo
Cam
ero
on
Uga
nd
a
Mal
awi
Tan
zan
ia
Rw
and
a
Bu
run
di
Ben
in
Cô
te d
'Ivo
ire
Zam
bia
Eth
iop
ia
Mo
zam
biq
ue
Nig
eria
Sen
egal
Bu
rkin
a Fa
so
Ch
ad
Nig
er
Mal
i
Group 1 Group 2 Group 3 Group 4
Pe
rce
nta
ge o
f te
st t
ake
rs
reac
hin
g m
inim
um
pro
fici
en
cy
<25%
25-49%
50-74%
>=75%M
auri
tius
Bots
wan
a
Keny
a
Sout
h …
Cong
o, …
Swaz
iland
Seyc
hell…
Leso
tho
Nam
ibia
Zim
bab…
Gha
na
Togo
Cam
ero…
Uga
nda
Mal
awi
Tanz
ania
Rwan
da
Buru
ndi
Beni
n
Côte
…
Zam
bia
Ethi
opi
a
Moz
am…
Nig
eria
Sene
gal
Burk
ina …
Chad
Nig
er
Mal
i
Per
cen
tage
of t
est
take
rs
reac
hin
g m
inim
um
pro
fici
ency

0
20
40
60
80
100
English Kiswahili
Kenya Tanzania (2014 ) Togo Uganda Mozambique Nigeria Senegal
Group 1 Group 2 Group 3 Group 4
Pe
rce
nta
ge
Pupil can read a letter (%) Pupil can read a word (%) Pupil can read a sentence (%) Pupil can read paragraph (%)
At the end of 4th grade, fewer than 30 percent of children can read a paragraph (except Tanzanian children in Kiswahili)
0
20
40
60
80
100
English Kiswahili
Kenya Tanzania (2014 ) Togo Uganda Mozambique Nigeria Senegal
Group 1 Group 2 Group 3 Group 4
Pe
rce
nta
ge
Pupil can read a letter (%) Pupil can read a word (%) Pupil can read a sentence (%) Pupil can read paragraph (%)
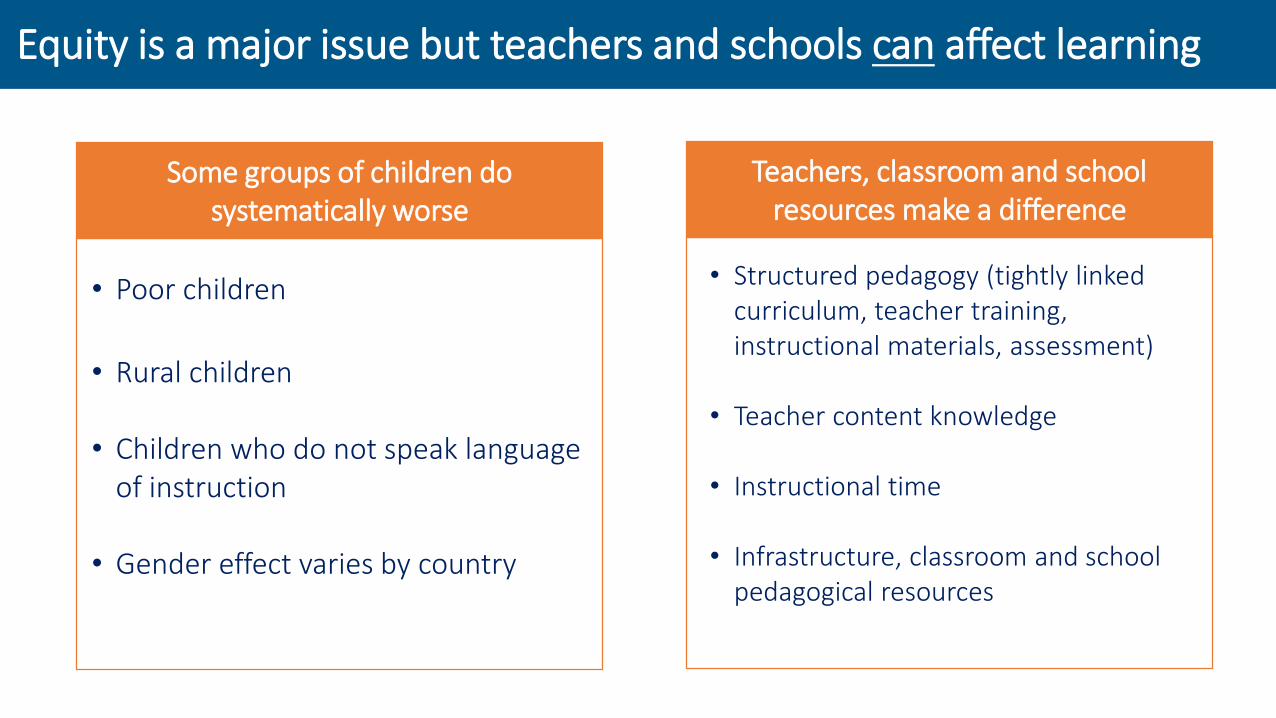
Some groups of children do systematically worse
Teachers, classroom and school resources make a difference
• Poor children
• Rural children
• Children who do not speak language of instruction
• Gender effect varies by country
• Structured pedagogy (tightly linked curriculum, teacher training, instructional materials, assessment)
• Teacher content knowledge
• Instructional time
• Infrastructure, classroom and school pedagogical resources
Equity is a major issue but teachers and schools can affect learning
Equity is a major issue but teachers and schools can affect learning
444
440
497
426
458
468
457
515
509
533
38
44
24
103
73
67
82
60
67
72
482
483
521
528
531
535
539
574
576
606
350 500 650
Côte d'Ivoire
Benin
Burkina Faso
Niger
Cameroon
Chad
Togo
Congo, Rep.
Senegal
Burundi
Mathematics
Never use LOI at home Gap Size Always/Sometimes use LOI at home
453
446
494
423
456
466
456
481
481
563
54
36
52
106
79
46
89
95
98
66
507
481
546
529
535
512
545
577
579
629
350 500 650
Côte d'Ivoire
Benin
Burkina Faso
Niger
Cameroon
Chad
Togo
Congo, Rep.
Senegal
Burundi
Reading
Never use LOI at home Gap Size Always/Sometimes use LOI at home
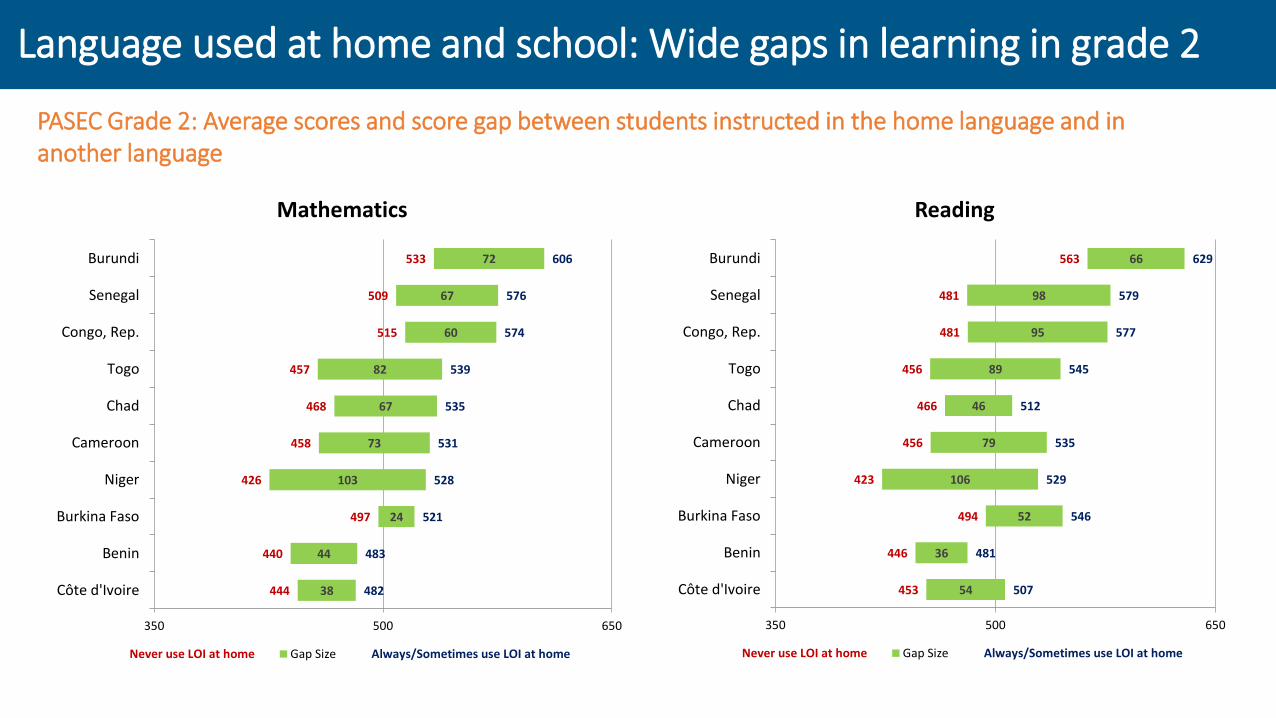
Language used at home and school: Wide gaps in learning in grade 2
PASEC Grade 2: Average scores and score gap between students instructed in the home language and in another language
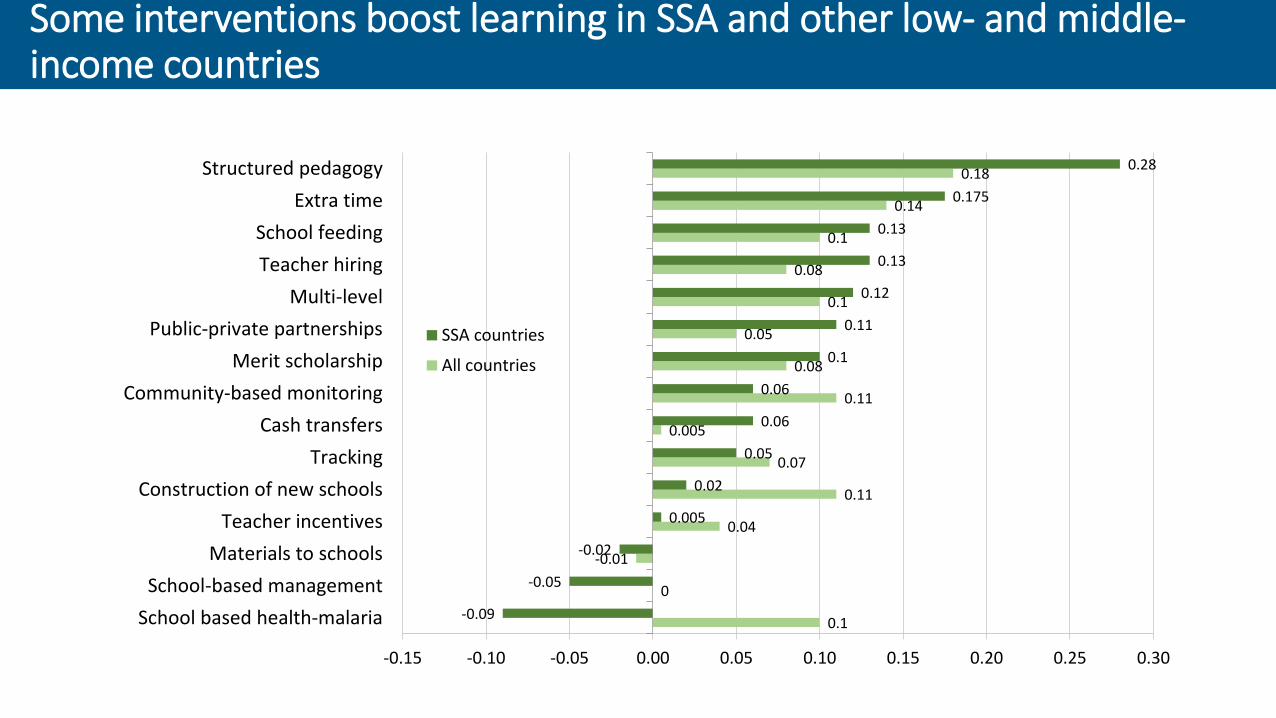
Some interventions boost learning in SSA and other low- and middle-income countries
0.1
0
-0.01
0.04
0.11
0.07
0.005
0.11
0.08
0.05
0.1
0.08
0.1
0.14
0.18
-0.09
-0.05
-0.02
0.005
0.02
0.05
0.06
0.06
0.1
0.11
0.12
0.13
0.13
0.175
0.28
-0.15 -0.10 -0.05 0.00 0.05 0.10 0.15 0.20 0.25 0.30
School based health-malaria
School-based management
Materials to schools
Teacher incentives
Construction of new schools
Tracking
Cash transfers
Community-based monitoring
Merit scholarship
Public-private partnerships
Multi-level
Teacher hiring
School feeding
Extra time
Structured pedagogy
SSA countries
All countries

1. Student progression from early grades to end of lower secondary, with learning
2. Teacher management and support
3. Using the budget to improve quality
4. Closing the capacity gap
Four areas of focus in the study

Target poor, female, rural students
More lowersecondary schools
Unblock early grade“traffic jam”
Student progression: early
grades through basic education
1. Student progression with learning

• Children enter at different ages
• Attend irregularly• Repeat years• Learn little
• Large classes (>80)• Different ages• Classes held outside• Few learning materials• Teachers need training to
teach reading, numeracy
• Children don’t understand Language of Instruction
• Teachers are not familiar with language
Student Flow
Poor Learning Environment in Early Grades
Language Policy
CHILDREN STUCK
IN EARLY GRADES
Early Grade “Traffic Jam” : Three Factors

80
Burkina, 46
CIV, 76
DRC, 83
Ethiopia, 57
Ghana, 90
100
Kenya, 80
36
Malawi, 16
72
Mozambique, 49
100
97
Nigeria, 83
68
Rwanda, 38
91
Senegal, 82
56
Uganda, 31
0
20
40
60
80
100
Grade1 Grade2 Grade3 Grade4 Grade5 Grade6 Grade7 Grade8 Grade9
Surv
ival
Rat
e
Survival rates through grade 9
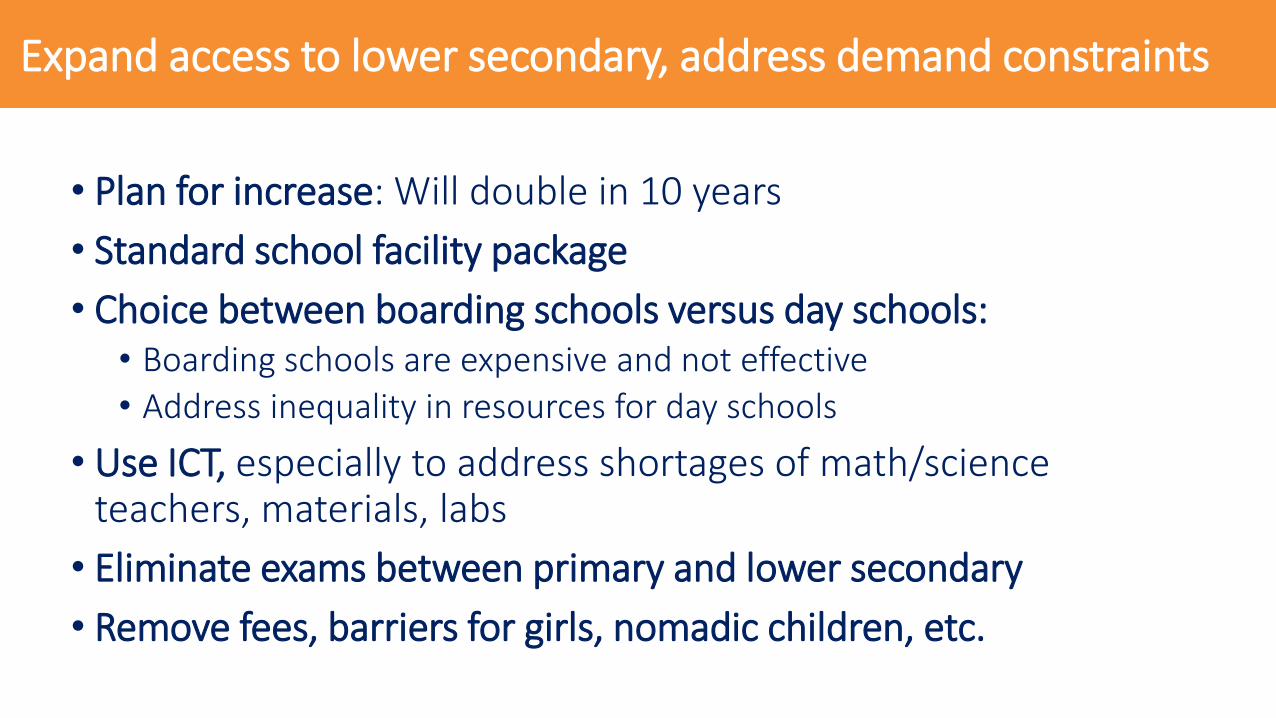
• Plan for increase: Will double in 10 years
• Standard school facility package
• Choice between boarding schools versus day schools:• Boarding schools are expensive and not effective
• Address inequality in resources for day schools
• Use ICT, especially to address shortages of math/science teachers, materials, labs
• Eliminate exams between primary and lower secondary
• Remove fees, barriers for girls, nomadic children, etc.
Expand access to lower secondary, address demand constraints

Deploy correctly/ ensure presence
Strengthen school leadership
Improve knowledge and practice
Improve teacher management and
support
Minimum learning conditions in schools
Accountability and incentives
2. Teachers: Improve management and support

Teacher recruitment
•Teaching attracts the more educated
• But pre-service preparation is inadequate
• And teacher knowledge remains modest
Teacher deployment
•Allocations vary widely across schools
•Control of allocations and transfers is weak
•Curriculum specialization worsens problems
Teacher absenteeism
•Teachers are absent from school and from the classroom (“orphaned” classrooms)
•Problems stem from issues with leave policy and weak school level management
Teaching and learning in the
classroom
•Teachers lack ongoing support to improve teaching
•Material and other conditions are unconducive
“Leakages” in Teacher Management at Multiple Points
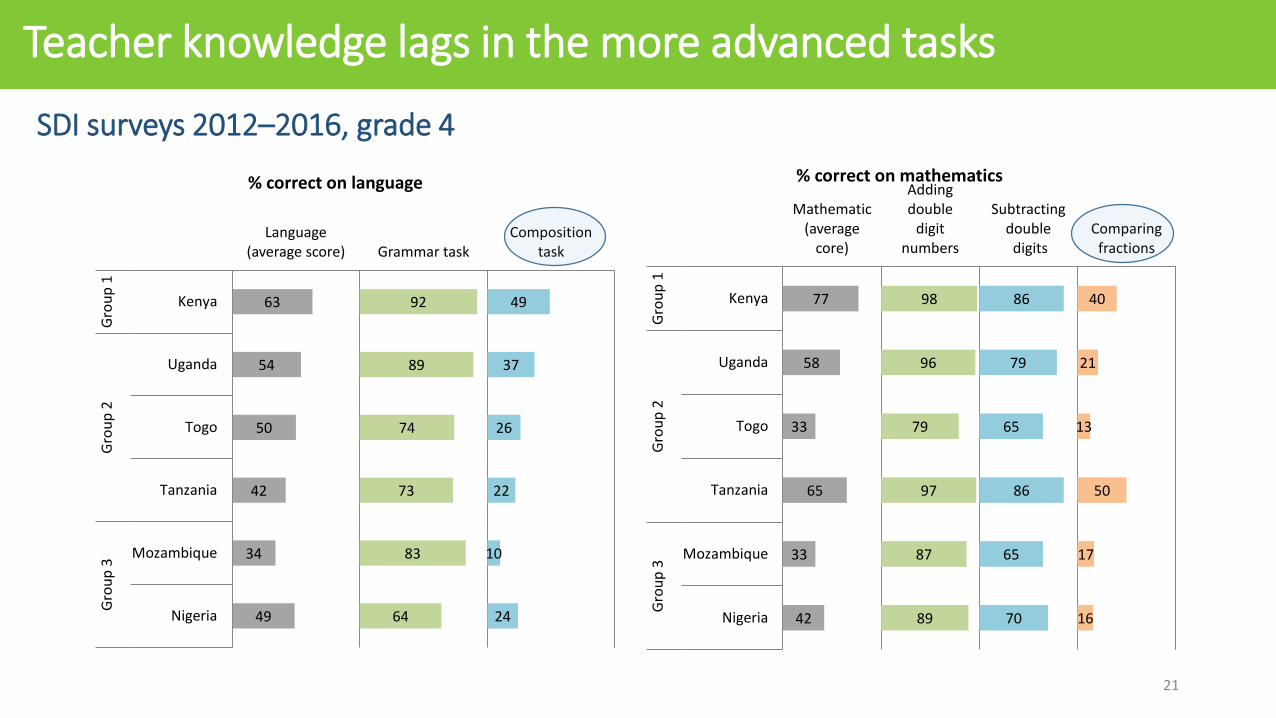
SDI surveys 2012–2016, grade 4
21
63
54
50
42
34
49
92
89
74
73
83
64
49
37
26
22
10
24
Language (average score) Grammar task
Composition task
Kenya
Uganda
Togo
Tanzania
Mozambique
Nigeria
Gro
up
1G
rou
p 2
Gro
up
3
% correct on language
77
58
33
65
33
42
98
96
79
97
87
89
86
79
65
86
65
70
40
21
13
50
17
16
Mathematic (average
core)
Adding double
digit numbers
Subtracting doubledigits
Comparing fractions
Kenya
Uganda
Togo
Tanzania
Mozambique
Nigeria
Gro
up
1G
rou
p 2
Gro
up
3
% correct on mathematics
Teacher knowledge lags in the more advanced tasks

Large shares of teachers are absent—not just from school but especially from class
0.15
0.15
0.21
0.24
0.05
0.35
0.43
0.14
0.18
0.43
0.47
0.36
0.53
0.22
0.42
0.55
0.19
0.29
Kenya
Tanzania
Togo
Uganda
Ethiopia
Madagascar
Mozambique
Nigeria
Senegal
12
34
School Class
Source: Service Delivery Indicators Surveys of primary schools, 2013-14, based on enumerators’ school visit reports

Improve the efficiency of public
spending
Reduce disparities in standards of
provision
Spend incremental resources on
learning
Use the budget to improve quality
Project multi-year resource
requirements
3. Use the budget to improve quality
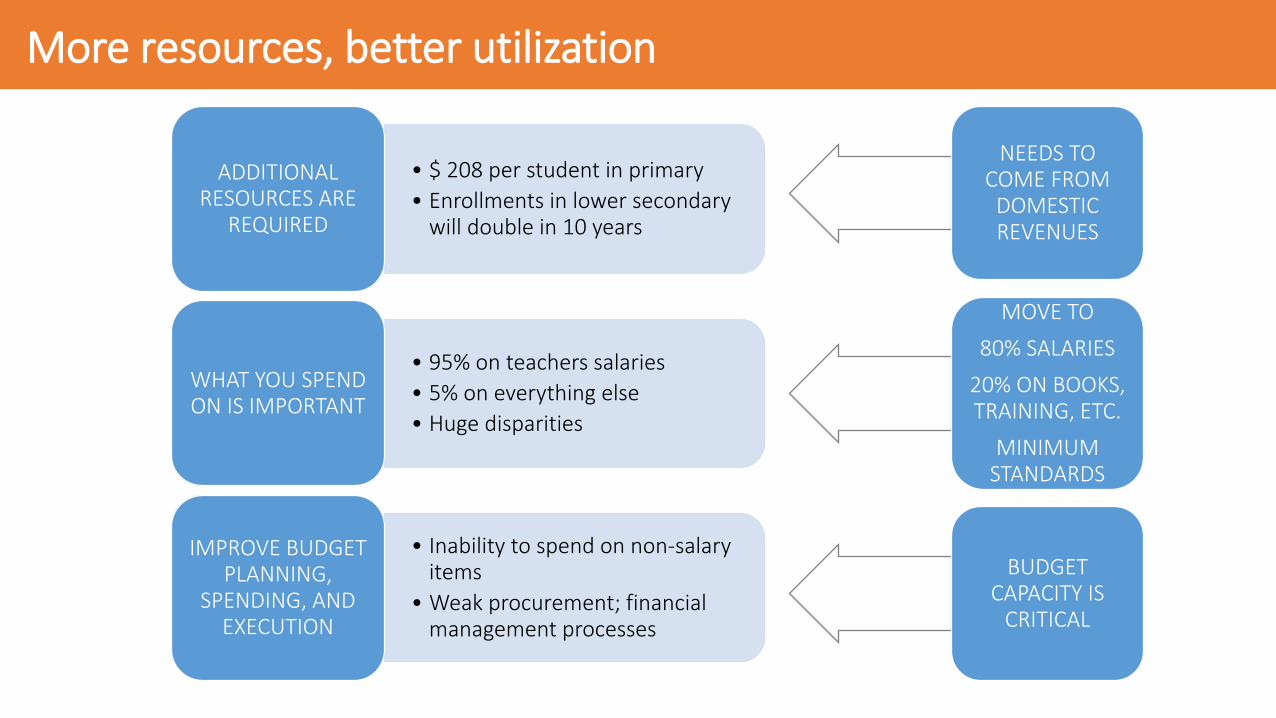
• $ 208 per student in primary
• Enrollments in lower secondary will double in 10 years
ADDITIONAL RESOURCES ARE
REQUIRED
• 95% on teachers salaries
• 5% on everything else
• Huge disparities
WHAT YOU SPEND ON IS IMPORTANT
• Inability to spend on non-salary items
• Weak procurement; financial management processes
IMPROVE BUDGET PLANNING,
SPENDING, AND EXECUTION
NEEDS TO COME FROM
DOMESTIC REVENUES
MOVE TO
80% SALARIES
20% ON BOOKS, TRAINING, ETC.
MINIMUM STANDARDS
BUDGET CAPACITY IS
CRITICAL
More resources, better utilization

Predictability of Direct Budget Support by country grouping
AB+BC+CD+D
Kenya (2012)
Mauritius (2011)
South Africa (2014)
Botswana (2013)
Ghana (2013)
Lesotho (2012)
Seychelles (2011)
Cabo Verde (2016)
Comoros (2016)
Togo (2016)
Uganda (2012)
Rwanda (2010)
Tanzania (2013)
Benin (2014)
Guinea-Bissau (2014)
Mauritania (2014)
Sierra Leone (2010)
Zambia (2013)
Burundi (2012)
Mozambique (2015)
Burkina Faso (2014)
Central African Republic (2010)
Liberia (2016)
Niger (2017)
Senegal (2011)
Mali (2016)
Gro
up
1G
rou
p 2
Gro
up
3G
rou
p 4
D/D+
C/C+
B/B+
A

26
Knowledge of “what to do” and increased financial
resources are not enough
The challenge is implementation and specific
capacities are required
From “Science to Service Delivery” – Closing the
capacity gap
Alternative slide4. Address capacity gaps in Ministries of Education

Bridging the implementation gap – connecting to schools/teachers
Ministry of Finance
Ministry of Education
Technical Institutions
Policy Planning
Data Capacity
UnionsParentsElected Officials
CoordinationNegotiation Capacities
Accountability Incentives
Technical Capacity
Decentralized/Deconcentrated
Units
Schools

“Market Failure” in Capacity Building
Demand
•Longer term capacity needs fail to be
expressed
Ministry of Finance unwilling to borrow
• Short electoral cycles
•Longer term capacity building required
for:
• Specialized technical skills
• Soft areas- negotiation, coordination
•Needs “learning by doing”
Supply
• Usually from donors
• Short term/project based
• Related to planning rather than
implementation
• Or focused on implementation of
project
• Training of few staff
• Equipment, etc.
• International technical assistance
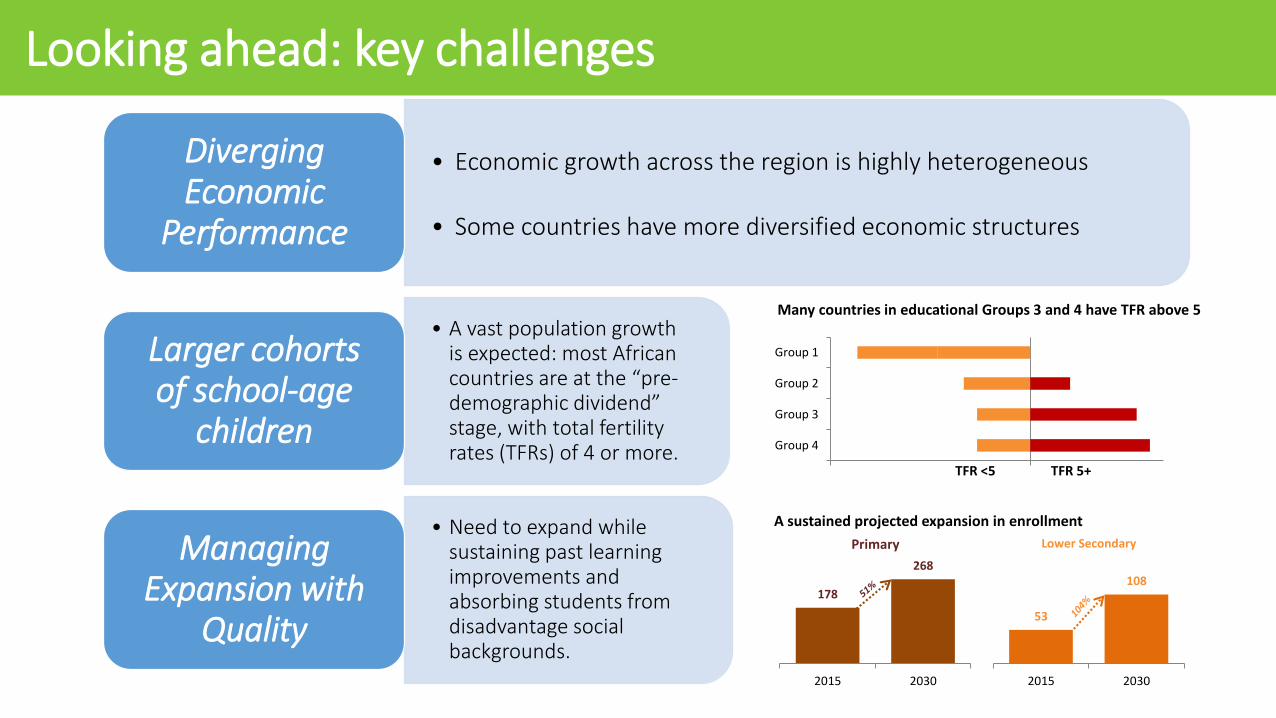
• Economic growth across the region is highly heterogeneous
• Some countries have more diversified economic structures
Diverging Economic
Performance
• A vast population growth is expected: most African countries are at the “pre-demographic dividend” stage, with total fertility rates (TFRs) of 4 or more.
Larger cohorts of school-age
children
• Need to expand while sustaining past learning improvements and absorbing students from disadvantage social backgrounds.
Managing Expansion with
Quality
Looking ahead: key challenges
Group 1
Group 2
Group 3
Group 4
Many countries in educational Groups 3 and 4 have TFR above 5
TFR <5 TFR 5+
A sustained projected expansion in enrollment
178
268
2015 2030
Primary
53
108
2015 2030
Lower Secondary

Thank You
Suggested citation:
Bashir, Sajitha, Marlaine Lockheed, Elizabeth Ninan, and Jee-Peng Tan. Forthcoming.
Facing Forward: Schooling for Learning in Africa. Washington, DC: World Bank
Annexes – Data Sources

32
Data Sources: Chapter 1, Country Groupings and Challenges
UIS.Statdatabase (UNESCO)
Country groupings,
GERs, Enrollment
(48 countries)
ISCED Mappings of Length Cycles
(48 countries)
Pole de Dakar (IIEP)
Country groupings,
Enrollment, GERs,
(48 countries)
Household Surveys
(WB)
Out of School Rates
(34 countries)
WDI (WB)
GDP, Growth of GDP
(40 countries)
Gini Index
(40 countries)
Poverty Headcount
(40 countries)
WPP 2015 (UN DESA)
Population Projections
(48 countries)
Population Growth
Rates (48 countries)
Ethnologue(SIL)
Linguistic Diversity
Index 2015
(47 countries)
7 countries
ACLED, Armed Conflict
Location and Event Data,
version 6
Number of conflicts (48 countries)
9 countries
33
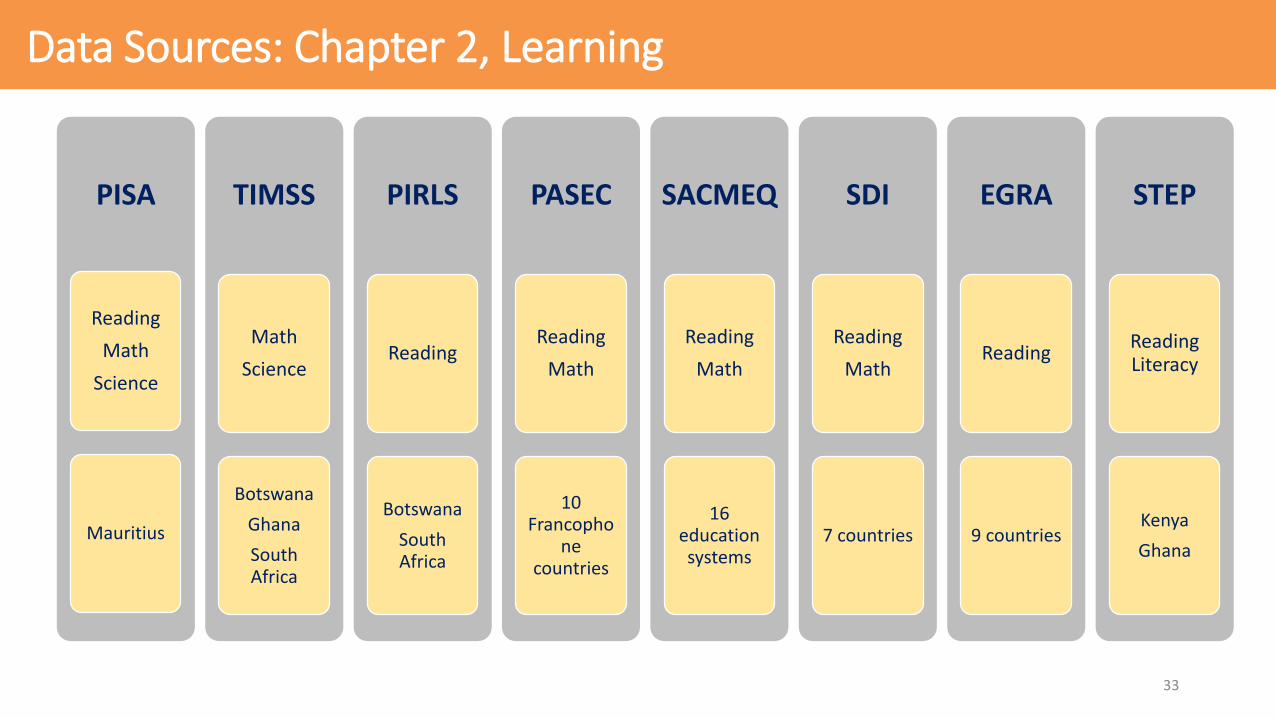
Data Sources: Chapter 2, Learning
PISA
Reading
Math
Science
Mauritius
TIMSS
Math
Science
Botswana
Ghana
South Africa
PIRLS
Reading
Botswana
South Africa
PASEC
Reading
Math
10 Francopho
ne countries
SACMEQ
Reading
Math
16 education systems
SDI
Reading
Math
7 countries
EGRA
Reading
9 countries
STEP
Reading Literacy
Kenya
Ghana
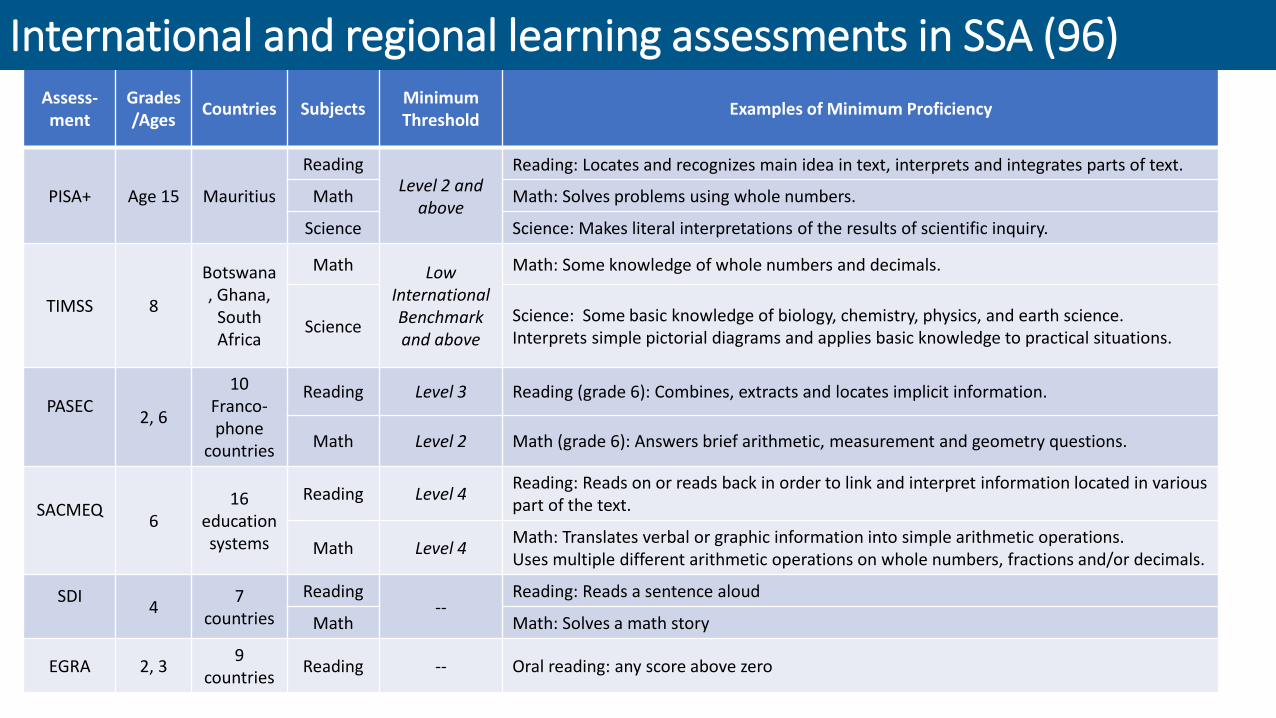
Assess-ment
Grades/Ages
Countries SubjectsMinimum Threshold
Examples of Minimum Proficiency
PISA+ Age 15 Mauritius
ReadingLevel 2 and
above
Reading: Locates and recognizes main idea in text, interprets and integrates parts of text.
Math Math: Solves problems using whole numbers.
Science Science: Makes literal interpretations of the results of scientific inquiry.
TIMSS 8
Botswana, Ghana,
South Africa
Math Low International Benchmark and above
Math: Some knowledge of whole numbers and decimals.
ScienceScience: Some basic knowledge of biology, chemistry, physics, and earth science. Interprets simple pictorial diagrams and applies basic knowledge to practical situations.
PASEC2, 6
10 Franco-phone
countries
Reading Level 3 Reading (grade 6): Combines, extracts and locates implicit information.
Math Level 2 Math (grade 6): Answers brief arithmetic, measurement and geometry questions.
SACMEQ6
16 education systems
Reading Level 4Reading: Reads on or reads back in order to link and interpret information located in various part of the text.
Math Level 4Math: Translates verbal or graphic information into simple arithmetic operations. Uses multiple different arithmetic operations on whole numbers, fractions and/or decimals.
SDI4
7 countries
Reading--
Reading: Reads a sentence aloud
Math Math: Solves a math story
EGRA 2, 3 9
countriesReading -- Oral reading: any score above zero
International and regional learning assessments in SSA (96)

35
Data Sources: Chapter 3, Student Progression
UIS.Stat database (UNESCO)
Bulge Analysis (all countries):
current, 103 countriestrend, 84 countries
Enrollment by grade
GERs in grade 1,
GIR in grade 1
GER in Pre-School
(Population projections by age, UN DESA)
Household Surveys (WB)
Over-age enrollment in grade 1
Repetition rates by grade 1
GERs by area, wealth
Distance to School
Gender Parity by area
Survival Rates grades 1-9
Drop-out reasons
(34 countries)
Other sources
Language Policies and Implementation:
EGRA reports , UNICEF, UNESCO (27 countries)
National Examinations: UIS, WB, ESP documents, national documents, WES, Nuffic
(43 countries)
Class size, SDI (Malawi)
Internet and Mobile Users
(Regional Averages)
ICT use: UIS Communication and Information database , InfoDeb, WB, MoE
(26 countries)

36
Data Sources: Chapter 4, Teachers
UIS.Statdatabase (UNESCO)
# of teachers, Total (P=38, S=32 countries)
Non-permanent (P=29 countries)
Class Size (25 countries), Textbooks
per pupil (32 countries)
Toilets, potable water and electricity in primary schools
(33 countries)
PTR (P=43 countries, S= 39 countries)
Household / Labor
Surveys (WB)
Teachers and comparator
groups:
educational attainment,
wages,
hours of work, second job,
hourly and annual pay
(13-16 countries)
EMIS data
Teacher deployment (Ghana, Cote
d'Ivoire)
Randomness in teacher
allocation
(P=28 countries,
S=8 countries)
SDI (WB)
Teacher absenteeism
(9 countries)
Teacher Pedagogy
Knowledge, Teaching Practices
( 6-7countries)
PASEC (2014) and SACMEQ
(2007)
Teacher knowledge (Only SACMEQ
2007, 11 countries)
Pre-Service Teacher Training (25 countries)
Prof. Development (15 countries)
In-service Training (10 countries)
Essential conditions (23-25 countries)
Other sources
STEP (Ghana and Kenya)
TIMSS and
TED-S (Botswana)
37
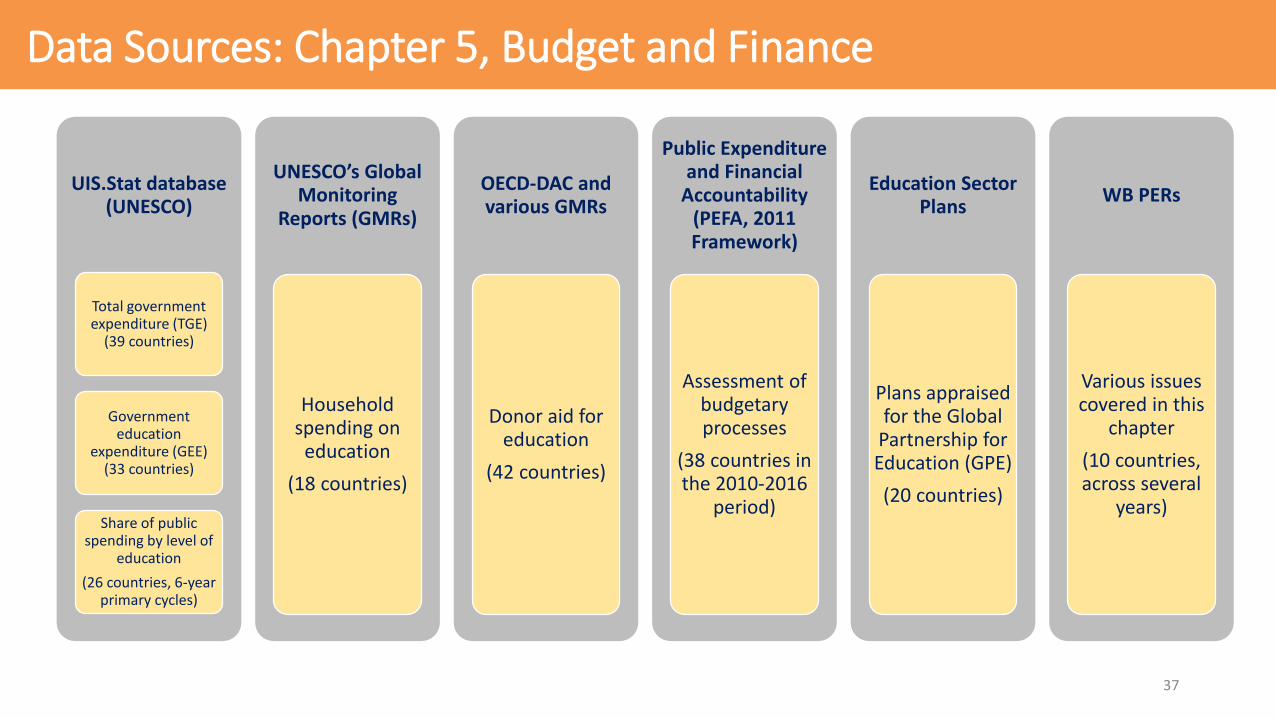
Data Sources: Chapter 5, Budget and Finance
UIS.Stat database (UNESCO)
Total government expenditure (TGE)
(39 countries)
Government education
expenditure (GEE) (33 countries)
Share of public spending by level of
education
(26 countries, 6-year primary cycles)
UNESCO’s Global Monitoring
Reports (GMRs)
Household spending on
education
(18 countries)
OECD-DAC and various GMRs
Donor aid for education
(42 countries)
Public Expenditure and Financial
Accountability (PEFA, 2011 Framework)
Assessment of budgetary processes
(38 countries in the 2010-2016
period)
Education Sector Plans
Plans appraised for the Global
Partnership for Education (GPE)
(20 countries)
WB PERs
Various issues covered in this
chapter
(10 countries, across several
years)

38
Data Sources: Chapter 6, Capacity Gap
UIS.Stat database (UNESCO)
Selected indicators in three domains: enrollment, teachers and spending
Coverage: at least one year in 2000-04, 2005-09, and 2010-15
periods
Number of countries with valid data increases over time
World Bank Internal Survey
Data collected through questionnaires addressed
to Bank staff working in different
Sub-Saharan African countries.
Information available on 26 countries

39
Data Sources: Chapter 8, Coda
Enrollment Projections
Prepared for Ethiopia, Ghana, Kenya, and Senegal
Inputs:
Population Projections:
WPP 2012
Patterns of Student Flows:
Household Surveys
Student Teacher Ratios (STRs):
UIS.Stat database (UNESCO)
WPP 2017
(UN DESA)
Total Fertility Rates, TFR
(46 countries)
World Bank
Robustness of economic performance, 1995–2016
(45 countries)