Embed Size (px)
Citation preview

Facing the New Marketing RealityCustomer data visualization for the smart marketer
Table of contents
The Situation:A day in the life
3
The challenge:Does this sound familiar?
5
The how:How Visual Analytics drives omnichannel conversions
15
The solution: Visual Analytics to the rescue
8
The why:The Benefits of Visual Analytics for marketing
12
The outcome:What Visual Analytics can do for your marketing
18
The e-book ‘Facing the New Marketing Reality’ looks at the challenges marketing faces today and how data visualization and easy-to-use analytics come to the rescue. It demonstrates how companies in various industries have made
great strides forward in marketing effectiveness by making marketing data and reporting readily available. Welcome to the new marketing reality.
1
4 5
2 3
6

The situationA day in the life
1
How well are marketers coping with this new reality?
Up until now, smart marketing analytics was lagging behind.
But data-driven insights and the first steps in analytics are changing all that.Marketing is now entering the era of approachable analytics, with marketers finally having access to intuitive and easy-to-use self-service data discovery and analytics.
Going forward, marketing is no longer dependent on IT or the data scientist to discover campaign opportunities. The marketer is regaining his/her independence, while staying firmly rooted in data.
We’re witnessing the birth of a new marketing reality!
These are challenging times for businesses and their
marketing departments. Everything has become digital
and fluid. New technologies like IoT and NFC (near field
communication) are just around the corner. Data makes
the world go round and round. The speed of change has
increased enormously.
Learn more about Visual Analytics for Marketing 4TABLE OF CONTENTS

The challengeDoes this sound familiar?
2
But combining all of that, is hard for many marketers. Even today.
• As marketers, we have to deliver insights and results on the spot, but with so many different tools and technologies in place, and so many different channels being deployed, getting all the data together isn’t just tough, it’s almost impossible to do in a short period of time. And way too often, marketing still needs help from the IT team to get this realized.
• As marketers, we must optimise our spending continuously, in other words, do more with less budget. A proper analysis of return on marketing investment (ROMI) can help, but with data dispersed across systems and teams, getting a 360° view of the customer and his/her journey, is hard.
• As marketers, we are under constant pressure for more and better qualified leads. But how can we do this when we have an unclear or incomplete image about which marketing channels deliver what type of impact? How can we solve the attribution problem and truly know which marketing euro delivers which type of revenue?
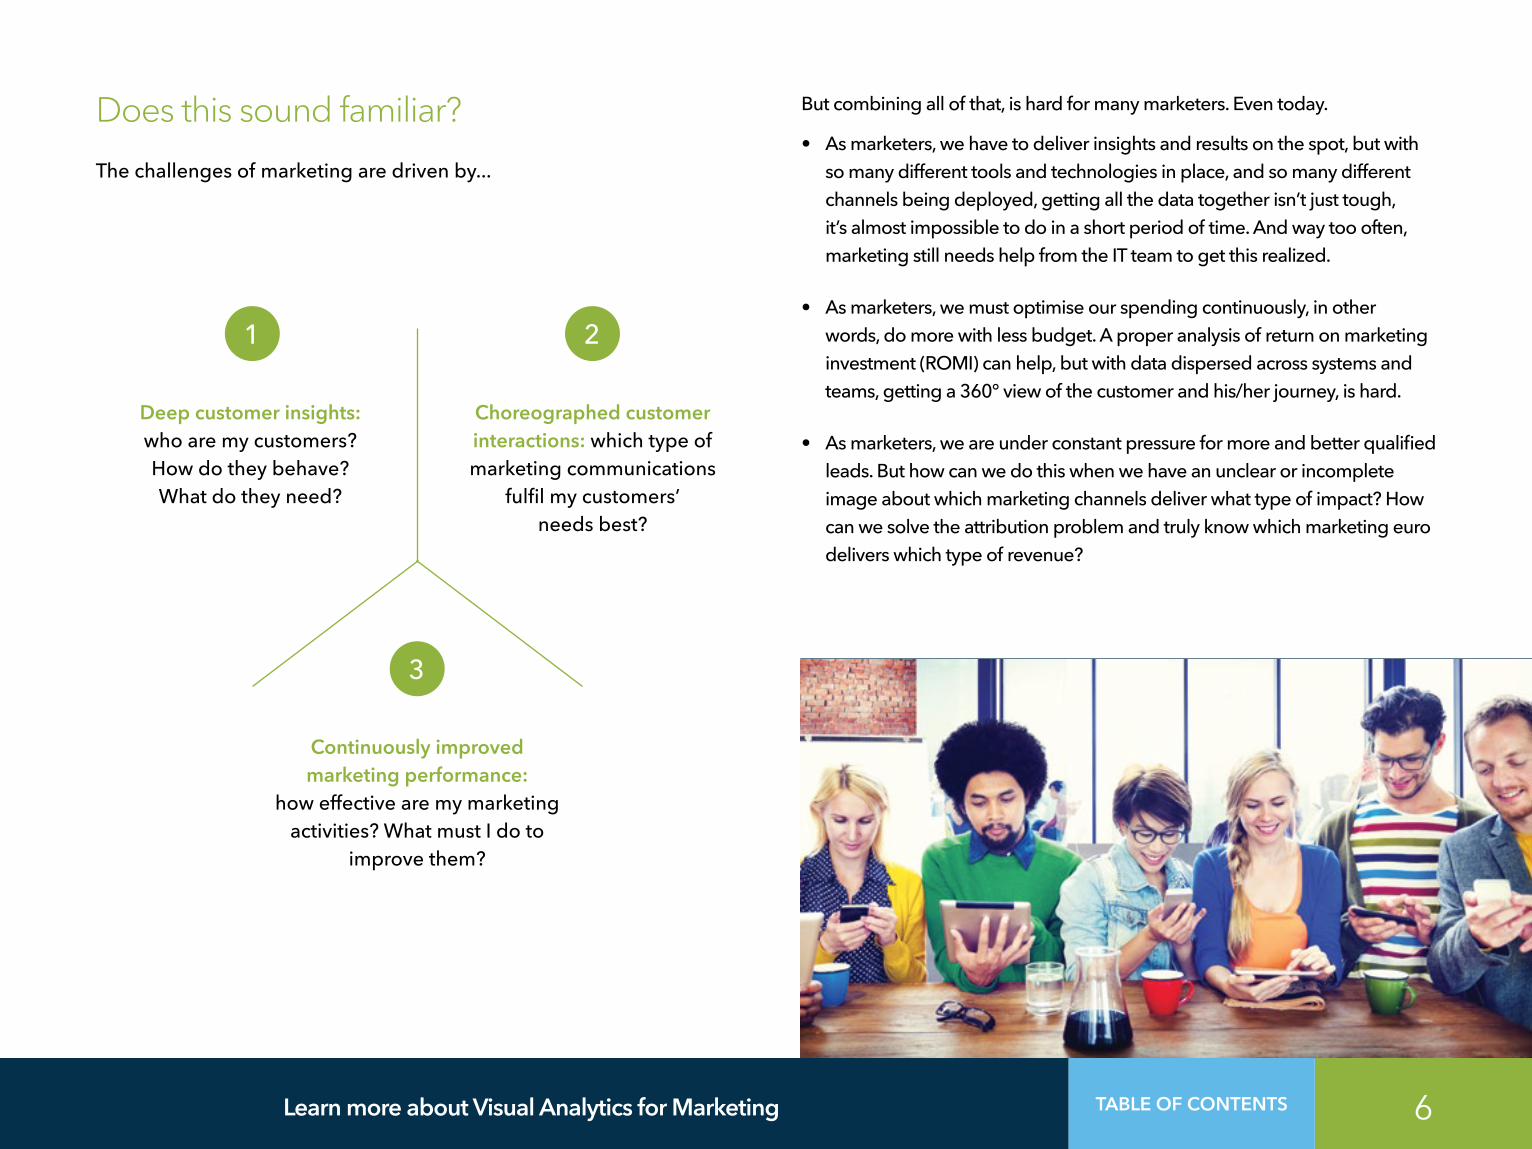
Does this sound familiar?
The challenges of marketing are driven by...
Deep customer insights: who are my customers? How do they behave? What do they need?
Continuously improved marketing performance:
how effective are my marketing activities? What must I do to
improve them?
Choreographed customer interactions: which type of marketing communications
fulfil my customers’ needs best?
1
3
2
6Learn more about Visual Analytics for Marketing TABLE OF CONTENTS

The problem with technology
Technology has radically changed the marketing profession and marketers really have embraced these new technologies. But when it comes to understanding the value and impact of each channel, insights have been lacking.
This is due to…
… a lack of data integration. Data is dispersed across the organisation. It resides in different databases owned by different teams. The siloed organisation—people as well as technology wise—is holding marketers back.
… a lack of data applicability. Data is not only dispersed, it’s also very heterogeneous. There is little uniformity or standardization, making comparing data difficult.
… a lack of data insights and skills. Marketers have begun to bring more analytic talent into their teams, but the right balance hasn’t been found yet. The result: many marketers are unable to make proper sense of the data.
The 360° customer image
360° customer insights are based on 4 key tenets:
When properly combined, a holistic
visualization of the customer can be built
around which relevant and personalized
campaigns can be constructed.
Socio-demographic and transactional info
Who are my customers?
What type of content did my customers receive?
How did they respond?
What do they say (online)?
Who do they influence?
How do they interact?
How loyal are my customers?
What value do they deliver?
What (additional) potential do they have?
Analytics
Contact history
Online and social
7Learn more about Visual Analytics for Marketing TABLE OF CONTENTS

The solutionSAS® Visual Analytics to the rescue
3

Visual Analytics to the rescue
Technology disrupted the marketing profession and it’s also technology that will come to its rescue.
Visual Analytics is your very own customer insights centre, making all relevant data and reporting readily available. From now on, the marketer is in the driving seat:
• Within Visual Analytics, different datasets from various resources, can easily be added to the tool.
• There’s no need to merge or standardize every possible data point: separate datasets can be uploaded and pulled into a single view.
• By placing different datasets on one and the same screen, correlations become visible and cross analyses can be performed.
• Marketers no longer have to wait for all the data to be integrated and interlinked. Consequently, the data integration pitfall can be avoided and marketers can now create their own insights independently of IT.
This creates a series of quick gains for the marketer:
• Through the visualization, data becomes understandable again.
• Campaign results are monitored visually and optimizations can be done continuously.
• More effective and efficient campaigns mean better optimized marketing expenditures.
• Discovering and testing new target groups, segments and markets can now happen much faster.
Visual Analytics is the closed loop marketing command centre for every marketer who wants to gain better insights into business cycles and campaign results through real-time reporting.
9Learn more about Visual Analytics for Marketing TABLE OF CONTENTS
The 360° customer view pitfall
Visual Analytics helps marketers to overcome the data integration pitfall, which comprises many different elements:
• The size of the data: how large are the datasets to be included?
• Data standardization: how standardized must all data be?
• Data provenance: how can we track which data comes from which resource?
• Data integration: to what level of detail must data be integrated?
Especially the latter is important, as it often leads to a `chicken and the egg’ discussion. In an ideal world, all data is fully integrated, standardized, while provenance is clearly indicated. But doing so takes a lot of time. Time which marketers usually don’t have!
So what to do? Do we aim for the ideal situation (full data integration, but very time consuming) or do we settle for partial data integration that generates immediate insights?
By opting for the latter, marketers can gain far more insights much faster. While, in the background, additional, more in-depth integration can still happen.
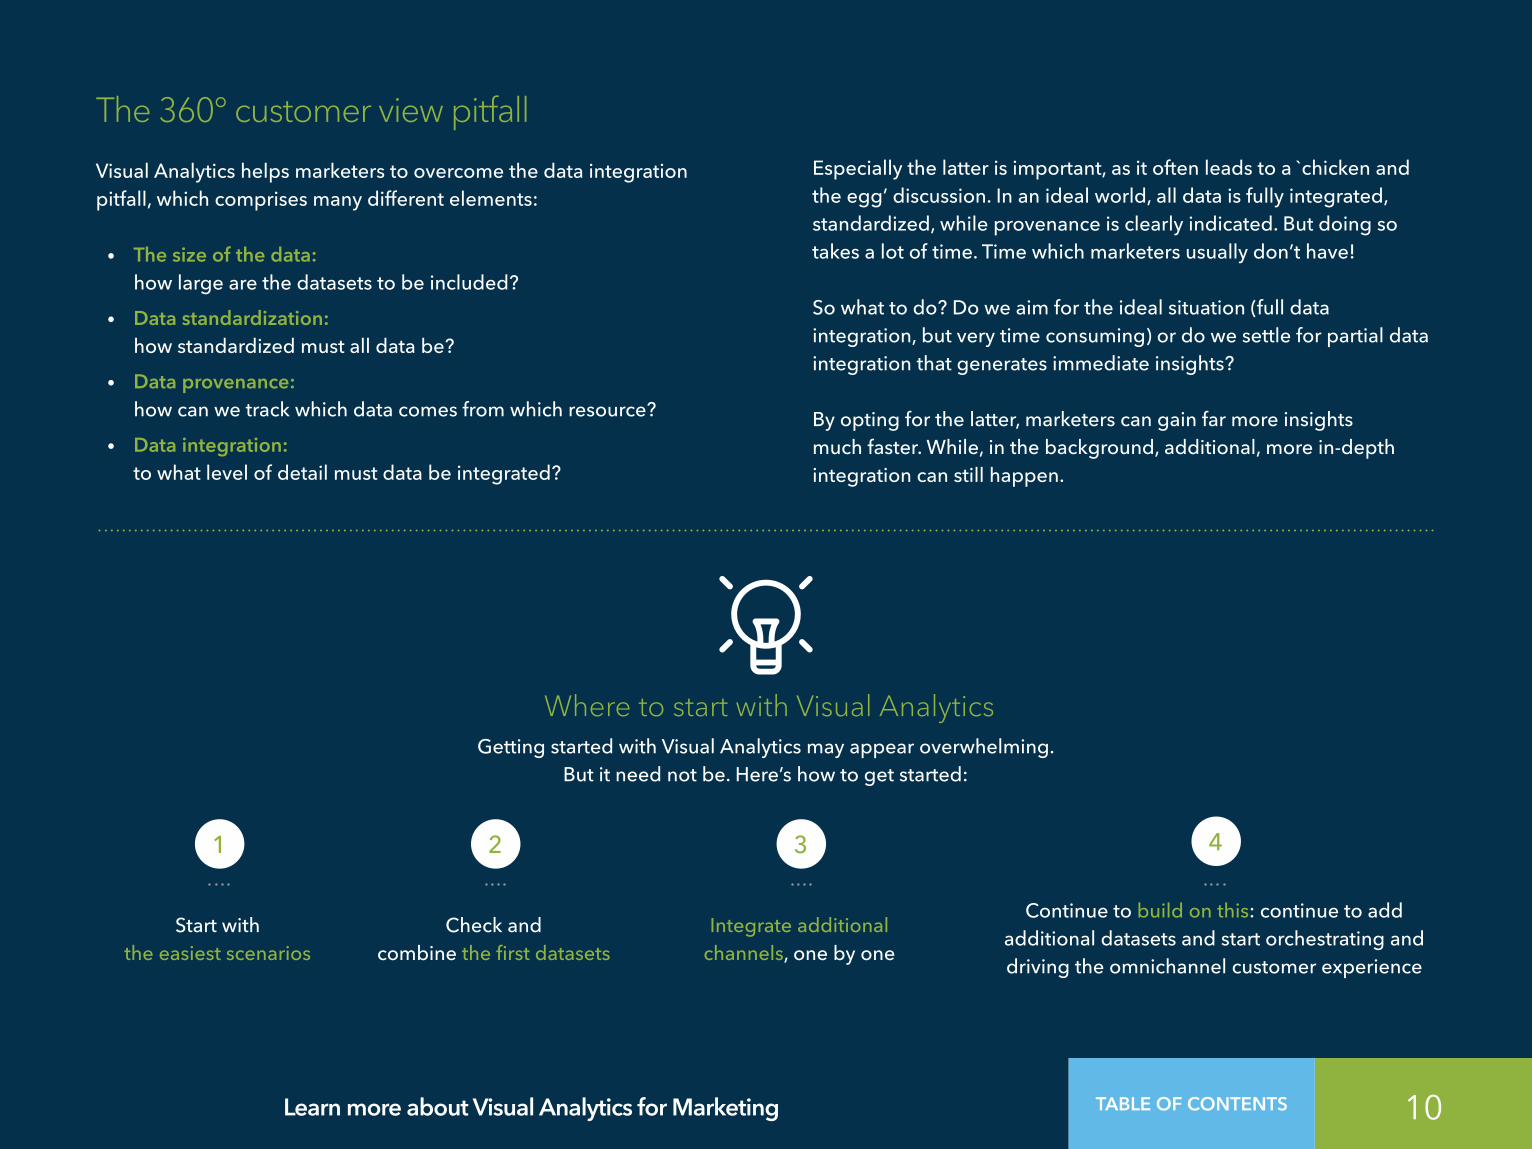
Getting started with Visual Analytics may appear overwhelming. But it need not be. Here’s how to get started:
Where to start with Visual Analytics
Start with the easiest scenarios
Integrate additional channels, one by one
Check and combine the first datasets
Continue to build on this: continue to add additional datasets and start orchestrating and driving the omnichannel customer experience
1 32 4
10Learn more about Visual Analytics for Marketing TABLE OF CONTENTS
Visual Analytics and the marketing organization today
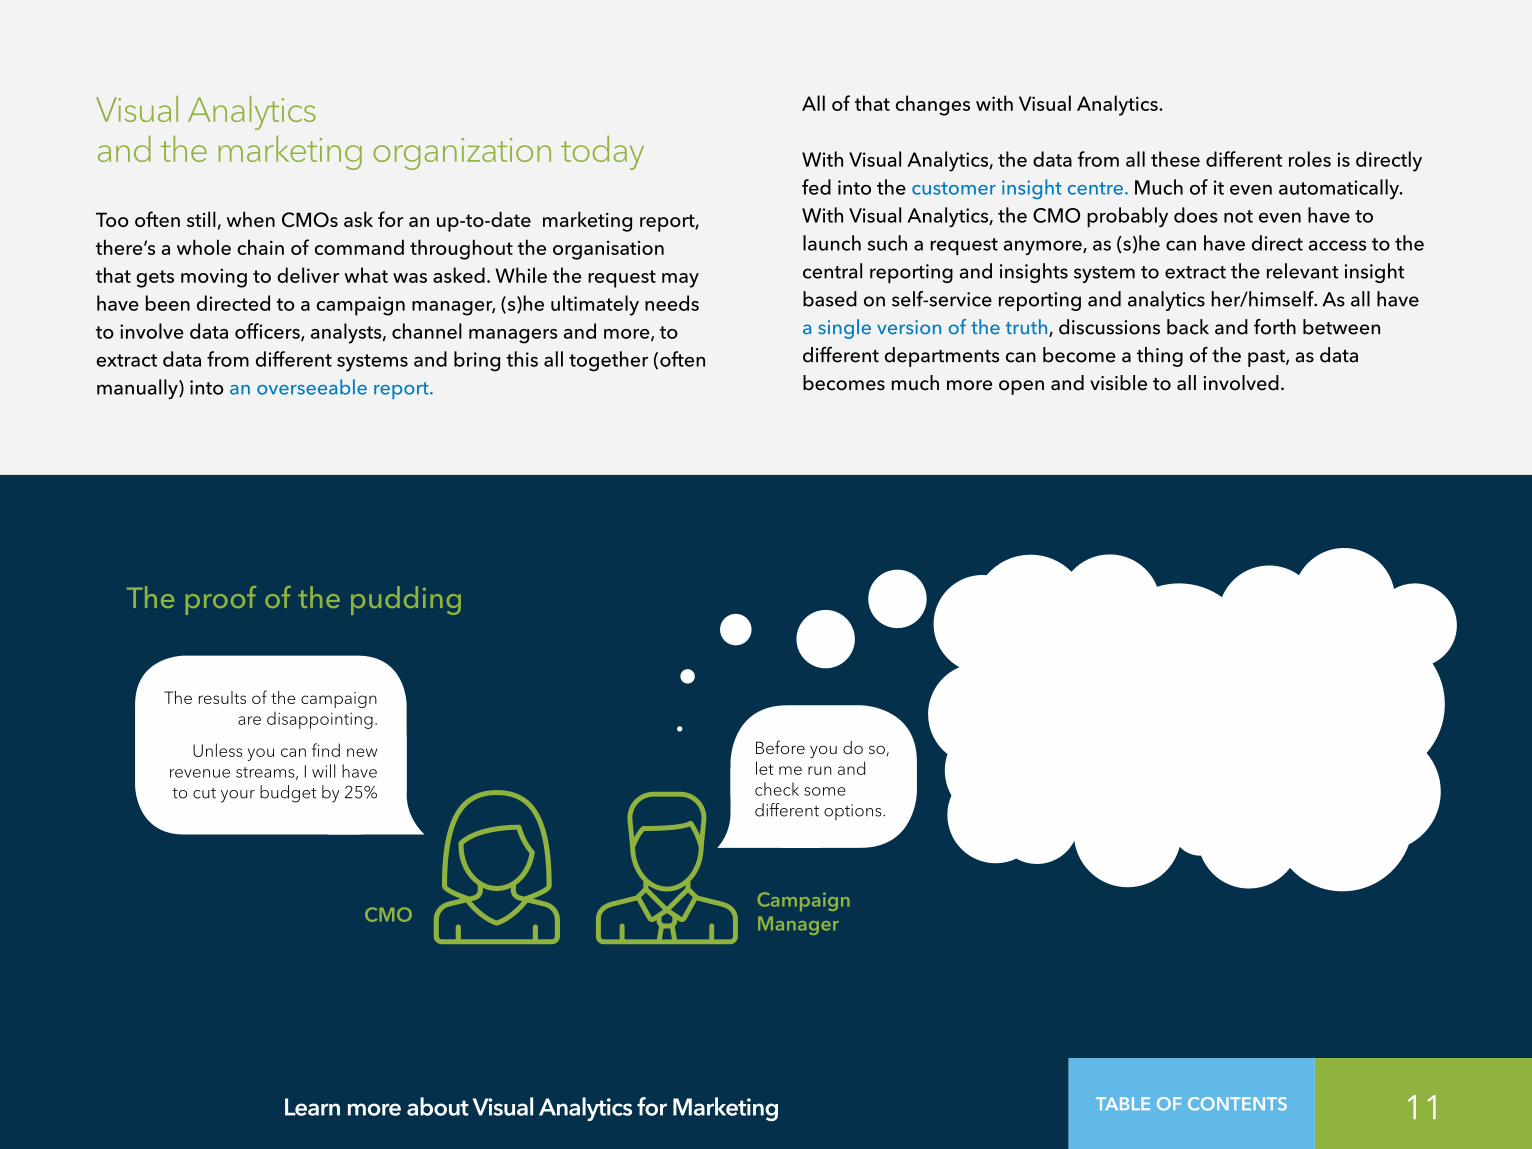
Too often still, when CMOs ask for an up-to-date marketing report, there’s a whole chain of command throughout the organisation that gets moving to deliver what was asked. While the request may have been directed to a campaign manager, (s)he ultimately needs to involve data officers, analysts, channel managers and more, to extract data from different systems and bring this all together (often manually) into an overseeable report.
All of that changes with Visual Analytics.
With Visual Analytics, the data from all these different roles is directly fed into the customer insight centre. Much of it even automatically. With Visual Analytics, the CMO probably does not even have to launch such a request anymore, as (s)he can have direct access to the central reporting and insights system to extract the relevant insight based on self-service reporting and analytics her/himself. As all have a single version of the truth, discussions back and forth between different departments can become a thing of the past, as data becomes much more open and visible to all involved.
The proof of the pudding
CMOCampaign Manager
The results of the campaign are disappointing.
Unless you can find new revenue streams, I will have to cut your budget by 25%
Before you do so, let me run and check some different options.
What would happen if we apply a regional promotion mix?
As of when do we need to change our instore promotions?
Where is the cut-off point between marketing and sales and which increase would generate the biggest leverage?
What does my market segment look like and where can I find more of it?
What are the best potential cross sell actions?
What type of leverage can we create in merchandising? Operations? Supply chain?
11Learn more about Visual Analytics for Marketing TABLE OF CONTENTS

The whyThe Benefits of Visual Analytics
for marketing
4
The benefits of Visual Analytics for marketing
With Visual Analytics…
• Marketers and other business users can now browse through the data and quickly uncover problems thanks to the user friendliness of the system.
• Interactive charting and easy approachable analytics bring data insights within reach of everyone.
• You no longer get stuck when you’ve identified the key problem with a marketing campaign, as you immediately start visualizing possible solutions.
• Marketing insights pop up much faster, greatly speeding up marketing decision-making.
With Visual Analytics, the accuracy of decision-making is improved, as more data is included and trends and correlations are visually clarified. Complex and complete reporting no longer takes up hours of work but is now done instantly, with a simple click. At the same time, marketing analytics moves away from just reporting (describing the way things are) and moves into forecasting (predicting and prescribing marketing’s next best move). New ideas for additional ad hoc campaigns, for example towards satellite segments, can quickly be found and trialled.
With Visual Analytics, marketing hindsight is replaced by marketing insight and foresight as data is being democratized. Visual Analytics takes the data out of the hands of the data scientists and gives it back to the marketer. As a marketer, you can now also better collaborate with other teams within the organisation: much of your data-driven marketing insights will, in fact, use much of the data from these other departments. Consequently, a 360° view of the customer is created and the whole organisation now moves towards a single, data-driven version of the truth.
The case for approachable analytics
• With Visual Analytics, you start with a blank canvas.
• Start by building your decision tree: what is the main dataset from which you want to start? Which additional datasets do you add next? And next, after that?
• Drag and drop the relevant datasets in your decision tree.
• The analysis is formalized automatically by the tool.
• Visualization makes possible correlations instantly clear, greatly improving your next action decision-making process.
13Learn more about Visual Analytics for Marketing TABLE OF CONTENTS

The ad hoc marketer
Although most marketers love to plan, very often, when opportunity knocks, they also have to jump right in and deliver results within hours (or less). Ad hoc campaigns are part of the marketer’s daily reality, and there’s no reason to be less analytic or KPI-driven about these.
Consider the case of a large supermarket chain. There’s a surplus of a specific fresh ingredient, e.g. tomatoes, that risks not getting sold in time. There’s only a short window of opportunity to drive additional customer traffic to the stores, so the marketing campaign needs to be set up in the morning and sent out in the afternoon, targeting people who are about to head home from work.
Going through the database, the marketers identify those customers that…
Based on this, targeted emails can be created and sent. These not only include a promotion code for this item, but also a series of suggested recipes that comprise this specific item. A
working mum with a family of four is emailed a different promotion code and different recipes compared to a young man who’s in a relationship.
Frequently purchase this fresh item
Probably don’t have much of it in house
(as they haven’t been to the store last week while they usually are very consistent)
Frequently use this product and regularly enjoy home-cooked meals
(based on their overall purchase history).
1
2 3
14Learn more about Visual Analytics for Marketing TABLE OF CONTENTS

The howHow Visual Analytics drives omnichannel
conversions
5

How Visual Analytics drives omnichannel conversions
Consider the case of a large bank that isn’t converting enough customers to buy a mortgage, despite having over 350 000 website visitors a day. The bank’s marketing team used Visual Analytics to better understand 1) the triggers that drive online conversion combined with 2) a better understanding of which customers to target.
• Using different datasets from different sources, the marketing department drew up a path to purchase, starting from a website visit all the way to a mortgage contract being signed.
• For each step along the path to purchase, 1) related content offers were selected and suggested (e.g. a mortgage simulation tool) and 2) triggers were defined (e.g. if a visitor is active for more than 10 minutes or visited 30+ pages, this generated a specific trigger).
• Each trigger received a score and was plotted on the path to purchase.
Note: when doing so, it’s important to bear in mind the `recency’: activities that are more recent should receive a higher score!
• All of this is then put together in a customer profile score. Depending on 1) the score and 2) where on the ‘path to purchase’ the customer was, relevant content or possible follow-up actions were suggested to the visitor. For example: a score of < 10 led to no action; a score of 10 – 20 led to an email communication being initiated; a score of 20 – 30 triggered a follow-up call by a call centre agent; a score of >30 was considered a hot lead and additional actions were taken.
As such, the marketing department was able to…
1. Identify the complex ‘moments of truth’ for each customer
2. Generate personalized and relevant offers to maximize the conversion rate and revenue
3. Make the right budget investments for every marketing channel
Visit home page
+3 points +4 points+7 points +5 points +3 points
Analyse types of mortages
INFORM THE CUSTOMERThe path to purchase
CONVERT THE CUSTOMER
Readblog post
E-mail with special offerMake
simulations
Pop up“make and
appointment”Visit
to the branch
16Learn more about Visual Analytics for Marketing TABLE OF CONTENTS
The two sides of becoming a marketing math (wo-)man
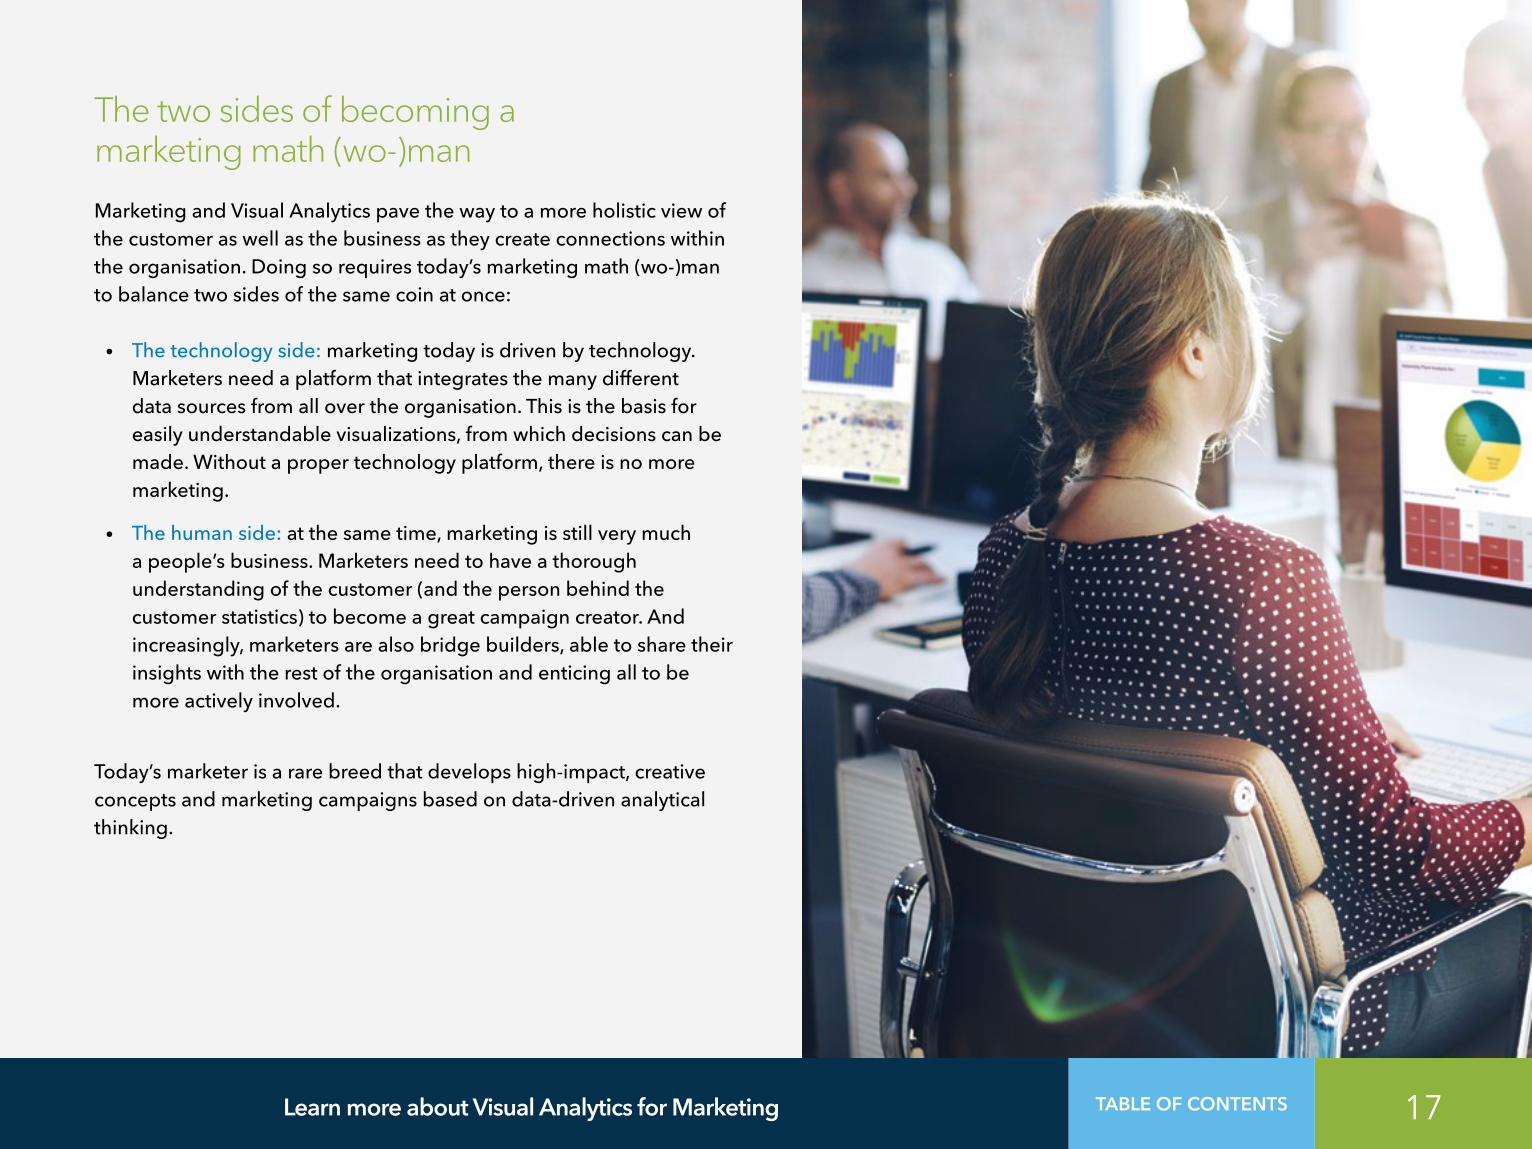
Marketing and Visual Analytics pave the way to a more holistic view of the customer as well as the business as they create connections within the organisation. Doing so requires today’s marketing math (wo-)man to balance two sides of the same coin at once:
• The technology side: marketing today is driven by technology. Marketers need a platform that integrates the many different data sources from all over the organisation. This is the basis for easily understandable visualizations, from which decisions can be made. Without a proper technology platform, there is no more marketing.
• The human side: at the same time, marketing is still very much a people’s business. Marketers need to have a thorough understanding of the customer (and the person behind the customer statistics) to become a great campaign creator. And increasingly, marketers are also bridge builders, able to share their insights with the rest of the organisation and enticing all to be more actively involved.
Today’s marketer is a rare breed that develops high-impact, creative concepts and marketing campaigns based on data-driven analytical thinking.
17Learn more about Visual Analytics for Marketing TABLE OF CONTENTS

The conclusionWhat Visual Analytics can do
for your marketing
6
What Visual Analytics can do for your marketing
While it takes companies and marketing organizations some time to make the shift to data-driven marketing, Visual Analytics enables you to quickly move beyond the technical part and focus instead on making the right marketing analyses and decisions.
• Define the optimal marketing mix. Stop guessing what channels work better for which target group. Visual Analytics clearly shows you which channels deliver which attribute along the customer journey.
• Within Visual Analytics, every touch point along the customer journey can be analyzed. Each touch point receives a certain weighting, based on the channel’s actual relevancy to the sales revenue. More and less relevant channels can be highlighted and investments can be optimized accordingly. Don’t let another marketing euro go to waste because of a lack of insight!
• Define the optimal promotion. No two customers are alike. So the type of content that you deliver to each customer at each point in the customer journey, should be optimized as much as possible.
• For every individual customer, we can generate insights based on segmentation and individual profiling, which can be used to optimize the right kind of promotion presented at the right time. Become truly customer intimate based on the data-driven foresights.
• By visualizing the sales generated by promotion and region, a more optimal geolocation based marketing mix can be set up. For example, a comparison between loyalty card rebate and coupons across regions showed a large retailer that it is more effective to promote the use of coupons in some regions versus loyalty cards in others.
• Forecast how much budget needs to be invested to reach a certain sales target.
• Decisions to increase or decrease marketing investments should be based on forecasts. Don’t go off flying blindly: Visual Analytics is your radar that tells you exactly where you need to go to achieve a certain result. Data-driven marketing means the end of gut-feeling marketing decisions.
• Define the minimum investment threshold needed to generate impact.
• Optimizing your marketing budgets in times of budget cuts can be extra challenging. But every campaign has its minimum threshold budget: investment below a certain threshold will not generate the desired effect and will cause you to lose money. Visual Analytics clearly indicates as of which budget threshold your marketing euros are (or aren’t) delivering impact.
19Learn more about Visual Analytics for Marketing TABLE OF CONTENTS
Follow us:
Read here Watch here
Learn more about Visual Analytics
SAS and all other SAS Institute Inc. product or service names are registered trademarks or trademarks of SAS Institute Inc. in the USA and other countries. ® indicates USA registration. Other brand and product names are trademarks of their respective companies. Copyright © 2016, SAS Institute Inc. All rights reserved. 00000.0000US
For more information, contact your local SAS office
Without analytics, there is no more marketing. And Visual Analytics give you all the insights you need to be a high-flying marketer.
Today’s marketer must be able to prove exactly the ROI of every spent marketing euro. That’s the only type of marketer who will be able to increase the marketing budget. Again and again.
It’s time to move out of the descriptive data zone, and take up permanent residence in the predictive and prescriptive areas.
Become the smarter marketer you know you can be!
Embrace SAS® Visual Analytics for marketing today.


![[Prospect-Facing] Sales & Marketing Alignment Playbook](https://img.pdfslide.net/doc/110x75/627a7a8b73b5b60f3843492a/prospect-facing-sales-amp-marketing-alignment-playbook.jpg)