Embed Size (px)
Citation preview

1
FACT BOOK 2013 – 2014
Prepared by the Office of Institutional Reporting & Assessment
Texas A&M University at Galveston 1001 Texas Clipper Road Galveston, Texas 77553
Texas A&M University is fully accredited by the Commission on Colleges of the Southern Association of Colleges and Schools (SACS). As a branch campus, Texas A&M Galveston is included in that process. Maritime Systems Engineering (MASE) is accredited by the Engineering Accreditation Commission and Marine Engineering Technology (MARR) is accredited by the Engineering Technology Accreditation Commission, both of the Accreditation Board for Engineering and Technology. Included in the Texas A&M Galveston Fact Book are general statistics about the institution and its student population. The information provided is through collection of data by the Office of Institutional Reporting and Assessment and the Texas Higher Education Coordinating Board reports. The information included herein is for the 2012 – 2013 academic school year.

2
I. INSTITUTIONAL PROFILE
Texas A&M University at Galveston TYPE OF INSTITUTION: Public, four year established in 1962 as a part of the A&M System. Texas A&M University at Galveston offers undergraduate and graduate (masters and PhD) level courses. ENROLLMENT: The enrollment at Texas A&M University at Galveston has steadily risen since its inception. In the Fall of 1990, enrollment was 1,075 students. A decade later in the Fall of 2000, enrollment reached 1,363 students. By Fall of 2013 enrollment had increased to 2174. AGE: Texas A&M University at Galveston serves a wide range of students. Based on the Fall 2013 Semester, the average age for first time freshmen was 18.18 years; for all undergraduates the average age was 21.3 years; for graduates, inclusive of post-baccalaureates, the average age was 29.0 years, and for all students the average age was 21.83 years. The age range of Galveston students was from 17 to 71. GENDER: Over one third of the student population at Texas A&M University at Galveston was female (37.3% for Fall 2013). ETHNICITY: Based on Fall 2013 enrollment and Coordinating Board categories, 77.5% of students were white, 14.2% were Hispanic, 2.3% were of mixed ancestry, 2.6% were Black, 1.6% were Asian, 1.0% were international, 0.64 were American Indian/Alaskan Native, 0.2% were Hawaiian or Pacific Islanders and 0.2% did not indicate their ethnicity. GRADUATES: During the 2013-2014 academic year, Texas A&M University at Galveston awarded 353 degrees (BA, BS and MS). FULL & PART-TIME: The Fall 2013 figures reflected 91% of Texas A&M University at Galveston students attended on a full-time basis and 9% attended on a part-time basis. TYPE OF STUDENTS: Based on the Fall 2013 semester, 83.7% indicated being Texas residents, 14.42% were students that represented 42 other states, 0.92% were International representing 19 countries, 24.29% indicated being first generation. The largest segment of the student population was freshmen (30%). Students seeking a Bachelors represented 93.1%, Masters 4.68% and PhD 1.37%. The Texas Maritime Academy included 423 license option; 55 Reserve Officer Training Corps; 25 Drill and Ceremony and 41 Strategic Sealift Officer students. Texas A&M University at Galveston serves as the “ocean oriented campus” of Texas A&M University. The campus offers a unique blend of marine and maritime programs, including majors in science, business, engineering, and transportation. The atmosphere fostered by the faculty, staff, and students emphasizes the intimate relationship between the university and the sea.

3
Historical Trends
Enrollment by academic year: (04-05 to 13-14).
Credit hours by semester: (04-05 to 13-14).
0
500
1000
1500
2000
2500
AY 04-05 AY 05-06 AY 06-07 AY 07-08 AY 08-09 AY 09-10 AY 10-11 AY 11-12 AY 12-13 AY 31-14
He
ad C
ou
nt
Academic Year
Enrollment Trends
Fall
Sp
Sum
0
5000
10000
15000
20000
25000
30000
35000
AY 04-05 AY 05-06 AY 06-07 AY 07-08 AY 08-09 AY 09-10 AY 10-11 AY 11-12 AY 12-13 AY 13-14
Cre
dit
Ho
urs
Academic Year
Credit Hour History by Semester
Fall
Sp
Sum

4
Credit hour history by academic year: (04-05 to 13-14).
Historical enrollment trends by fall semester: (04-05 to 13-14).
46415 47585 44888 46100 45884
50970 52034
56280 56442
62928
0
10000
20000
30000
40000
50000
60000
70000
AY 04-05 AY 05-06 AY 06-07 AY 07-08 AY 08-09 AY 09-10 AY 10-11 AY 11-12 AY 12-13 AY 13-14
Cre
dti
Ho
urs
Academic Year
Credit Hour History by Academic Year
1585 1639 1523 1565 1566
1720 1805 1952 1905
2045
30 38 33 49 46
54 63
84 109 129
0
500
1000
1500
2000
2500
AY 04-05 AY 05-06 AY 06-07 AY 07-08 AY 08-09 AY 09-10 AY 10-11 AY 11-12 AY 12-13 AY 13-14
He
ad C
ou
nt
Academic year
Fall Enrollment Trends
GD
UG

5
Historical enrollment trends by spring semester: (04-05 to 13-14).
Historical enrollment trends by summer semester: (04-05 to 13-14).
1451 1464 1398 1386 1513 1503
1693 1788 1749
1886
30 35 57 51 50 64
70 92 118
139
0
500
1000
1500
2000
2500
AY 04-05 AY 05-06 AY 06-07 AY 07-08 AY 08-09 AY 09-10 AY 10-11 AY 11-12 AY 12-13 AY 13-14
He
ad C
ou
nt
Academic Year
Spring Enrollment Trends
GD
UG
490 519 485 529 456
580 557 568
683 790
30 15 20
37
36
31 27 39
61
81
0
100
200
300
400
500
600
700
800
900
1000
AY 04-05 AY 05-06 AY 06-07 AY 07-08 AY 08-09 AY 09-10 AY 10-11 AY 11-12 AY 12-13 AY 13-14
He
ad C
ou
nt
Academic Year
Summer Enrollment Trends
GD
UG

6
Historical enrollment trends by fall semester: (04-05 to 13-14).
Historical enrollment trends by spring semester: (04-05 to 13-14).
716 725 660 677 657 712 731
796 792 810
899 952
893 937 955
1062 1137
1240 1222 1364
0
500
1000
1500
2000
2500
Fall 04 Fall 05 Fall 06 Fall 07 Fall 08 Fall 09 Fall 10 Fall 11 Fall 12 Fall 13
Fall Enrollment Trends by Gender
Male
Female
649 643 606 597 657
633 701
755
705
747
832 856 849 840
906 934
1062
1125 1162 1278
0
500
1000
1500
2000
2500
Sp 05 Sp 06 Sp 07 Sp 08 Sp 09 Sp 10 Sp 11 Sp 12 Sp 13 Sp 14
Spring Enrollment Trends by Gender
Male
Female

7
STUDENT PROFILE, FALL 2013
Enrollment by Age: Undergraduate only, Post-baccalaureate, Masters and PhD excluded
1123
742
197
58 23 12 11 6 4 1
0
200
400
600
800
1000
1200
17-20 21-25 26-30 31-35 36-40 41-45 46-50 51-55 56-60 61+
Nu
mb
er
pe
r G
rou
p
Age
Fall 2013: Enrollment by Age
Males - 1364 63%
Females - 810 37%
Fall 2013: Enrollment by Gender

8
Ethnicity is based on Coordinating Board classifications
White, 1685, 78%
Black, 57, 3%
Hisp, 309, 14%
Asian, 34, 2%
Nat Am, 8, 0% Int, 22, 1%
Mixed, 51, 2%
HA/PI, 4, 0%
Unk, 4, 0%
Fall 2013: Enrollment by Ethnicity
Res -1847 85%
Non-Res - 301 14%
Int - 26 1%
Fall 2013: Enrollment by Residency

9
Non-resident includes 40 states plus Puerto Rico. International represents 23 countries.
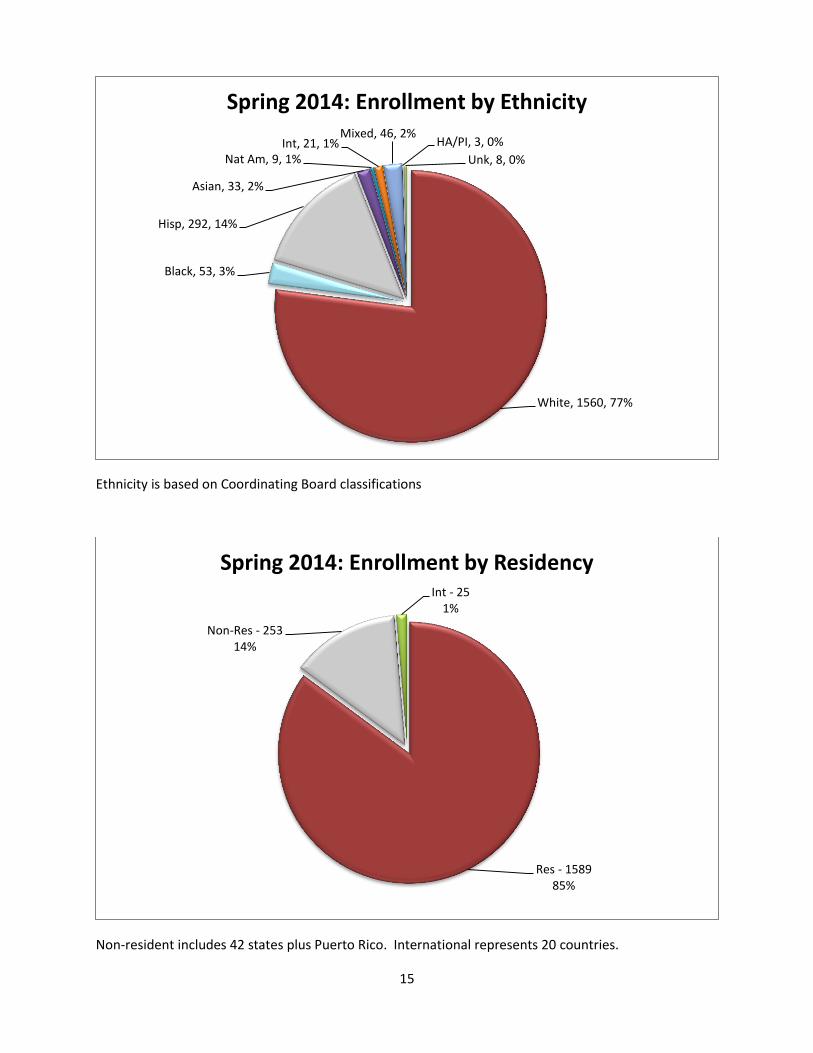
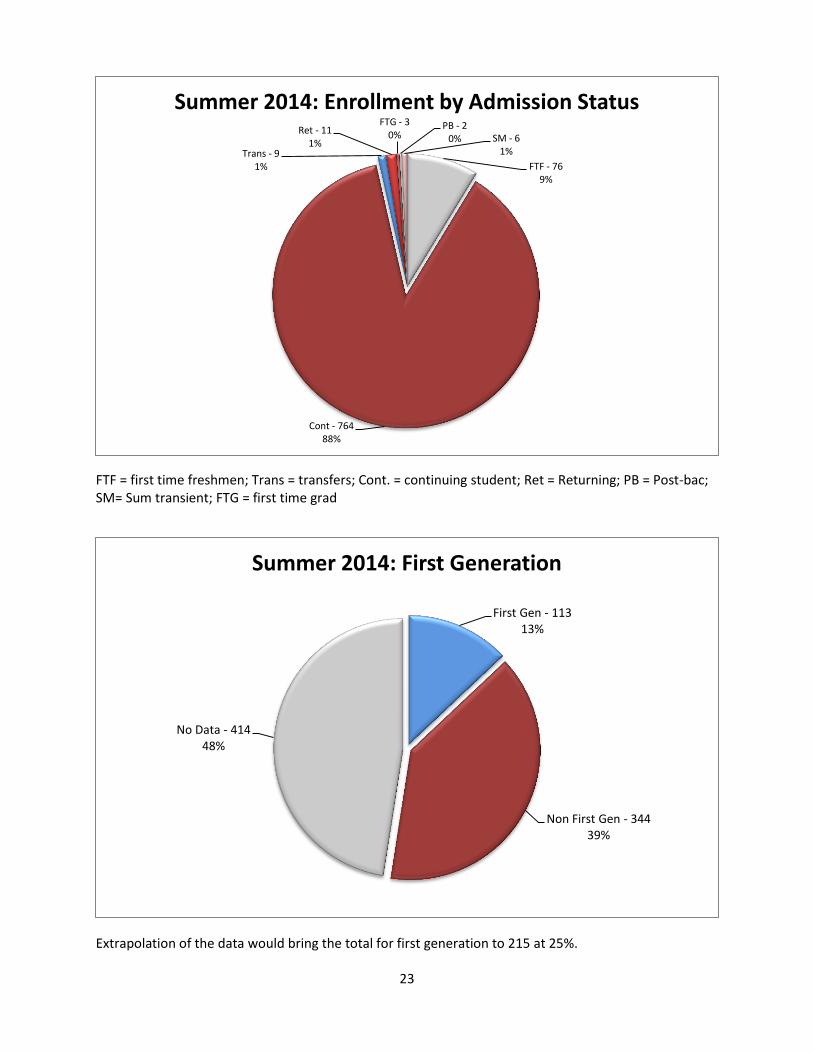
FTF = first time freshmen; FTM = first time masters; FTD = first time doctorates; Trans = transfers; Cont. = continuing student
FTF - 531 24%
FTM - 38 2%
FTD - 2 0%
Cont - 1371 63%
Trans - 232 11%
Fall 2013: Enrollment by Admission Status
First Gen - 596 27%
Non First Gen - 1433 66%
No Data - 145 7%
Fall 2013: First Generation

10
Extrapolation of the data would bring the total for first generation to 609 at 29.35%.
Fall 2013: Enrollment by Major
General Academics 116
Marine Biology 631
Marine Engineering Technology 175
Marine Fisheries 30
Marine Science 55
Maritime Administration 403
Maritime Studies 55
Maritime Systems Engineering 249
Marine Transportation 325
Ocean & Coastal Resources 115
Other 15
University Studies 5
Total 2174
Corps enrollment is duplicated due to student participation in more than one academy activity;
unduplicated numbers for the Corps is 502; total enrollment is 2174
LO - 423 19%
ROTC - 55 2%
D & C - 25 1%
SSO - 414 2%
Gen Pop - 1675 76%
Fall 2013: Texas A&M Maritime Academy

11
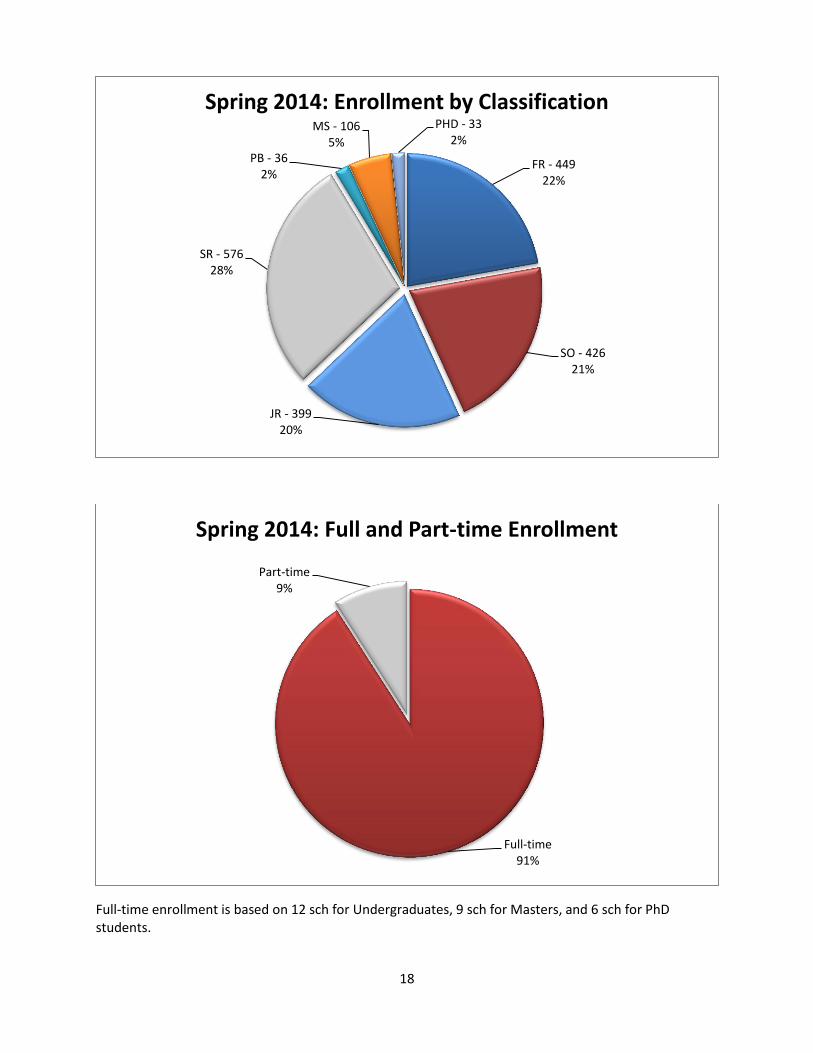
Full-time enrollment is based on 12 sch for Undergraduates, 9 sch for Masters, and 6 sch for PhD students.
FR - 653 30%
SO - 434 20%
JR - 404 18%
SR - 536 25%
PB - 18 1%
MS - 102 5%
PHD - 30 1%
Fall 2013: Enrollment by Classification
Full-time 1979
Part-time 198
Fall 2013: Full and Part-time Enrollment

12
Financial aid is inclusive of all classifications
Aggregate grade distribution includes only undergraduates
Receiving Financial Aid 60%
Not Receiving Financial Aid
40%
Fall 2013: Financial Aid
3084 3217
2039
689
429
5
404 374
168
0
500
1000
1500
2000
2500
3000
3500
A B C D F/U I Q S W
Fall 2013: Grade Distribution

13
Success Rate = total of grades A, B, C, D and S (Undergraduates only) Failure Rate = total of grades F/U Grades of I are not included in the calculation as these do not reflect either a completion or
failure, rather work that may or may not be completed Grades of Q (permitted drop by student – only three are allowed) and W are included in order to
provide a global perspective
Completion Rate = total of grades A, B, C, D, F/U and S (Undergraduates only) Completion Rate is defined as conclusion of a class based on assigned grade Incompletion Rate = total of grades Q and W Grades of I are not included in the calculation as these do not reflect either a completion or
failure, rather work that may or may not be completed
Success Rate 90%
Failure Rate 4%
Q/W 6%
Fall 2013: Success Rate
Completion 95%
Incomplete 5%
Fall 2013: Completion Rate

14
STUDENT PROFILE, SPRING 2014
Undergraduate only, Post-baccalaureate, Masters and PhD excluded
970
690
140
42 14 11 5 7 5 2
0
200
400
600
800
1000
1200
17-20 21-25 26-30 31-35 36-40 41-45 46-50 51-55 56-60 61+
Nu
mb
er
pe
r G
rou
p
Age
Spring 2014: Enrollment by Age
Males - 1278 63%
Females - 747 37%
Spring 2014: Enrollment by Gender
15
Ethnicity is based on Coordinating Board classifications
Non-resident includes 42 states plus Puerto Rico. International represents 20 countries.
White, 1560, 77%
Black, 53, 3%
Hisp, 292, 14%
Asian, 33, 2%
Nat Am, 9, 1% Int, 21, 1%
Mixed, 46, 2% HA/PI, 3, 0%
Unk, 8, 0%
Spring 2014: Enrollment by Ethnicity
Res - 1589 85%
Non-Res - 253 14%
Int - 25 1%
Spring 2014: Enrollment by Residency
16
FTF = first time freshmen; FTM = first time masters; Trans = transfers; Cont. = continuing student
Extrapolation of the data would bring the total for first generation to 492 at 24.29%.
FTF - 7 0% FTM - 8
1%
Cont - 1775 95%
Trans - 74 4%
Spring 2014: Enrollment by Admission Status
First Gen - 276 14%
Non First Gen - 860 42%
No Data - 889 44%
Spring 2014: First Generation
17
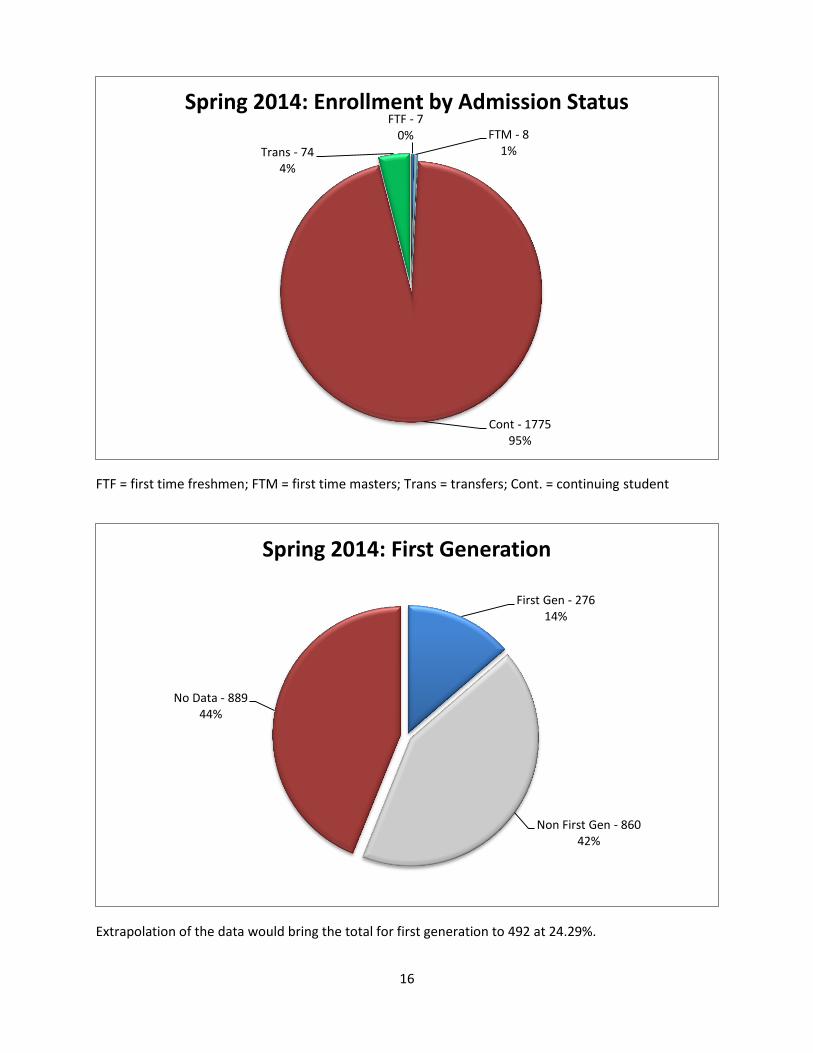
Spring 2014: Enrollment by Major
General Academics 112
Marine Biology 574
Marine Engineering Technology 212
Marine Fisheries 26
Marine Science 46
Maritime Administration 388
Maritime Studies 58
Maritime Systems Engineering 174
Marine Transportation 296
Ocean & Coastal Resources 113
Other 20
University Studies 6
Total 2025
Corps enrollment is duplicated due to student participation in more than one academy activity;
unduplicated numbers for the Corps is 471; total enrollment is 2025
LO - 399 19%
ROTC - 49 3%
D & C - 25 1%
SSO - 38 2%
Gen Pop - 1554 75%
Spring 2014: Texas A&M Maritime Academy
18
Full-time enrollment is based on 12 sch for Undergraduates, 9 sch for Masters, and 6 sch for PhD students.
FR - 449 22%
SO - 426 21%
JR - 399 20%
SR - 576 28%
PB - 36 2%
MS - 106 5%
PHD - 33 2%
Spring 2014: Enrollment by Classification
Full-time 91%
Part-time 9%
Spring 2014: Full and Part-time Enrollment

19
Financial aid is inclusive of all classifications
Aggregate grade distribution includes only undergraduates
Receiving Financial Aid 59%
Not Receiving Financial Aid
41%
Spring 2014: Financial Aid
2943 3057
1869
570
363
43
367 257
77
0
500
1000
1500
2000
2500
3000
3500
A B C D F/U I Q S W
Spring 2014: Grade Distribution

20
Success Rate = total of grades A, B, C, D and S (Undergraduates only) Failure Rate = total of grades F/U Grades of I are not included in the calculation as these do not reflect either a completion or
failure, rather work that may or may not be completed Grades of Q (permitted drop by student – only three are allowed) and W are included in order to
provide a global perspective
Completion Rate = total of grades A, B, C, D, F/U and S (Undergraduates only) Completion Rate is defined as conclusion of a class based on assigned grade Incompletion Rate = total of grades Q and W Grades of I are not included in the calculation as these do not reflect either a completion or
failure, rather work that may or may not be completed
Success Rate 91%
Failure Rate 4%
Q/W 5%
Spring 2014: Success Rate
Completion 95%
Incomplete 5%
Spirng 2014: Completion Rate

21
STUDENT PROFILE, SUMMER 2013
Undergraduate only, Post-baccalaureate, Masters and PhD excluded
318
352
77
20 10 4 1 3 2
0
50
100
150
200
250
300
350
400
17-20 21-25 26-30 31-35 36-40 41-45 46-50 51-55 56-60
Summer 2014: Enrollment by Age
Female - 276 32%
Male - 595 68%
Summer 2014: Enrollment by Gender

22
Ethnicity is based on Coordinating Board classifications: total enrollment is 871
Non-resident includes 39 states plus Puerto Rico. International represents 15 countries.
White 79%
Black 2%
Hisp 13%
Asian 2%
Nat Am 0%
Int 1%
Mixed 2%
HA/PI 0% Unk
1%
Summer 2014: Enrollment by Ethnicity
Res - 659 76%
Non-Res - 197 22%
Int - 15 2%
Summer 2014: Enrollment by Residency
23
FTF = first time freshmen; Trans = transfers; Cont. = continuing student; Ret = Returning; PB = Post-bac; SM= Sum transient; FTG = first time grad
Extrapolation of the data would bring the total for first generation to 215 at 25%.
FTF - 76 9%
Cont - 764 88%
Trans - 9 1%
Ret - 11 1%
FTG - 3 0%
PB - 2 0% SM - 6
1%
Summer 2014: Enrollment by Admission Status
First Gen - 113 13%
Non First Gen - 344 39%
No Data - 414 48%
Summer 2014: First Generation
24
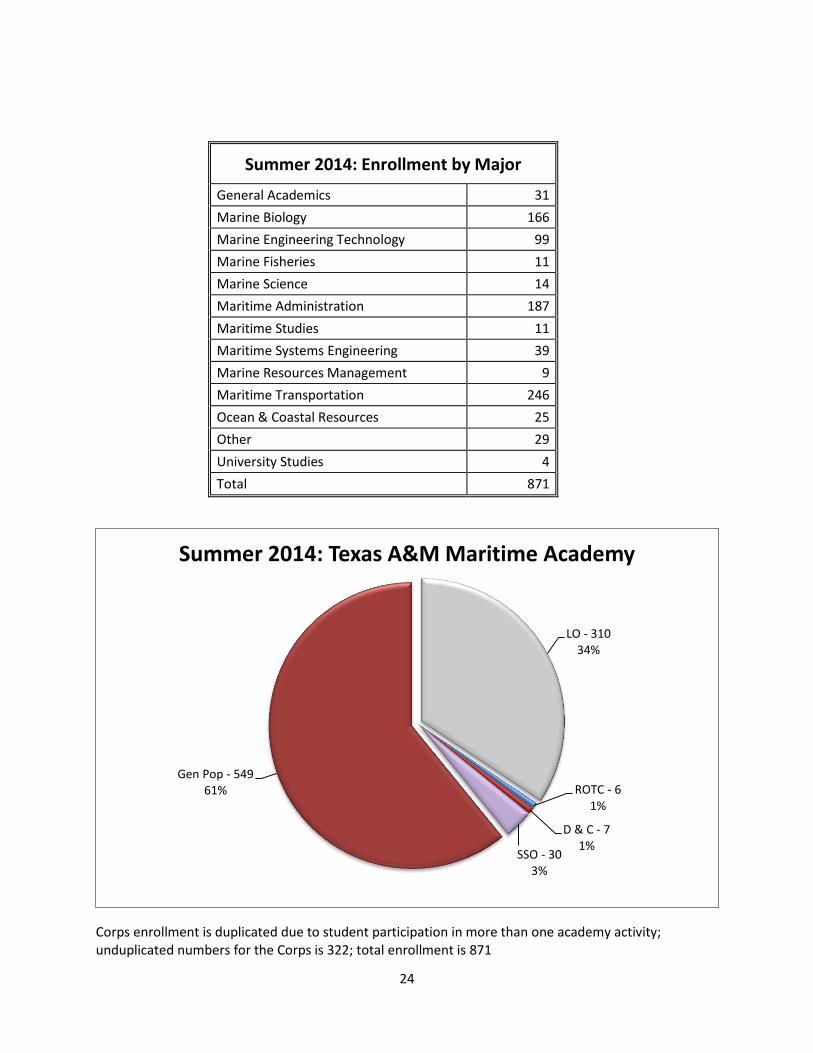
Summer 2014: Enrollment by Major
General Academics 31
Marine Biology 166
Marine Engineering Technology 99
Marine Fisheries 11
Marine Science 14
Maritime Administration 187
Maritime Studies 11
Maritime Systems Engineering 39
Marine Resources Management 9
Maritime Transportation 246
Ocean & Coastal Resources 25
Other 29
University Studies 4
Total 871
Corps enrollment is duplicated due to student participation in more than one academy activity; unduplicated numbers for the Corps is 322; total enrollment is 871
LO - 310 34%
ROTC - 6 1%
D & C - 7 1%
SSO - 30 3%
Gen Pop - 549 61%
Summer 2014: Texas A&M Maritime Academy

25
Full-time enrollment is based on 8 sch for Undergraduates and 6 sch for Graduates
FR - 112 13%
SO - 112 13%
JR - 198 23%
SR - 365 42%
PB - 2 0%
MS - 63 7%
PHD - 19 2%
Summer 2014: Enrollment by Classification
Full-time 21%
Part-time 79%
Summer 2014: Full and Part-time Enrollment

26
Financial aid is inclusive of all classifications
Aggregate grade distribution includes only undergraduates
Receiving Financial Aid 57%
Not Receiving Financial Aid
43%
Summer 2014: Financial Aid
594
465
211
43 26
67
12 34
2 0
100
200
300
400
500
600
700
A B C D F/U I Q S W
Summer 2014: Grade Distribution

27
Success Rate = total of grades A, B, C, D and S (Undergraduates only) Failure Rate = total of grades F Grades of I are not included in the calculation as these do not reflect either a completion or
failure, rather work that may or may not be completed Grades of Q (permitted drop by student) and W are included in order to provide a global
perspective
Completion Rate = total of grades A, B, C, D, F/U and S (Undergraduates only) Completion Rate is defined as conclusion of a class based on assigned grade Incompletion Rate = total of grades Q and W Grades of I are not included in the calculation as these do not reflect either a completion or
failure, rather work that may or may not be completed
Success Rate 97%
Failure Rate 2%
Q/W 1%
Summer 2014: Success Rate
Completion 99%
Incomplete 1%
Summer 2014: Completion Rate

28
Texas A&M Galveston has three commencement ceremonies during the academic school year, in December, May, and August. The following table provides information on the degrees awarded by A&M University at Galveston for the 2012-2013 academic year. The data is based on the CB009 report.
Degrees Conferred: 2013-2014 Academic Year
Degree Degree level Total
Bachelors Masters
Ocean and Coastal Resources 17 0 17
Marine Resources Management 0 17 17
Marine Fisheries 9 0 9
Marine Engineering Technology 22 0 22
Maritime Systems Engineering 26 0 26
Marine Biology 84 0 84
Marine Biology 0 3 3
Maritime Studies 11 0 11
Marine Science 17 0 17
University Studies 2 0 2
Marine Transportation 58 0 58
Maritime Administration 76 0 76
Maritime Administration and Logistics 0 11 11
Totals 322 31 353