Embed Size (px)
Citation preview

2 0 1 7
Fact Book City College
Prepared by: SDCCD Office of Institutional Research and Planning
August 2017

Overview & Mission ..................................................................... 1
Section I. Headcount and Student Characteristics .................. 4 Section Overview ............................................................... 5 Overall ................................................................................. 6 By Gender ........................................................................... 7 By Ethnicity ........................................................................ 8 By Age ................................................................................. 9 By Enrollment Status ......................................................... 10 By Educational Objective .................................................. 11 By Primary Language ....................................................... 13 By Prior Education Level .................................................. 14 By Service Area of Residence ........................................... 15 By First Generation ............................................................ 16 By Residency Status .......................................................... 17 By DSPS ............................................................................... 18 By EOPS .............................................................................. 19 By Day, Evening, & Online Status................................... 20 By Military Status .............................................................. 21 By Units Attempted by Units Earned ............................. 22
Section II. Persistence Rates ........................................................ 24 Section Overview ............................................................... 25 Overall ................................................................................. 26 By Gender ........................................................................... 27 By Ethnicity ........................................................................ 28 By Age ................................................................................. 30
Section III. Student Completion ................................................. 32 Section Overview ............................................................... 33 Annual Success Rates
Overall .................................................................... 34 By Gender .............................................................. 35 By Ethnicity ........................................................... 36 By Age .................................................................... 37
Annual Retention Rates Overall ...................................................................... 38 By Gender................................................................. 39 By Ethnicity .............................................................. 40 By Age ...................................................................... 41
Annual GPA Overall ...................................................................... 42 By Gender................................................................. 43 By Ethnicity ............................................................. 44 By Age ...................................................................... 45
Annual Awards Conferred Overall ...................................................................... 46 By Gender................................................................. 47 By Ethnicity .............................................................. 49 By Age ...................................................................... 52
Annual Transfer Volume Overall ...................................................................... 55 By Gender................................................................. 56 By Ethnicity .............................................................. 57 By Age ...................................................................... 58 By CSU/UC/Private (In‐state)/Out‐of‐State ......... 59 By CSU/UC .............................................................. 60 By Institution Type (Private vs. Public) ............... 61
Section IV. Productivity and Efficiency....................................... 62 Section Overview ................................................................. 63 FTES (Resident, Nonresident, and Overall) ..................... 64 Enrollments (Online and On Campus) ............................ 67 Fill Rates (Online and On Campus) .................................. 68 Load ....................................................................................... 70
Section V. Human Resources ......................................................... 71 Section Overview ................................................................. 72 Fall 2016 Employee Breakdown ......................................... 73
SDCCD Office of Institutional Research and Planning
City College/ECC Fact Book 2017_______________________________

OVERVIEW This Fact Book is a publication of the SDCCD Office of Institutional Research and Planning for the San Diego City College. It is designed to serve the information needs of the college community with a primary focus on student enrollment, demographics, and outcomes.
The Fact Book is a rich source of collegewide trend information that may be used for planning and decision making. The book contains the following five sections:
1) Headcount and Student Characteristics. Provides information on student demographic characteristics (e.g., age, ethnicity, andeducational objective) over five years.
2) Persistence Rates. Provides information about first‐time to college students who complete a fall term and enroll in the subsequentspring and fall terms. The information is also reported by demographic characteristics of interest.
3) Student Completion. Provides information on students’ successful course completion rates, retention rates, GPA, awardsconferred, and transfer volume. All of the information is provided in summary form, as well as by demographic characteristics ofinterest.
4) Productivity and Efficiency. Provides information on annual FTES, enrollment and fill rates, and Load (WSCH/FTEF).
5) Human Resources. Provides information on the number of employees by employment type, ethnicity, and gender.
Each section contains the following benchmarks: 1) The percentage change or percent difference over the five year period being reported, 2) The collegewide average, and 3) The “All Colleges” in the district average (excludes Continuing Education).
SDCCD Office of Institutional Research and Planning 1
City College/ECC Fact Book 2017_______________________________

Mission
San Diego City College has as its highest priority student learning and achievement. The college provides lower division and general education courses that lead to certificates, associate degrees or transfer to a four-year college or university; career technical education programs that meet specific industry needs, upgrade the employment skills of students and fulfill licensing requirements of the state of California as well as contribute to the economic development of our region; basic skills instruction to assist all students in meeting their educational goals; and essential student support services for all students.
Values San Diego City College is a multicultural institution committed to providing open access to all who can benefit from instruction and to meeting the diverse and ever-changing educational, cultural, and economic needs of the urban core and surrounding communities of San Diego. We are committed to the tradition of academic freedom and responsibility, to employee empowerment, and to maintaining a climate that promotes learning, understanding and respect for students, faculty, staff, community, and the environment. The following are core tenets of our value system:
• The development of informed, active individuals who will be engaged in the global community, lifelong learners, social justiceadvocates, and literate in information technology;
• Institutional community involvement, community development and community service;• Equity, inclusiveness and diversity in all of its manifestations;• High quality instructional programs emphasizing creative and critical thinking;• Essential student support services, including co-curricular and cultural activities;• Environmental sustainability and a campus culture of conservation; and• A continuous campus-wide cycle of assessment and program review with integrated planning and resource allocation.
SDCCD Office of Institutional Research and Planning 2
City College/ECC Fact Book 2017_______________________________
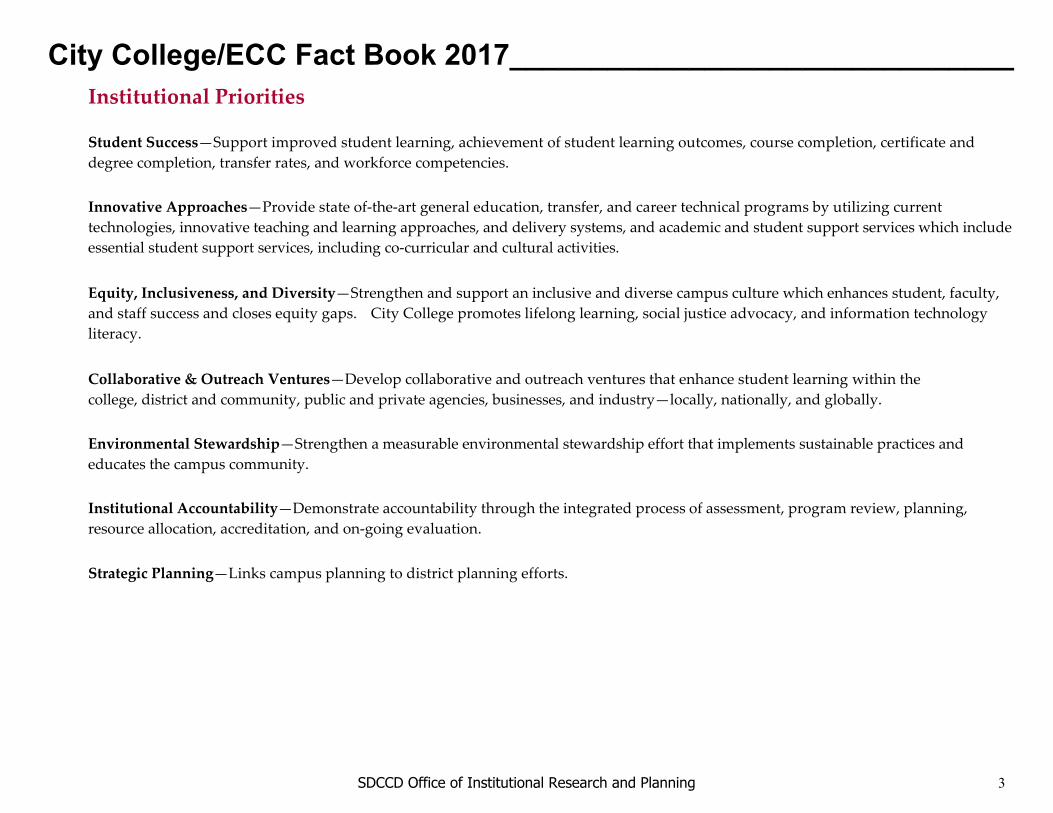
Institutional Priorities
Student Success—Support improved student learning, achievement of student learning outcomes, course completion, certificate and degree completion, transfer rates, and workforce competencies.
Innovative Approaches—Provide state of-the-art general education, transfer, and career technical programs by utilizing current technologies, innovative teaching and learning approaches, and delivery systems, and academic and student support services which include essential student support services, including co-curricular and cultural activities.
Equity, Inclusiveness, and Diversity—Strengthen and support an inclusive and diverse campus culture which enhances student, faculty, and staff success and closes equity gaps. City College promotes lifelong learning, social justice advocacy, and information technology literacy.
Collaborative & Outreach Ventures—Develop collaborative and outreach ventures that enhance student learning within the college, district and community, public and private agencies, businesses, and industry—locally, nationally, and globally.
Environmental Stewardship—Strengthen a measurable environmental stewardship effort that implements sustainable practices and educates the campus community.
Institutional Accountability—Demonstrate accountability through the integrated process of assessment, program review, planning, resource allocation, accreditation, and on-going evaluation.
Strategic Planning—Links campus planning to district planning efforts.
SDCCD Office of Institutional Research and Planning 3
City College/ECC Fact Book 2017_______________________________

Section I Headcount and Student Characteristics
SDCCD Office of Institutional Research and Planning 4
City College/ECC Fact Book 2017_______________________________

This section of the Fact Book contains student headcount by various student characteristics. The headcount figures are individual counts ofstudents, or unduplicated headcount, based on official census counts at the end of the semester. Drops, never attends, and cancelled classes areexcluded. The headcount information is reported over a period of five years to analyze trends and establish benchmarks. Headcountinformation is reported by the following segments:
1) Overall2) Gender3) Ethnicity4) Age5) Enrollment Status6) Educational Objective7) Primary Language8) Prior Education Level9) Service Area of Residence10) First Generation11) Residency Status12) DSPS13) EOPS14) Day, Evening, and Online Status15) Military Status16) Units Attempted by Units Earned
SDCCD Office of Institutional Research and Planning 5
City College/ECC Fact Book 2017_______________________________
16,92316,453 16,370
16,64916,908
Fall 2016Fall 2015Fall 2014Fall 2013Fall 2012
TotalSpring 13 Spring 14 Spring 15 Spring 16 Spring 17 % Change
Spring 13-17
Total 16,727 16,738 16,608 16,852 16,326 -2%
TotalSummer 12 Summer 13 Summer 14 Summer 15 Summer 16 % Change
Summer 12-16
Total 1,342 1,173 6,365 6,893 7,648 470%
TotalFall 12 Fall 13 Fall 14 Fall 15 Fall 16 % Change
Fall 12-16
Total 16,923 16,453 16,370 16,649 16,907 0%
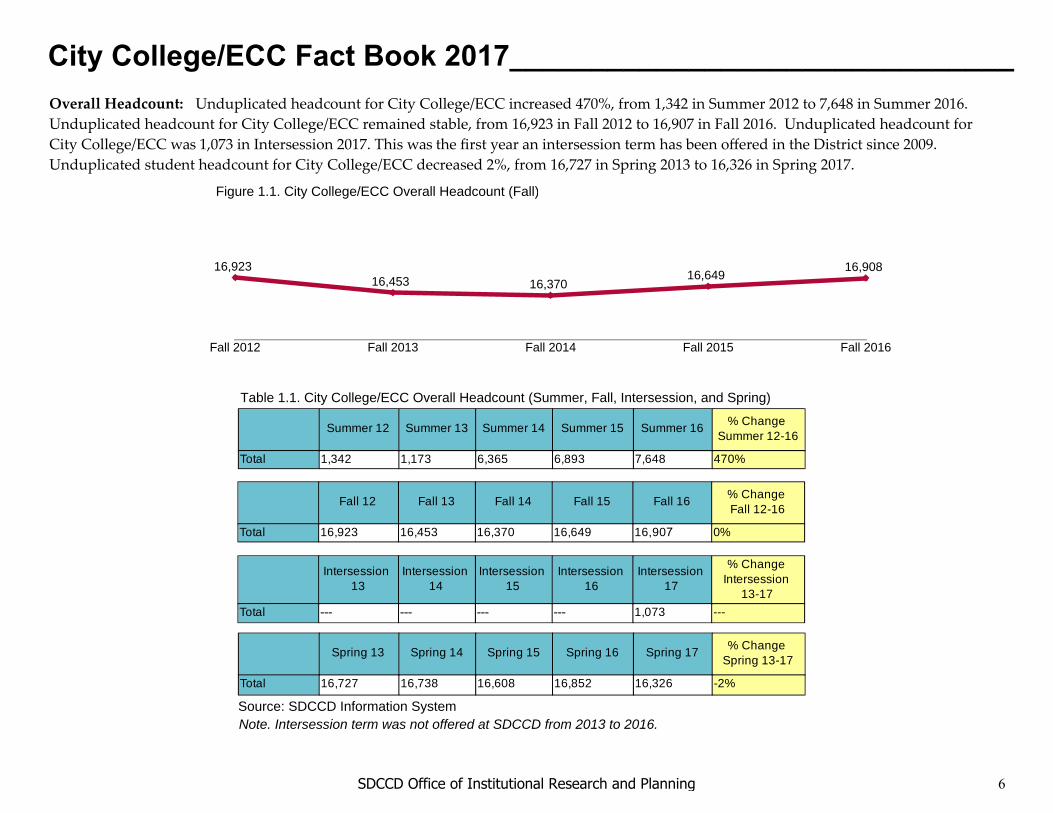
Table 1.1. City College/ECC Overall Headcount (Summer, Fall, Intersession, and Spring)
Source: SDCCD Information System
Overall Headcount: Unduplicated headcount for City College/ECC increased 470%, from 1,342 in Summer 2012 to 7,648 in Summer 2016. Unduplicated headcount for City College/ECC remained stable, from 16,923 in Fall 2012 to 16,907 in Fall 2016. Unduplicated headcount for City College/ECC was 1,073 in Intersession 2017. This was the first year an intersession term has been offered in the District since 2009. Unduplicated student headcount for City College/ECC decreased 2%, from 16,727 in Spring 2013 to 16,326 in Spring 2017.
Figure 1.1. City College/ECC Overall Headcount (Fall)
Total Intersession 13
Intersession 14
Intersession 15
Intersession 16
Intersession 17
% Change Intersession
13-17Total --- --- --- --- 1,073 ---
Note. Intersession term was not offered at SDCCD from 2013 to 2016.
City College/ECC Fact Book 2017_______________________________
SDCCD Office of Institutional Research and Planning 6

UnreportedMaleFemale
70%
60%
50%
40%
30%
20%
10%
0%
Fall 12 Fall 13 Fall 14 Fall 15 Fall 16
Table 1.2. City College/ECC Headcount by Gender
Source: SDCCD Information System
Figure 1.2. City College/ECC Headcount by Gender
Headcount by Gender: On average, the female student headcount (53%) was higher than their male counterpart (47%). This trend has remained fairly consistent between Fall 2012 and Fall 2016. The female and male student headcounts remained stable between Fall 2012 and Fall 2016.
All Colleges Average Fall 12-16
50%50%0%100%
Gender Fall 12 Fall12
Fall 13 Fall13
Fall 14 Fall 14 Fall 15 Fall 15 Fall 16 Fall16
% Change Fall 12-16
College Average Fall 12-16
FemaleMaleUnreportedTotal
53%8,993 53% 8,664 53% 8,558 52% 8,748 53% 8,985 53% 0%7,927 47% 7,788 47% 7,812 48% 7,901 47% 7,922 47% 0% 47%3 0% 1 0% 0 0% 0 0% 0 0% -100% 0%16,923 100% 16,453 100% 16,370 100% 16,649 100% 16,907 100% 0% 100%
SDCCD Office of Institutional Research and Planning 7
City College/ECC Fact Book 2017_______________________________

UnreportedOtherWhiteLatinoFilipinoAsian/Pacific Islander
American IndianAfrican American
60%
50%
40%
30%
20%
10%
0%
Fall 12 Fall 13 Fall 14 Fall 15 Fall 16
Source: SDCCD Information System
Table 1.3. City College/ECC Headcount by Ethnicity
Figure 1.3. City College/ECC Headcount by Ethnicity
Headcount by Ethnicity: The ethnic groups with the largest percentage of the student population between Fall 2012 and Fall 2016 were Latino students (48%), White students (23%), and African American students (11%). At City College/ECC, the Latino student population increased 14% between Fall 2012 and Fall 2016. There was a smaller percentage of White students at City College/ECC compared to the overall percentage for all colleges in the District (23% & 31%, respectively), and the same was true for Asian/Pacific Islanders students (6% & 11%, respectively). Conversely, there was a larger percentage of African American students at City College/ECC compared to the overall percentage for all colleges in the District (11% & 8%, respectively), as well as for Latino students at City College/ECC (48% & 36%, respectively).
All Colleges Average Fall 12-16
8%0%11%5%36%31%6%3%100%
Ethnicity Fall 12 Fall12
Fall 13 Fall13
Fall 14 Fall 14 Fall 15 Fall 15 Fall 16 Fall16
% Change Fall 12-16
College Average Fall 12-16
African AmericanAmerican IndianAsian/Pacific IslanderFilipinoLatinoWhiteOtherUnreportedTotal
2,012 12% 2,002 12% 1,917 12% 1,789 11% 1,710 10% -15% 11%78 0% 51 0% 60 0% 43 0% 52 0% -33% 0%1,107 7% 1,042 6% 1,020 6% 1,084 7% 1,043 6% -6% 6%550 3% 491 3% 502 3% 456 3% 528 3% -4% 3%7,592 45% 7,632 46% 7,923 48% 8,264 50% 8,628 51% 14% 48%4,225 25% 3,951 24% 3,766 23% 3,785 23% 3,762 22% -11% 23%800 5% 792 5% 763 5% 811 5% 797 5% 0% 5%559 3% 492 3% 419 3% 417 3% 387 2% -31% 3%16,923 100% 16,453 100% 16,370 100% 16,649 100% 16,907 100% 0% 100%
SDCCD Office of Institutional Research and Planning 8
City College/ECC Fact Book 2017_______________________________
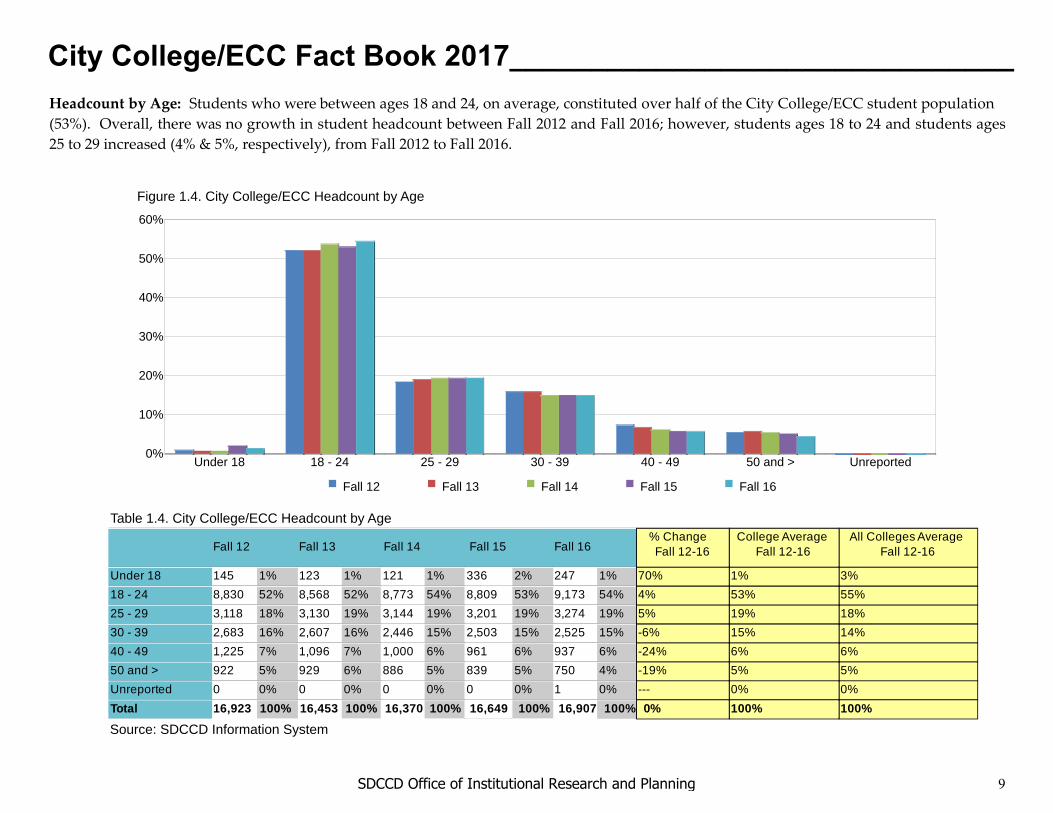
Figure 1.7. City College Headcount by Primary Language
Unreported50 and >40 - 4930 - 3925 - 2918 - 24Under 18
60%
50%
40%
30%
20%
10%
0%
Fall 12 Fall 13 Fall 14 Fall 15 Fall 16
Headcount by Age: Students who were between ages 18 and 24, on average, constituted over half of the City College/ECC student population (53%). Overall, there was no growth in student headcount between Fall 2012 and Fall 2016; however, students ages 18 to 24 and students ages 25 to 29 increased (4% & 5%, respectively), from Fall 2012 to Fall 2016.
Table 1.4. City College/ECC Headcount by Age
Source: SDCCD Information System
Figure 1.4. City College/ECC Headcount by Age
All Colleges Average Fall 12-16
3%55%18%14%6%5%0%100%
Age_Grp2 Fall 12Fall 12 Fall 13
Fall 13 Fall 14
Fall 14 Fall 15
Fall 15 Fall 16
Fall 16
% Change Fall 12-16
College Average Fall 12-16
Under 1818 - 2425 - 2930 - 3940 - 4950 and >UnreportedTotal
145 1% 123 1% 121 1% 336 2% 247 1% 70% 1%8,830 52% 8,568 52% 8,773 54% 8,809 53% 9,173 54% 4% 53%3,118 18% 3,130 19% 3,144 19% 3,201 19% 3,274 19% 5% 19%2,683 16% 2,607 16% 2,446 15% 2,503 15% 2,525 15% -6% 15%1,225 7% 1,096 7% 1,000 6% 961 6% 937 6% -24% 6%922 5% 929 6% 886 5% 839 5% 750 4% -19% 5%0 0% 0 0% 0 0% 0 0% 1 0% --- 0%16,923 100% 16,453 100% 16,370 100% 16,649 100% 16,907 100% 0% 100%
SDCCD Office of Institutional Research and Planning 9
City College/ECC Fact Book 2017_______________________________

UnreportedReturning Transfer Student
Returning StudentFirst-Time Transfer Student
First-Time StudentCurrent High School Student
Continuing Student
80%
70%
60%
50%
40%
30%
20%
10%
0%
Fall 12 Fall 13 Fall 14 Fall 15 Fall 16
On average, 70% of the City College/ECC student population were continuing students, which has increased (2%) between Fall 2012 and Fall 2016. Current high school students increased by 92% and First‐Time Transfer Students increased by 3% between Fall 2012 and Fall 2016.
Headcount by Enrollment Status:
Source: SDCCD Information System
Table 1.5. City College/ECC Headcount by Enrollment Status
Figure 1.5. City College/ECC Headcount by Enrollment Status
All Colleges Average Fall 12-16
64%4%11%10%6%3%0%100%
Enrl_Status Fall 12Fall 12 Fall 13
Fall 13 Fall 14
Fall 14 Fall 15 Fall 15 Fall 16
Fall 16
% Change Fall 12-16
College Average Fall 12-16
Continuing StudentCurrent High School StudentFirst-Time StudentFirst-Time Transfer StudentReturning StudentReturning Transfer StudentUnreportedTotal
11,670 69% 11,492 70% 11,669 71% 11,574 70% 11,849 70% 2% 70%202 1% 163 1% 188 1% 420 3% 387 2% 92% 2%1,991 12% 1,962 12% 2,016 12% 1,930 12% 1,901 11% -5% 12%1,432 8% 1,349 8% 1,254 8% 1,482 9% 1,468 9% 3% 8%1,132 7% 1,030 6% 859 5% 885 5% 905 5% -20% 6%464 3% 423 3% 351 2% 324 2% 339 2% -27% 2%32 0% 34 0% 33 0% 34 0% 58 0% 81% 0%16,923 100% 16,453 100% 16,370 100% 16,649 100% 16,907 100% 0% 100%
SDCCD Office of Institutional Research and Planning 10
City College/ECC Fact Book 2017_______________________________
Unr
epor
ted
Und
ecid
ed
Voc
Cer
t/Deg
ree
w/o
ut T
rans
fer
Non
-Cre
dit t
o C
redi
t Tra
nsiti
on
New
Car
eer P
repa
ratio
n
HS
Dip
lom
a/G
ED
Cer
tific
ate
Edu
catio
nal D
evel
opm
ent
Cur
rent
Job
/Car
eer A
dvan
cem
ent
Cer
tific
ate/
Lice
nse
Mai
nten
ance
Basi
c Sk
ills Im
prov
emen
t
BA/B
S w
/out
Com
plet
ing
AA/A
S
BA
/BS
afte
r Com
plet
ing
AA
/AS
AA
/AS
w/o
ut T
rans
fer
4 Y
r Col
lege
Stu
dent
50%
40%
30%
20%
10%
0%
Fall 12 Fall 13 Fall 14 Fall 15 Fall 16
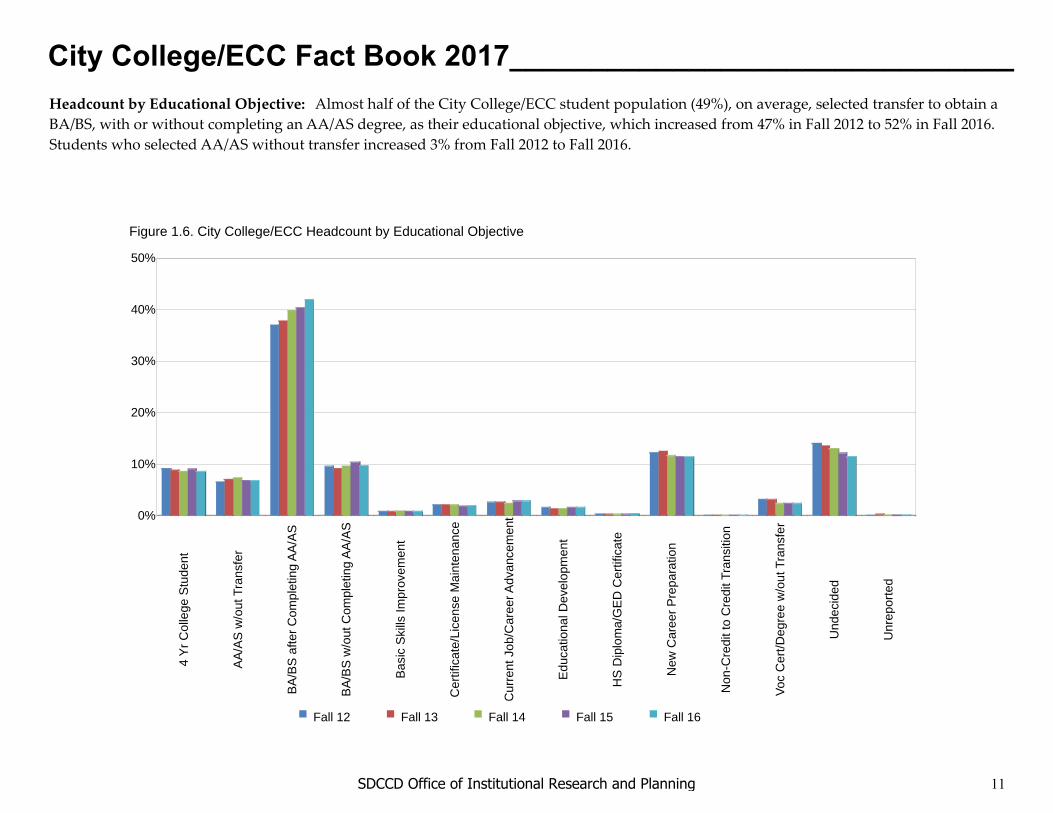
Almost half of the City College/ECC student population (49%), on average, selected transfer to obtain a BA/BS, with or without completing an AA/AS degree, as their educational objective, which increased from 47% in Fall 2012 to 52% in Fall 2016. Students who selected AA/AS without transfer increased 3% from Fall 2012 to Fall 2016.
Headcount by Educational Objective:
Figure 1.6. City College/ECC Headcount by Educational Objective
SDCCD Office of Institutional Research and Planning 11
City College/ECC Fact Book 2017_______________________________

Table 1.6. City College/ECC Headcount by Educational Objective
Source: SDCCD Information System
All Colleges Average Fall 12-16
10%6%38%11%1%2%4%2%1%11%0%2%13%0%100%
Educ Obj Fall 12Fall 12 Fall 13
Fall 13 Fall 14
Fall 14 Fall 15
Fall 15Fall 16 Fall 16
% Change Fall 12-16
College Average Fall 12-16
4 Yr College StudentAA/AS w/out TransferBA/BS after Completing AA/ASBA/BS w/out Completing AA/ASBasic Skills ImprovementCertificate/License MaintenanceCurrent Job/Career AdvancementEducational DevelopmentHS Diploma/GED CertificateNew Career PreparationNon-Credit to Credit TransitionVoc Cert/Degree w/out TransferUndecidedUnreportedTotal
1,561 9% 1,454 9% 1,413 9% 1,495 9% 1,443 9% -8% 9%1,117 7% 1,171 7% 1,215 7% 1,151 7% 1,148 7% 3% 7%6,271 37% 6,225 38% 6,534 40% 6,725 40% 7,096 42% 13% 39%1,612 10% 1,524 9% 1,587 10% 1,724 10% 1,652 10% 2% 10%147 1% 141 1% 160 1% 149 1% 138 1% -6% 1%360 2% 348 2% 335 2% 306 2% 338 2% -6% 2%435 3% 435 3% 404 2% 462 3% 467 3% 7% 3%268 2% 220 1% 232 1% 256 2% 261 2% -3% 1%68 0% 41 0% 45 0% 41 0% 75 0% 10% 0%2,079 12% 2,075 13% 1,891 12% 1,910 11% 1,936 11% -7% 12%34 0% 24 0% 28 0% 25 0% 21 0% -38% 0%548 3% 514 3% 372 2% 393 2% 390 2% -29% 3%2,389 14% 2,241 14% 2,152 13% 2,012 12% 1,942 11% -19% 13%34 0% 40 0% 2 0% 0 0% 0 0% -100% 0%16,923 100% 16,453 100% 16,370 100% 16,649 100% 16,907 100% 0% 100%
SDCCD Office of Institutional Research and Planning 12
City College/ECC Fact Book 2017_______________________________

Fall 2016Fall 2015Fall 2014Fall 2013Fall 2012
100%
90%
80%
70%
60%
50%
40%
30%
20%
10%
0%
English Other than English Unreported
On average, 91% of the City College/ECC student population reported English as their primary language, which was similar to the average for all colleges in the District (92%). Between Fall 2012 and Fall 2016, those who reported English as their primary language remained stable and there was a decrease for those who reported speaking a language other than English (6%).
Headcount by Primary Language:
Table 1.7. City College/ECC Headcount by Primary Language
Source: SDCCD Information System
Figure 1.7. City College/ECC Headcount by Primary Language
All Colleges Average Fall 12-16
92%8%0%100%
Primary Lang Fall 12Fall 12 Fall 13
Fall 13 Fall 14
Fall 14 Fall 15 Fall 15 Fall 16 Fall 16
% Change Fall 12-16
College Average Fall 12-16
EnglishOther than EnglishUnreportedTotal
15,499 92% 15,020 91% 14,880 91% 15,231 91% 15,569 92% 0% 91%1,422 8% 1,430 9% 1,488 9% 1,416 9% 1,337 8% -6% 9%2 0% 3 0% 2 0% 2 0% 1 0% -50% 0%
16,923 100% 16,453 100% 16,370 100% 16,649 100% 16,907 100% 0% 100%
SDCCD Office of Institutional Research and Planning 13
City College/ECC Fact Book 2017_______________________________

Special Admit/K-12
Not a Grad/Not Enrolled in
HS
HS DiplomaGED/HS Certificate
Foreign HS Diploma
Certification of Calif. HS
Proficiency
Bachelors Degree or
Higher
Associate Degree
Adult School
80%
70%
60%
50%
40%
30%
20%
10%
0%
Fall 12 Fall 13 Fall 14 Fall 15 Fall 16
All Colleges Average Fall 12-16
0%4%9%1%7%5%70%1%4%100%
Enrolled Type Fall 12 Fall12
Fall 13 Fall13
Fall 14 Fall14
Fall 15 Fall 15 Fall 16 Fall16
% Change Fall 12-16
College Average Fall 12-16
Adult SchoolAssociate DegreeBachelors Degree or HigherCertification of Calif. HS ProficiencyForeign HS DiplomaGED/HS CertificateHS DiplomaNot a Grad/Not Enrolled in HSSpecial Admit/K-12Total
42 0% 34 0% 28 0% 22 0% 22 0% -48% 0%656 4% 685 4% 670 4% 611 4% 644 4% -2% 4%1,225 7% 1,108 7% 1,010 6% 1,030 6% 1,017 6% -17% 6%126 1% 116 1% 114 1% 112 1% 89 1% -29% 1%969 6% 1,008 6% 1,014 6% 1,082 6% 1,056 6% 9% 6%1,203 7% 1,158 7% 1,101 7% 1,040 6% 1,055 6% -12% 7%12,249 72% 11,981 73% 12,098 74% 12,217 73% 12,541 74% 2% 73%299 2% 254 2% 219 1% 183 1% 151 1% -49% 1%154 1% 109 1% 116 1% 352 2% 332 2% 116% 1%16,923 100% 16,453 100% 16,370 100% 16,649 100% 16,907 100% 0% 100%
Between Fall 2012 and Fall 2016, 73% of the City College/ECC student population had a high school diploma and 6% had a bachelor’s degree or higher. City College/ECC students who had a foreign HS Diploma and Special Admit/K‐12 increased 6% and 116% from Fall 2012 to Fall 2016, while most other groups decreased. The significant increase of Special Admit/K‐12 students can be partially attributed to the growth in high school partnerships.
Headcount by Prior Education Level:
Table 1.8. City College/ECC Headcount by Prior Education Level
Source: SDCCD Information System
Figure 1.8. City College/ECC Headcount by Prior Education Level
SDCCD Office of Institutional Research and Planning 14
City College/ECC Fact Book 2017_______________________________

Outside Service AreaMiramar CollegeMesa CollegeCity College
50%
40%
30%
20%
10%
0%
Fall 12 Fall 13 Fall 14 Fall 15 Fall 16
Source: SDCCD Information System
Table 1.9. City College/ECC Headcount by Service Area of Residence
Between Fall 2012 and Fall 2016, on average, 47% of students who attended City College/ECC resided within the City College service area. Approximately one third (30%) of students attending any of the credit colleges resided in the City College service area. Forty percent of the students who attended City College/ECC resided outside of the SDCCD service area.
Figure 1.9. City College/ECC Headcount by Service Area of Residence
Headcount by Service Area of Residence:
All Colleges Average Fall 12-16
30%20%11%39%100%
Service Area Fall 12Fall 12 Fall 13
Fall 13 Fall 14
Fall 14 Fall 15
Fall 15Fall 16
Fall 16
% Change Fall 12-16
College Average Fall 12-16
City CollegeMesa CollegeMiramar CollegeOutside Service AreaTotal
7,952 47% 7,738 47% 7,667 47% 7,691 46% 7,777 46% -2% 47%1,721 10% 1,700 10% 1,627 10% 1,657 10% 1,633 10% -5% 10%583 3% 515 3% 468 3% 529 3% 555 3% -5% 3%6,667 39% 6,500 40% 6,608 40% 6,772 41% 6,942 41% 4% 40%
16,923 100% 16,453 100% 16,370 100% 16,649 100% 16,907 100% 0% 100%
SDCCD Office of Institutional Research and Planning 15
City College/ECC Fact Book 2017_______________________________

Fall 2016Fall 2015Fall 2014Fall 2013Fall 2012
80%
70%
60%
50%
40%
30%
20%
10%
0%
First Generation Not First Generation Unreported
Table 1.10. City College/ECC Headcount by First Generation
Source: SDCCD Information System
From Fall 2012 to Fall 2016, over one third (36%) of the City College/ECC student population reported being first generation college students. Between Fall 2012 and Fall 2016, there was a 1% increase in the number of first generation college students and a 1% decrease for those who were not first generation students.
Headcount by First Generation:
Figure 1.10. City College/ECC Headcount by First Generation
All Colleges Average Fall 12-16
29%71%0%100%
First_Gen Fall 12Fall 12 Fall 13
Fall 13 Fall 14
Fall 14 Fall 15 Fall 15 Fall 16 Fall 16
% Change Fall 12-16
College Average Fall 12-16
First GenerationNot First GenerationUnreportedTotal
5,985 35% 5,937 36% 5,904 36% 5,928 36% 6,058 36% 1% 36%10,911 64% 10,490 64% 10,450 64% 10,709 64% 10,847 64% -1% 64%27 0% 26 0% 16 0% 12 0% 2 0% -93% 0%
16,923 100% 16,453 100% 16,370 100% 16,649 100% 16,907 100% 0% 100%
SDCCD Office of Institutional Research and Planning 16
City College/ECC Fact Book 2017_______________________________
Non-ResidentResident
100%
90%
80%
70%
60%
50%
40%
30%
20%
10%
0%
Fall 12 Fall 13 Fall 14 Fall 15 Fall 16
All Colleges Average Fall 12-16
95%5%100%
Resident Fall 12Fall 12 Fall 13
Fall 13 Fall 14
Fall 14 Fall 15 Fall 15 Fall 16 Fall 16
% Change Fall 12-16
College Average Fall 12-16
ResidentNon-ResidentTotal
16,366 97% 15,889 97% 15,742 96% 15,886 95% 16,151 96% -1% 96%557 3% 564 3% 628 4% 763 5% 756 4% 36% 4%
16,923 100% 16,453 100% 16,370 100% 16,649 100% 16,907 100% 0% 100%
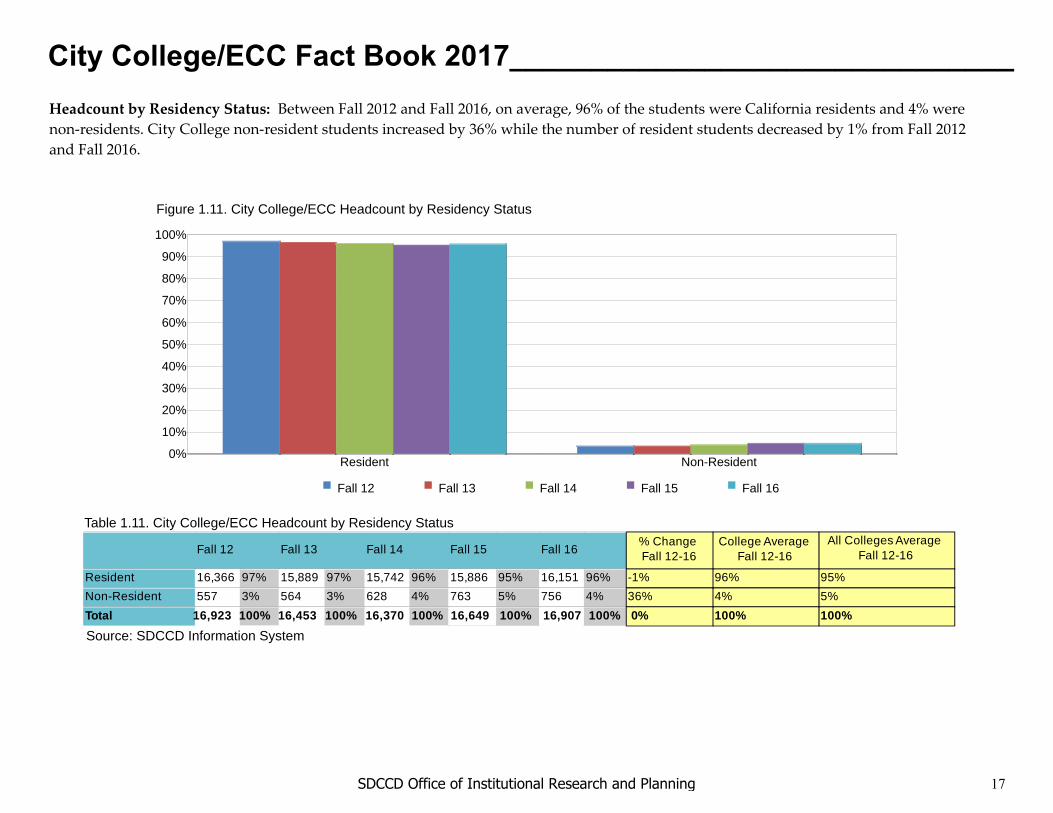
Between Fall 2012 and Fall 2016, on average, 96% of the students were California residents and 4% were non‐residents. City College non‐resident students increased by 36% while the number of resident students decreased by 1% from Fall 2012 and Fall 2016.
Headcount by Residency Status:
Table 1.11. City College/ECC Headcount by Residency Status
Source: SDCCD Information System
Figure 1.11. City College/ECC Headcount by Residency Status
SDCCD Office of Institutional Research and Planning 17
City College/ECC Fact Book 2017_______________________________

On average, 4% of the City College/ECC student population received disability support services between Fall 2012 and Fall 2016, which was comparable to the student population for all colleges in the District (4%). Moreover, the number of students who received disability services increased 16% between Fall 2012 to Fall 2016, while those who had not received disability services decreased 1%.
Headcount by Disability Support Programs and Services (DSPS):
Fall 2016Fall 2015Fall 2014Fall 2013Fall 2012
100%
90%
80%
70%
60%
50%
40%
30%
20%
10%
0%
Received Services Did Not Receive Services
Figure 1.12. City College/ECC Headcount by Disability Support Programs and Services (DSPS)
All Colleges Average Fall 12-16
4%96%100%
DSPSFall 12 F12 Fall 13 F13 Fall 14 F14 Fall 15 F15 Fall 16 F16
% Change Fall 12-16
College Average Fall 12-16
Received ServicesDid Not Receive ServicesTotal
598 4% 670 4% 635 4% 661 4% 696 4% 16% 4%16,325 96% 15,783 96% 15,735 96% 15,988 96% 16,211 96% -1% 96%16,923 100% 16,453 100% 16,370 100% 16,649 100% 16,907 100% -0% 100%
Table 1.12. City College/ECC Headcount by Disability Support Programs and Services (DSPS)
Source: SDCCD Information System
SDCCD Office of Institutional Research and Planning 18
City College/ECC Fact Book 2017_______________________________

On average, 5% of the City College/ECC student population received EOPS services between Fall 2012 and Fall 2016, which was comparable to the overall student population for all colleges in the District (4%). While students at City College/ECC who had received EOPS services decreased by 15%, those who had not received EOPS services increased by 1% between Fall 2012 and Fall 2016.
Headcount by Extended Opportunity Programs and Services (EOPS):
Fall 2016Fall 2015Fall 2014Fall 2013Fall 2012
100%
90%
80%
70%
60%
50%
40%
30%
20%
10%
0%
Received Services Did Not Receive Services
All Colleges Average Fall 12-16
4%96%
100%
EOPSFall 12 F12 Fall 13 F13 Fall 14 F14 Fall 15 F15 Fall 16 F16
% Change Fall 12-16
College Average Fall 12-16
Received ServicesDid Not Receive ServicesTotal
881 5% 1,018 6% 775 5% 702 4% 748 4% -15% 5%16,042 95% 15,435 94% 15,595 95% 15,947 96% 16,159 96% 1% 95%
16,923 100% 16,453 100% 16,370 100% 16,649 100% 16,907 100% 0% 100%Source: SDCCD Information System
Figure 1.13. City College/ECC Headcount by Extended Opportunity Programs and Services (EOPS)
Table 1.13. City College/ECC Headcount by Extended Opportunity Programs and Services (EOPS)
SDCCD Office of Institutional Research and Planning 19
City College/ECC Fact Book 2017_______________________________

Online OnlyOn-Campus/OnlineDay/EveningEvening OnlyDay Only
50%
40%
30%
20%
10%
0%
Fall 12 Fall 13 Fall 14 Fall 15 Fall 16
All Colleges Average Fall 12-16
42%11%21%17%9%100%
Student_DayEve_Online
Fall 12 Fall 12
Fall 13 Fall 13
Fall 14 Fall14
Fall 15Fall 15
Fall 16 Fall16
% Change Fall 12-16
College Average Fall 12-16
Day OnlyEvening OnlyDay/EveningOn-Campus/OnlineOnline OnlyTotal
5,849 35% 5,796 35% 6,204 38% 6,430 39% 6,590 39% 13% 37%3,521 21% 3,479 21% 3,001 18% 2,791 17% 2,719 16% -23% 19%3,111 18% 3,074 19% 3,095 19% 2,970 18% 2,772 16% -11% 18%1,939 11% 1,864 11% 1,981 12% 2,243 13% 2,241 13% 16% 12%2,503 15% 2,240 14% 2,089 13% 2,215 13% 2,585 15% 3% 14%16,923 100% 16,453 100% 16,370 100% 16,649 100% 16,907 100% 0% 100%
On average, 37% of the City College/ECC student population took day courses exclusively. One in five students (19%) took evening courses exclusively. Students who took online courses exclusively increased 3% and students who took evening courses exclusively decreased 23%.
Headcount by Day, Evening, & Online Status:
Table 1.14. City College/ECC Headcount by Day, Evening, & Online Status
Source: SDCCD Information System
Figure 1.14. City College/ECC Headcount by Day, Evening, & Online Status
SDCCD Office of Institutional Research and Planning 20
City College/ECC Fact Book 2017_______________________________

Non-Active Military or Veteran, nor Military
Spouse or Dependent
Non-Active Military or Veteran, and Military Spouse or Dependent
Active Military or Veteran, and Military Spouse or
Dependent
Active Military or Veteran
100%90%80%70%60%50%40%30%20%10%0%
Fall 12 Fall 13 Fall 14 Fall 15 Fall 16
Headcount by Military Status: Over the past five fall terms, on average, 8% of City College/ECC students were active duty military or veterans, 2% were dependents and not active duty military or veterans, and 2% were dependents and active duty military or veterans. Between Fall 2012 and Fall 2016, the number of active duty military or veteran students increased 2%, and non‐military students remained stable.
Source: SDCCD Information System
Table 1.15. City College/ECC Headcount by Military Status
Figure 1.15. City College/ECC Headcount by Military Status
All Colleges Average Fall 12-16
8%
2%
3%
88%
100%
12%
88%
100%
Military StatusFall 12 Fall 12 Fall 13
Fall 13 Fall 14 Fall 14 Fall 15
Fall 15Fall 16
Fall 16
% Change Fall 12-16
College Average Fall 12-16
Active Military or Veteran
Active Military or Veteran, Military Spouse or DependentNon-Active Military or Veteran, Military Spouse or DependentNon-Active Military or Veteran, nor Military Spouse or DependentTotal
1,350 8% 1,520 9% 1,349 8% 1,379 8% 1,374 8% 2% 8%
111 1% 285 2% 294 2% 307 2% 321 2% 189% 2%
534 3% 303 2% 335 2% 335 2% 305 2% -43% 2%
14,928 88% 14,345 87% 14,392 88% 14,628 88% 14,907 88% -0% 88%
16,923 100% 16,453 100% 16,370 100% 16,649 100% 16,907 100% -0% 100%
Total Active/Non-Active Military or Veteran, Spouse or DependentNon-Active Military or Veteran, nor Military Spouse or DependentTotal
1,995 12% 2,108 13% 1,978 12% 2,021 12% 2,000 12% 0% 12%
14,928 88% 14,345 87% 14,392 88% 14,628 88% 14,907 88% -0% 88%
16,923 100% 16,453 100% 16,370 100% 16,649 100% 16,907 100% 0% 100%
SDCCD Office of Institutional Research and Planning 21
City College/ECC Fact Book 2017_______________________________

12.0 + Units9.0 - 11.9 Units6.0 - 8.9 Units3.0 - 5.9 Units0.1 - 2.9 Units
80%
70%
60%
50%
40%
30%
20%
10%
0%
Fall 2012 Fall 2013 Fall 2014 Fall 2015 Fall 2016
Table 1.16 shows the interplay between units attempted (in rows) and units earned (in columns). On average, the greatest proportion of students who earned the units attempted were those in the 3.0-5.9 unit range (70%). The smallest proportions of students who earned the units attempted were those in the 9.0-11.9 and 12.0+ unit ranges (54% & 55%, respectively). Students who attempted and earned 12 or more units increased 2%, while students who attempted and earned between 0.1 and 2.9 units decreased 18% between Fall 2012 and Fall 2016.
Headcount by Units Attempted by Units Earned:
Figure 1.16. City College/ECC Headcount by Units Attempted by Units Earned
SDCCD Office of Institutional Research and Planning 22
City College/ECC Fact Book 2017_______________________________

� �� 0.1 - 2.9 Units 3.0 - 5.9 Units 6.0 - 8.9 Units 9.0 - 11.9 Units 12.0 + Units
Average Fall 12-16 --- 69% 70% 58% 54% 55%
0 Units 0.1 - 2.9 Units 3.0 - 5.9 Units 6.0 - 8.9 Units 9.0 - 11.9 Units 12.0 + Units
% Change Fall 12-16 --- -18% 4% 3% 5% 2%
12.0 + Units
Fall 2012
0.1 - 2.9 Units3.0 - 5.9 Units6.0 - 8.9 Units9.0 - 11.9 Units12.0 + Units
Fall 2013
0.1 - 2.9 Units3.0 - 5.9 Units6.0 - 8.9 Units9.0 - 11.9 Units12.0 + Units
Fall 2014
0.1 - 2.9 Units3.0 - 5.9 Units6.0 - 8.9 Units9.0 - 11.9 Units12.0 + Units
Fall 2015
0.1 - 2.9 Units3.0 - 5.9 Units6.0 - 8.9 Units9.0 - 11.9 Units12.0 + Units
Fall 2016 0.1 - 2.9 Units3.0 - 5.9 Units6.0 - 8.9 Units9.0 - 11.9 Units12.0 + Units
53%
56%
56%
56%
56%
9.0 - 11.9 Units
Fall 2012
0.1 - 2.9 Units3.0 - 5.9 Units6.0 - 8.9 Units9.0 - 11.9 Units12.0 + Units
Fall 2013
0.1 - 2.9 Units3.0 - 5.9 Units6.0 - 8.9 Units9.0 - 11.9 Units12.0 + Units
Fall 2014
0.1 - 2.9 Units3.0 - 5.9 Units6.0 - 8.9 Units9.0 - 11.9 Units12.0 + Units
Fall 2015
0.1 - 2.9 Units3.0 - 5.9 Units6.0 - 8.9 Units9.0 - 11.9 Units12.0 + Units
Fall 2016 0.1 - 2.9 Units3.0 - 5.9 Units6.0 - 8.9 Units9.0 - 11.9 Units12.0 + Units
54%18%
53%18%
53%18%
53%17%
55%17%
6.0 - 8.9 Units
Fall 2012
0.1 - 2.9 Units3.0 - 5.9 Units6.0 - 8.9 Units9.0 - 11.9 Units12.0 + Units
Fall 2013
0.1 - 2.9 Units3.0 - 5.9 Units6.0 - 8.9 Units9.0 - 11.9 Units12.0 + Units
Fall 2014
0.1 - 2.9 Units3.0 - 5.9 Units6.0 - 8.9 Units9.0 - 11.9 Units12.0 + Units
Fall 2015
0.1 - 2.9 Units3.0 - 5.9 Units6.0 - 8.9 Units9.0 - 11.9 Units12.0 + Units
Fall 2016 0.1 - 2.9 Units3.0 - 5.9 Units6.0 - 8.9 Units9.0 - 11.9 Units12.0 + Units
58%18%13%
58%20%12%
58%20%12%
57%20%11%
58%20%12%
3.0 - 5.9 Units
Fall 2012
0.1 - 2.9 Units3.0 - 5.9 Units6.0 - 8.9 Units9.0 - 11.9 Units12.0 + Units
Fall 2013
0.1 - 2.9 Units3.0 - 5.9 Units6.0 - 8.9 Units9.0 - 11.9 Units12.0 + Units
Fall 2014
0.1 - 2.9 Units3.0 - 5.9 Units6.0 - 8.9 Units9.0 - 11.9 Units12.0 + Units
Fall 2015
0.1 - 2.9 Units3.0 - 5.9 Units6.0 - 8.9 Units9.0 - 11.9 Units12.0 + Units
Fall 2016 0.1 - 2.9 Units3.0 - 5.9 Units6.0 - 8.9 Units9.0 - 11.9 Units12.0 + Units
69%21%13%7%
71%21%14%7%
69%21%13%7%
72%23%14%8%
71%22%12%8%
0.1 - 2.9 Units
Fall 2012
0.1 - 2.9 Units3.0 - 5.9 Units6.0 - 8.9 Units9.0 - 11.9 Units12.0 + Units
Fall 2013
0.1 - 2.9 Units3.0 - 5.9 Units6.0 - 8.9 Units9.0 - 11.9 Units12.0 + Units
Fall 2014
0.1 - 2.9 Units3.0 - 5.9 Units6.0 - 8.9 Units9.0 - 11.9 Units12.0 + Units
Fall 2015
0.1 - 2.9 Units3.0 - 5.9 Units6.0 - 8.9 Units9.0 - 11.9 Units12.0 + Units
Fall 2016 0.1 - 2.9 Units3.0 - 5.9 Units6.0 - 8.9 Units9.0 - 11.9 Units12.0 + Units
65%1%2%1%1%71%1%2%1%1%69%1%2%1%1%72%1%2%1%1%69%1%2%1%1%
0 Units
Fall 2012
0.1 - 2.9 Units3.0 - 5.9 Units6.0 - 8.9 Units9.0 - 11.9 Units12.0 + Units
Fall 2013
0.1 - 2.9 Units3.0 - 5.9 Units6.0 - 8.9 Units9.0 - 11.9 Units12.0 + Units
Fall 2014
0.1 - 2.9 Units3.0 - 5.9 Units6.0 - 8.9 Units9.0 - 11.9 Units12.0 + Units
Fall 2015
0.1 - 2.9 Units3.0 - 5.9 Units6.0 - 8.9 Units9.0 - 11.9 Units12.0 + Units
Fall 2016
0.1 - 2.9 Units3.0 - 5.9 Units6.0 - 8.9 Units9.0 - 11.9 Units12.0 + Units
35%29%20%13%8%29%28%20%13%6%31%30%19%13%6%28%27%18%12%7%31%28%18%11%7%
Source: SDCCD Information SystemNote. Percent change and average were based on counts.
Units Earned
Uni
ts A
ttem
pted
Table 1.16. City College/ECC Headcount by Units Attempted by Units Earned
SDCCD Office of Institutional Research and Planning 23
City College/ECC Fact Book 2017_______________________________

Section IIPersistence Rates
SDCCD Office of Institutional Research and Planning 24
City College/ECC Fact Book 2017_______________________________

This section of the Fact Book contains information on the term and annual persistence rates for first‐time to college students. For purposes of this report, the term persistence rate is the percentage of first‐time to college students who enrolled in a fall term as of official census who received a grade notation of A, B, C, D, F, P, NP, I, or RD and who enrolled in at least one course in the subsequent spring term and received a grade notation of A, B, C, D, F, P, NP, I, or RD (SDSU and UCSD‐only students and sections are excluded. Intersession, tutoring, in‐service, and cancelled classes are excluded). Annual persistence follows the same operational definition; however, student enrollments are tracked from fall to spring to fall.
The information in this section includes five years of data and is reported as follows:1) Overall2) Gender3) Ethnicity4) Age
SDCCD Office of Institutional Research and Planning 25
City College/ECC Fact Book 2017_______________________________

The average term persistence rate of first‐time students at City College/ECC was 69% among the Fall 2011 to Fall 2016 cohorts. The average annual persistence rate among the Fall 2011 to Fall 2015 cohorts was 46%. Overall, term persistence rates remained stable at 68% from Fall 2011 to Fall 2016. Annual persistence rates increased three percentage points, from 45% in Fall 2011 to 48% in Fall 2015. The average term and annual persistence rates of first‐time City College/ECC students were lower compared to the average term and annual persistence rates of first‐time students enrolled in all colleges in the District (79% & 59%, respectively).
45% 45%47% 46%
48%
57%59% 58%
60% 59%
Fall 2015Fall 2014Fall 2013Fall 2012Fall 2011
City College/ECC All Colleges
Overall Persistence:
Table 2.1. City College/ECC First-Time Student Overall Term and Annual Persistence
Source: SDCCD Information System
Figure 2.1. City College/ECC First-Time Student Overall Annual Persistence
Note. Overall annual persistence counts and rates exclude the Fall 2016 cohort due to the unavailability of Fall 2017 data.
All Colleges Term
Persistence
All Colleges Annual
Persistence
78% 57%79% 59%78% 58%79% 60%79% 59%78% ---79% 59%
CohortFall Enrolled
Cohort
Term Persistence
Counts
Term Persistence
Rates
Annual Persistence
Counts
Annual Persistence
Rates
Fall 2011Fall 2012Fall 2013Fall 2014Fall 2015Fall 2016Total/Average
1,677 1,148 68% 763 45%1,673 1,156 69% 758 45%1,603 1,121 70% 751 47%1,633 1,138 70% 759 46%1,668 1,188 71% 802 48%1,634 1,103 68% --- ---9,888 6,854 69% 3,833 46%
SDCCD Office of Institutional Research and Planning 26
City College/ECC Fact Book 2017_______________________________

Annual Persistence by Gender: On average, annual persistence rates of female students (49%) were higher than their male student counterparts (44%) between the Fall 2011 and Fall 2015 cohorts. Persistence rates decreased one percentage point for female students and increased five percentage points for male students between the Fall 2011 and Fall 2015 cohorts.
MaleFemale
60%
50%
40%
30%
20%
10%
0%
Fall 2011 Fall 2012 Fall 2013 Fall 2014 Fall 2015
Cohort
Gender Female Male
Fall Enrolled Cohort
Annual Persistence
Counts
Annual Persistence
Rates
Fall Enrolled Cohort
Annual Persistence
Counts
Annual Persistence
Rates
Fall 2011Fall 2012Fall 2013Fall 2014Fall 2015Total/Average
793 394 50% 884 369 42%806 394 49% 865 363 42%773 390 50% 830 361 43%803 394 49% 830 365 44%871 428 49% 797 374 47%4,046 2,000 49% 4,206 1,832 44%
Figure 2.2. City College/ECC First-Time Student Annual Persistence by Gender
Table 2.2. City College/ECC First-Time Student Annual Persistence by Gender
Source: SDCCD Information SystemNote. Due to a low student cohort count, 'Unreported' students are excluded from the analysis.
SDCCD Office of Institutional Research and Planning 27
City College/ECC Fact Book 2017_______________________________

UnreportedOtherWhiteLatinoFilipinoAsian/Pacific Islander
American Indian
African American
80%
70%
60%
50%
40%
30%
20%
10%
0%
Fall 2011 Fall 2012 Fall 2013 Fall 2014 Fall 2015
Figure 2.3. City College/ECC First-Time Student Annual Persistence by Ethnicity
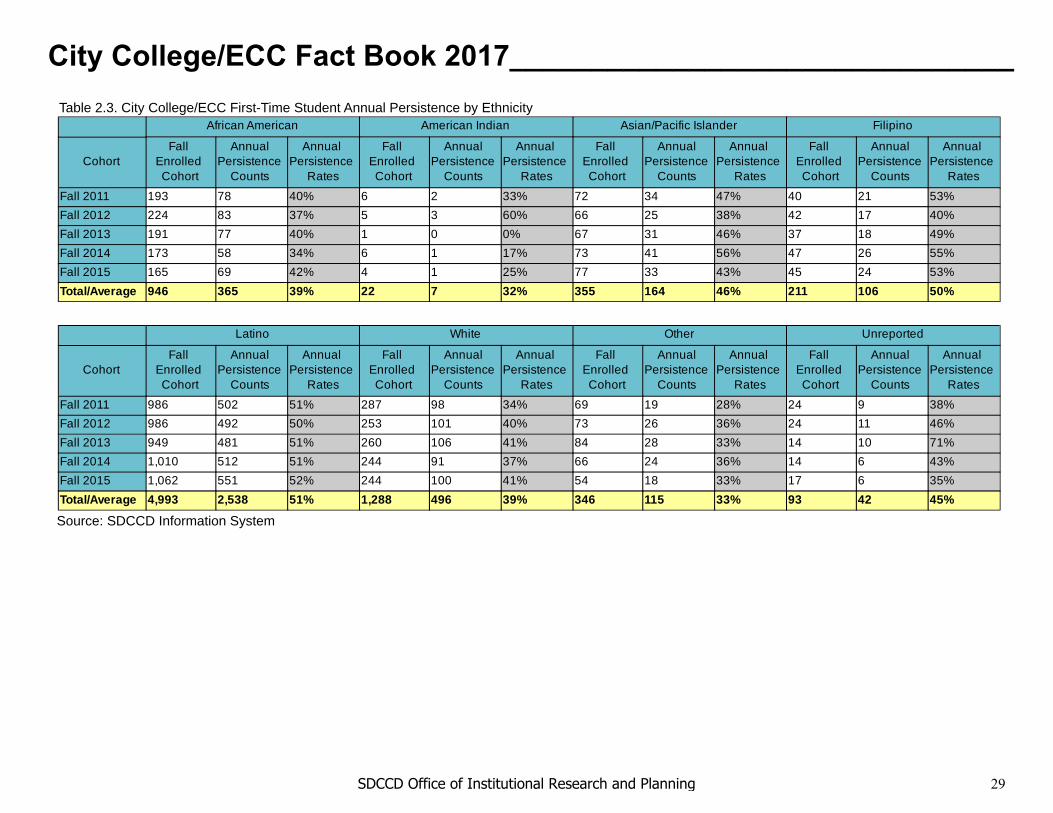
Annual Persistence by Ethnicity: The ethnic groups with the highest annual persistence rates, on average, were Latino students (51%), Filipino students (50%), and Asian/Pacific Islander students (46%). White students and students categorized as ʺOtherʺ ethnicity showed the greatest increase over the five year period increasing seven percentage points and five percentage points, respectively.
SDCCD Office of Institutional Research and Planning 28
City College/ECC Fact Book 2017_______________________________
Cohort
Ethnicity Latino White Other Unreported
Fall Enrolled Cohort
Annual Persistence
Counts
Annual Persistence
Rates
Fall Enrolled Cohort
Annual Persistence
Counts
Annual Persistence
Rates
Fall Enrolled Cohort
Annual Persistence
Counts
Annual Persistence
Rates
Fall Enrolled Cohort
Annual Persistence
Counts
Annual Persistence
Rates
Fall 2011Fall 2012Fall 2013Fall 2014Fall 2015Total/Average
986 502 51% 287 98 34% 69 19 28% 24 9 38%986 492 50% 253 101 40% 73 26 36% 24 11 46%949 481 51% 260 106 41% 84 28 33% 14 10 71%1,010 512 51% 244 91 37% 66 24 36% 14 6 43%1,062 551 52% 244 100 41% 54 18 33% 17 6 35%4,993 2,538 51% 1,288 496 39% 346 115 33% 93 42 45%
Cohort
Ethnicity African American American Indian Asian/Pacific Islander Filipino
Fall Enrolled Cohort
Annual Persistence
Counts
Annual Persistence
Rates
Fall Enrolled Cohort
Annual Persistence
Counts
Annual Persistence
Rates
Fall Enrolled Cohort
Annual Persistence
Counts
Annual Persistence
Rates
Fall Enrolled Cohort
Annual Persistence
Counts
Annual Persistence
Rates
Fall 2011Fall 2012Fall 2013Fall 2014Fall 2015Total/Average
193 78 40% 6 2 33% 72 34 47% 40 21 53%224 83 37% 5 3 60% 66 25 38% 42 17 40%191 77 40% 1 0 0% 67 31 46% 37 18 49%173 58 34% 6 1 17% 73 41 56% 47 26 55%165 69 42% 4 1 25% 77 33 43% 45 24 53%946 365 39% 22 7 32% 355 164 46% 211 106 50%
Source: SDCCD Information System
Table 2.3. City College/ECC First-Time Student Annual Persistence by Ethnicity
SDCCD Office of Institutional Research and Planning 29
City College/ECC Fact Book 2017_______________________________

50 and >40 - 4930 - 3925 - 2918 - 24Under 18
70%
60%
50%
40%
30%
20%
10%
0%
Fall 2011 Fall 2012 Fall 2013 Fall 2014 Fall 2015
Figure 2.4. City College/ECC First-Time Student Annual Persistence by Age
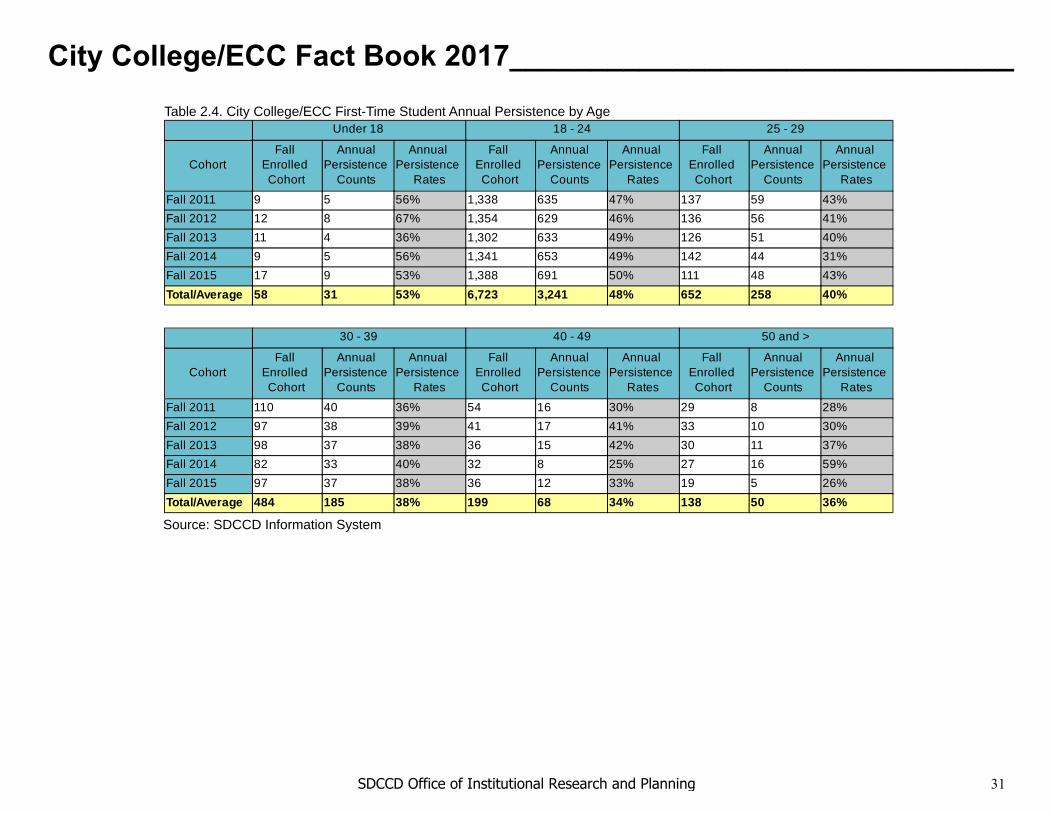
Students under age 18 had the highest average persistence rate (53%). Between Fall 2011 and Fall 2015, annual persistence rates increased by three percentage points for students between the ages 18 and 24 and students between the ages 40 and 49.Annual Persistence by Age:
SDCCD Office of Institutional Research and Planning 30
City College/ECC Fact Book 2017_______________________________
Source: SDCCD Information System
Cohort
Agepro 30 - 39 40 - 49 50 and >
Fall Enrolled Cohort
Annual Persistence
Counts
Annual Persistence
Rates
Fall Enrolled Cohort
Annual Persistence
Counts
Annual Persistence
Rates
Fall Enrolled Cohort
Annual Persistence
Counts
Annual Persistence
Rates
Fall 2011Fall 2012Fall 2013Fall 2014Fall 2015Total/Average
110 40 36% 54 16 30% 29 8 28%97 38 39% 41 17 41% 33 10 30%98 37 38% 36 15 42% 30 11 37%82 33 40% 32 8 25% 27 16 59%97 37 38% 36 12 33% 19 5 26%484 185 38% 199 68 34% 138 50 36%
Cohort
Agepro Under 18 18 - 24 25 - 29
Fall Enrolled Cohort
Annual Persistence
Counts
Annual Persistence
Rates
Fall Enrolled Cohort
Annual Persistence
Counts
Annual Persistence
Rates
Fall Enrolled Cohort
Annual Persistence
Counts
Annual Persistence
Rates
Fall 2011Fall 2012Fall 2013Fall 2014Fall 2015Total/Average
9 5 56% 1,338 635 47% 137 59 43%12 8 67% 1,354 629 46% 136 56 41%11 4 36% 1,302 633 49% 126 51 40%9 5 56% 1,341 653 49% 142 44 31%17 9 53% 1,388 691 50% 111 48 43%58 31 53% 6,723 3,241 48% 652 258 40%
Table 2.4. City College/ECC First-Time Student Annual Persistence by Age
SDCCD Office of Institutional Research and Planning 31
City College/ECC Fact Book 2017_______________________________

Section IIIStudent Completion
SDCCD Office of Institutional Research and Planning 32
City College/ECC Fact Book 2017_______________________________

This section of the Fact Book contains information on various student completion outcomes which may be considered indirect assessments of student learning. The outcomes included in this section are: 1) Annual Successful Course Completion Rates, 2) Annual Retention Rates, 3) Annual GPA, 4) Annual Awards Conferred, and 5) Annual Transfer Volume. All of the information in this section includes five years of data by gender, ethnicity, and age. The following describes in detail each of the outcomes listed.
1) Successful Course Completion Rates. The first outcome reported in this section is successful course completion, or student success rate.For purposes of this report, the success rate is the percentage of students who complete a course with a grade of A, B, C, or P out of total official census enrollments. Tutoring, non‐credit, and cancelled classes are excluded.
2) Retention Rates. The second outcome reported in this section is retention rate. For purposes of this report, the retention rate is thepercentage of students who complete a course with a grade of A, B, C, D, F, P, NP, I or RD out of total official census enrollments. Tutoring and cancelled classes are excluded.
3) Annual GPA. The third outcome reported in this section is annual GPA. For purposes of this report, the annual GPA is the total gradepoint average of all students for a given academic year.
4) Annual Awards Conferred. The fourth outcome reported in this section is the annual awards conferred. For purposes of this report, theannual awards conferred are the total number of associate degrees and certificates awarded in a single academic year (summer, fall, and spring).
5) Annual Transfer Volume. The last outcome reported in this section is the number of students who transferred annually. For the purposesof this report, the annual transfer volume represents the total number of students who transferred to a 4‐year institution and were enrolled at an SDCCD college at any time within six semesters prior to transferring (including stop outs). The student must also have completed 12 or more transferrable units from any one of the SDCCD credit colleges within six years prior to transferring to a 4‐year institution. Note. Transfer volume parameters were changed for this report beginning with the 2014 Fact Book. Final data are reported for 2011/12 – 2015/16. Additionally, due to entry requirements at the CSU/UCs that delay transferring, the number of semesters prior to transferring was increased from three to six. Thus, totals will be different when comparing historical terms to Fact Book editions prior to 2014. Please see the 2017 SDCCD Transfer Report: A Comprehensive Perspective for comparable transfer volume numbers.
Note. Annual awards conferred that are reported in this Fact Book are considered preliminary data. Please see the upcoming Awards Conferred Supplement report for final annual awards conferred numbers.
SDCCD Office of Institutional Research and Planning 33
City College/ECC Fact Book 2017_______________________________

67%68%
67%68% 68%
70% 70%71% 71% 71%
2016-172015-162014-152013-142012-13
City College All Colleges
Table 3.1. City College/ECC Overall Success Rates
Figure 3.1. City College/ECC Overall Success Rates
Source: SDCCD Information System
Overall Success Rates: City College/ECC annual success rates increased one percentage point between 2012/13 and 2016/17, with a five‐year average of 67%. The average success rate for City College/ECC was below the average success rate of all colleges in the District (71%).
All Colleges Average 12/13 - 16/17
71%
Filler 2012-13 2013-14 2014-15 2015-16 2016-17 % Difference12/13 - 16/17
College Average 12/13 - 16/17
Average 67% 68% 67% 68% 68% 1% 67%
SDCCD Office of Institutional Research and Planning 34
City College/ECC Fact Book 2017_______________________________

UnreportedMaleFemale
100%
90%
80%
70%
60%
50%
40%
30%
20%
10%
0%
2012-13 2013-14 2014-15 2015-16 2016-17
Figure 3.2. City College/ECC Success Rates by Gender
Table 3.2. City College/ECC Success Rates by Gender
On average, female and male students success rates between 2012/13 and 2016/17 were comparable (68% & 67%, respectively). At City College/ECC, both female and male students had lower average success rates compared to the female and male student populations of all colleges in the District (71% & 70%, respectively). Between 2012/13 and 2016/17, the success rates for male students at City College/ECC increased two percentage points while the success rates for female students remained stable.
Success Rates by Gender:
Source: SDCCD Information System
All Colleges Average 12/13 - 16/17
71%70%---71%
Gender 2012-13 2013-14 2014-15 2015-16 2016-17 % Difference12/13 - 16/17
College Average 12/13 - 16/17
FemaleMaleUnreportedAverage
68% 68% 68% 69% 68% 0% 68%65% 67% 67% 67% 67% 2% 67%93% 57% --- --- --- --- ---67% 68% 67% 68% 68% 1% 67%
Note. Unreported cells may have fewer than 25 students in a given year.
SDCCD Office of Institutional Research and Planning 35
City College/ECC Fact Book 2017_______________________________

UnreportedOtherWhiteLatinoFilipinoAsian/Pacific Islander
American Indian
African American
90%80%70%60%50%40%30%20%10%0%
2012-13 2013-14 2014-15 2015-16 2016-17
Table 3.3. City College/ECC Success Rates by Ethnicity
Figure 3.3. City College/ECC Success Rates by Ethnicity
On average, the ethnic groups with the highest success rates between 2012/13 and 2016/17 were Asian/Pacific Islander students (77%), Filipino students (75%), and White students (75%). The average success rates of Latino students (64%) and African American students (62%) were lower than the overall average success rates of the general student populations at City College/ECC and all colleges in the District (67% & 71%, respectively). Success rates for most ethnic groups increased between 2012/13 and 2016/17.
Success Rates by Ethnicity:
Source: SDCCD Information System
All Colleges Average 12/13 - 16/17
62%70%78%74%66%76%69%73%71%
Ethnicity 2012-13 2013-14 2014-15 2015-16 2016-17 % Difference12/13 - 16/17
College Average 12/13 - 16/17
African AmericanAmerican IndianAsian/Pacific IslanderFilipinoLatinoWhiteOtherUnreportedAverage
61% 62% 63% 62% 62% 1% 62%70% 62% 68% 68% 72% 2% 68%75% 78% 78% 78% 77% 2% 77%74% 76% 74% 73% 75% 1% 75%63% 65% 64% 65% 65% 2% 64%74% 75% 75% 75% 76% 2% 75%70% 66% 64% 67% 67% -3% 67%69% 65% 64% 66% 67% -2% 67%67% 68% 67% 68% 68% 1% 67%
SDCCD Office of Institutional Research and Planning 36
City College/ECC Fact Book 2017_______________________________

Unreported50 and >40 - 4930 - 3925 - 2918 - 24Under 18
100%90%80%70%60%50%40%30%20%10%0%
2012-13 2013-14 2014-15 2015-16 2016-17
Source: SDCCD Information System
Figure 3.4. City College/ECC Success Rates by Age
Table 3.4. City College/ECC Success Rates by Age
Between 2012/13 and 2016/17, the age group with the highest success rate, on average, was students under age 18 (83%). With the exception of students between ages 18 and 24 (65%), the average success rates of all other reported age groups were higher than or comparable to the average success rates of the general student populations at City College/ECC and all colleges in the District (67% & 71%, respectively).
Success Rates by Age:
All Colleges Average 12/13 - 16/17
88%68%72%75%76%75%---71%
Agepro2012-13 2013-14 2014-15 2015-16 2016-17
% Difference 12/13 - 16/17
College Average 12/13 - 16/17
Under 1818 - 2425 - 2930 - 3940 - 4950 and >UnreportedAverage
86% 85% 85% 82% 79% -7% 83%63% 65% 64% 65% 65% 2% 65%70% 71% 70% 69% 70% 0% 70%72% 73% 73% 73% 72% 0% 73%71% 71% 74% 73% 73% 2% 72%71% 68% 69% 72% 72% 1% 70%--- --- --- --- 100% --- ---67% 68% 67% 68% 68% 1% 67%
Note. Unreported cells may have fewer than 25 students in a given year.
SDCCD Office of Institutional Research and Planning 37
City College/ECC Fact Book 2017_______________________________
85% 85%86% 86%
86% 86% 86%87% 87%
2016-172015-162014-152013-142012-13
City College All Colleges
Table 3.5. City College/ECC Overall Retention Rates
Figure 3.5. City College/ECC Overall Retention Rates
Source: SDCCD Information System
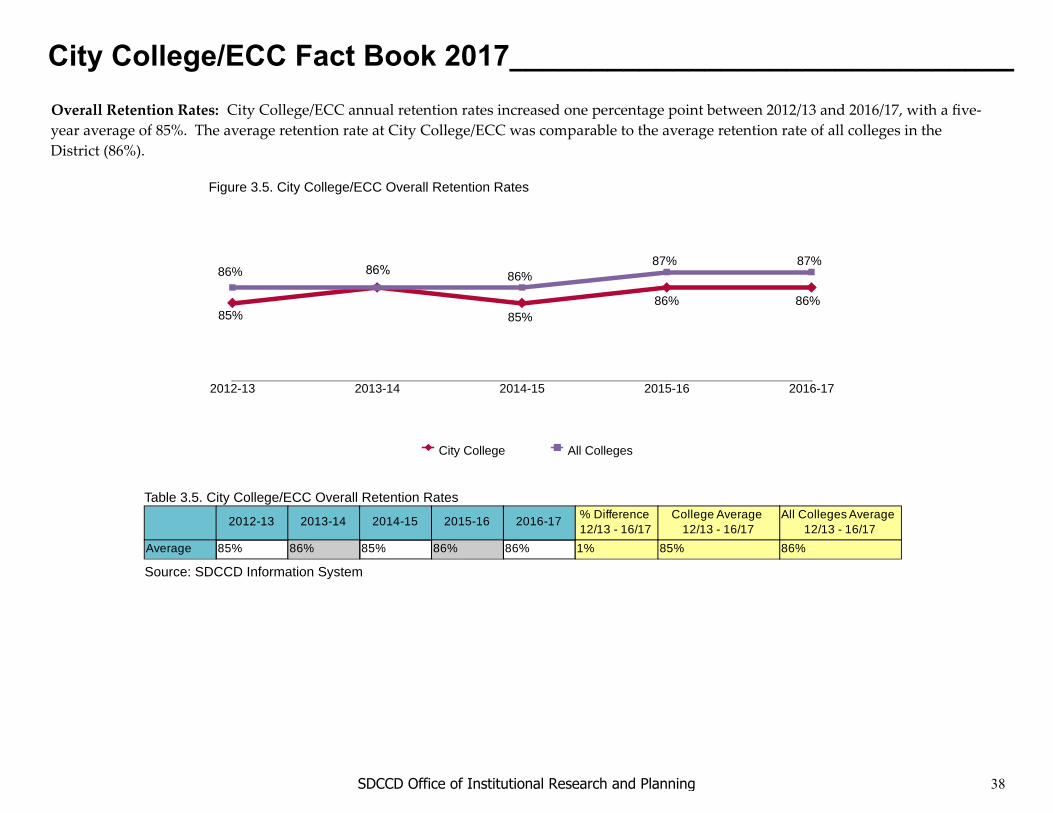
Overall Retention Rates: City College/ECC annual retention rates increased one percentage point between 2012/13 and 2016/17, with a five‐year average of 85%. The average retention rate at City College/ECC was comparable to the average retention rate of all colleges in the District (86%).
All Colleges Average 12/13 - 16/17
86%
Filler 2012-13 2013-14 2014-15 2015-16 2016-17 % Difference12/13 - 16/17
College Average 12/13 - 16/17
Average 85% 86% 85% 86% 86% 1% 85%
SDCCD Office of Institutional Research and Planning 38
City College/ECC Fact Book 2017_______________________________

UnreportedMaleFemale
100%
90%
80%
70%
60%
50%
40%
30%
20%
10%
0%
2012-13 2013-14 2014-15 2015-16 2016-17
Figure 3.6. City College/ECC Retention Rates by Gender
Table 3.6. City College/ECC Retention Rates by Gender
At City College/ECC, the female student retention rate, on average, was comparable to the male student retention rate (86% & 85%, respectively) between 2012/13 and 2016/17. The average retention rates of both female and male students at City College/ECC were comparable to the average retention rates of the female and male student populations of all colleges in the District (86% each). The average retention rates among males at City College/ECC increased over the five year period by one percentage point while the average retention rates among female students remained stable.
Retention Rates by Gender:
Source: SDCCD Information SystemNote. Unreported cells may have fewer than 25 students in a given year.
All Colleges Average 12/13 - 16/17
86%86%---86%
Gender 2012-13 2013-14 2014-15 2015-16 2016-17 % Difference12/13 - 16/17
College Average 12/13 - 16/17
FemaleMaleUnreportedAverage
86% 86% 85% 86% 86% 0% 86%85% 86% 85% 85% 86% 1% 85%100% 100% --- --- --- --- ---85% 86% 85% 86% 86% 1% 85%
SDCCD Office of Institutional Research and Planning 39
City College/ECC Fact Book 2017_______________________________

UnreportedOtherWhiteLatinoFilipinoAsian/Pacific Islander
American Indian
African American
100%90%80%70%60%50%40%30%20%10%0%
2012-13 2013-14 2014-15 2015-16 2016-17
Table 3.7. City College/ECC Retention Rates by Ethnicity
Figure 3.7. City College/ECC Retention Rates by Ethnicity
The ethnic groups with the highest retention rates, on average, were Asian/Pacific Islander students and Filipino students (88% each). The average retention rates of American Indian students and African American students (84% & 83%, respectively) were lower compared to the general student populations of City College/ECC (85%) and all colleges in the District (86%).
Retention Rates by Ethnicity:
Source: SDCCD Information System
All Colleges Average 12/13 - 16/17
83%86%89%88%85%88%86%88%86%
Ethnicity 2012-13 2013-14 2014-15 2015-16 2016-17 % Difference12/13 - 16/17
College Average 12/13 - 16/17
African AmericanAmerican IndianAsian/Pacific IslanderFilipinoLatinoWhiteOtherUnreportedAverage
84% 83% 83% 83% 82% -2% 83%87% 76% 85% 85% 87% 0% 84%88% 89% 88% 87% 89% 1% 88%88% 89% 88% 89% 87% -1% 88%85% 85% 84% 85% 85% 0% 85%87% 87% 88% 87% 88% 1% 87%85% 84% 82% 86% 85% 0% 84%86% 88% 88% 88% 88% 2% 87%85% 86% 85% 86% 86% 1% 85%
SDCCD Office of Institutional Research and Planning 40
City College/ECC Fact Book 2017_______________________________

Unreported50 and >40 - 4930 - 3925 - 2918 - 24Under 18
100%90%80%70%60%50%40%30%20%10%0%
2012-13 2013-14 2014-15 2015-16 2016-17
Table 3.8. City College/ECC Retention Rates by Age
Figure 3.8. City College/ECC Retention Rates by Age
Source: SDCCD Information System
Between 2012/13 and 2016/17, City College/ECC students under age 18 had the highest average retention rate (94%). All remaining age groups had retention rates that were between 84% and 86%, which were comparable to the average retention rates for the general student populations at City College/ECC (85%) and all colleges in the District (86%).
Retention Rates by Age:
All Colleges Average 12/13 - 16/17
96%87%86%86%87%86%---86%
Agepro2012-13 2013-14 2014-15 2015-16 2016-17
% Difference 12/13 - 16/17
College Average 12/13 - 16/17
Under 1818 - 2425 - 2930 - 3940 - 4950 and >UnreportedAverage
94% 95% 95% 94% 91% -3% 94%85% 86% 85% 86% 86% 1% 86%85% 85% 85% 85% 85% 0% 85%85% 86% 84% 86% 85% 0% 85%86% 85% 85% 85% 86% 0% 85%85% 84% 84% 84% 85% 0% 84%--- --- --- --- 100% --- ---85% 86% 85% 86% 86% 1% 85%
Note. Unreported cells may have fewer than 25 students in a given year.
SDCCD Office of Institutional Research and Planning 41
City College/ECC Fact Book 2017_______________________________

2.612.63 2.63
2.66 2.662.67 2.682.70
2.72 2.73
2016-172015-162014-152013-142012-13
City College All Colleges
Table 3.9. City College/ECC Overall Annual GPA
Figure 3.9. City College/ECC Overall Annual GPA
Source: SDCCD Information System
Overall Annual GPA: The average annual GPA for City College/ECC students increased steadily from 2.61 in 2012/13 to 2.66 in 2016/17, with a five‐year average of 2.64. The City College/ECC collegewide annual average was lower than the annual GPA average of all colleges in the District (2.70).
All Colleges Average 12/13 - 16/17
2.70
Filler 2012-13 2013-14 2014-15 2015-16 2016-17 College Average 12/13 - 16/17
Average 2.61 2.63 2.63 2.66 2.66 2.64
SDCCD Office of Institutional Research and Planning 42
City College/ECC Fact Book 2017_______________________________

UnreportedMaleFemale
4.00
3.50
3.00
2.50
2.00
1.50
1.00
0.50
0.00
2012-13 2013-14 2014-15 2015-16 2016-17
Figure 3.10. City College/ECC Annual GPA by Gender
Table 3.10. City College/ECC Annual GPA by Gender
Between 2012/13 and 2016/17, female students, on average, had a slightly higher GPA than their male student counterparts (2.67 & 2.61, respectively). The average GPA among female students increased from 2.65 in 2012/13 to 2.70 in 2016/17, and the average GPA among male students increased from 2.56 in 2012/13 to 2.62 in 2016/17. The average GPAs of female and male students at City College/ECC were lower than the average GPAs of the female and male student population of all colleges in the District (2.75 & 2.65, respectively).
Annual GPA by Gender:
Source: SDCCD Information System
All Colleges Average 12/13 - 16/17
2.752.65---2.70
Gender 2012-13 2013-14 2014-15 2015-16 2016-17 College Average 12/13 - 16/17
FemaleMaleUnreportedAverage
2.65 2.63 2.66 2.70 2.70 2.672.56 2.63 2.60 2.62 2.62 2.613.60 2.64 --- --- --- ---2.61 2.63 2.63 2.66 2.66 2.64
SDCCD Office of Institutional Research and Planning 43
City College/ECC Fact Book 2017_______________________________

UnreportedOtherWhiteLatinoFilipinoAsian/Pacific Islander
American Indian
African American
4.00
3.50
3.00
2.50
2.00
1.50
1.00
0.50
0.00
2012-13 2013-14 2014-15 2015-16 2016-17
Table 3.11. City College/ECC Annual GPA by Ethnicity
Figure 3.11. City College/ECC Annual GPA by Ethnicity
Annual GPA by Ethnicity: Between 2012/13 and 2016/17, White students (3.04), Asian/Pacific Islander students (3.03), and American Indian students (2.87) had the highest GPAs, on average. The average annual GPAs of Latino students (2.46) and African American students (2.42) were lower than the average annual GPAs of the general student populations at City College/ECC and all colleges in the District (2.64 & 2.70, respectively).
Source: SDCCD Information System
All Colleges Average 12/13 - 16/17
2.372.702.982.742.482.942.652.872.70
Ethnicity 2012-13 2013-14 2014-15 2015-16 2016-17 College Average 12/13 - 16/17
African AmericanAmerican IndianAsian/Pacific IslanderFilipinoLatinoWhiteOtherUnreportedAverage
2.35 2.43 2.43 2.47 2.45 2.422.77 2.86 2.82 3.01 2.99 2.872.97 3.02 3.06 3.09 3.02 3.032.80 2.90 2.85 2.82 2.90 2.852.42 2.44 2.45 2.50 2.49 2.463.03 3.04 3.05 3.04 3.06 3.042.76 2.60 2.60 2.69 2.72 2.672.82 2.80 2.81 2.74 2.75 2.792.61 2.63 2.63 2.66 2.66 2.64
SDCCD Office of Institutional Research and Planning 44
City College/ECC Fact Book 2017_______________________________

Unreported50 and >40 - 4930 - 3925 - 2918 - 24Under 18
4.00
3.50
3.00
2.50
2.00
1.50
1.00
0.50
0.00
2012-13 2013-14 2014-15 2015-16 2016-17
Source: SDCCD Information System
Figure 3.12. City College/ECC Annual GPA by Age
Table 3.12. City College/ECC Annual GPA by Age
Among reported age groups, students under age 18 had the highest average annual GPA (3.03) between 2012/13 and 2016/17. The average annual GPA of students who were between ages 18 and 24 (2.46) was lower than the average annual GPA of the general student populations at City College/ECC and all colleges in the District (2.64 & 2.70, respectively).
Annual GPA by Age:
All Colleges Average 12/13 - 16/17
3.102.562.862.983.013.044.002.70
Agepro2012-13 2013-14 2014-15 2015-16 2016-17
College Average 12/13 - 16/17
Under 1818 - 2425 - 2930 - 3940 - 4950 and >UnreportedAverage
3.11 3.01 3.06 2.93 3.10 3.032.41 2.44 2.44 2.50 2.50 2.462.81 2.81 2.81 2.78 2.79 2.802.94 2.94 2.96 2.95 2.97 2.952.91 2.92 2.99 3.01 3.00 2.962.91 2.82 2.90 3.01 3.04 2.93--- --- --- --- 4.00 ---2.61 2.63 2.63 2.66 2.66 2.64
Note. Unreported cells may have fewer than 25 students in a given year.
SDCCD Office of Institutional Research and Planning 45
City College/ECC Fact Book 2017_______________________________

All Colleges Average 12/13-16/17
T
69%16%16%100%
College Average 12/13-16/17
T
63%17%20%100%
Awards2012-13
2012-13 2013-14
2013-14 2014-15
2014-15 2015-16
2015-16 2016-17
2016-17
% Change 12/13-16/17
AA/AS DegreeCertificate 30 to 59 UnitsCertificate 29 or Fewer Units
Total
626 65% 673 60% 856 63% 814 59% 894 67% 43%158 16% 217 19% 242 18% 244 18% 189 14% 20%185 19% 232 21% 267 20% 321 23% 244 18% 32%969 100% 1,122 100% 1,365 100% 1,379 100% 1,327 100% 37%
Certificate 29 or Fewer UnitsCertificate 30 to 59 UnitsAA/AS Degree
70%
60%
50%
40%
30%
20%
10%
0%
2012-13 2013-14 2014-15 2015-16 2016-17
Annual Awards Conferred:
Source: SDCCD Information SystemNote 1. No Certificates of 60 or More Units were awarded.
Table 3.13. City College/ECC Overall Annual Awards Conferred
Figure 3.13. City College/ECC Overall Annual Awards Conferred
On average, 63% of the total awards conferred at City College/ECC were associate degrees. The number of associate degrees increased 43%, from 626 in 2012/13 to 894 in 2016/17. Certificates that require 30 to 59 units increased 20%, from 158 in 2012/13 to 189 in 2016/17, and certificates requiring 29 or fewer units increased 32%, from 185 in 2012/13 to 244 in 2016/17. The share of associate degrees awarded at City College/ECC was six percentage points lower, on average, than the share of associate degrees conferred within all colleges in the District (69%).
Note 2. Only state approved certificates are included.
SDCCD Office of Institutional Research and Planning 46
City College/ECC Fact Book 2017_______________________________

2016-172015-162014-152013-142012-13
80%70%60%50%40%30%20%10%0%
Female Male Unreported
2016-172015-162014-152013-142012-13
80%70%60%50%40%30%20%10%0%
Female Male Unreported
2016-172015-162014-152013-142012-13
80%70%60%50%40%30%20%10%0%
Female Male Unreported
Figure 3.14.1. City College/ECC Annual AA/AS Degrees by Gender
Figure 3.14.2. City College/ECC Annual Certificates 30 to 59 Units by Gender Figure 3.14.3. City College/ECC Annual Certificates 29 or Fewer Units by Gender
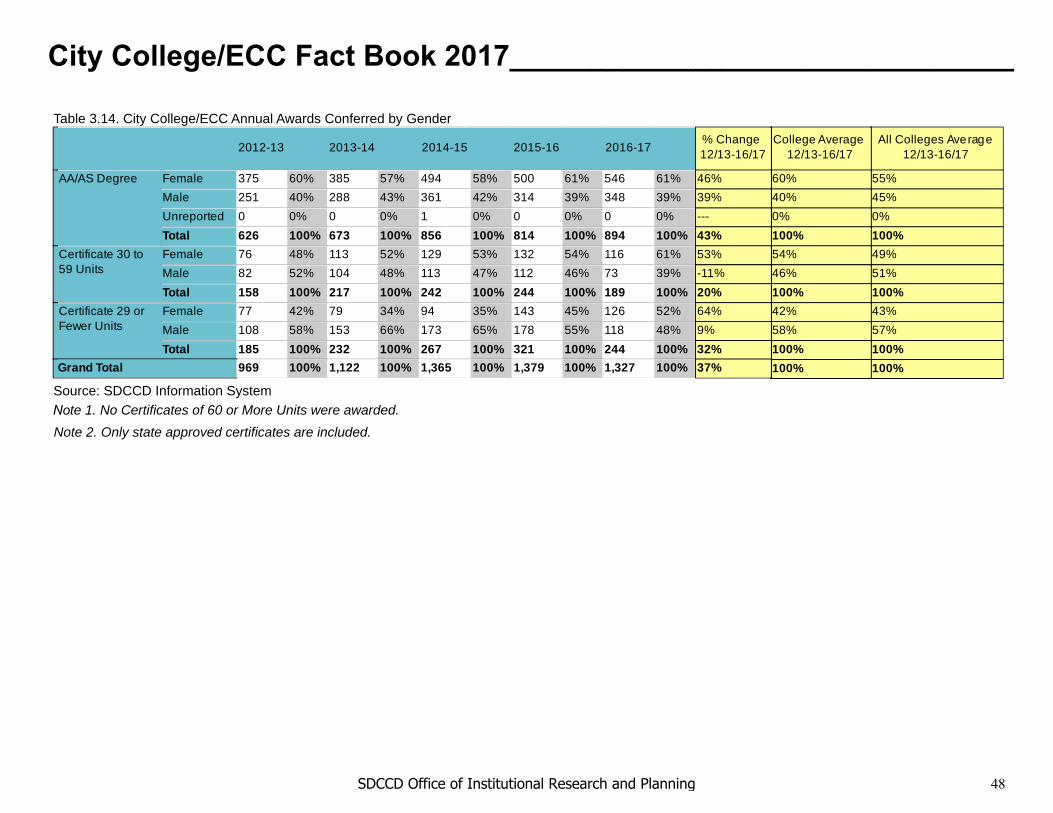
Of the total awards conferred at City College/ECC, female students received a greater share of the associate degrees, on average, than their male student counterparts (60% & 40%, respectively) between 2012/13 and 2016/17. The number of certificates requiring 30 to 59 units awarded to female students increased 53%, from 76 in 2012/13 to 116 in 2016/17. Female students received a smaller share of certificates requiring 29 or fewer units (42%) compared to male students (58%), on average, but showed a sixty‐four percentage point increase in these certificates between 2012/13 and 2016/17.
Annual Awards Conferred by Gender:
SDCCD Office of Institutional Research and Planning 47
City College/ECC Fact Book 2017_______________________________
All Colleges Average 12/13-16/17
To
55%45%0%100%49%51%100%43%57%100%100%
College Average 12/13-16/17
To
60%40%0%100%54%46%100%42%58%100%100%
Awards Gender_Label 2012-13
% of Award
20122013-14
% of Award
20132014-15
% of Award
20142015-16
% of Award
20152016-17
% of Award
2016
% Change 12/13-16/17
AA/AS Degree FemaleMaleUnreportedTotal
Certificate 30 to 59 Units
FemaleMaleTotal
Certificate 29 or Fewer Units
FemaleMaleTotal
375 60% 385 57% 494 58% 500 61% 546 61% 46%251 40% 288 43% 361 42% 314 39% 348 39% 39%0 0% 0 0% 1 0% 0 0% 0 0% ---626 100% 673 100% 856 100% 814 100% 894 100% 43%76 48% 113 52% 129 53% 132 54% 116 61% 53%82 52% 104 48% 113 47% 112 46% 73 39% -11%158 100% 217 100% 242 100% 244 100% 189 100% 20%77 42% 79 34% 94 35% 143 45% 126 52% 64%108 58% 153 66% 173 65% 178 55% 118 48% 9%185 100% 232 100% 267 100% 321 100% 244 100% 32%
Grand Total 969 100% 1,122 100% 1,365 100% 1,379 100% 1,327 100% 37%
Table 3.14. City College/ECC Annual Awards Conferred by Gender
Source: SDCCD Information System
SDCCD Office of Institutional Research and Planning 48
City College/ECC Fact Book 2017_______________________________
Note 1. No Certificates of 60 or More Units were awarded.Note 2. Only state approved certificates are included.

UnreportedOtherWhiteLatinoFilipinoAsian/Pacific Islander
American Indian
African American
60%50%40%30%20%10%0%
2012-13 2013-14 2014-15 2015-16 2016-17
UnreportedOtherWhiteLatinoFilipinoAsian/Pacific Islander
American Indian
African American
50%
40%
30%
20%
10%
0%
2012-13 2013-14 2014-15 2015-16 2016-17
Annual Awards Conferred by Ethnicity: Between 2012/13 and 2016/17, Latino students received 47% of the total associate degrees conferred, followed by White students (24%), and African American students (12%). Additionally, the number of associate degrees conferred increased 83% for Latino students and 42% for Asian/Pacific Islander students over the same years. Latino students also received the greatest share of certificates requiring 30 to 59 units (38%) and certificates requiring 29 or fewer units (39%).
Figure 3.15.1. City College/ECC Annual AA/AS Degrees by Ethnicity
Figure 3.15.2. City College/ECC Annual Certificates 30 to 59 Units by Ethnicity
SDCCD Office of Institutional Research and Planning 49
City College/ECC Fact Book 2017_______________________________

UnreportedOtherWhiteLatinoFilipinoAsian/Pacific Islander
American Indian
African American
60%50%40%30%20%10%0%
2012-13 2013-14 2014-15 2015-16 2016-17
Figure 3.15.3. City College/ECC Annual Certificates 29 or Fewer Units by Ethnicity
SDCCD Office of Institutional Research and Planning 50
City College/ECC Fact Book 2017_______________________________

All Colleges Average 12/13-16/17
To
6%0%12%6%32%34%6%3%100%7%1%10%4%30%40%5%4%100%7%1%14%5%31%35%5%3%100%100%
College Average 12/13-16/17
T
T
TTo
12%0%5%4%47%24%5%3%100%11%1%6%3%38%35%4%3%100%10%1%7%2%39%34%4%3%100%100%
Awards Ethnicity2012-13
% of Award 20
2013-14% of Award 20
2014-15% of Award 20
2015-16% of Award 20
2016-17% of Award 20
% Change 12/13-16/17
AA/AS Degree African AmericanAmerican IndianAsian/Pacific IslanderFilipinoLatinoWhiteOtherUnreported
TotalCertificate 30 to 59 Units
African AmericanAmerican IndianAsian/Pacific IslanderFilipinoLatinoWhiteOtherUnreported
TotalCertificate 29 or Fewer Units
African AmericanAmerican IndianAsian/Pacific IslanderFilipinoLatinoWhiteOtherUnreported
Total
82 13% 83 12% 97 11% 94 12% 90 10% 10%5 1% 2 0% 0 0% 3 0% 3 0% -40%31 5% 33 5% 46 5% 48 6% 44 5% 42%27 4% 38 6% 21 2% 37 5% 22 2% -19%252 40% 282 42% 418 49% 416 51% 460 51% 83%157 25% 197 29% 205 24% 154 19% 214 24% 36%41 7% 25 4% 44 5% 39 5% 43 5% 5%31 5% 13 2% 25 3% 23 3% 18 2% -42%626 100% 673 100% 856 100% 814 100% 894 100% 43%19 12% 29 13% 28 12% 24 10% 19 10% 0%0 0% 5 2% 1 0% 1 0% 0 0% ---9 6% 10 5% 17 7% 16 7% 8 4% -11%3 2% 9 4% 8 3% 4 2% 3 2% 0%55 35% 75 35% 89 37% 83 34% 92 49% 67%58 37% 70 32% 84 35% 101 41% 51 27% -12%7 4% 13 6% 7 3% 8 3% 10 5% 43%7 4% 6 3% 8 3% 7 3% 6 3% -14%158 100% 217 100% 242 100% 244 100% 189 100% 20%30 16% 31 13% 22 8% 27 8% 17 7% -43%2 1% 2 1% 2 1% 3 1% 1 0% -50%13 7% 10 4% 25 9% 27 8% 15 6% 15%5 3% 8 3% 7 3% 4 1% 5 2% 0%71 38% 76 33% 104 39% 130 40% 105 43% 48%44 24% 91 39% 91 34% 109 34% 92 38% 109%10 5% 11 5% 10 4% 8 2% 7 3% -30%10 5% 3 1% 6 2% 13 4% 2 1% -80%185 100% 232 100% 267 100% 321 100% 244 100% 32%
Grand Total 969 100% 1,122 100% 1,365 100% 1,379 100% 1,327 100% 37%
Table 3.15. City College/ECC Annual Awards Conferred by Ethnicity
Source: SDCCD Information SystemNote 1. No Certificates of 60 or More Units were awarded.Note 2. Only state approved certificates are included.
SDCCD Office of Institutional Research and Planning 51
City College/ECC Fact Book 2017_______________________________

50 and >40 - 4930 - 3925 - 2918 - 24
50%
40%
30%
20%
10%
0%
2012-13 2013-14 2014-15 2015-16 2016-17
50 and >40 - 4930 - 3925 - 2918 - 24
50%
40%
30%
20%
10%
0%
2012-13 2013-14 2014-15 2015-16 2016-17
Annual Awards Conferred by Age: Over half (51%) of the total number of associate degrees awarded between 2012/13 and 2016/17 were to students between ages 25 and 39 years old, and approximately one third (35%) were awarded to students between ages 18 and 24. Students between ages 30 and 39 were overrepresented in the share of associate degrees received at City College/ECC when compared to the same age group within all colleges in the District, while students between ages 18 and 24 were underrepresented when compared to the same age group within all colleges in the District.
Figure 3.16.1. City College/ECC Annual AA/AS Degrees by Age
Figure 3.16.2. City College/ECC Annual Certificates 30 to 59 Units by Age
SDCCD Office of Institutional Research and Planning 52
City College/ECC Fact Book 2017_______________________________

50 and >40 - 4930 - 3925 - 2918 - 24
50%
40%
30%
20%
10%
0%
2012-13 2013-14 2014-15 2015-16 2016-17
Figure 3.16.3. City College/ECC Annual Certificates 29 or Fewer Units by Age
SDCCD Office of Institutional Research and Planning 53
City College/ECC Fact Book 2017_______________________________

All Colleges Average 12/13-16/17
To
26%23%25%14%12%100%100%
All Colleges Average 12/13-16/17
27%26%26%12%9%100%
All Colleges Average 12/13-16/17
45%26%19%6%4%100%
College Average 12/13-16/17
T
T
TTo
35%28%23%9%6%100%23%21%24%17%15%100%19%26%27%14%14%100%100%
Awards Age Group2012-13
% of Award
20122013-14
% of Award
20132014-15
% of Award 20
2015-16% of Award
20152016-17
% of Award
2016
% Change 12/13-16/17
AA/AS Degree 18 - 2425 - 2930 - 3940 - 4950 and >
TotalCertificate 30 to 59 Units
18 - 2425 - 2930 - 3940 - 4950 and >
TotalCertificate 29 or Fewer Units
18 - 2425 - 2930 - 3940 - 4950 and >
Total
213 34% 200 30% 280 33% 303 37% 354 40% 66%158 25% 189 28% 244 29% 223 27% 260 29% 65%154 25% 169 25% 201 23% 184 23% 174 19% 13%59 9% 66 10% 86 10% 56 7% 65 7% 10%42 7% 49 7% 45 5% 48 6% 41 5% -2%626 100% 673 100% 856 100% 814 100% 894 100% 43%35 22% 39 18% 53 22% 56 23% 55 29% 57%19 12% 52 24% 42 17% 57 23% 51 27% 168%40 25% 51 24% 72 30% 50 20% 44 23% 10%27 17% 41 19% 43 18% 42 17% 26 14% -4%37 23% 34 16% 32 13% 39 16% 13 7% -65%158 100% 217 100% 242 100% 244 100% 189 100% 20%30 16% 39 17% 49 18% 64 20% 59 24% 97%31 17% 65 28% 73 27% 89 28% 65 27% 110%53 29% 58 25% 75 28% 89 28% 61 25% 15%32 17% 37 16% 37 14% 38 12% 28 11% -13%39 21% 33 14% 33 12% 41 13% 31 13% -21%185 100% 232 100% 267 100% 321 100% 244 100% 32%
Grand Total 969 100% 1,122 100% 1,365 100% 1,379 100% 1,327 100% 37%
Table 3.16. City College/ECC Annual Awards Conferred by Age
Source: SDCCD Information SystemNote 1. No Certificates of 60 or More Units were awarded.Note 2. Only state approved certificates are included.
SDCCD Office of Institutional Research and Planning 54
City College/ECC Fact Book 2017_______________________________

970847
752 779849
2015-162014-152013-142012-132011-12
Total2011-12 2012-13 2013-14 2014-15 2015-16
% Change 11/12-15/16
Total 970 847 752 779 849 -12%
The annual transfer volume for City College decreased 12%, from 970 in 2011/12 to 849 in 2015/16.Annual Transfer Volume:
Figure 3.17. City College Overall Annual Transfers
Table 3.17. City College Overall Annual Transfers
Source: National Student Clearinghouse
SDCCD Office of Institutional Research and Planning 55
City College/ECC Fact Book 2017_______________________________

MaleFemale
70%
60%
50%
40%
30%
20%
10%
0%
2011-12 2012-13 2013-14 2014-15 2015-16
All Colleges Average 11/12-15/16
51%49%100%
Gender2011-12
2011-12 2012-13
2012-13 2013-14
2013-14 2014-15
2014-15 2015-16
2015-16
% Change 11/12-15/16
College Average 11/12-15/16
FemaleMaleTotal
534 55% 446 53% 420 56% 406 52% 455 54% -15% 54%436 45% 401 47% 332 44% 373 48% 394 46% -10% 46%970 100% 847 100% 752 100% 779 100% 849 100% -12% 100%
Figure 3.18. City College Annual Transfers by Gender
Table 3.18. City College Annual Transfers by Gender
Source: National Student Clearinghouse
Between 2011/12 and 2015/16, female students had a higher transfer volume, on average, compared to their male student counterpart (54% & 46%, respectively). The transfer volume decreased 15% for female students and 10% for male students between 2011/12 and 2015/16.
Annual Transfer Volume by Gender:
SDCCD Office of Institutional Research and Planning 56
City College/ECC Fact Book 2017_______________________________

UnreportedOtherWhiteLatinoFilipinoAsian/Pacific Islander
American IndianAfrican American
50%
40%
30%
20%
10%
0%
2011-12 2012-13 2013-14 2014-15 2015-16
All Colleges Average 11/12-15/16
7%0%12%5%25%41%6%4%100%
Ethnicity12011-12
2011-12 2012-13
2012-13 2013-14
2013-14 2014-15
2014-15 2015-16
2015-16
% Change 11/12-15/16
College Average 11/12-15/16
African AmericanAmerican IndianAsian/Pacific IslanderFilipinoLatinoWhiteOtherUnreportedTotal
146 15% 108 13% 72 10% 91 12% 97 11% -34% 12%10 1% 7 1% 5 1% 2 0% 2 0% -80% 1%53 5% 37 4% 44 6% 24 3% 50 6% -6% 5%28 3% 26 3% 23 3% 29 4% 35 4% 25% 3%300 31% 282 33% 291 39% 304 39% 366 43% 22% 37%334 34% 304 36% 231 31% 255 33% 250 29% -25% 33%43 4% 42 5% 41 5% 44 6% 40 5% -7% 5%56 6% 41 5% 45 6% 30 4% 9 1% -84% 4%970 100% 847 100% 752 100% 779 100% 849 100% -12% 100%
Source: National Student Clearinghouse
Table 3.19. City College Annual Transfers by Ethnicity
Figure 3.19. City College Annual Transfers by Ethnicity
Among those students who transferred from City College, 37% were Latino students, on average, and 33% were White students. African American students accounted for more than one tenth of the transfers (12%). Transfer volume decreased for almost all ethnic groups, with the exception of Filipino and Latino students which increased (25% & 22%, respectively) between 2011/12 and 2015/16.
Annual Transfer Volume by Ethnicity:
SDCCD Office of Institutional Research and Planning 57
City College/ECC Fact Book 2017_______________________________

g
50 and >40 - 4930 - 3925 - 2918 - 24Under 18
50%
40%
30%
20%
10%
0%
2011-12 2012-13 2013-14 2014-15 2015-16
All Colleges Average 11/12-15/16
0%55%26%15%3%1%100%
Age_Grp2011-12
2011-12 2012-13
2012-13 2013-14
2013-14 2014-15
2014-15 2015-16
2015-16
% Change 11/12-15/16
College Average 11/12-15/16
Under 1818 - 2425 - 2930 - 3940 - 4950 and >Total
3 0% 2 0% 0 0% 0 0% 0 0% -100% 0%348 36% 317 37% 324 43% 287 37% 366 43% 5% 39%304 31% 258 30% 216 29% 261 34% 250 29% -18% 31%230 24% 197 23% 155 21% 176 23% 168 20% -27% 22%60 6% 49 6% 41 5% 39 5% 44 5% -27% 6%25 3% 24 3% 16 2% 16 2% 21 2% -16% 2%970 100% 847 100% 752 100% 779 100% 849 100% -12% 100%
Source: National Student Clearinghouse
Table 3.20. City College Annual Transfers by Age
Figure 3.20. City College Annual Transfers by Age
The age groups with the highest transfer volume, on average, were students between ages 18 and 24 (39%), students between ages 25 and 29 (31%), and students between ages 30 and 39 (22%). All age groups showed a decrease in transfer volume, with the exception of students between ages 18 and 24 which showed an increase (5%) between 2011/12 and 2015/16.
Annual Transfer Volume by Age:
SDCCD Office of Institutional Research and Planning 58
City College/ECC Fact Book 2017_______________________________

Out-of-StatePrivate (In-State)UCCSU
60%
50%
40%
30%
20%
10%
0%
2011-12 2012-13 2013-14 2014-15 2015-16
All Colleges Average 11/12-15/16
42%16%18%23%100%
Coll_Type2011-12
2011-12 2012-13
2012-13 2013-14
2013-14 2014-15
2014-15 2015-16
2015-16
% Change 11/12-15/16
College Average 11/12-15/16
CSUUCPrivate (In-State)Out-of-StateTotal
326 34% 340 40% 349 46% 357 46% 421 50% 29% 43%105 11% 88 10% 67 9% 79 10% 91 11% -13% 10%286 29% 191 23% 143 19% 143 18% 130 15% -55% 21%253 26% 228 27% 193 26% 200 26% 207 24% -18% 26%970 100% 847 100% 752 100% 779 100% 849 100% -12% 100%
Table 3.21. City College Annual Transfers by CSU/UC/Private (In-State)/Out-of-State
Source: National Student ClearinghouseNote. Out-of-State includes both public and private 4-year institutions.
Figure 3.21. City College Annual Transfers by CSU/UC/Private (In-State)/Out-of-State
On average, almost one third of the City College transfer volume was students who transferred into the California State University system (CSU; 43%), followed by out‐of‐state institutions (26%), in‐state private institutions (21%), and then the University of California system (UC; 10%). Between 2011/12 and 2015/16, City College transfer volume for all institutions decreased, with the exception of transfers to the CSU system.
Annual Transfer Volume by CSU/UC/Private (In‐State)/Out‐of‐State:
SDCCD Office of Institutional Research and Planning 59
City College/ECC Fact Book 2017_______________________________

2015-162014-152013-142012-132011-12
90%80%
70%60%50%40%30%20%10%
0%
CSU UC
All Colleges Average 11/12-15/16
73%27%100%
UCCSU2011-12
2011-12 2012-13
2012-13 2013-14
2013-14 2014-15
2014-15 2015-16
2015-16
% Change 11/12-15/16
College Average 11/12-15/16
CSUUCTotal
326 76% 340 79% 349 84% 357 82% 421 82% 29% 81%105 24% 88 21% 67 16% 79 18% 91 18% -13% 19%431 100% 428 100% 416 100% 436 100% 512 100% 19% 100%
Figure 3.22. City College Annual Transfers by CSU/UC
Table 3.22. City College Annual Transfers by CSU/UC
Source: National Student Clearinghouse
Of the total City College transfer volume between 2011/12 and 2015/16, 53% transferred into either the California State University (CSU) or University of California (UC) systems, on average (43% & 10%, respectively; see Table 3.21). Of the total number of students who transferred to CSU or UC systems, the majority of students went to CSU (81%) and almost one fifth went to UC (19%), on average. There was a increased trend in the number of students who transferred from City College to the CSU system (29%) and a decrease in students who transferred to the UC system (13%) between 2011/12 and 2015/16.
Annual Transfer Volume by CSU/UC:
SDCCD Office of Institutional Research and Planning 60
City College/ECC Fact Book 2017_______________________________

2015-162014-152013-142012-132011-12
90%
80%
70%
60%
50%
40%
30%
20%
10%
0%
Private Public
All Colleges Average 11/12-15/16
29%71%100%
PublicPrivate 2011-12
2011-12 2012-13
2012-13 2013-14
2013-14 2014-15
2014-15 2015-16
2015-16
% Change 11/12-15/16
College Average 11/12-15/16
PrivatePublicTotal
428 44% 327 39% 239 32% 253 32% 214 25% -50% 35%542 56% 520 61% 513 68% 526 68% 635 75% 17% 65%970 100% 847 100% 752 100% 779 100% 849 100% -12% 100%
Of those students who transferred from City College, on average, 35% transferred to a private institution and 65% transferred to a public institution. Transfers to private institutions displayed a 50% decrease, while transfers to public institutions displayed a 17% increase between 2011/12 and 2015/16.
Figure 3.23. City College Annual Transfers by Institution Type
Table 3.23. City College Annual Transfers by Institution Type
Source: National Student ClearinghouseNote. Public and Private includes both Out-of-State and In-State 4-year institutions.
Annual Transfer Volume by Institution Type:
SDCCD Office of Institutional Research and Planning 61
City College/ECC Fact Book 2017_______________________________

Section IV Productivity and Efficiency
SDCCD Office of Institutional Research and Planning 62

1) FTES. The first measure reported in this section is a measure of productivity. FTES is the total number of full‐time equivalentstudents enrolled. Includes non‐residents. Excludes apprenticeship classes, students who enroll after census, apprenticeship students enrolled in a non‐apprenticeship class, ineligible course repetitions, non‐state supported classes, and cancelled classes. F‐Factor is included when reported annually.
2) Enrollments. The second measure in this section of the report is also a measure of productivity. Enrollments are the number ofseats enrolled, or duplicated headcount, based on official census. Drops, never attends, cancelled, and tutoring classes are excluded.
3) Fill Rates. The third measure reported in this section is a measure of efficiency. Fill rates are the enrollment divided by thecourse enrollment capacity as set in the curriculum outline. Apprenticeship, cancelled, tutoring classes, and classes with a capacity of 0 or 1 are excluded. Positive attendance credit sections PHYE 153W‐153Y and EXSC 124A‐124D series are excluded from City College fill rates.
4) Load. The fourth measure reported in this section is a measure of efficiency. Load is the ratio of Weekly Student ContactHours (WSCH) to Full‐time Equivalent Faculty (FTEF). Tutoring, positive attendance, and cancelled sections are excluded.
This section of the Fact Book contains information on productivity and efficiency measures. The following describes in detail each of the measures:
City College/ECC Fact Book 2017_______________________________
SDCCD Office of Institutional Research and Planning 63

City College/ECC resident credit FTES increased between 2012/13 and 2015/16 (1,059 additional FTES), and then decreased between 2015/16 and 2016/17 (240 fewer FTES), yielding a 9% net increase over the five years. Resident noncredit FTES increased between 2012/13 and 2014/15, and decreased from 2015/16 to 2016/17, which yielded a 9% increase over the five years.
9,60010,389 10,415 10,659 10,419
2016-172015-162014-152013-142012-13
Credit Noncredit F-Factor
Annual Resident FTES:
2012-13 2013-14 2014-15 2015-16 2016-17CreditNoncreditF-FactorTotal
9,600.29 10,388.88 10,415.31 10,659.44 10,419.49
54.22 57.57 70.83 62.40 59.07
13.99 10.20 9.84 10.82 7.67
9,668.50 10,456.65 10,495.98 10,732.66 10,486.23
Figure 4.1.1 City College/ECC Annual Resident FTES
Table 4.1.1 City College/ECC Annual Resident FTES
Source: SDCCD Information System
SDCCD Office of Institutional Research and Planning 64
City College/ECC Fact Book 2017_______________________________
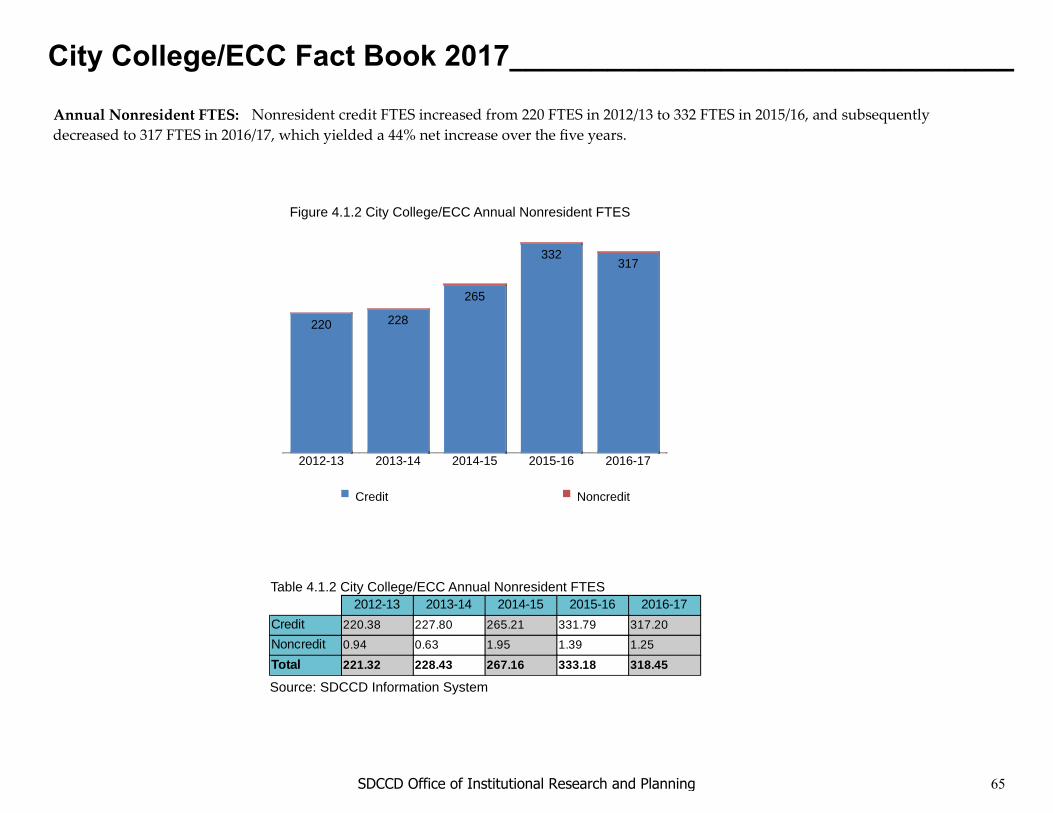
220 228
265
332317
2016-172015-162014-152013-142012-13
Credit Noncredit
2012-13 2013-14 2014-15 2015-16 2016-17CreditNoncreditTotal
220.38 227.80 265.21 331.79 317.20
0.94 0.63 1.95 1.39 1.25
221.32 228.43 267.16 333.18 318.45
Annual Nonresident FTES:
Figure 4.1.2 City College/ECC Annual Nonresident FTES
Table 4.1.2 City College/ECC Annual Nonresident FTES
Source: SDCCD Information System
Nonresident credit FTES increased from 220 FTES in 2012/13 to 332 FTES in 2015/16, and subsequently decreased to 317 FTES in 2016/17, which yielded a 44% net increase over the five years.
SDCCD Office of Institutional Research and Planning 65
City College/ECC Fact Book 2017_______________________________

Resident and nonresident overall FTES (including F‐factor) increased at City College/ECC from 9,890 FTES in 2012/13 to 11,066 FTES in 2015/16, and subsequently decreased to 10,805 FTES in 2016/17, yielding a 9% net increase over the five years.
9,82110,617 10,681 10,991 10,737
2016-172015-162014-152013-142012-13
Credit Noncredit F-Factor
2012-13 2013-14 2014-15 2015-16 2016-17CreditNoncreditF-FactorTotal
9,820.67 10,616.68 10,680.52 10,991.23 10,736.69
55.16 58.20 72.78 63.79 60.32
13.99 10.20 9.84 10.82 7.67
9,889.82 10,685.08 10,763.14 11,065.84 10,804.68
Annual Overall FTES:
Table 4.1.3 City College/ECC Resident & Nonresident Annual Overall FTES
Source: SDCCD Information System
Figure 4.1.3 City College/ECC Resident & Nonresident Annual Overall FTES
SDCCD Office of Institutional Research and Planning 66
City College/ECC Fact Book 2017_______________________________

From Summer 2012 to Summer 2013, City College/ECC enrollment remained about the same; however, enrollment began to increase starting in Summer 2014, yielding an 18% net increase from Summer 2014 to Summer 2016 (compared to a 31% increase for all colleges in the District). Overall City College/ECC enrollment decreased 3% between Fall 2012 and Fall 2016, and 6% between Spring 2013 and Spring 2017, while enrollment for all colleges in the District increased 1% and decreased 4%, respectively, during the same periods.
Enrollments:
Figure 4.2.2 City College/ECC Enrollments (Fall)
Figure 4.2.4. City College/ECC Enrollments (Spring)
31,780 6,476
33,095 5,686
33,248 5,218
33,673 5,205
33,598 5,823Fall 2012
Fall 2013
Fall 2014
Fall 2015
Fall 2016
On Campus Online
2017
Figure 4.2.3 City College/ECC Enrollments (Intersession)
On Campus Online
29,386 6,538
31,987 6,131
32,644 5,304
32,999 5,341
33,100 5,158Spring 2013
Spring 2014
Spring 2015
Spring 2016
Spring 2017
On Campus Online
Figure 4.2.1 City College/ECC Enrollments (Summer)
6,971 3,621
7,352 2,344
6,836 2,169
2013Summer
2014Summer
2015Summer
2016
On Campus Online
Summer 1,450 253
304Summer2012 1,741
Intersession440 733
City College/ECC Fact Book 2017_______________________________
SDCCD Office of Institutional Research and Planning 67

Between 2012/13 and 2016/17, fill rates decreased for fall (91% to 81%, respectively), and spring (87% to 76%, respectively) terms. On average, fill rates for summer on campus (75%) were slightly lower than the online (77%) mode of instruction, while fill rates were slightly higher for the on campus mode of instruction in the fall and spring terms (84% & 81%, respectively) when compared to the online mode of instruction (82% & 79%, respectively). On average, City College/ECC summer fill rates were comparable to those for all colleges in the District (76% & 75%, respectively), and fall and spring fill rates at City College/ECC were lower (84% & 81%, respectively) than those for all colleges in the District (87% & 83%, respectively).
Fill Rates:
Figure 4.3.1. City College/ECC Fill Rates (Summer) Figure 4.3.2. City College/ECC Fill Rates (Fall)
Figure 4.3.4. City College/ECC Fill Rates (Spring)
44%
75% 76% 79%70%
76%
Summer 2016
Summer 2015
Summer 2014
Summer 2013
Summer 2012
On Campus Online Overall Fill Rate
92%86% 86%84% 82%78% 81%80% 80%84%
Fall 2016Fall 2015Fall 2014Fall 2013Fall 2012
On Campus Online Overall Fill Rate
88%83% 81%80% 81%80% 78%76% 76%79%
Spring 2017
Spring 2016
Spring 2015
Spring 2014
Spring 2013
On Campus Online Overall Fill Rate
72%
Intersession 2017
Figure 4.3.3 City College/ECC Fill Rates (Intersession)
On Campus Online Overall Fill Rate
75%
80%
City College/ECC Fact Book 2017_______________________________
SDCCD Office of Institutional Research and Planning 68

All Colleges TotalEnrollment Capacity Fill Rate
Intersession 2017Total
6,294 8,886 71%6,294 8,886 71%
Term_RModality On Campus Online City College Total
Enrollment Capacity Fill Rate Enrollment Capacity Fill Rate Enrollment Capacity Fill RateIntersession 2017Total\5-Yr Avg
440 610 72% 733 972 75% 1,173 1,582 74%440 610 72% 733 972 75% 1,173 1,582 74%
Source: SDCCD Information System
All Colleges TotalEnrollment Capacity Fill Rate
Summer 2012Summer 2013Summer 2014Summer 2015Summer 2016Total
3,587 2,860 70%3,105 2,061 81%26,433 33,362 79%30,352 39,663 77%34,537 47,545 71%98,014 125,491 75%
Term_RModality On Campus Online City College Total
Enrollment Capacity Fill Rate Enrollment Capacity Fill Rate Enrollment Capacity Fill RateSummer 2012Summer 2013Summer 2014Summer 2015Summer 2016Total\5-Yr Avg
1,741 0 --- 304 0 --- 2,045 0 ---1,450 33 44% 253 0 --- 1,703 33 44%6,836 7,785 80% 2,169 2,530 75% 9,005 10,315 79%7,352 9,320 76% 2,344 2,985 79% 9,696 12,305 77%6,971 9,469 70% 3,621 4,745 76% 10,592 14,214 72%24,350 26,607 75% 8,691 10,260 77% 33,041 36,867 76%
Table 4.3. City College/ECC Enrollments and Fill Rates
Note. Using the figures in the tables will give approximate fill rates since additional parameters are used to calculate the fill rate.
All Colleges TotalEnrollment Capacity Fill Rate
Fall 2012Fall 2013Fall 2014Fall 2015Fall 2016Total
125,930 131,235 94%126,842 139,548 89%123,613 141,179 86%125,633 145,809 85%126,954 150,779 83%628,972 708,550 87%
Term_RModality On Campus Online City College Total
Enrollment Capacity Fill Rate Enrollment Capacity Fill Rate Enrollment Capacity Fill RateFall 2012Fall 2013Fall 2014Fall 2015Fall 2016Total\5-Yr Avg
33,598 36,200 92% 5,823 6,754 86% 39,421 42,954 91%33,673 38,784 86% 5,205 6,219 84% 38,878 45,003 86%33,248 39,774 82% 5,218 6,662 78% 38,466 46,436 82%33,095 39,731 81% 5,686 7,144 80% 38,781 46,875 81%31,780 38,494 80% 6,476 7,741 84% 38,256 46,235 81%165,394 192,983 84% 28,408 34,520 82% 193,802 227,503 84%
All Colleges TotalEnrollment Capacity Fill Rate
Spring 2013Spring 2014Spring 2015Spring 2016Spring 2017Total
127,437 139,710 89%124,312 142,972 85%125,319 148,328 83%125,241 154,360 80%122,916 153,450 78%625,225 738,820 83%
Term_RModality On Campus Online City College Total
Enrollment Capacity Fill Rate Enrollment Capacity Fill Rate Enrollment Capacity Fill RateSpring 2013Spring 2014Spring 2015Spring 2016Spring 2017Total\5-Yr Avg
33,100 37,413 88% 5,158 6,198 83% 38,258 43,611 87%32,999 40,105 81% 5,341 6,706 80% 38,340 46,811 81%32,644 39,432 81% 5,304 6,618 80% 37,948 46,050 81%31,987 39,664 78% 6,131 8,090 76% 38,118 47,754 78%29,386 37,716 76% 6,538 8,285 79% 35,924 46,001 76%160,116 194,330 81% 28,472 35,897 79% 188,588 230,227 81%
City College/ECC Fact Book 2017_______________________________
SDCCD Office of Institutional Research and Planning 69

The fall load values at City College/ECC decreased, from 577 in Fall 2012 to 501 in Fall 2016, and spring displayed a similar trend, declining from 552 in Spring 2013 to 476 in Spring 2017. In general, City College/ECC load values varied term to term when compared to the load values for all the colleges in the District. The statewide benchmark for Load is 525 for a 17.5 week semester. SDCCD has set an internal benchmark of 557, which is commensurate to its 16.5 week semester.
501
523
528
555
577Fall 2012
Fall 2013
Fall 2014
Fall 2015
Fall 2016 476
494
515
524
552Spring 2013
Spring 2014
Spring 2015
Spring 2016
Spring 2017
Load:
Table 4.4. City College/ECC Load
Source: SDCCD Information System
Figure 4.4.1. City College/ECC Load (Fall) Figure 4.4.2. City College/ECC Load (Spring)
All Colleges Load
582556530516499560525508486470
Term_RCity College
Load
Fall 2012Fall 2013Fall 2014Fall 2015Fall 2016Spring 2013Spring 2014Spring 2015Spring 2016Spring 2017
577555528523501552524515494476
City College/ECC Fact Book 2017_______________________________
SDCCD Office of Institutional Research and Planning 70
Section V Human Resources
SDCCD Office of Institutional Research and Planning 71
City College/ECC Fact Book 2017_______________________________
This section of the Fact Book contains information on the number and classification of employees during the Fall 2016 semester. The information is reported as follows:
1) Employment Type2) Ethnicity3) Gender
SDCCD Office of Institutional Research and Planning 72
City College/ECC Fact Book 2017_______________________________

Fall 2016 Employee Breakdown: There were a total of 2,110 employees working at City College/ECC during Fall 2016. At City College/ECC, adjunct faculty constituted over half (53%) of the total employee population, followed by non‐academic hourly employees (32%), contract faculty (8%), and classified staff (5%). Supervisory staff and management constituted the smallest proportions of City College/ECC employees (1% each).
The ethnic breakdown showed that White employees constituted 41% of the total employee population, followed by Latino employees (26%), and African American employees (11%). Among classified staff, Latino employees constituted 27% of the employee demographic breakdown. White employees comprised 28% of the classified staff positions, and made up 53% of the adjunct teaching faculty positions. White employees constituted 29% of the management positions and 36% of the supervisory positions. Latino employees constituted 29% of the management positions and 27% of the supervisory positions. African American employees constituted 6% of the management positions and 9% of the supervisory positions.
Classified Staff5%
Non-Academic Hourly32%
Contract Faculty
8%
Adjunct Faculty
53%
Management1%
Supervisory Staff1%
Figure 5.1. City College/ECC Fall 2016 Employees by Employment Type
African American
11%
American Indian/Alaska
Native1%
Asian9%
Latino26%
Native Hawaiian or Other Pacific
Islander0%
White41%
Two or More Races
2% Unknown10%
Figure 5.2. City College/ECC Fall 2016 Employees by Ethnicity
SDCCD Office of Institutional Research and Planning 73
City College/ECC Fact Book 2017_______________________________

Table 5.1. City College/ECC Fall 2016 Employees by Ethnicity
Total
Total Employees: 240 11% 19 1% 182 9% 549 26% 3 0% 866 41% 32 2% 219 10% 2,110
Female: 144 12% 13 1% 112 9% 333 27% 1 0% 492 40% 16 1% 127 10% 1,238
Male: 96 11% 6 1% 70 8% 216 25% 2 0% 374 43% 16 2% 92 11% 872
Classified Staff : 18 16% 0 0% 15 13% 31 27% 1 1% 32 28% 3 3% 14 12% 114
Female: 10 14% 0 0% 9 12% 24 33% 1 1% 18 25% 1 1% 10 14% 73
Male: 8 20% 0 0% 6 15% 7 17% 0 0% 14 34% 2 5% 4 10% 41
Non-Academic Hourly: 103 15% 7 1% 55 8% 287 43% 2 0% 145 22% 7 1% 61 9% 667
Female: 62 16% 4 1% 37 9% 184 46% 0 0% 75 19% 4 1% 32 8% 398Male: 41 15% 3 1% 18 7% 103 38% 2 1% 70 26% 3 1% 29 11% 269
Contract Faculty: 16 9% 0 0% 14 8% 31 18% 0 0% 85 50% 5 3% 19 11% 170
Female: 10 10% 0 0% 10 10% 14 13% 0 0% 56 53% 3 3% 12 11% 105
Male: 6 9% 0 0% 4 6% 17 26% 0 0% 29 45% 2 3% 7 11% 65
Adjunct Faculty: 100 9% 11 1% 95 8% 189 17% 0 0% 591 53% 17 2% 117 10% 1,120
Female: 59 9% 9 1% 54 9% 104 16% 0 0% 334 53% 8 1% 67 11% 635
Male: 41 8% 2 0% 41 8% 85 18% 0 0% 257 53% 9 2% 50 10% 485
Management: 1 6% 0 0% 1 6% 5 29% 0 0% 5 29% 0 0% 5 29% 17
Female: 1 9% 0 0% 1 9% 2 18% 0 0% 3 27% 0 0% 4 36% 11
Male: 0 0% 0 0% 0 0% 3 50% 0 0% 2 33% 0 0% 1 17% 6
Supervisory Staff: 2 9% 1 5% 2 9% 6 27% 0 0% 8 36% 0 0% 3 14% 22
Female: 2 13% 0 0% 1 6% 5 31% 0 0% 6 38% 0 0% 2 13% 16
Male: 0 0% 1 17% 1 17% 1 17% 0 0% 2 33% 0 0% 1 17% 6Source: SDCCD Information System
Native Hawaiian or Other Pacific
Islander
Two or More Races
UnreportedAfrican
American
American Indian/ Alaska
NativeAsian Latino White
Table 5.2. City College/ECC Employees by Gender and Employment Status
59% 16%
41% 84%Source: SDCCD Information System
Hourly/Adjunct
Gender Employment StatusFemale Full-Time/Contract
Male
SDCCD Office of Institutional Research and Planning 74
City College/ECC Fact Book 2017_______________________________