Embed Size (px)
Citation preview
1 UNCTAD Handbook of Statistics 2017 - Economic trends
Fact sheet #9: Foreign direct investment
9 and more
5 to less than 9
2 to less than 5
0 to less than 2
Less than 0
No data
Note: Excluding financial centres in the Caribbean (see the note to UNCTAD Handbook of Statistics 2017, table 3.3.1).
Foreign direct investment (FDI) is defined as an investment reflecting a lasting interest and control by a foreign direct investor, resident in one economy, in an enterprise resident in another economy (foreign affiliate).
FDI inflows comprise capital provided by a foreign direct investor to a foreign affiliate, or capital received by a foreign direct investor from a foreign affiliate. FDI outflows represent the same flows from the perspective of the other economy.
FDI flows are presented on a net basis, i.e. as credits less debits. Thus in cases ofreverse investment or disinvestment, FDImay be negative.
FDI stock is the value of capital and reserves attributable to a non-resident parent enterprise, plus the net indebtedness of foreign affiliates to parent enterprises (UNCTAD, 2017b).
Concepts and definitions
Trends and global patterns of inflows
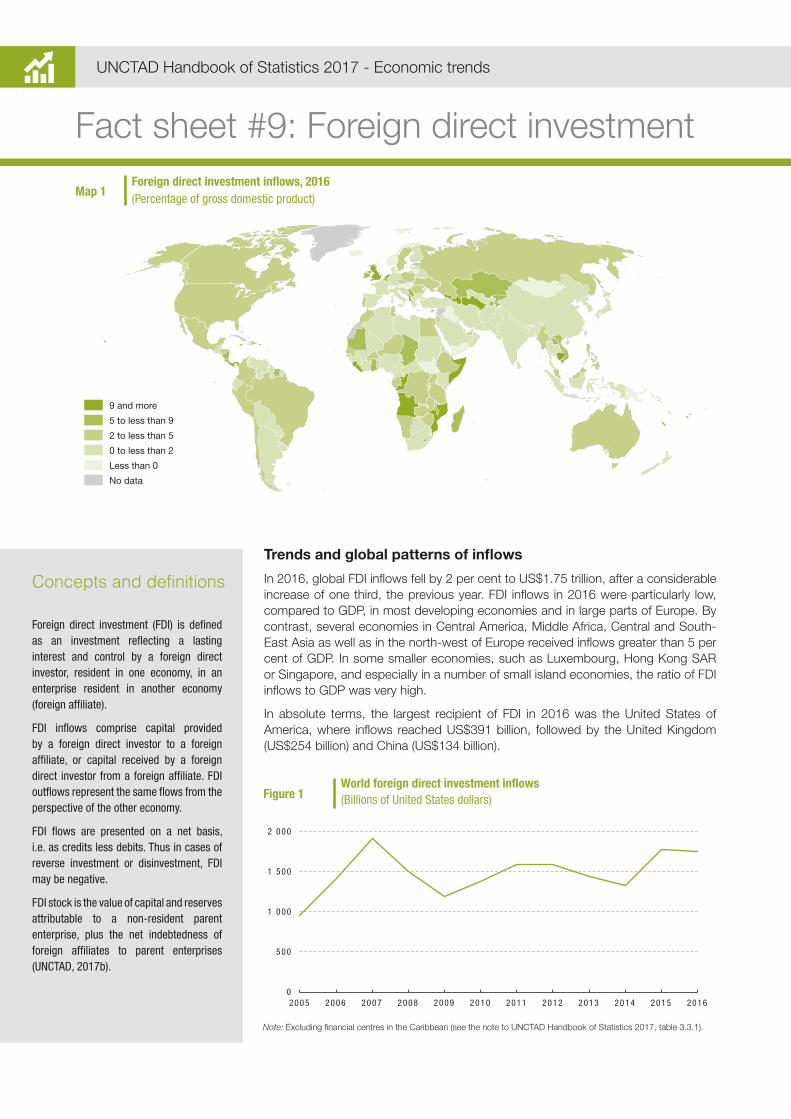
In 2016, global FDI inflows fell by 2 per cent to US$1.75 trillion, after a considerable increase of one third, the previous year. FDI inflows in 2016 were particularly low, compared to GDP, in most developing economies and in large parts of Europe. By contrast, several economies in Central America, Middle Africa, Central and South-East Asia as well as in the north-west of Europe received inflows greater than 5 per cent of GDP. In some smaller economies, such as Luxembourg, Hong Kong SAR or Singapore, and especially in a number of small island economies, the ratio of FDI inflows to GDP was very high.
In absolute terms, the largest recipient of FDI in 2016 was the United States of America, where inflows reached US$391 billion, followed by the United Kingdom (US$254 billion) and China (US$134 billion).
0
5 0 0
1 0 0 0
1 5 0 0
2 0 0 0
2 0 0 5 2 0 0 6 2 0 0 7 2 0 0 8 2 0 0 9 2 0 1 0 2 0 1 1 2 0 1 2 2 0 1 3 2 0 1 4 2 0 1 5 2 0 1 6
Map 1 Foreign direct investment inflows, 2016(Percentage of gross domestic product)
Figure 1 World foreign direct investment inflows (Billions of United States dollars)

UNCTAD Handbook of Statistics 2017 - Economic trends 1
Note: Excluding financial centres in the Caribbean (see note, UNCTAD Handbook of Statistics 2017, table 3.3.1).
Note: Excluding financial centres in the Caribbean (see note, UNCTAD Handbook of Statistics 2017, table 3.3.1).
Inflows and outflows by economic group
In developing economies, total FDI inflows were larger than total FDI outflows, with inflows exceeding outflows by two thirds, more or less the same rate as in 2011. The outflows from American developing economies were negligible in 2016. In transition economies, inflows were almost three times as high as outflows, mainly as a result of a considerable reduction of outflows over recent years. By contrast, for developed economies FDI outflows exceeded inflows.
Origins and destinations of foreign direct investment
In 2016, developing economies attracted one third of global FDI inflows. This share had been over 50 per cent in 2014 but has shrunk over the last two years. In 2016, one quarter of global FDI was directed to developing economies in Asia and Oceania and less than 10 per cent to developing economies in Africa and America, each. Looking at the origins of global FDI, around 70 per cent were initiated by investors from developed economies. Out of these, 35 per cent originated from Europe and 25 per cent from Northern America.1
1 For further analyses on that topic, see UNCTAD (2017b).
0 2 0 0 4 0 0 6 0 0 8 0 0 1 0 0 0 1 2 0 0
De v e l o p i n g e c o n o m i e s
A f r i c a
A m e r i ca
A s i a a n d Oc e a n i a
T r a n s i t i o n e c o n o m i es
De v e l o p e d e c o n o m i e s
Dev
elop
ing
econ
omie
s
I n � o w sO u t �ow s
0
2 0
4 0
6 0
8 0
2 0 0 5 2 0 1 0 2 0 1 5
A m e r i ca
A s i a a n d O c e a n i a
I n fl o w s to d e v e l o p i n g e c o n o m i e s
A f r i c a0
2 0
4 0
6 0
8 0
2 0 0 5 2 0 1 0 2 0 1 5
A m e r i ca
A s i a a n d O c e a n i a
Outflow s f rom d e v e l o p e d e c o n o m i es
E u r o p e
Global FDI down by 2%in 2016
The United Statesof Americawas host to FDIof US$391 billion
Developingeconomies receivedtwo thirds moreFDI than they initiated
Declining importance of developingeconomies asFDI targets
Figure 2 Foreign direct investment inflows and outflows, 2016 (Billions of United States dollars)
Figure 3 Selected foreign direct investment flows(Percentage of world total)
For references, see UNCTAD Handbook of Statistics 2017, annex 6.4.