Embed Size (px)
Citation preview
J Phys Fitness Sports Med, 10 (5): 243-253 (2021)DOI: 10.7600/jpfsm.10.243
JPFSM: Regular Article
Factors affecting an increase in core body temperature and heat tolerance during hot water immersion
Yuta Masuda1,2, Issei Kato1,2 and Kei Nagashima2*
Received: September 29, 2020 / Accepted: December 23, 2020
Abstract The aim of the present study was to clarify the factors affecting an increase in core body temperature during 40°C water immersion to the subclavian level. Fifteen healthy males were immersed in water for 60 min. Rectal temperature (Trec) and skin temperature (Tsk) at four skin sites were determined. Minute ventilation (V・E) was measured, and metabolic rate was de-termined by indirect calorimetry. Skin blood flow and sweat rate at the forehead were assessed using laser-Doppler flowmetry (%LDFhead) and dew hygrometry (SRhead), respectively. Hot feel-ing was assessed with a visual analog scale. When Trec reached 39°C or participants reported an extremely hot feeling, the experiment was ceased. Eleven participants were unable to complete the protocol (ten participants due to Trec > 39°C; and one due to excessive hot feeling). Trec in-creased with immersion period. Mean Tsk was unchanged from 20 min. V・E and metabolic rate increased with immersion period. %LDFhead and SRhead increased after immersion and remained unchanged from 15 and 30 min, respectively. Change in Trec from the baseline at 15, 30, and 45 min was correlated to cumulative change in metabolic rate from the baseline at 0-15, 0-30, and 0-45 min. No correlations were observed between change in Trec and cumulative changes in V・E, %LDFhead, and SRhead from baseline, hot feeling, body weight and body composition. Water im-mersion at 40°C induced a large difference in the increase of Trec, in which metabolic responses to heat stress may be involved. The relationship between heat tolerance and change in Trec is different among individuals.Keywords : thermoregulation, oxygen consumption, metabolic rate, heat balance, hot feeling
Introduction
Hot water immersion induces a stronger heat load to humans within a shorter time relative to that of hot air, es-pecially when water temperature exceeds 34.5°C and the water level reaches the neck1). During hot water immer-sion, heat loss from the body is limited to that from the head and/or ventilating air2). In addition, when the water temperature surpasses core body temperature, greater heat flux occurs from the water to the core body3). In our pre-vious study4), we also found rapid increases in body tem-perature and hot feeling during a 20-min at 41°C water immersion to the subclavian level. Moreover, the increase in core body temperature was significantly different, rang-ing 0.9°C-2.3°C from the baseline (unpublished data). Al-though the mechanism remains unclear, we speculate that the difference in the heat response resulted in the increase in core body temperature. Body surface area, fat, and muscle layers are factors that
may affect heat flux in an environment with fluctuation of temperature5,6). In addition, body mass per se would affect the rate of the increase in core body temperature when thermal load from the environment is large7). However, it remains unclear if the factors could modulate the increase in core body temperature during hot water immersion even in those with normal anatomical variation. In exercising humans, heat load originates mainly from working muscle. It was reported that an increase in core body temperature during 120-min walking in the heat was significantly different among individuals8). In addition, the difference reflected the cardiopulmonary function of the individuals. Armstrong and Stoppani9) reported that, during exercise, individuals with augmented sweat rate and skin blood flow showed less increase in core body temperature. Corbett et al.10) reported that metabolic rate estimated by indirect calorimetry at a given exercise intensity was decreased in heat-acclimated individuals. These results may suggest that both heat loss and produc-tion processes affect the increase in core body tempera-ture during exercise. However, heat loss processes are *Correspondence: [email protected]
1 Graduate School of Human Sciences, Waseda University, 2-579-15 Mikajima, Tokorozawa, Saitama 359-1192, Japan2 Body Temperature and Fluid Laboratory, Faculty of Human Sciences, Waseda University, 2-579-15 Mikajima, Tokorozawa,
Saitama 359-1192, Japan
244 JPFSM : Masuda Y, et al.
limited to the head during hot water immersion. In addi-tion, it remains unknown if the inter-individual difference in body temperature in resting humans is underpinned by the same mechanisms as those in exercising humans. Ventilation may also affect the increase in core body tem-perature during water immersion, increasing evaporation rate in the airway, although this remains controversial11,12). Heat tolerance is defined as the ability to tolerate high ambient temperatures and comprises various physiologi-cal characteristics13). In general, heat tolerance seems to be determined by the psychological susceptibility to heat during exercise, i.e., exhaustion and/or hot feeling result-ing in the cessation of exercise8). Gonzàlez-Alonso et al.14) proposed that heat tolerance is limited when core body temperature reaches a critically high level, although there is no evidence showing that core body temperature is the factor determining heat tolerance. Moreover, it remains unclear if the increase of core body temperature during hot water immersion is inversely reflected by higher sus-ceptibility to the heat, i.e. heat tolerance. The aim of the present study was to clarify the factors affecting an increase in core body temperature and heat tolerance during 40°C water immersion to the subclavian level. First, we examined if differences in body mass, body surface area, and fat mass could modulate an in-crease in core body temperature in participants with nor-mal anatomical variation. Second, we assessed if heat loss responses (i.e. skin blood flow and sweating at the face and/or ventilation) modulate the increase in core body temperature. Third, we evaluated if the metabolic rate af-fects the increase in core body temperature. Finally, we tested the hypothesis that the increase in core body tem-perature determines hot feeling, which may be a factor determining heat tolerance during water immersion.
Materials and Methods
Participants. Fifteen healthy male volunteers (age, 23.7 ± 2.5 years; height, 172.2 ± 5.5 cm; body weight, 66.1 ± 9.3 kg; values presented as mean ± standard deviation [SD]) participated in this study. Participants were non-smokers without any clinical history of cardiovascular, metabolic, or respiratory disease. Applicants who were obese or lean (body mass index [BMI] > 25 or < 18.5, respectively) were excluded. Their exercise habits ranged from physically active (moderate exercise such as jog-ging, 2-3 times a week) to sedentary. Participants were not involved in any heat acclimation program and/or exer-cise training. Participants were instructed to refrain from heavy exercise and consumption of alcohol and caffeine for 24 h before each experimental trial. The experimental protocol was approved by the Ethical Committee of Hu-man Research, Waseda University (2018-287) and was conducted in accordance with the Declaration of Helsinki. Participants were briefed on the purpose and procedures of the present study and provided written informed con-
sent prior to experimentation.
Experimental protocol. Whole-body fat mass of each participant was assessed using the bio-impedance method (Inbody770; InBody, Cerritos, USA), which was correct-ed by body weight (percent fat mass, % Fat). After mea-surement, participants underwent a graded exercise test to determine peak oxygen uptake (peak V・O2) on a cycle ergometer (Powermax IV; Konami, Yokohama, Japan) in an environmental chamber maintained at an ambient temperature of 20°C and 30% relative humidity (Espec, Tokyo, Japan). The test was started at 40 W with a target cadence of 80 rpm, and intensity was increased by 40 W every 2 minutes until participants were unable to maintain the cadence. Expired gas was collected with a respiratory mask (8930; Hans Rudolph, Shawnee, USA) to determine the minute ventilation (V・E) and fractions of O2 and CO2 with a metabolic analyzer (RM300i; Minato Medical Science, Osaka, Japan). Oxygen uptake rate (V・O2) and carbon dioxide output rate (V・CO2) were calculated as V・E × fractions of O2 and CO2, respectively, and recorded in 30-s intervals. The maximal value of V・O2 during the test was determined as the peak V・O2. At least 1 week after the peak V・O2 test, participants underwent a hot water immersion experiment. On the day of the experiment, participants were instructed to con-sume a light meal (They were instructed to avoid high-carbohydrate and high-fat foods.) with >500 mL water for breakfast. All participants were instructed to come to the laboratory at 10:00 am. After arriving at the labora-tory, participants rested on a chair for approximately 30 min and drank 300 mL of water. Participants then voided and put on a swimsuit, and body weights were recorded. They rested for 45 min in an environmental chamber maintained at an ambient temperature of 33°C and rela-tive humidity of 50%, during which the baseline data were obtained. The temperature is the upper limit of the thermoneutral zone that has been reported, where body temperature is not controlled by metabolic response of nude humans in the air15). Expiratory gas was collected and analyzed in the same manner as that for the peak V・O2 test. Rectal temperature (Trec) was measured with a thermistor probe (401J; Nik-kiso-Therm, Musashino, Japan), and skin temperature at four skin sites (anterior chest [Tchest], forearm [Tarm], thigh [Tthigh], and lower leg [Tleg]) were determined with therm-istor loggers (iButton; Maxim Integrated, Dallas, USA) every 30 s. Heat flux between the water to the body per unit skin area was assessed with a heat flow sensor, which was attached to the anterior chest skin (HFM-EM1; Kyoto Electric, Kyoto, Japan). Heart rates were monitored by electrocardiography (BSM-2401; Nihon Koden, Tokyo, Japan). Skin blood flow at the forehead was assessed by laser-Doppler flowmetry (ALF21; Advance, Tokyo, Japan) at a sampling rate of 1/100 s. Ventilated capsules were placed on the skin surface of the forehead to assess
245JPFSM : Responses to heat during hot water immersion
± 1.3 mL/min/kg body weight. Percent Fat was 17 ± 1%, and BSA was 1.8 ± 0.1 m2.
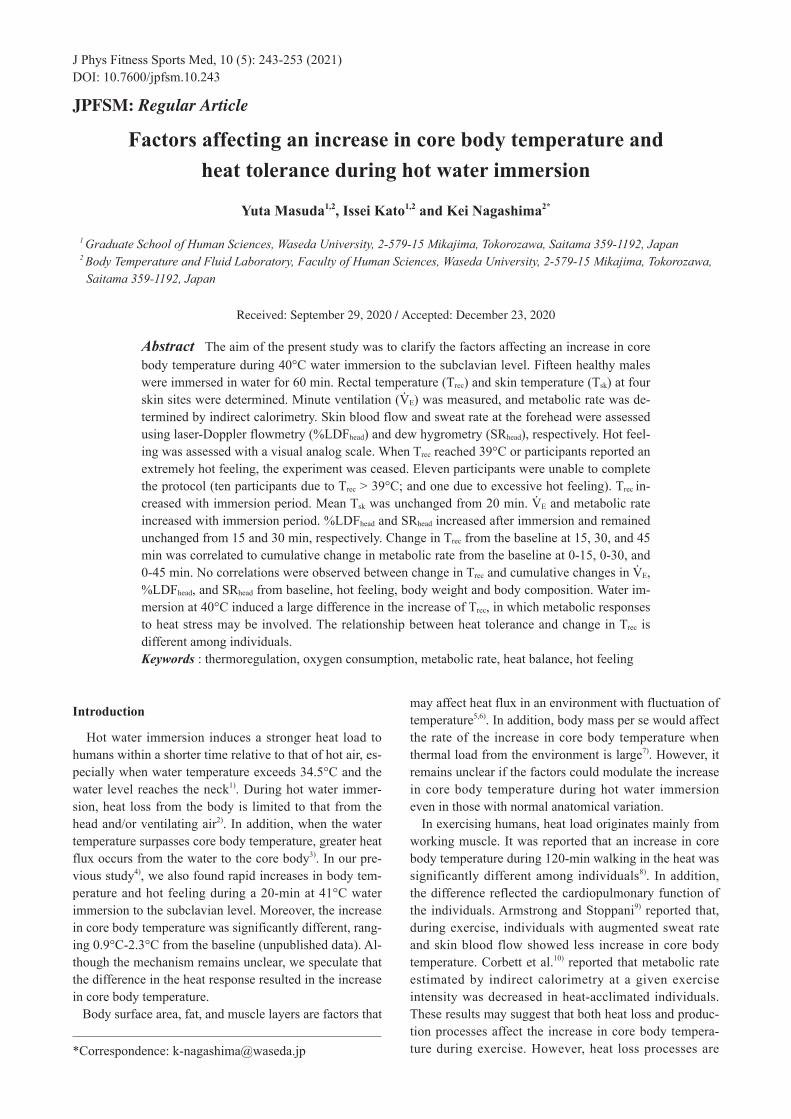
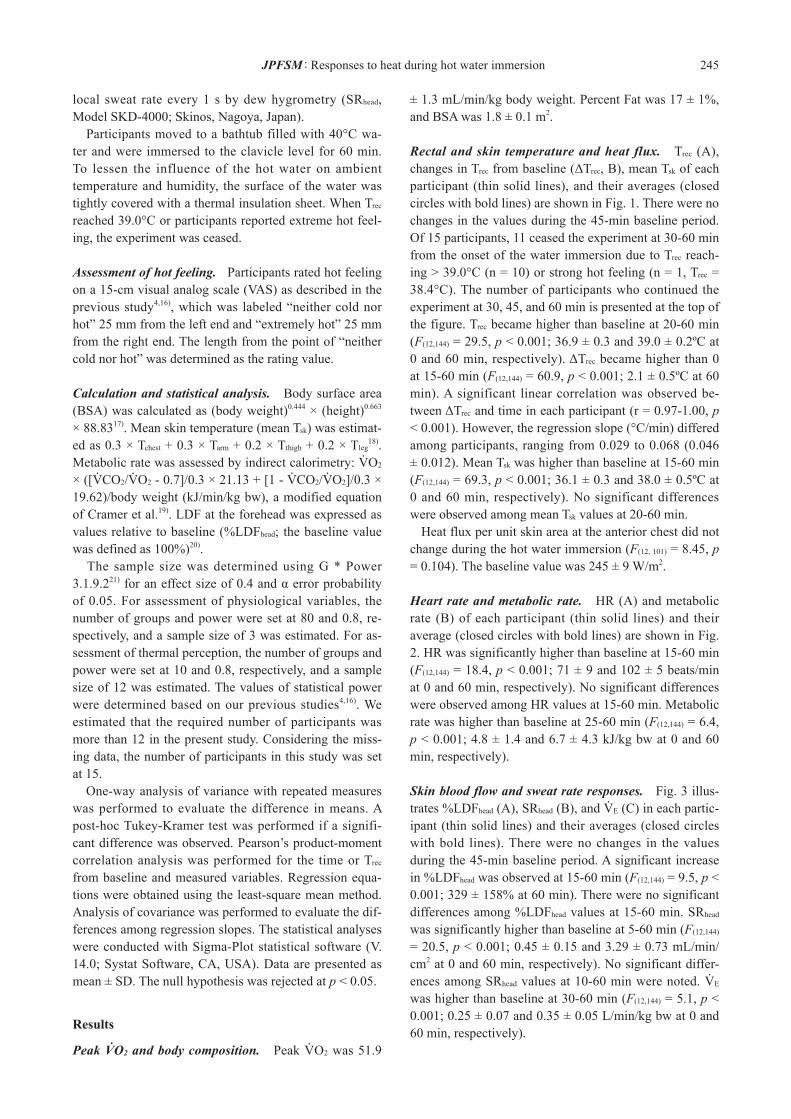
Rectal and skin temperature and heat flux. Trec (A), changes in Trec from baseline (ΔTrec, B), mean Tsk of each participant (thin solid lines), and their averages (closed circles with bold lines) are shown in Fig. 1. There were no changes in the values during the 45-min baseline period. Of 15 participants, 11 ceased the experiment at 30-60 min from the onset of the water immersion due to Trec reach-ing > 39.0°C (n = 10) or strong hot feeling (n = 1, Trec = 38.4°C). The number of participants who continued the experiment at 30, 45, and 60 min is presented at the top of the figure. Trec became higher than baseline at 20-60 min (F(12,144) = 29.5, p < 0.001; 36.9 ± 0.3 and 39.0 ± 0.2ºC at 0 and 60 min, respectively). ΔTrec became higher than 0 at 15-60 min (F(12,144) = 60.9, p < 0.001; 2.1 ± 0.5ºC at 60 min). A significant linear correlation was observed be-tween ΔTrec and time in each participant (r = 0.97-1.00, p < 0.001). However, the regression slope (°C/min) differed among participants, ranging from 0.029 to 0.068 (0.046 ± 0.012). Mean Tsk was higher than baseline at 15-60 min (F(12,144) = 69.3, p < 0.001; 36.1 ± 0.3 and 38.0 ± 0.5ºC at 0 and 60 min, respectively). No significant differences were observed among mean Tsk values at 20-60 min. Heat flux per unit skin area at the anterior chest did not change during the hot water immersion (F(12, 101) = 8.45, p = 0.104). The baseline value was 245 ± 9 W/m2.
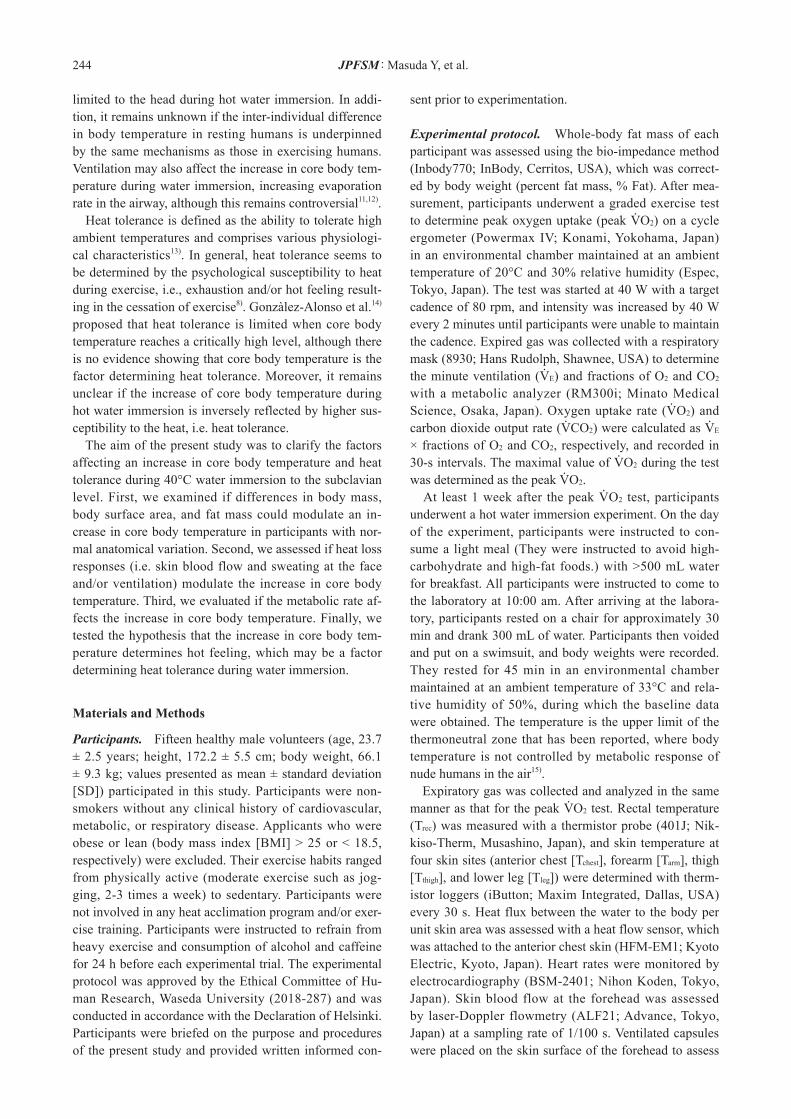
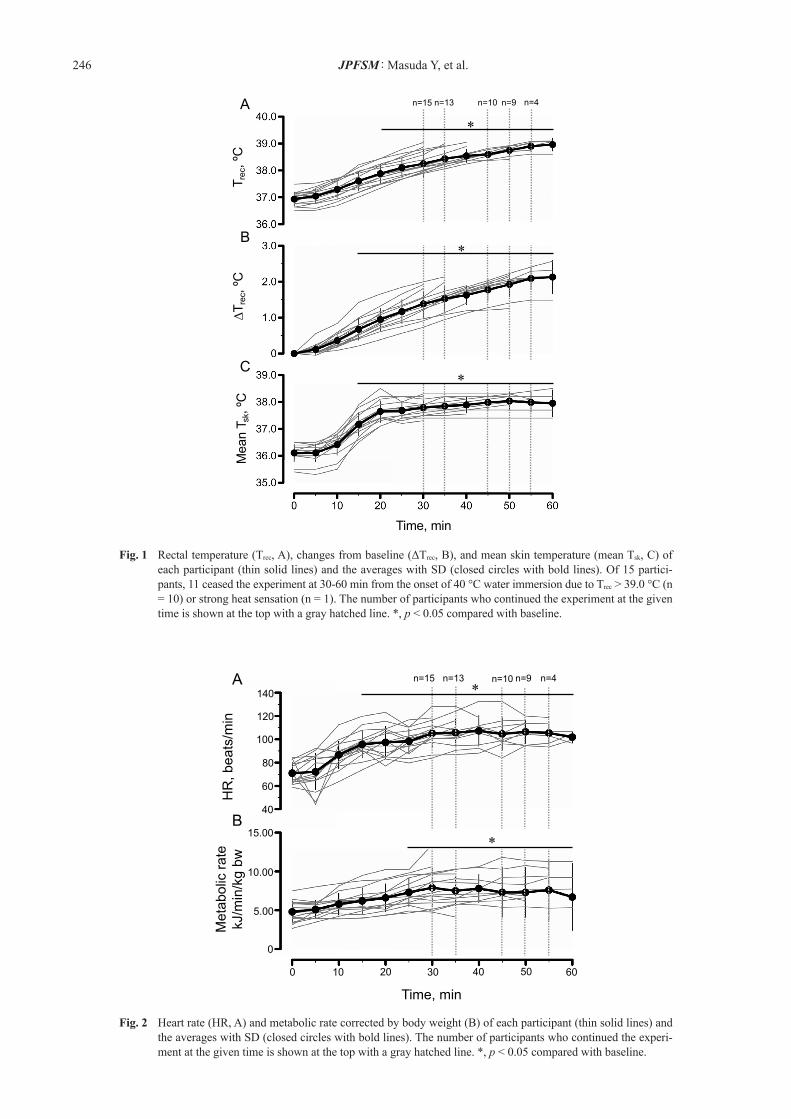
Heart rate and metabolic rate. HR (A) and metabolic rate (B) of each participant (thin solid lines) and their average (closed circles with bold lines) are shown in Fig. 2. HR was significantly higher than baseline at 15-60 min (F(12,144) = 18.4, p < 0.001; 71 ± 9 and 102 ± 5 beats/min at 0 and 60 min, respectively). No significant differences were observed among HR values at 15-60 min. Metabolic rate was higher than baseline at 25-60 min (F(12,144) = 6.4, p < 0.001; 4.8 ± 1.4 and 6.7 ± 4.3 kJ/kg bw at 0 and 60 min, respectively).
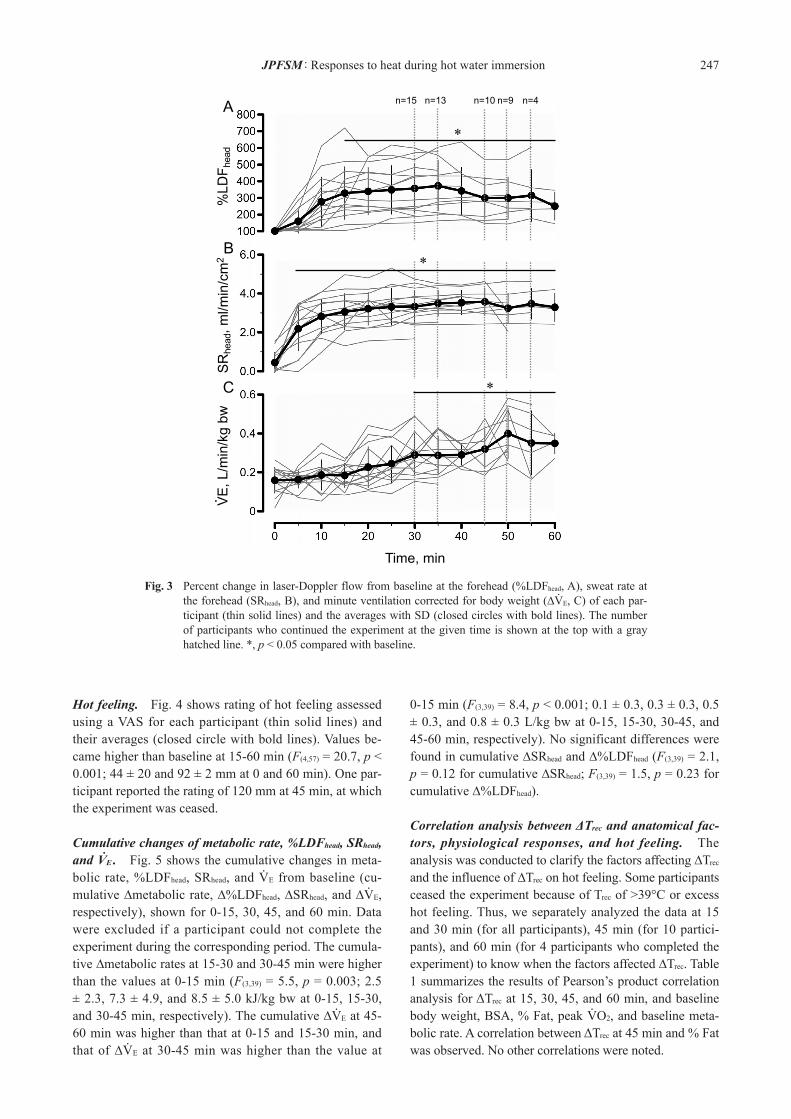
Skin blood flow and sweat rate responses. Fig. 3 illus-trates %LDFhead (A), SRhead (B), and V・E (C) in each partic-ipant (thin solid lines) and their averages (closed circles with bold lines). There were no changes in the values during the 45-min baseline period. A significant increase in %LDFhead was observed at 15-60 min (F(12,144) = 9.5, p < 0.001; 329 ± 158% at 60 min). There were no significant differences among %LDFhead values at 15-60 min. SRhead was significantly higher than baseline at 5-60 min (F(12,144) = 20.5, p < 0.001; 0.45 ± 0.15 and 3.29 ± 0.73 mL/min/cm2 at 0 and 60 min, respectively). No significant differ-ences among SRhead values at 10-60 min were noted. V・E was higher than baseline at 30-60 min (F(12,144) = 5.1, p < 0.001; 0.25 ± 0.07 and 0.35 ± 0.05 L/min/kg bw at 0 and 60 min, respectively).
local sweat rate every 1 s by dew hygrometry (SRhead, Model SKD-4000; Skinos, Nagoya, Japan). Participants moved to a bathtub filled with 40°C wa-ter and were immersed to the clavicle level for 60 min. To lessen the influence of the hot water on ambient temperature and humidity, the surface of the water was tightly covered with a thermal insulation sheet. When Trec reached 39.0°C or participants reported extreme hot feel-ing, the experiment was ceased.
Assessment of hot feeling. Participants rated hot feeling on a 15-cm visual analog scale (VAS) as described in the previous study4,16), which was labeled “neither cold nor hot” 25 mm from the left end and “extremely hot” 25 mm from the right end. The length from the point of “neither cold nor hot” was determined as the rating value.
Calculation and statistical analysis. Body surface area (BSA) was calculated as (body weight)0.444 × (height)0.663 × 88.8317). Mean skin temperature (mean Tsk) was estimat-ed as 0.3 × Tchest + 0.3 × Tarm + 0.2 × Tthigh + 0.2 × Tleg
18). Metabolic rate was assessed by indirect calorimetry: V・O2 × ([V・CO2/V・O2 - 0.7]/0.3 × 21.13 + [1 - V・CO2/V・O2]/0.3 × 19.62)/body weight (kJ/min/kg bw), a modified equation of Cramer et al.19). LDF at the forehead was expressed as values relative to baseline (%LDFhead; the baseline value was defined as 100%)20). The sample size was determined using G * Power 3.1.9.221) for an effect size of 0.4 and α error probability of 0.05. For assessment of physiological variables, the number of groups and power were set at 80 and 0.8, re-spectively, and a sample size of 3 was estimated. For as-sessment of thermal perception, the number of groups and power were set at 10 and 0.8, respectively, and a sample size of 12 was estimated. The values of statistical power were determined based on our previous studies4,16). We estimated that the required number of participants was more than 12 in the present study. Considering the miss-ing data, the number of participants in this study was set at 15. One-way analysis of variance with repeated measures was performed to evaluate the difference in means. A post-hoc Tukey-Kramer test was performed if a signifi-cant difference was observed. Pearson’s product-moment correlation analysis was performed for the time or Trec from baseline and measured variables. Regression equa-tions were obtained using the least-square mean method. Analysis of covariance was performed to evaluate the dif-ferences among regression slopes. The statistical analyses were conducted with Sigma-Plot statistical software (V. 14.0; Systat Software, CA, USA). Data are presented as mean ± SD. The null hypothesis was rejected at p < 0.05.
Results
Peak VO2 and body composition. Peak V・O2 was 51.9 ・
246 JPFSM : Masuda Y, et al.
Fig. 2 Heart rate (HR, A) and metabolic rate corrected by body weight (B) of each participant (thin solid lines) and the averages with SD (closed circles with bold lines). The number of participants who continued the experi-ment at the given time is shown at the top with a gray hatched line. *, p < 0.05 compared with baseline.
Fig. 1 Rectal temperature (Trec, A), changes from baseline (ΔTrec, B), and mean skin temperature (mean Tsk, C) of each participant (thin solid lines) and the averages with SD (closed circles with bold lines). Of 15 partici-pants, 11 ceased the experiment at 30-60 min from the onset of 40 °C water immersion due to Trec > 39.0 °C (n = 10) or strong heat sensation (n = 1). The number of participants who continued the experiment at the given time is shown at the top with a gray hatched line. *, p < 0.05 compared with baseline.
247JPFSM : Responses to heat during hot water immersion
0-15 min (F(3,39) = 8.4, p < 0.001; 0.1 ± 0.3, 0.3 ± 0.3, 0.5 ± 0.3, and 0.8 ± 0.3 L/kg bw at 0-15, 15-30, 30-45, and 45-60 min, respectively). No significant differences were found in cumulative ∆SRhead and ∆%LDFhead (F(3,39) = 2.1, p = 0.12 for cumulative ∆SRhead; F(3,39) = 1.5, p = 0.23 for cumulative ∆%LDFhead).
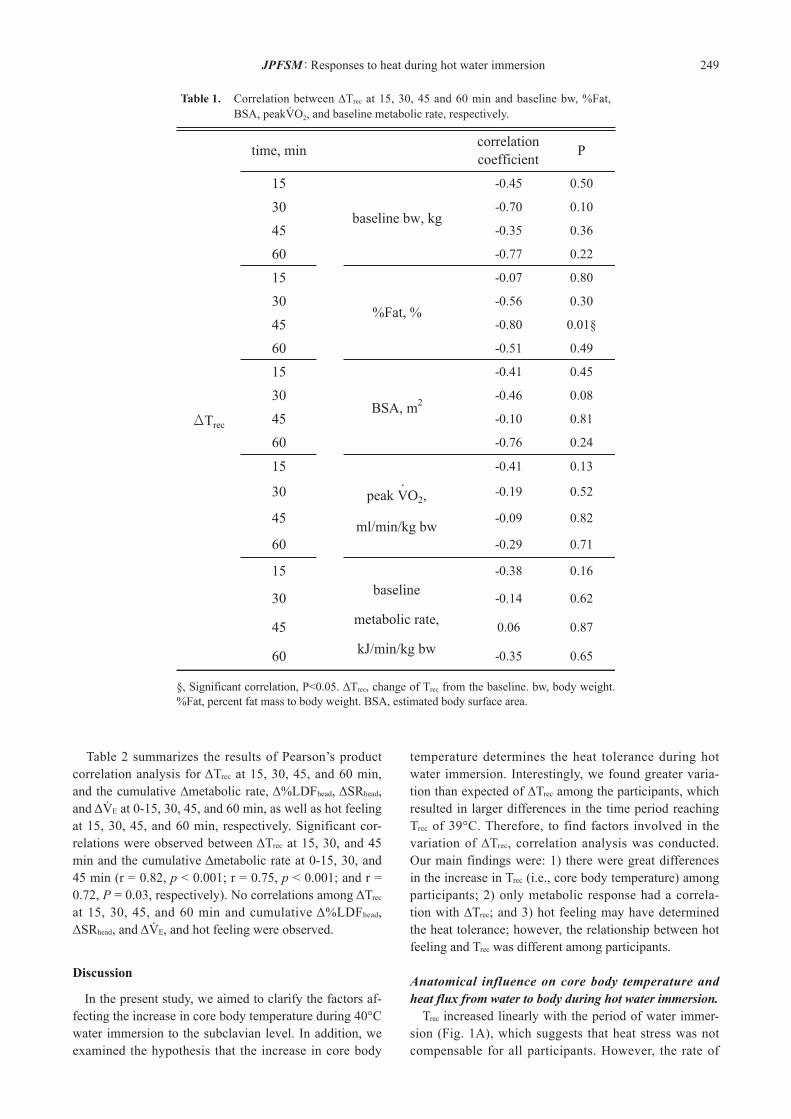
Correlation analysis between ΔTrec and anatomical fac-tors, physiological responses, and hot feeling. The analysis was conducted to clarify the factors affecting ∆Trec and the influence of ∆Trec on hot feeling. Some participants ceased the experiment because of Trec of >39°C or excess hot feeling. Thus, we separately analyzed the data at 15 and 30 min (for all participants), 45 min (for 10 partici-pants), and 60 min (for 4 participants who completed the experiment) to know when the factors affected ∆Trec. Table 1 summarizes the results of Pearson’s product correlation analysis for ΔTrec at 15, 30, 45, and 60 min, and baseline body weight, BSA, % Fat, peak V・O2, and baseline meta-bolic rate. A correlation between ΔTrec at 45 min and % Fat was observed. No other correlations were noted.
Fig. 3 Percent change in laser-Doppler flow from baseline at the forehead (%LDFhead, A), sweat rate at the forehead (SRhead, B), and minute ventilation corrected for body weight (∆V・E, C) of each par-ticipant (thin solid lines) and the averages with SD (closed circles with bold lines). The number of participants who continued the experiment at the given time is shown at the top with a gray hatched line. *, p < 0.05 compared with baseline.
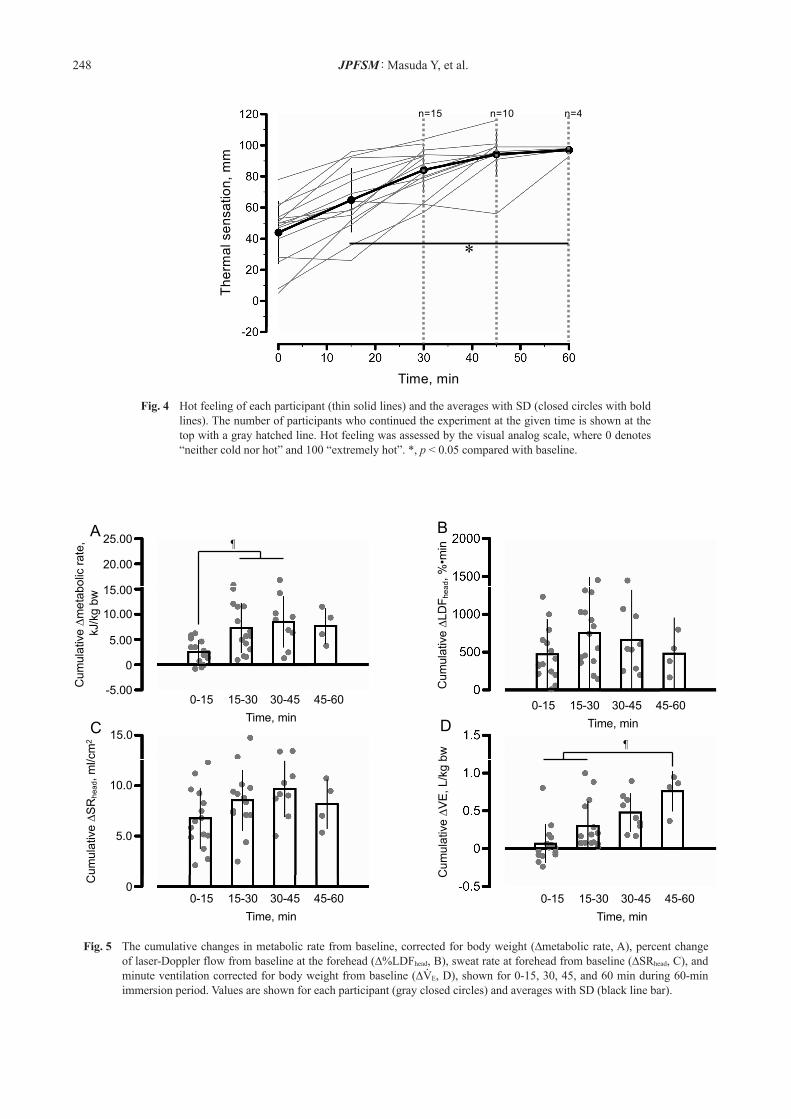
Hot feeling. Fig. 4 shows rating of hot feeling assessed using a VAS for each participant (thin solid lines) and their averages (closed circle with bold lines). Values be-came higher than baseline at 15-60 min (F(4,57) = 20.7, p < 0.001; 44 ± 20 and 92 ± 2 mm at 0 and 60 min). One par-ticipant reported the rating of 120 mm at 45 min, at which the experiment was ceased.
Cumulative changes of metabolic rate, %LDFhead, SRhead, and VE . Fig. 5 shows the cumulative changes in meta-bolic rate, %LDFhead, SRhead, and V・E from baseline (cu-mulative ∆metabolic rate, ∆%LDFhead, ∆SRhead, and ∆V・E, respectively), shown for 0-15, 30, 45, and 60 min. Data were excluded if a participant could not complete the experiment during the corresponding period. The cumula-tive ∆metabolic rates at 15-30 and 30-45 min were higher than the values at 0-15 min (F(3,39) = 5.5, p = 0.003; 2.5 ± 2.3, 7.3 ± 4.9, and 8.5 ± 5.0 kJ/kg bw at 0-15, 15-30, and 30-45 min, respectively). The cumulative ∆V・E at 45-60 min was higher than that at 0-15 and 15-30 min, and that of ∆V・E at 30-45 min was higher than the value at
・
248 JPFSM : Masuda Y, et al.
Fig. 4 Hot feeling of each participant (thin solid lines) and the averages with SD (closed circles with bold lines). The number of participants who continued the experiment at the given time is shown at the top with a gray hatched line. Hot feeling was assessed by the visual analog scale, where 0 denotes “neither cold nor hot” and 100 “extremely hot”. *, p < 0.05 compared with baseline.
Fig. 5 The cumulative changes in metabolic rate from baseline, corrected for body weight (∆metabolic rate, A), percent change of laser-Doppler flow from baseline at the forehead (∆%LDFhead, B), sweat rate at forehead from baseline (∆SRhead, C), and minute ventilation corrected for body weight from baseline (∆V・E, D), shown for 0-15, 30, 45, and 60 min during 60-min immersion period. Values are shown for each participant (gray closed circles) and averages with SD (black line bar).
249JPFSM : Responses to heat during hot water immersion
temperature determines the heat tolerance during hot water immersion. Interestingly, we found greater varia-tion than expected of ∆Trec among the participants, which resulted in larger differences in the time period reaching Trec of 39°C. Therefore, to find factors involved in the variation of ∆Trec, correlation analysis was conducted. Our main findings were: 1) there were great differences in the increase in Trec (i.e., core body temperature) among participants; 2) only metabolic response had a correla-tion with ∆Trec; and 3) hot feeling may have determined the heat tolerance; however, the relationship between hot feeling and Trec was different among participants.
Anatomical influence on core body temperature and heat flux from water to body during hot water immersion. Trec increased linearly with the period of water immer-sion (Fig. 1A), which suggests that heat stress was not compensable for all participants. However, the rate of
Table 2 summarizes the results of Pearson’s product correlation analysis for ΔTrec at 15, 30, 45, and 60 min, and the cumulative ∆metabolic rate, Δ%LDFhead, ΔSRhead, and ΔV・E at 0-15, 30, 45, and 60 min, as well as hot feeling at 15, 30, 45, and 60 min, respectively. Significant cor-relations were observed between ΔTrec at 15, 30, and 45 min and the cumulative Δmetabolic rate at 0-15, 30, and 45 min (r = 0.82, p < 0.001; r = 0.75, p < 0.001; and r = 0.72, P = 0.03, respectively). No correlations among ΔTrec at 15, 30, 45, and 60 min and cumulative Δ%LDFhead, ΔSRhead, and ΔV・E, and hot feeling were observed.
Discussion
In the present study, we aimed to clarify the factors af-fecting the increase in core body temperature during 40°C water immersion to the subclavian level. In addition, we examined the hypothesis that the increase in core body
Table 1. Correlation between ∆Trec at 15, 30, 45 and 60 min and baseline bw, %Fat, BSA, peakV・O2, and baseline metabolic rate, respectively.
§, Significant correlation, P<0.05. ∆Trec, change of Trec from the baseline. bw, body weight. %Fat, percent fat mass to body weight. BSA, estimated body surface area.
time, mincorrelation
coefficientP
15 -0.45 0.50
30 -0.70 0.10
45 -0.35 0.36
60 -0.77 0.22
15 -0.07 0.80
30 -0.56 0.30
45 -0.80 0.01§
60 -0.51 0.49
15 -0.41 0.45
30 -0.46 0.08
45 -0.10 0.81
60 -0.76 0.24
15 -0.41 0.13
30 -0.19 0.52
45 -0.09 0.82
60 -0.29 0.71
15 -0.38 0.16
30 -0.14 0.62
45 0.06 0.87
60 -0.35 0.65
rec
baseline bw, kg
%Fat, %
BSA, m2
peak VO2,
ml/min/kg bw
baseline
metabolic rate,
kJ/min/kg bw
250 JPFSM : Masuda Y, et al.
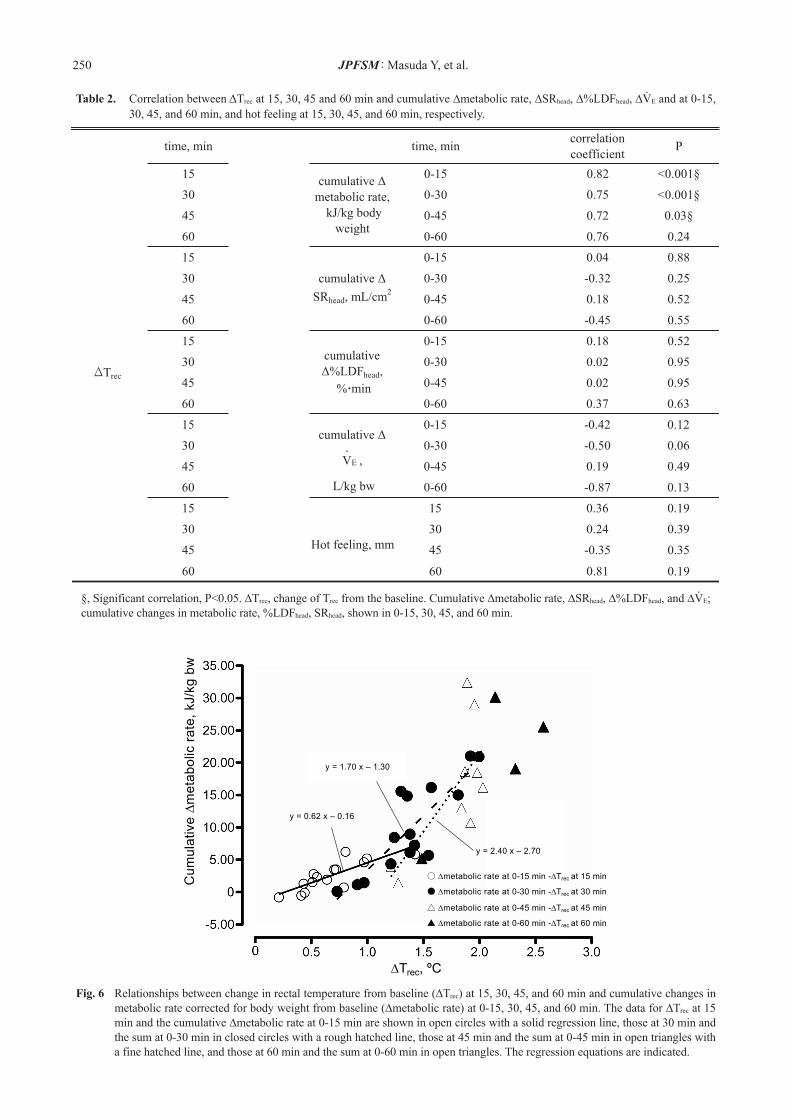
Table 2. Correlation between ΔTrec at 15, 30, 45 and 60 min and cumulative ∆metabolic rate, ∆SRhead, ∆%LDFhead, ∆V・E and at 0-15, 30, 45, and 60 min, and hot feeling at 15, 30, 45, and 60 min, respectively.
§, Significant correlation, P<0.05. ∆Trec, change of Trec from the baseline. Cumulative ∆metabolic rate, ∆SRhead, ∆%LDFhead, and ∆V・E; cumulative changes in metabolic rate, %LDFhead, SRhead, shown in 0-15, 30, 45, and 60 min.
nim ,emitnim ,emitcorrelation
coefficientP
§100.0<28.051-051
§100.0<57.003-003
§30.027.054-054
42.067.006-006
88.040.051-051
52.023.0-03-003
25.081.054-054
55.054.0-06-006
25.081.051-051
59.020.003-003
59.020.054-054
36.073.006-006
21.024.0-51-051
60.005.0-03-003
94.091.054-054
31.078.0-06-006
91.063.05151
93.042.00303
53.053.0-5454
91.018.00606
rec
metabolic rate,
kJ/kg body
weight
head2
cumulative
head,
Hot feeling, mm
Fig. 6 Relationships between change in rectal temperature from baseline (∆Trec) at 15, 30, 45, and 60 min and cumulative changes in metabolic rate corrected for body weight from baseline (∆metabolic rate) at 0-15, 30, 45, and 60 min. The data for ∆Trec at 15 min and the cumulative ∆metabolic rate at 0-15 min are shown in open circles with a solid regression line, those at 30 min and the sum at 0-30 min in closed circles with a rough hatched line, those at 45 min and the sum at 0-45 min in open triangles with a fine hatched line, and those at 60 min and the sum at 0-60 min in open triangles. The regression equations are indicated.
251JPFSM : Responses to heat during hot water immersion
nary experiment, we found similar responses to those of the forehead. Thus, we assume that the thermoregulatory responses were similar between the immersed and non-immersed skin areas. Cabanac and White24) reported that V・E started to in-crease at an esophageal temperature of 38.5°C without changes in V・O2 (i.e. metabolic rate) during 41°C water immersion to the subclavian level. In the present study, both metabolic rate and V・ E increased with the immer-sion period and ∆Trec (Figs. 2B and 3C). The value of V・E/V・O2 started to increase at 30 min (47.8 at 0 min and Trec of 36.9°C; and 58.4 at 35 min and Trec of 38.3°C). These results may suggest the dependency of V・E on body tem-perature as previously suggested25). In addition, V・E might work as a thermoregulatory process. To clarify the role of V・E on thermoregulation in heat, we assessed the cor-relation between ∆Trec and the cumulative ∆V・E (Table 2). However, no significant correlation was observed, which suggests that heat loss via V・ E is unable to account for inter-individual differences in ∆Trec.
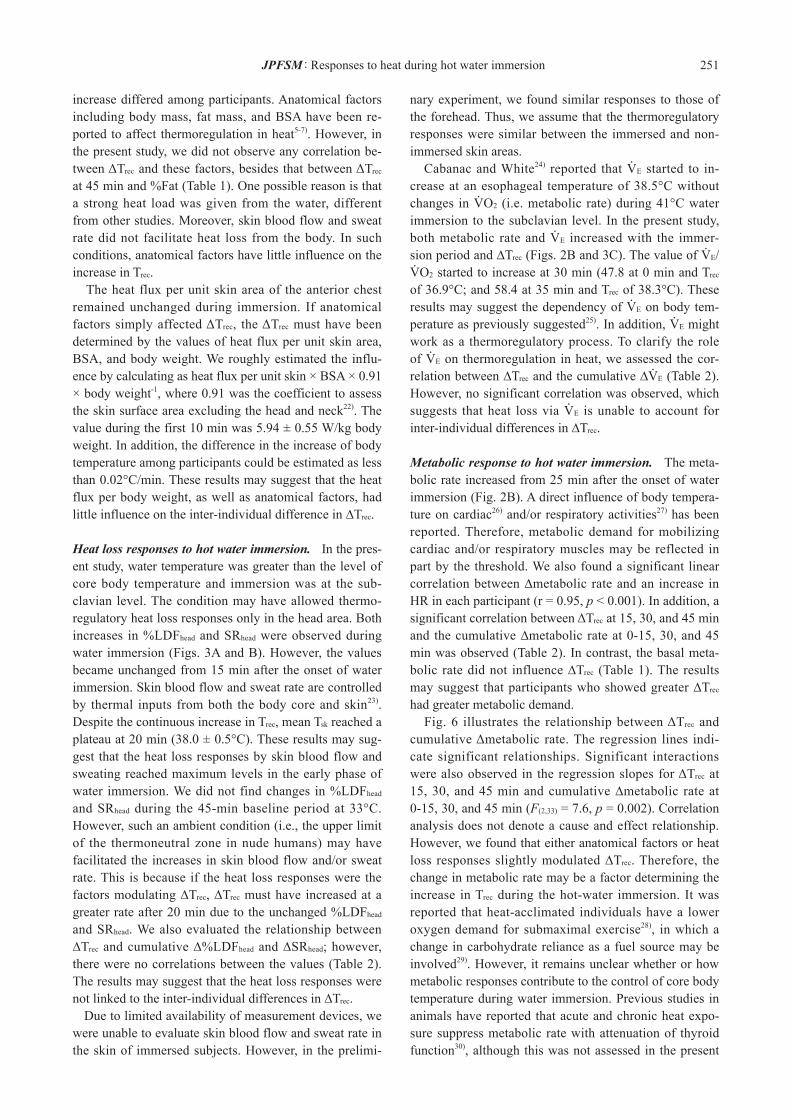
Metabolic response to hot water immersion. The meta-bolic rate increased from 25 min after the onset of water immersion (Fig. 2B). A direct influence of body tempera-ture on cardiac26) and/or respiratory activities27) has been reported. Therefore, metabolic demand for mobilizing cardiac and/or respiratory muscles may be reflected in part by the threshold. We also found a significant linear correlation between ∆metabolic rate and an increase in HR in each participant (r = 0.95, p < 0.001). In addition, a significant correlation between ΔTrec at 15, 30, and 45 min and the cumulative ∆metabolic rate at 0-15, 30, and 45 min was observed (Table 2). In contrast, the basal meta-bolic rate did not influence ∆Trec (Table 1). The results may suggest that participants who showed greater ∆Trec had greater metabolic demand. Fig. 6 illustrates the relationship between ΔTrec and cumulative Δmetabolic rate. The regression lines indi-cate significant relationships. Significant interactions were also observed in the regression slopes for ΔTrec at 15, 30, and 45 min and cumulative ∆metabolic rate at 0-15, 30, and 45 min (F(2,33) = 7.6, p = 0.002). Correlation analysis does not denote a cause and effect relationship. However, we found that either anatomical factors or heat loss responses slightly modulated ∆Trec. Therefore, the change in metabolic rate may be a factor determining the increase in Trec during the hot-water immersion. It was reported that heat-acclimated individuals have a lower oxygen demand for submaximal exercise28), in which a change in carbohydrate reliance as a fuel source may be involved29). However, it remains unclear whether or how metabolic responses contribute to the control of core body temperature during water immersion. Previous studies in animals have reported that acute and chronic heat expo-sure suppress metabolic rate with attenuation of thyroid function30), although this was not assessed in the present
increase differed among participants. Anatomical factors including body mass, fat mass, and BSA have been re-ported to affect thermoregulation in heat5-7). However, in the present study, we did not observe any correlation be-tween ΔTrec and these factors, besides that between ΔTrec at 45 min and %Fat (Table 1). One possible reason is that a strong heat load was given from the water, different from other studies. Moreover, skin blood flow and sweat rate did not facilitate heat loss from the body. In such conditions, anatomical factors have little influence on the increase in Trec. The heat flux per unit skin area of the anterior chest remained unchanged during immersion. If anatomical factors simply affected ΔTrec, the ΔTrec must have been determined by the values of heat flux per unit skin area, BSA, and body weight. We roughly estimated the influ-ence by calculating as heat flux per unit skin × BSA × 0.91 × body weight-1, where 0.91 was the coefficient to assess the skin surface area excluding the head and neck22). The value during the first 10 min was 5.94 ± 0.55 W/kg body weight. In addition, the difference in the increase of body temperature among participants could be estimated as less than 0.02°C/min. These results may suggest that the heat flux per body weight, as well as anatomical factors, had little influence on the inter-individual difference in ∆Trec.
Heat loss responses to hot water immersion. In the pres-ent study, water temperature was greater than the level of core body temperature and immersion was at the sub-clavian level. The condition may have allowed thermo-regulatory heat loss responses only in the head area. Both increases in %LDFhead and SRhead were observed during water immersion (Figs. 3A and B). However, the values became unchanged from 15 min after the onset of water immersion. Skin blood flow and sweat rate are controlled by thermal inputs from both the body core and skin23). Despite the continuous increase in Trec, mean Tsk reached a plateau at 20 min (38.0 ± 0.5°C). These results may sug-gest that the heat loss responses by skin blood flow and sweating reached maximum levels in the early phase of water immersion. We did not find changes in %LDFhead and SRhead during the 45-min baseline period at 33°C. However, such an ambient condition (i.e., the upper limit of the thermoneutral zone in nude humans) may have facilitated the increases in skin blood flow and/or sweat rate. This is because if the heat loss responses were the factors modulating ∆Trec, ∆Trec must have increased at a greater rate after 20 min due to the unchanged %LDFhead and SRhead. We also evaluated the relationship between ∆Trec and cumulative ∆%LDFhead and ∆SRhead; however, there were no correlations between the values (Table 2). The results may suggest that the heat loss responses were not linked to the inter-individual differences in ∆Trec. Due to limited availability of measurement devices, we were unable to evaluate skin blood flow and sweat rate in the skin of immersed subjects. However, in the prelimi-
252 JPFSM : Masuda Y, et al.
individuals. It was reported that heat tolerance during water immersion was determined by core temperature and psychological factors (i.e., hot feeling)13); however, the relationship between hot feeling and the increase in core body temperature varied among individuals.
Acknowledgments
We thank all volunteers for participating in this study.
Grants
This work was supported by JSPS KAKENHI Grant Numbers No. 19H01128, No. 16K13055, Japan.
Conflict of Interests
The authors declare that there is no conflict of interests regard-ing the publication of this article.
Author Contributions
YM and KN conceived and designed experiments. YM and IK contributed to data collection. YM and IK performed data analy-sis. YM and KN interpreted the experiment results. YM and KN edited the manuscript. All authors approved the final version of the manuscript.
study. Moreover, in vitro studies have indicated that the expression of uncoupling protein 3, associated with heat production in skeletal muscles, is decreased during heat exposure31,32). Differences in these biochemical and mo-lecular responses to heat may be reflected by the inter-individual differences in ∆Trec in the present study. Cardiopulmonary function is reported to augment the ability of thermoregulation in the heat via heat loss and metabolic process stated before5). However, we did not find a relationship between ∆Trec and peak V・O2, suggest-ing less involvement of cardiopulmonary function in ∆Trec during the hot water immersion. One possible reason is that the participants in the present study had a similar fitness level. Thus, we could not assess the influence of peak V・O2 on ∆Trec.
Hot feeling during hot water immersion. Hot feeling in-creased during hot water immersion, which was assessed with a visual analogue scale (VAS) (Fig. 4). Interestingly, one participant reported excessive hot feeling and ter-minated the experiment with Trec of < 39°C. In addition, there was no significant correlation between ∆Trec and hot feeling (Table 2). It has been reported that thermal feeling is determined by both core body and skin temperature33,34). However, when skin temperature is high enough, core body temperature may not be a factor determining hot feeling. These results may suggest that hot feeling is an independent factor determining heat tolerance during hot water immersion. It has been reported that heat acclimatized individuals exhibit less thermal sensation in the heat35) and during ex-ercise36,37). However, no correlation between ∆Trec and the VAS rating of hot feeling was noted in the present study (Table 2), indicating that individuals with smaller ∆Trec did not have less hot feeling.
Limitations and future research. The applicability of the present findings is limited to male subjects with simi-lar body composition and endurance abilities (i.e., body composition and peakV・O2). Moreover, due to ethical con-siderations, the study could only be performed until the core temperature reached 39°C. Therefore, we may have missed other factors determining heat tolerance, such as gender difference, age, and fitness level. To prevent heat-related illness, it is important to clarify the factors deter-mining heat tolerance. In the future, it will be necessary to examine the changes in body temperature and the affect-ing factors in individuals of both sex with a wide range of anatomical and physiological characteristics.
Conclusion
To conclude, variation in inter-individual differences in core temperature increases was observed during 40°C water immersion. The mechanisms underscoring this variation may be related to metabolic responses among
References
1) Yamazaki F, Endo Y, Torii R, Sagawa S and Shiraki K. 2000. Continuous monitoring of change in hemodilution during water immersion in humans: effect of water temperature. Aviat Space Environ Med 71: 632-639.
2) Fujishima K. 1986. Thermoregulatory responses during ex-ercise and a hot water immersion and the affective responses to peripheral thermal stimuli. Int J Biometeorol 30: 1-19. doi: 10.1007/BF02192052.
3) Mollendorf JC and Pendergast DR. 2010. Thermal protection system for underwater use in cold and hot water. J Thermal Sci Eng Appl 2: 011003. doi: 10.1115/1.4001986.
4) Masuda Y, Marui S, Kato I, Fujiki M, Nakada M and Na-gashima K. 2019. Thermal and cardiovascular responses and thermal sensation during hot-water bathing and the influence of room temperature. J Therm Biol 82: 83-89. doi: 10.1016/j.jtherbio.2019.03.014.
5) Havenith G. 2001. Individualized model of human thermo-regulation for the simulation of heat stress response. J Appl Physiol 90: 1943-1954. doi: 10.1152/jappl.2001.90.5.1943.
6) Veicsteinas A, Ferretti G and Rennie DW. 1982. Superficial shell insulation in resting and exercising men in cold water. J Appl Physiol Respir Environ Exerc Physiol 52: 1557-1564. doi: 10.1152/jappl.1982.52.6.1557.
7) Schmidt-Nielsen K. 1959. The physiology of the camel. Sci Am 201: 140-151. doi: 10.1038/scientificamerican1259-140.
8) Moran DS, Erlich T and Epstein Y. 2007. The heat tolerance test: an efficient screening tool for evaluating susceptibility to heat. J Sport Rehabil 16: 215-221. doi: 10.1123/jsr.16.3.215.

253JPFSM : Responses to heat during hot water immersion
9) Armstrong LE and Stoppani J. 2002. Central nervous system control of heat acclimation adaptations: an emerging para-digm. Rev Neurosci 13: 271-285. doi: 10.1515/REVNEU-RO.2002.13.3.271.
10) Corbett J, Rendell RA, Massey HC, Costello JT and Tipton MJ. 2018. Inter-individual variation in the adaptive response to heat acclimation. J Therm Biol 74: 29-36. doi: 10.1016/j.jtherbio.2018.03.002.
11) Sancheti A and White MD. 2006. Reproducibility of rela-tionships between human ventilation, its components and oesophageal temperature during incremental exercise. Eur J Appl Physiol 96: 495-504. doi: 10.1007/s00421-005-0101-9.
12) Saxton C. 1975. Respiration during heat stress. Aviat Space Environ Med 46: 41-46.
13) Glossary of terms for thermal physiology. 2001. Third edition revised by The Commision for Thermal Physiology of the In-ternational Union of Physiological Sciences (IUPS Thermal Commission). Jpn J Physiol 51: 245-280.
14) Gonzàlez-Alonso J, Teller C, Andersen SL, Jensen FB, Hyl-dig T and Nielsen B. 1999. Influence of body temperature on the development of fatigue during prolonged exercise in the heat. J Appl Physiol 86: 1032-1039. doi: 10.1152/jap-pl.1999.86.3.1032.
15) Kingma BRM, Frijns AJH, Schellen L and van Marken Li-chtenbelt WD. 2014. Beyond the classic thermoneutral zone: including thermal comfort. Temperature 1: 142-149. doi: 10.4161/temp.29702.
16) Nakamura M, Yoda T, Crawshaw LI, Yasuhara S, Saito Y, Kasuga M, Nagashima K and Kanosue K. 2008. Regional differences in temperature sensation and thermal comfort in humans. J Appl Physiol 105: 1897-1906. doi: 10.1152/jap-plphysiol.90466.2008.
17) Fujimoto S, Watanabe T, Sakamoto A, Yukawa K and Morim-oto K. 1968. Studies on the physical surface area of Japanese. 18. Calculation formulas in three stages over all ages. Nip-pon Eiseigaku Zasshi (Jpn J Hyg) 23: 443-450. doi: 10.1265/jjh.23.443.
18) Ramanathan NL. 1964. A new weighting system for mean surface temperature of the human body. J Appl Physiol 19: 531-533. doi: 10.1152/jappl.1964.19.3.531.
19) Cramer MN, Gagnon D, Crandall CG and Jay O. 2017. Does attenuated skin blood flow lower sweat rate and the critical environmental limit for heat balance during severe heat expo-sure? Exp Physiol 102: 202-213. doi: 10.1113/EP085915.
20) Nilsson GE, Tenland T and Oberg PA. 1980. Evaluation of a laser Doppler flowmeter for measurement of tissue blood flow. IEEE Trans Biomed Eng 27: 597-604. doi: 10.1109/TBME.1980.326582.
21) Faul F, Erdfelder E, Lang AG and Buchner A. 2007. G*Power 3: a flexible statistical power analysis program for the social, behavioral, and biomedical sciences. Behav Res Methods 39: 175-191. doi: 10.3758/BF03193146.
22) Wallace AB. 1951. The exposure treatment of burns. Lancet 257: 501-504. doi: 10.1016/S0140-6736(51)91975-7.
23) Wyss CR, Brengelmann GL, Johnson JM, Rowell LB and Niederberger M. 1974. Control of skin blood flow, sweat-ing, and heart rate: role of skin vs. core temperature. J Appl Physiol 36: 726-733. doi: 10.1152/jappl.1974.36.6.726.
24) Cabanac M and White MD. 1995. Core temperature thresh-
olds for hyperpnea during passive hyperthermia in humans. Eur J Appl Physiol Occup Physiol 71: 71-76. doi: 10.1007/BF00511235.
25) Chai CY and Lin MT. 1972. Effects of heating and cooling the spinal cord and medulla oblongata on thermoregulation in monkeys. J Physiol 225: 297-308. doi: 10.1113/jphysi-ol.1972.sp009941.
26) Nybo L and Nielsen B. 2001. Middle cerebral artery blood velocity is reduced with hyperthermia during prolonged exer-cise in humans. J Physiol 534: 279-286. doi: 10.1111/j.1469-7793.2001.t01-1-00279.x.
27) Tsuji B, Honda Y, Fujii N, Kondo N and Nishiyasu T. 2012. Effect of initial core temperature on hyperthermic hyperven-tilation during prolonged submaximal exercise in the heat. Am J Physiol Integr Comp Physiol 302: R94-R102. doi: 10.1152/ajpregu.00048.2011.
28) Sawka MN, Pandolf KB, Avellini BA and Shapiro Y. 1983. Does heat acclimation lower the rate of metabolism elicited by muscular exercise? Aviat Space Environ Med 54: 27-31.
29) Febbraio MA, Snow RJ, Hargreaves M, Stathis CG, Martin IK and Carey MF. 1994. Muscle metabolism during exercise and heat stress in trained men: effect of acclimation. J Appl Physiol 76: 589-597. doi: 10.1152/jappl.1994.76.2.589.
30) Rousset B, Cure M, Jordan D, Kervran A, Bornet H and Mornex R. 1984. Metabolic alterations induced by chronic heat exposure in the rat: the involvement of thyroid function. Pflügers Arch 401: 64-70. doi: 10.1007/BF00581534.
31) Mujahid A, Akiba Y and Toyomizu M. 2007. Acute heat stress induces oxidative stress and decreases adaptation in young white leghorn cockerels by downregulation of avian uncoupling protein. Poult Sci 86: 364-371. doi: 10.1093/ps/86.2.364.
32) Salgado RM, Sheard AC, Vaughan RA, Parker DL, Schneider SM, Kenefick RW, McCormick JJ, Gannon NP, Van Dussel-dorp TA, Kravitz LR and Mermier CM. 2017. Mitochondrial efficiency and exercise economy following heat stress: a po-tential role of uncoupling protein 3. Physiol Rep 5: e13054. doi: 10.14814/phy2.13054.
33) Schlader ZJ, Simmons SE, Stannard SR and Mündel T. 2011. The independent roles of temperature and thermal perception in the control of human thermoregulatory behavior. Physiol Behav 103: 217-224. doi: 10.1016/j.physbeh.2011.02.002.
34) Kanosue K, Crawshaw LI, Nagashima K and Yoda T. 2010. Concepts to utilize in describing thermoregulation and neuro-physiological evidence for how the system works. Eur J Appl Physiol 109: 5-11. doi: 10.1007/s00421-009-1256-6.
35) Lee JY, Saat M, Chou C, Hashiguchi N, Wijayanto T, Waka-bayashi H and Tochihara Y. 2010. Cutaneous warm and cool sensation thresholds and the inter-threshold zone in Ma-laysian and Japanese males. J Therm Biol 35: 70-76. doi: 10.1016/j.jtherbio.2009.11.002.
36) Mee JA, Peters S, Doust JH and Maxwell NS. 2017. Sauna exposure immediately prior to short-term heat acclimation accelerates phenotypic adaptation in females. J Sci Med Sport 21: 190-195. doi: 10.1016/j.jsams.2017.06.024.
37) Gonzalez RR and Gagge AP. 1976. Warm discomfort and associated thermoregulatory changes during dry, and humid-heat acclimatization. Isr J Med Sci 12: 804-807.