Embed Size (px)
Citation preview
FACTORS AFFECTING COMPOSITION OF
MILK
2
a2

Slide 2
a2 acdf, 6/24/2012
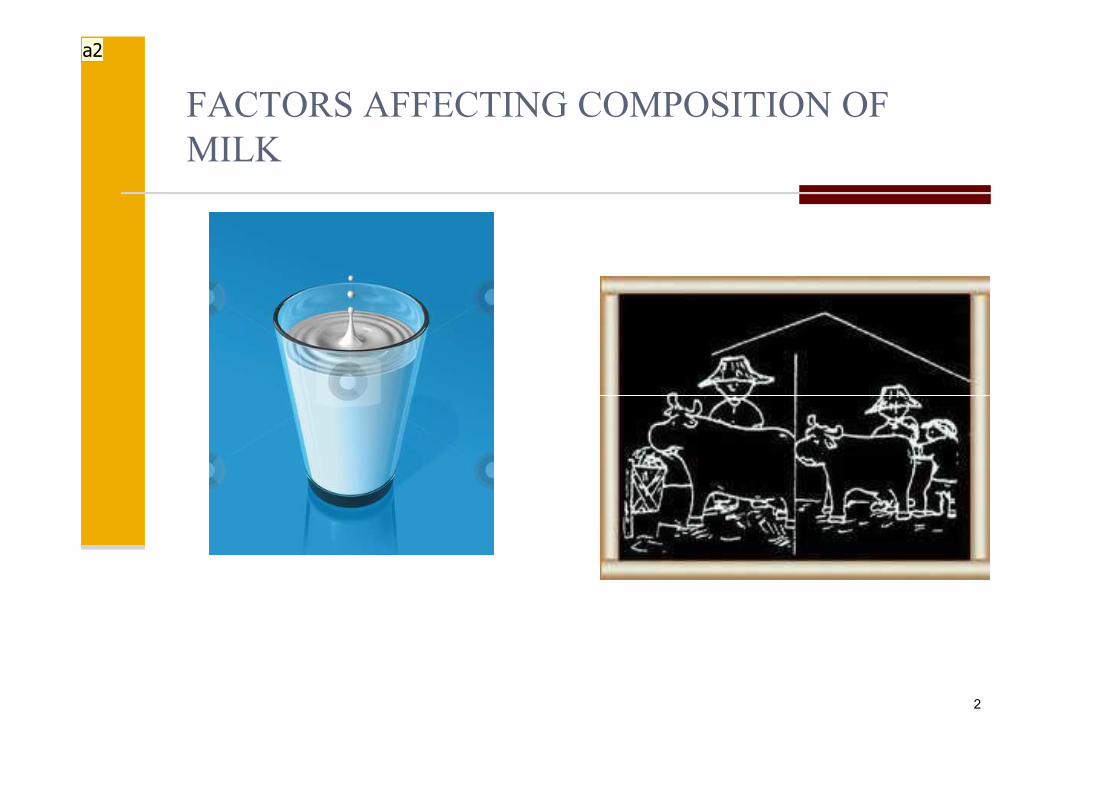
CLASSIFICATION OF MILK CONSTITUENTS
3
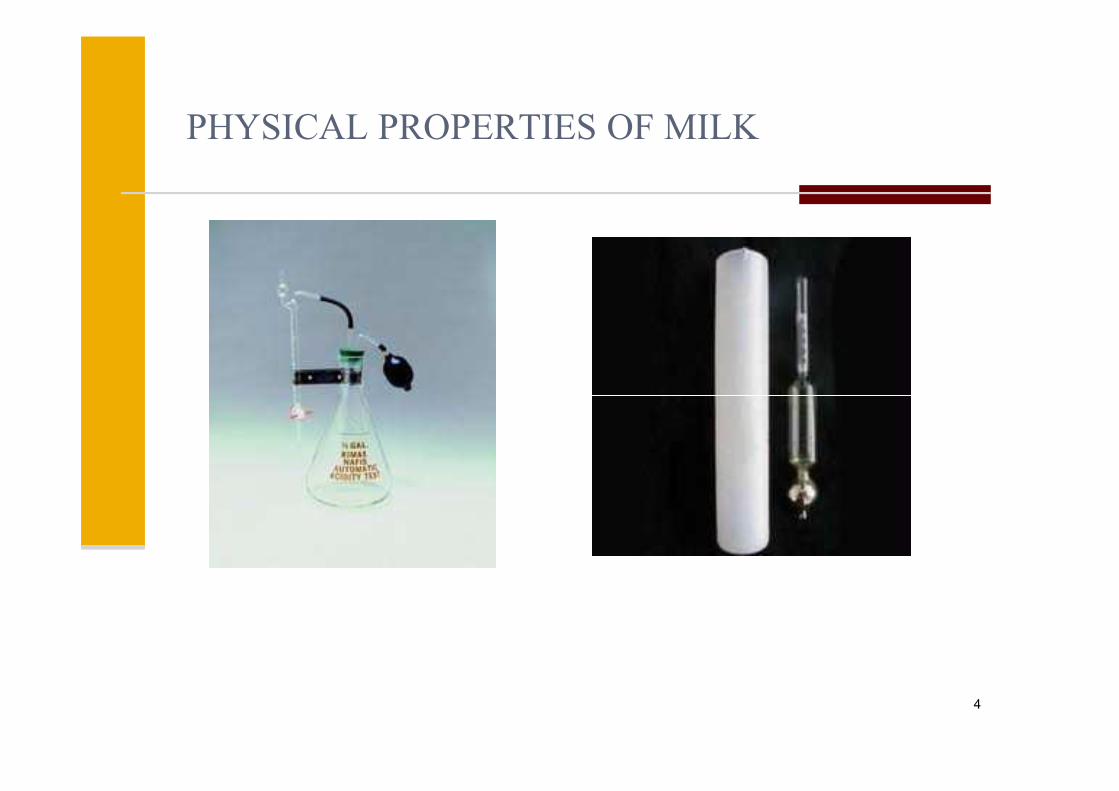
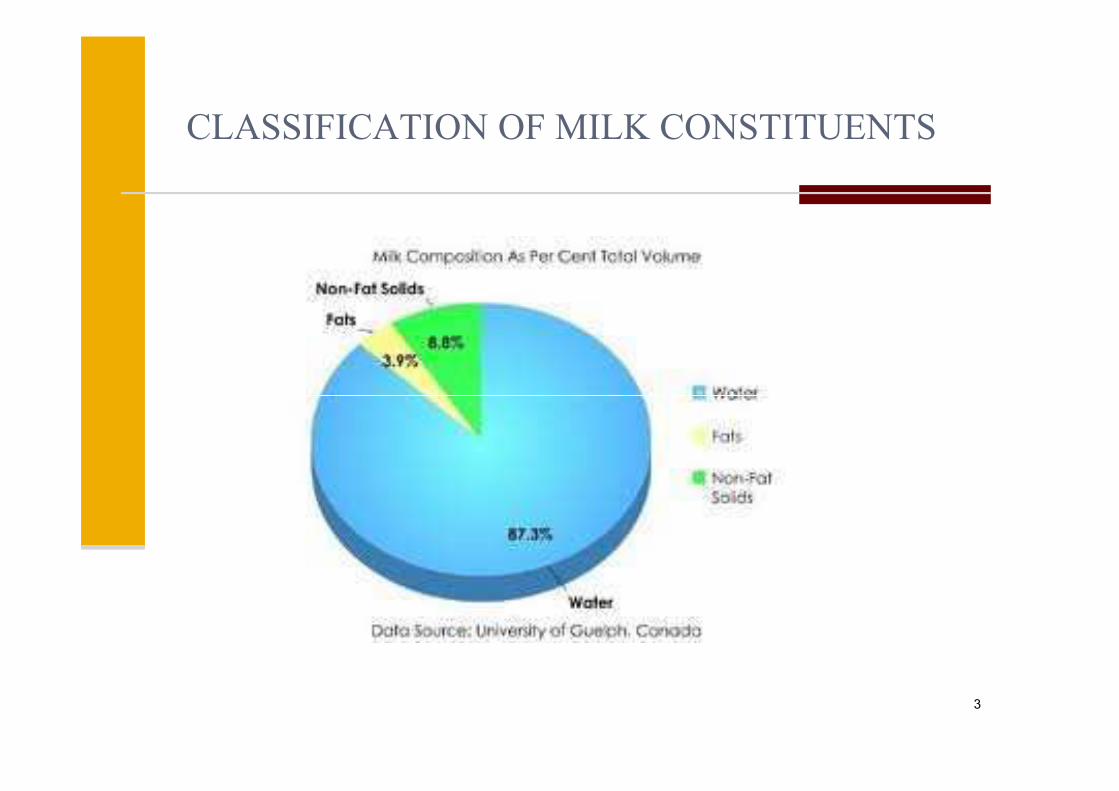
PHYSICAL PROPERTIES OF MILK
4
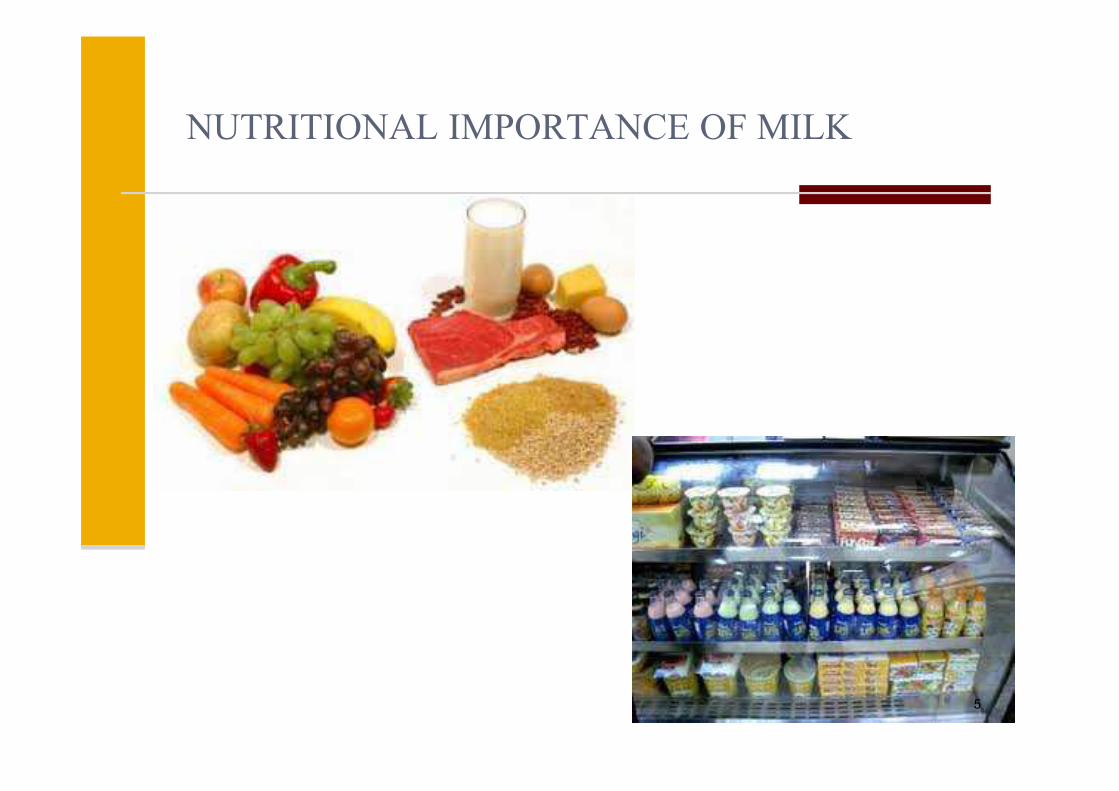
NUTRITIONAL IMPORTANCE OF MILK
5

CLASSIFICATION OF MILK PRODUCTS AND
COMPOSITION
6
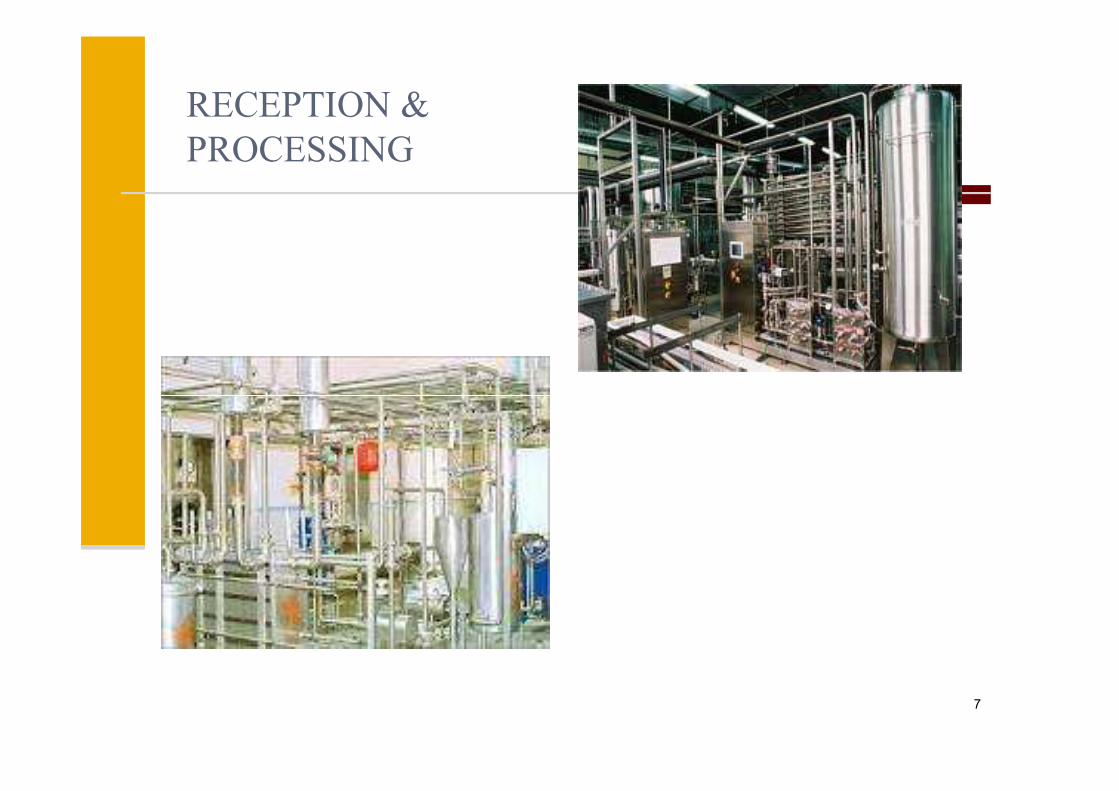
RECEPTION &
PROCESSING
7
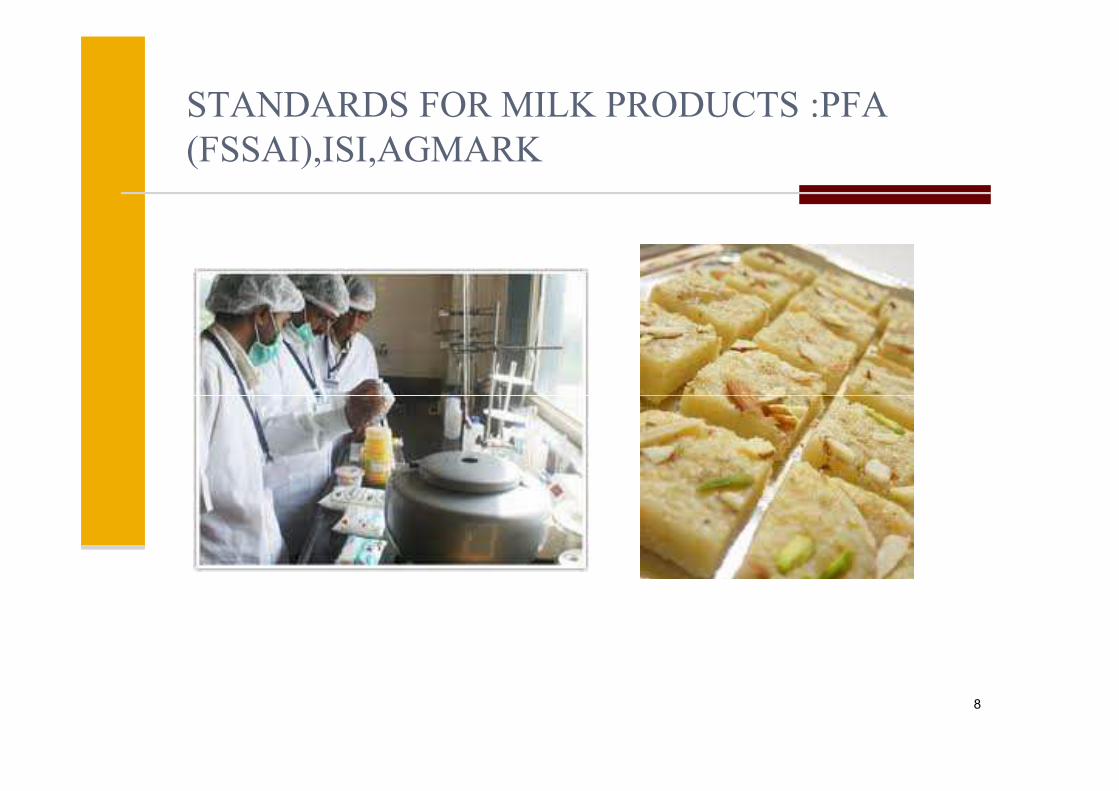
STANDARDS FOR MILK PRODUCTS :PFA
(FSSAI),ISI,AGMARK
8
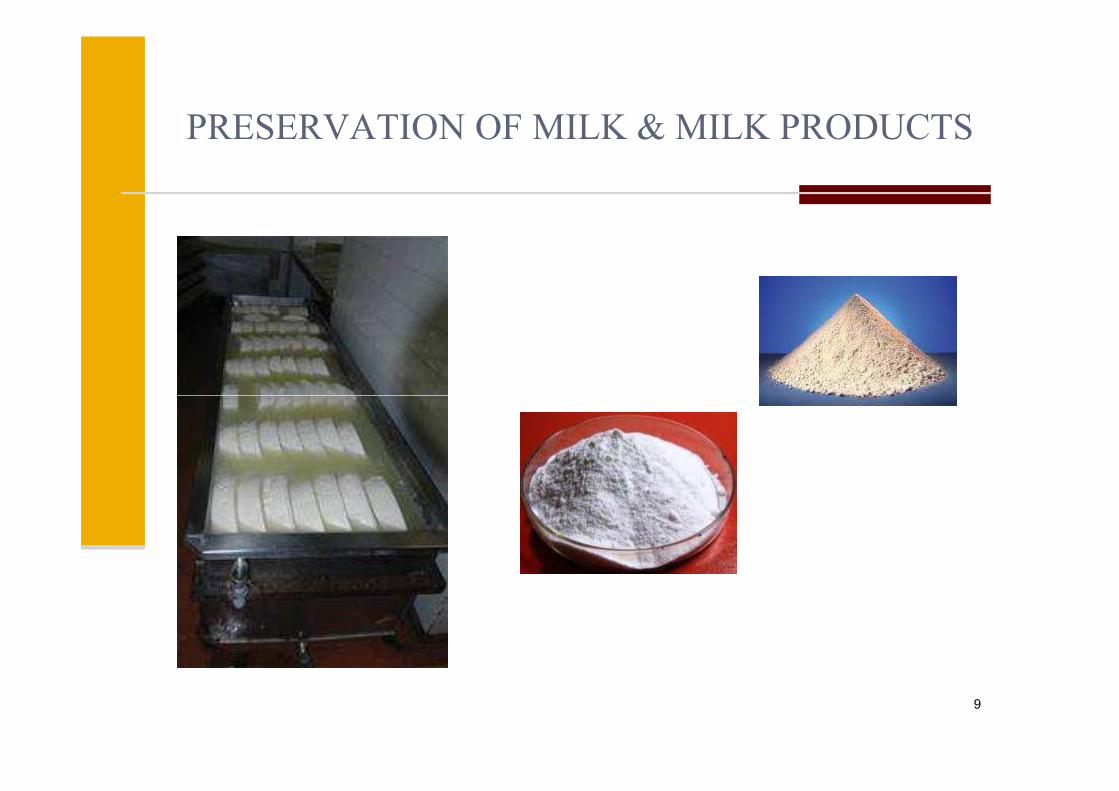
PRESERVATION OF MILK & MILK PRODUCTS
9
PACKAGIING OF MILK & MILK PRODUCTS
10

DAIRY INDUSTRY SCENARIO:INDIA
AND MAHARASHTRA
Dr.D.H.KankhareAssistant Professor
Animal Sci. & Dairy Sci.
College of Agriculture, Dhule
11

1.Livestock Production and livelihood
� Livestock sector : fastest growing sector providing supplementary income for the livelihood of ¾ rural household in our country
� India no.1 milk producer in the world 137.7 million tonnes in 2013-14 (Annual Report, 2014-15, Deptt. Of AH, D & F, MOA,GOI. Pp 4)
� Largest milk producer in the world , is set to produce over 146.3 � Largest milk producer in the world , is set to produce over 146.3 MT during 2014-15 (Annual Report,2014-15, NDDB)
� Dairying is found to provide about 20% of farm employment & about 30 % of family income (Ramswamy, 2000)
� The FAO survey (2003) in India has indicated that if a farmer is having one cow or one buffalo it help to reduce his poverty to the extent of 16 and 24 % respectively. About 43 % ruralhouseholds are malnourished if they do not reared cow / buffaloes
12

� Largest milk producer (146.3 mt in 2014-15)
� India’s share in livestock population in the world
15 % of the total livestock
57.3 % of total buffaloes (105 million) and 14.7% (200 million) of
total cattle.
Share in India GDP :3.6%(13.7% agriculture)
Secondary source of income for 70 million rural households
engaged in dairying. Growth rate of milk production (2013 -14) :3.97 %
Consumer demand rate :5 %
4.38 million women members in dairy cooperatives across the
country as 2011.
13
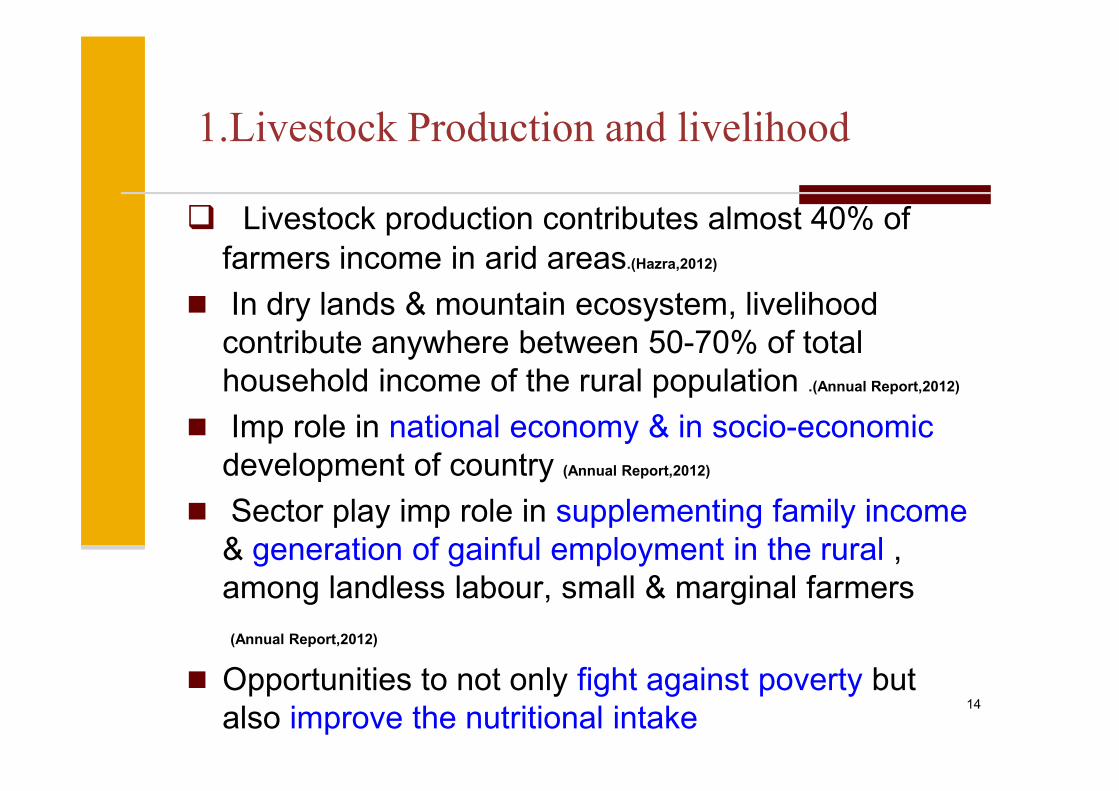
1.Livestock Production and livelihood
� Livestock production contributes almost 40% of
farmers income in arid areas.(Hazra,2012)
� In dry lands & mountain ecosystem, livelihood
contribute anywhere between 50-70% of total
household income of the rural population .(Annual Report,2012)household income of the rural population
� Imp role in national economy & in socio-economic
development of country (Annual Report,2012)
� Sector play imp role in supplementing family income
& generation of gainful employment in the rural ,
among landless labour, small & marginal farmers
(Annual Report,2012)
� Opportunities to not only fight against poverty but
also improve the nutritional intake 14
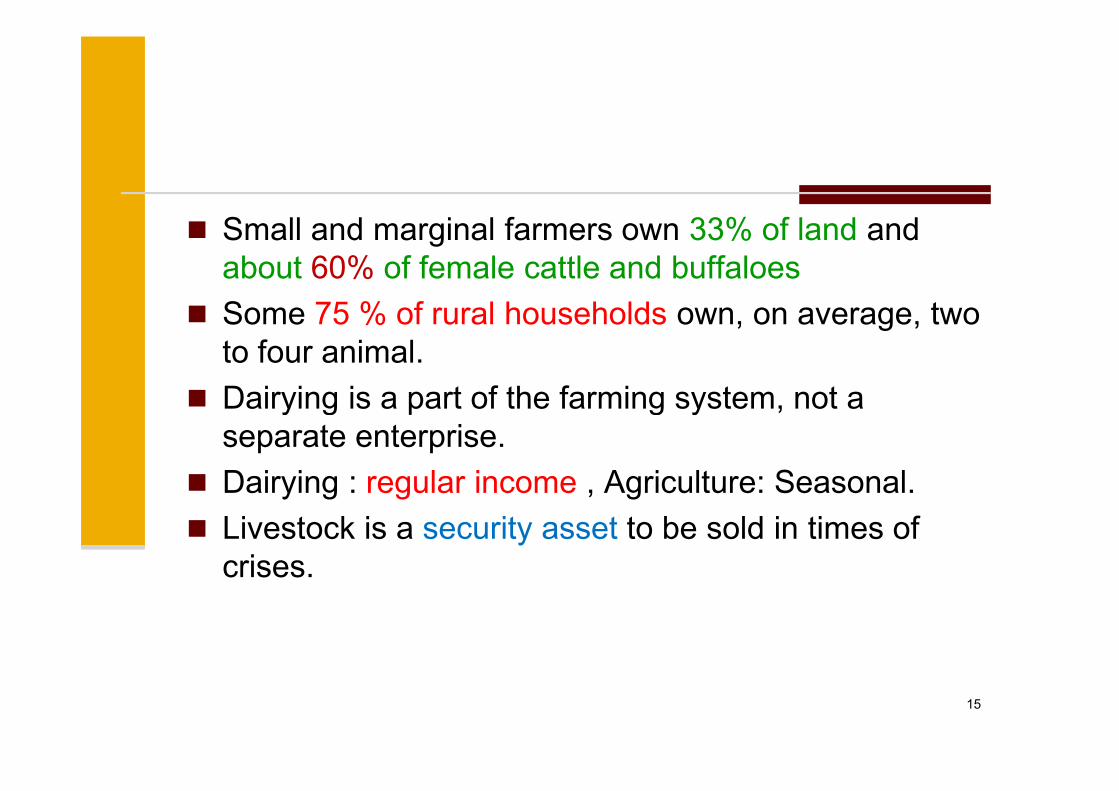
� Small and marginal farmers own 33% of land and
about 60% of female cattle and buffaloes
� Some 75 % of rural households own, on average, two
to four animal.
� Dairying is a part of the farming system, not a � Dairying is a part of the farming system, not a
separate enterprise.
� Dairying : regular income , Agriculture: Seasonal.
� Livestock is a security asset to be sold in times of
crises.
15
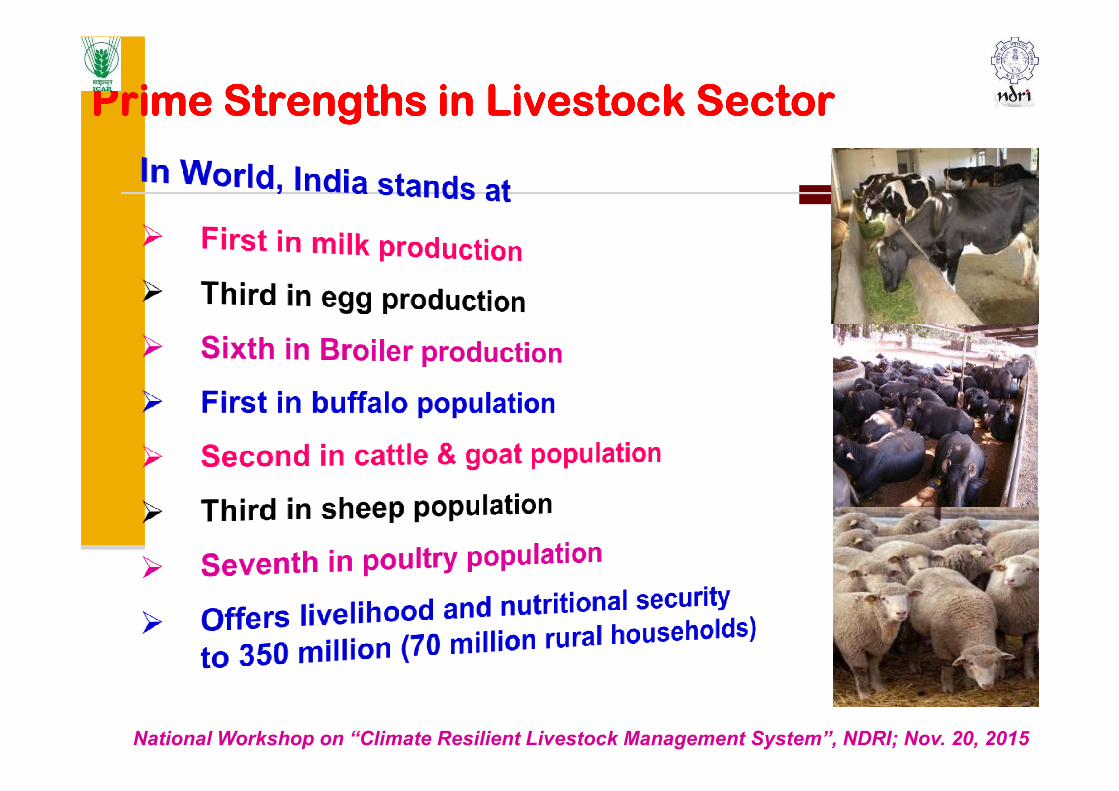
Prime Strengths in Livestock SectorPrime Strengths in Livestock SectorPrime Strengths in Livestock SectorPrime Strengths in Livestock SectorPrime Strengths in Livestock SectorPrime Strengths in Livestock SectorPrime Strengths in Livestock SectorPrime Strengths in Livestock Sector
National Workshop on “Climate Resilient Livestock Management System”, NDRI; Nov. 20, 2015
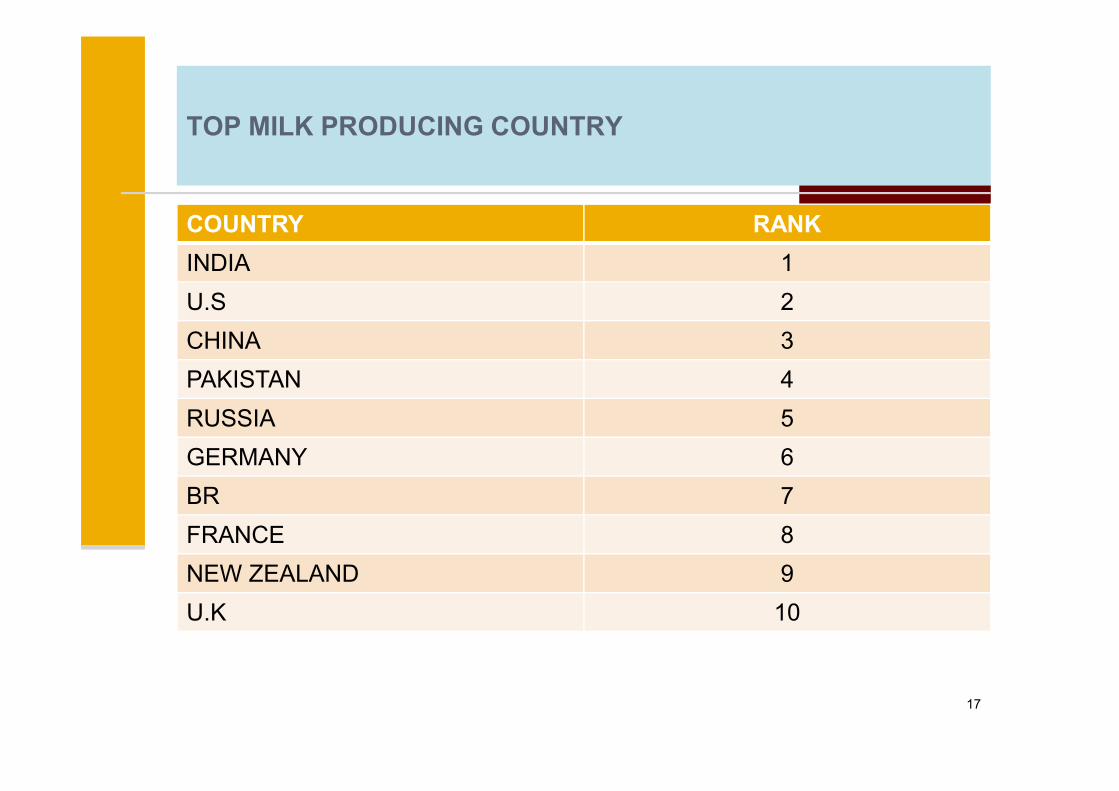
TOP MILK PRODUCING COUNTRY
COUNTRY RANK
INDIA 1
U.S 2
CHINA 3
PAKISTAN 4
RUSSIA 5
GERMANY 6
BR 7
FRANCE 8
NEW ZEALAND 9
U.K 10
17
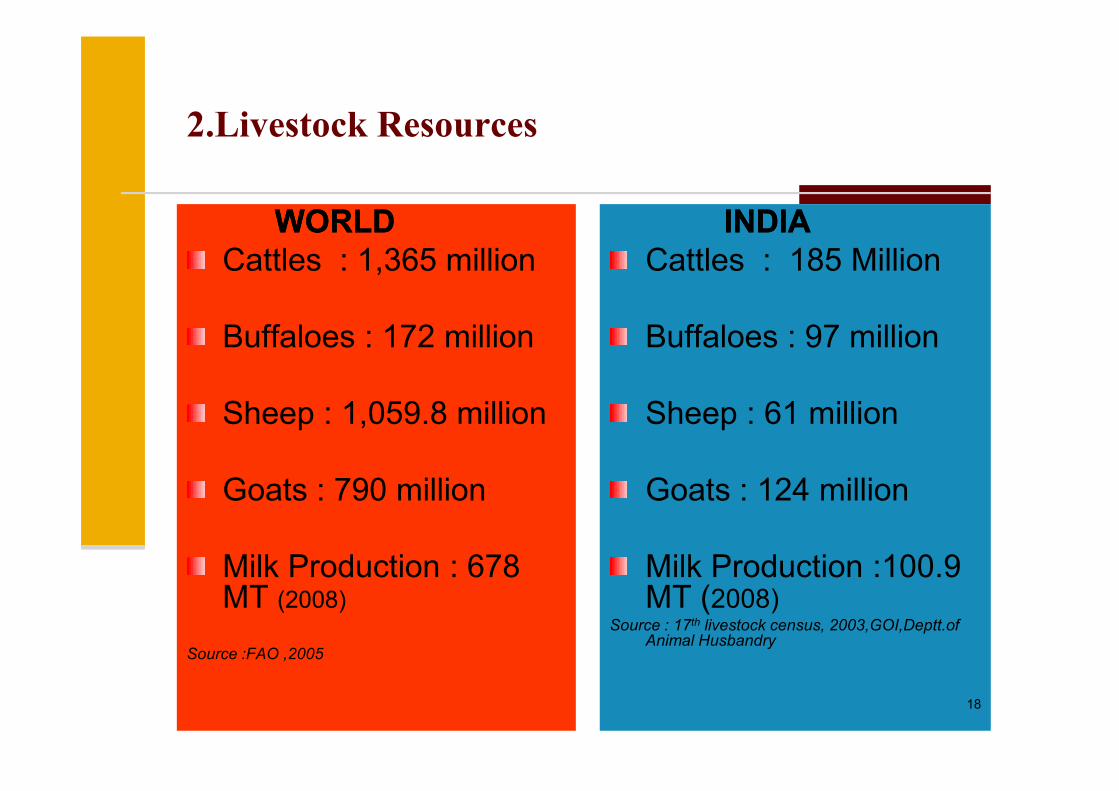
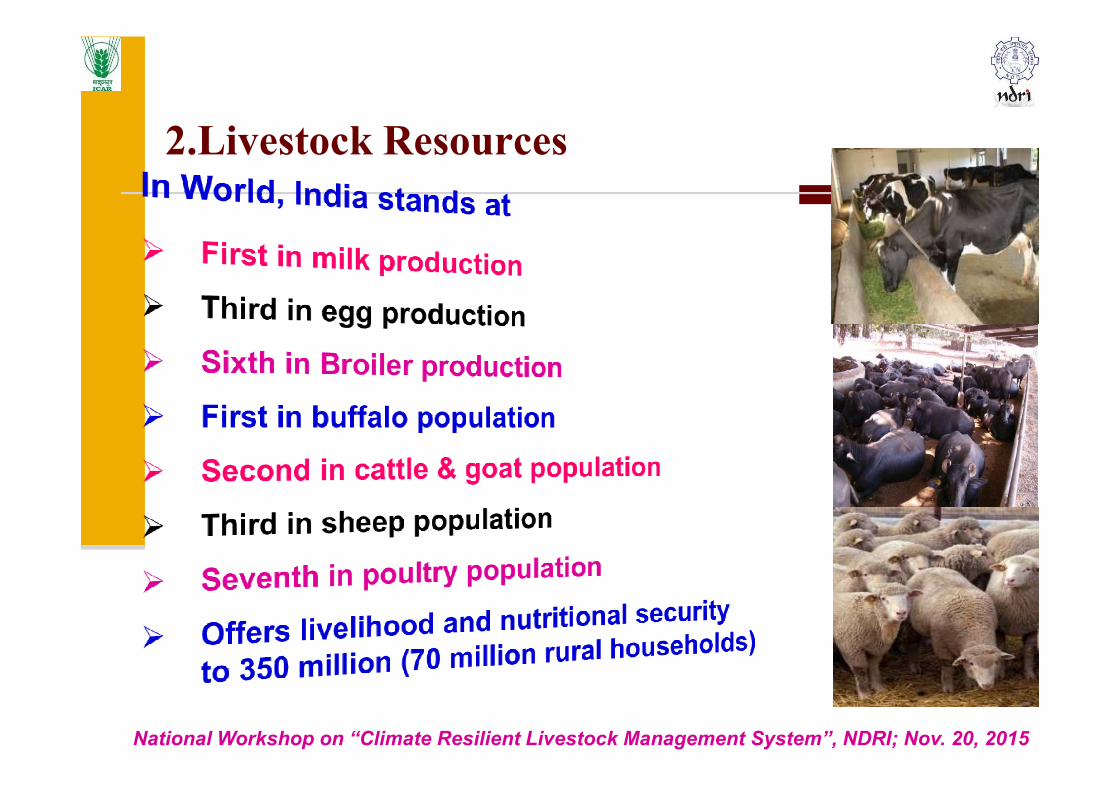
2.Livestock Resources
WORLDWORLD
Cattles : 1,365 million
Buffaloes : 172 million
Sheep : 1,059.8 million
INDIAINDIA
Cattles : 185 Million
Buffaloes : 97 million
Sheep : 61 millionSheep : 1,059.8 million
Goats : 790 million
Milk Production : 678 MT (2008)
Source :FAO ,2005
Sheep : 61 million
Goats : 124 million
Milk Production :100.9 MT (2008)
Source : 17th livestock census, 2003,GOI,Deptt.of Animal Husbandry
18
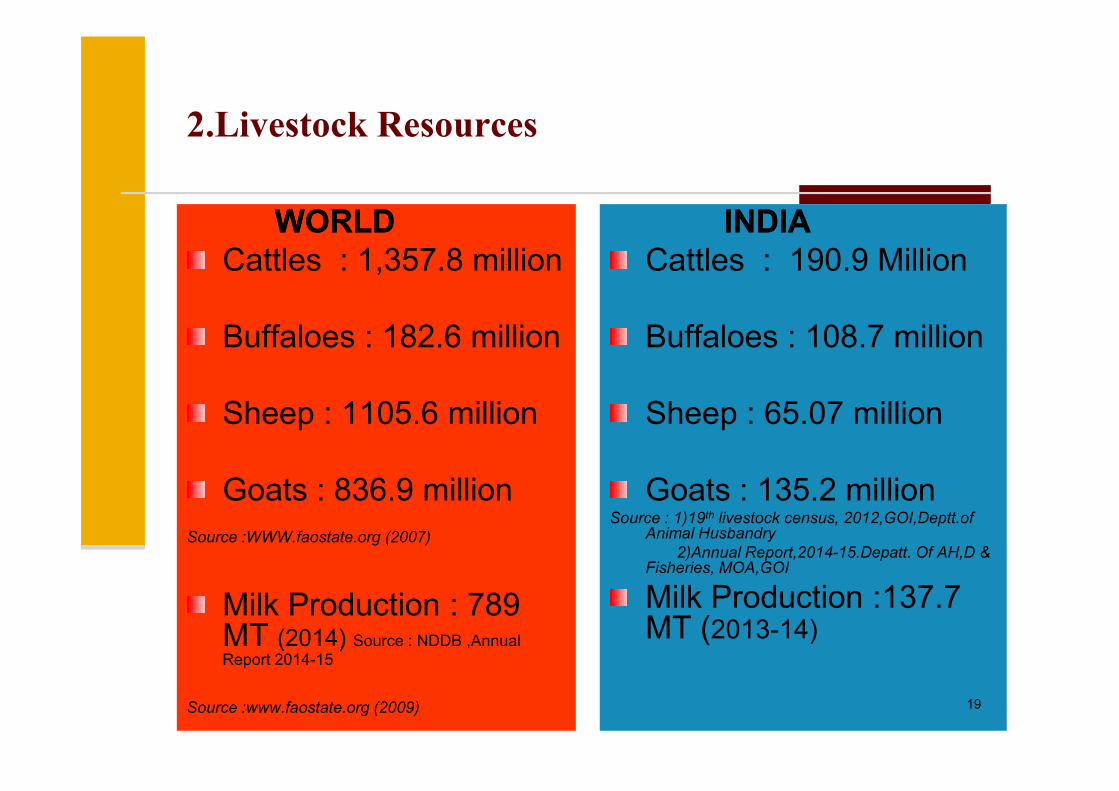
2.Livestock Resources
WORLDWORLD
Cattles : 1,357.8 million
Buffaloes : 182.6 million
Sheep : 1105.6 million
INDIAINDIA
Cattles : 190.9 Million
Buffaloes : 108.7 million
Sheep : 65.07 millionSheep : 1105.6 million
Goats : 836.9 million
Source :WWW.faostate.org (2007)
Milk Production : 789 MT (2014) Source : NDDB ,Annual
Report 2014-15
Source :www.faostate.org (2009)
Sheep : 65.07 million
Goats : 135.2 millionSource : 1)19th livestock census, 2012,GOI,Deptt.of
Animal Husbandry
2)Annual Report,2014-15.Depatt. Of AH,D & Fisheries, MOA,GOI
Milk Production :137.7 MT (2013-14)
19
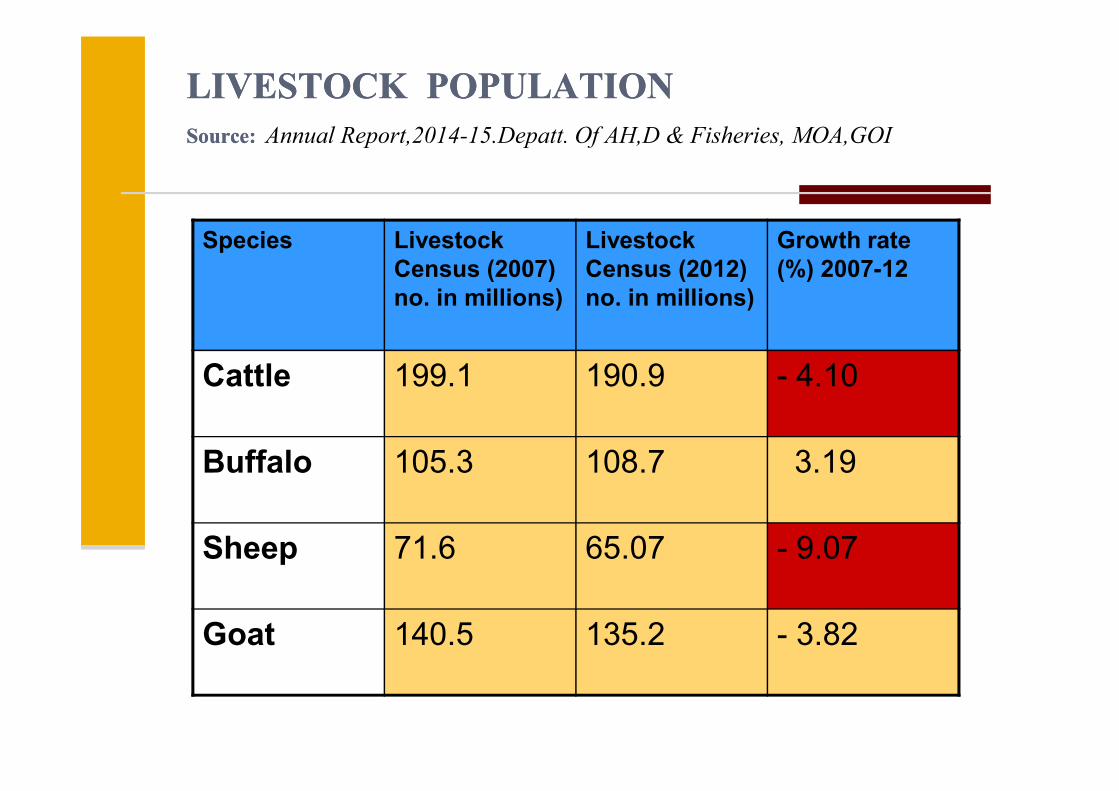
LIVESTOCK POPULATIONLIVESTOCK POPULATION
Source:Source: Annual Report,2014-15.Depatt. Of AH,D & Fisheries, MOA,GOI
Species Livestock
Census (2007)
no. in millions)
Livestock
Census (2012)
no. in millions)
Growth rate
(%) 2007-12
Cattle 199.1 190.9 - 4.10
Buffalo 105.3 108.7 3.19
Sheep 71.6 65.07 - 9.07
Goat 140.5 135.2 - 3.82
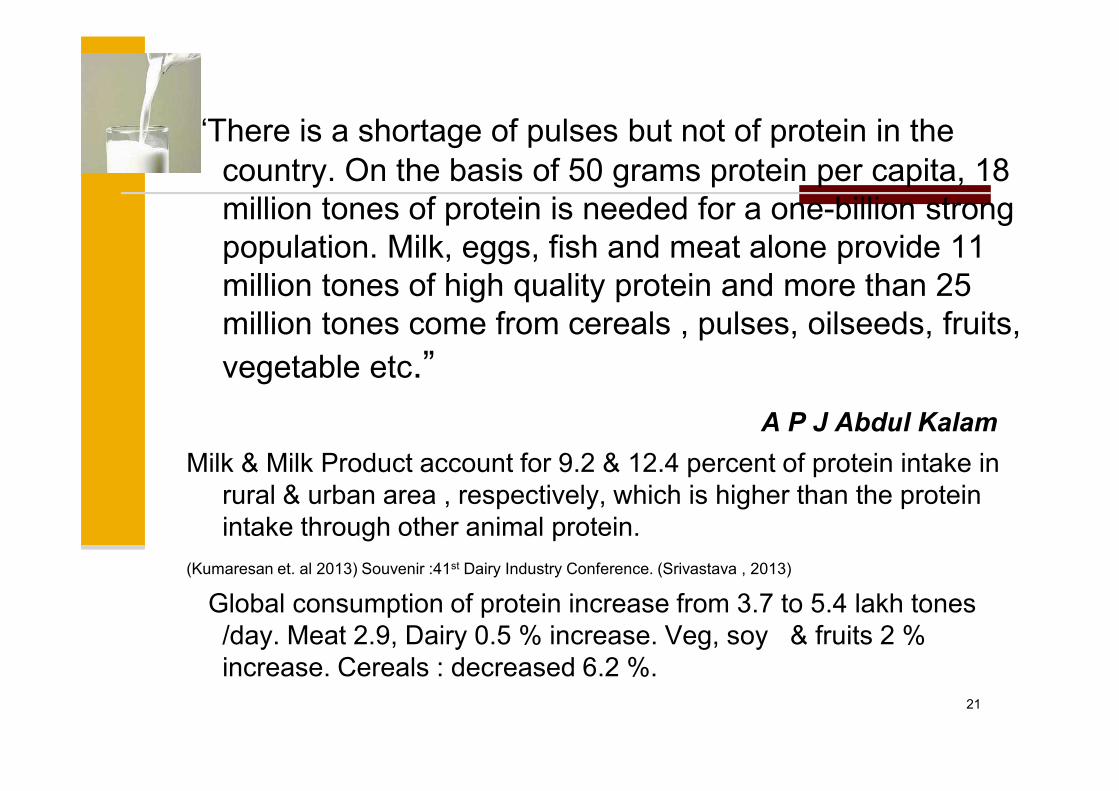
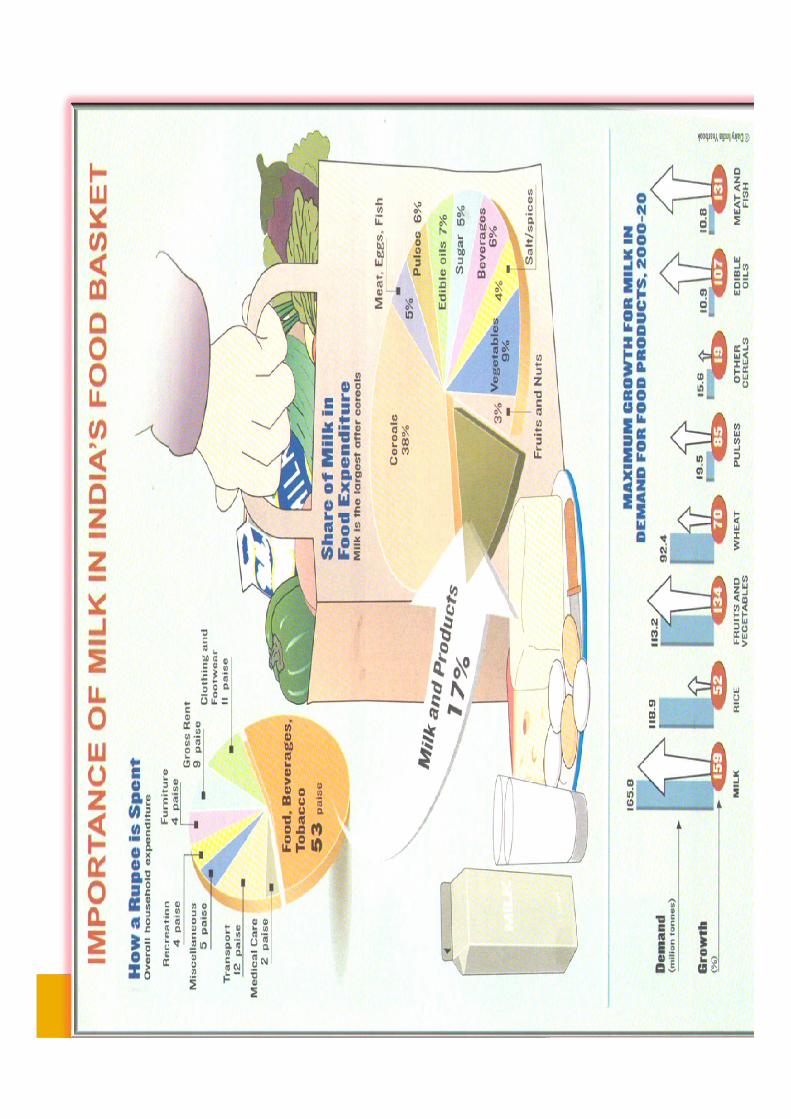
“There is a shortage of pulses but not of protein in the
country. On the basis of 50 grams protein per capita, 18
million tones of protein is needed for a one-billion strong
population. Milk, eggs, fish and meat alone provide 11
million tones of high quality protein and more than 25
million tones come from cereals , pulses, oilseeds, fruits,
vegetable etc.”
A P J Abdul Kalam
Milk & Milk Product account for 9.2 & 12.4 percent of protein intake in
rural & urban area , respectively, which is higher than the protein
intake through other animal protein.
(Kumaresan et. al 2013) Souvenir :41st Dairy Industry Conference. (Srivastava , 2013)
Global consumption of protein increase from 3.7 to 5.4 lakh tones
/day. Meat 2.9, Dairy 0.5 % increase. Veg, soy & fruits 2 %
increase. Cereals : decreased 6.2 %.
21

2.Livestock Resources
India : largest population in the world. It accounts for 56.7 % of
the world buffalo population & 12.7 % of the world cattle
population (FAO,2008)
From 18.7% of worlds bovine population, the country produces
17.6% of worlds total milk production. (Srivastava, 2015.Indian Dairyman, 17.6% of worlds total milk production. (Srivastava, 2015.Indian Dairyman,
IDA Conference, Calcutta 2015.)
2.Livestock Resources
National Workshop on “Climate Resilient Livestock Management System”, NDRI; Nov. 20, 2015
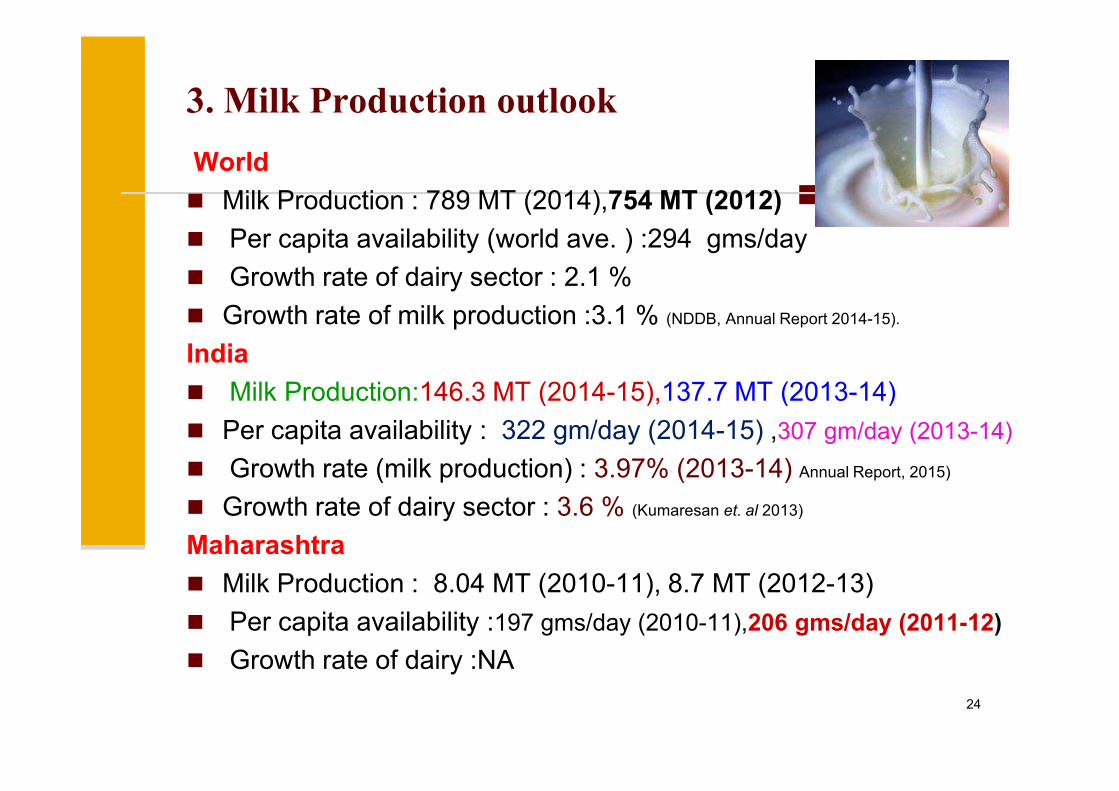
3. Milk Production outlook
World
� Milk Production : 789 MT (2014),754 MT (2012)
� Per capita availability (world ave. ) :294 gms/day
� Growth rate of dairy sector : 2.1 %
� Growth rate of milk production :3.1 % (NDDB, Annual Report 2014-15).
India
� Milk Production:146.3 MT (2014-15),137.7 MT (2013-14)� Milk Production:146.3 MT (2014-15),137.7 MT (2013-14)
� Per capita availability : 322 gm/day (2014-15) ,307 gm/day (2013-14)
� Growth rate (milk production) : 3.97% (2013-14) Annual Report, 2015)
� Growth rate of dairy sector : 3.6 % (Kumaresan et. al 2013)
Maharashtra
� Milk Production : 8.04 MT (2010-11), 8.7 MT (2012-13)
� Per capita availability :197 gms/day (2010-11),206 gms/day (2011-12)
� Growth rate of dairy :NA
24

3. Milk Production outlook
Contribution of species in total milk produce in India
� 53.4 % : Buffalo
� 43.1 % : Cow
� 3.5 % : Other species (mainly goat )
Source : Misra,A.K. (2012). Indian Dairyman.64(2).p 85
� About 35% of milk produced in India is processed.
India contributing about 17.6% of the total world milk
production Source : Srivastava .(2015). Indian Dairyman.67(3).p 40-41
25
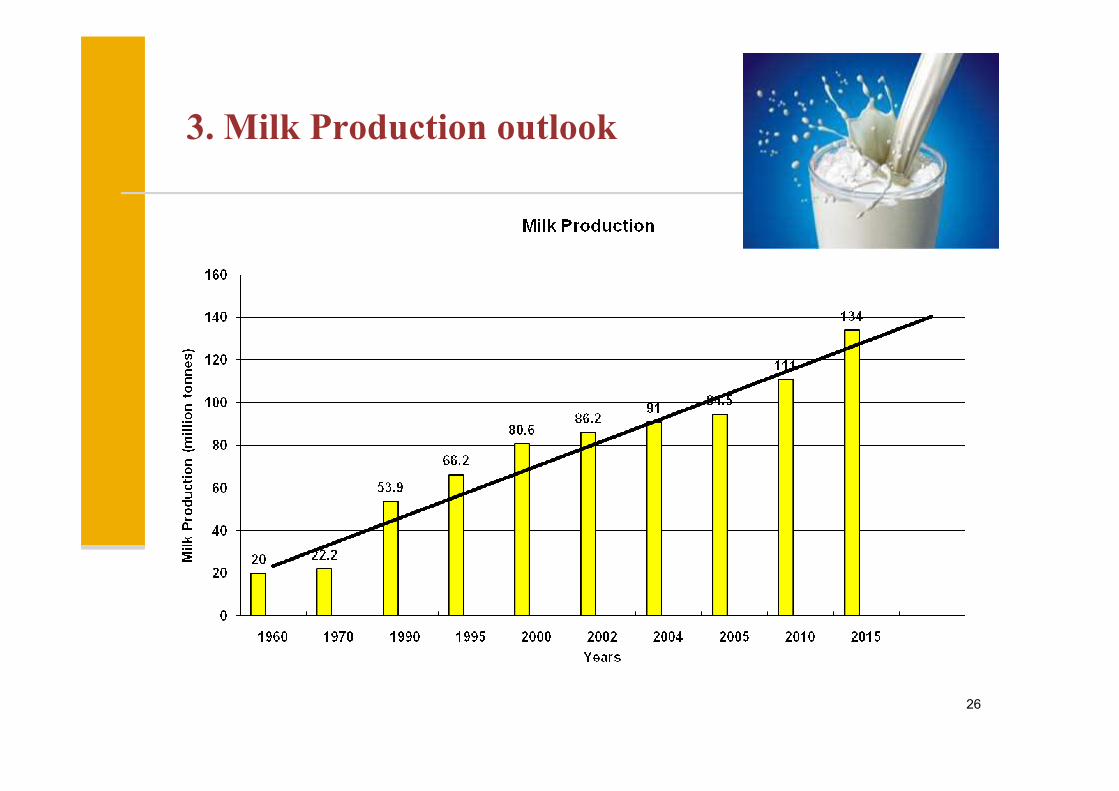
3. Milk Production outlook
26
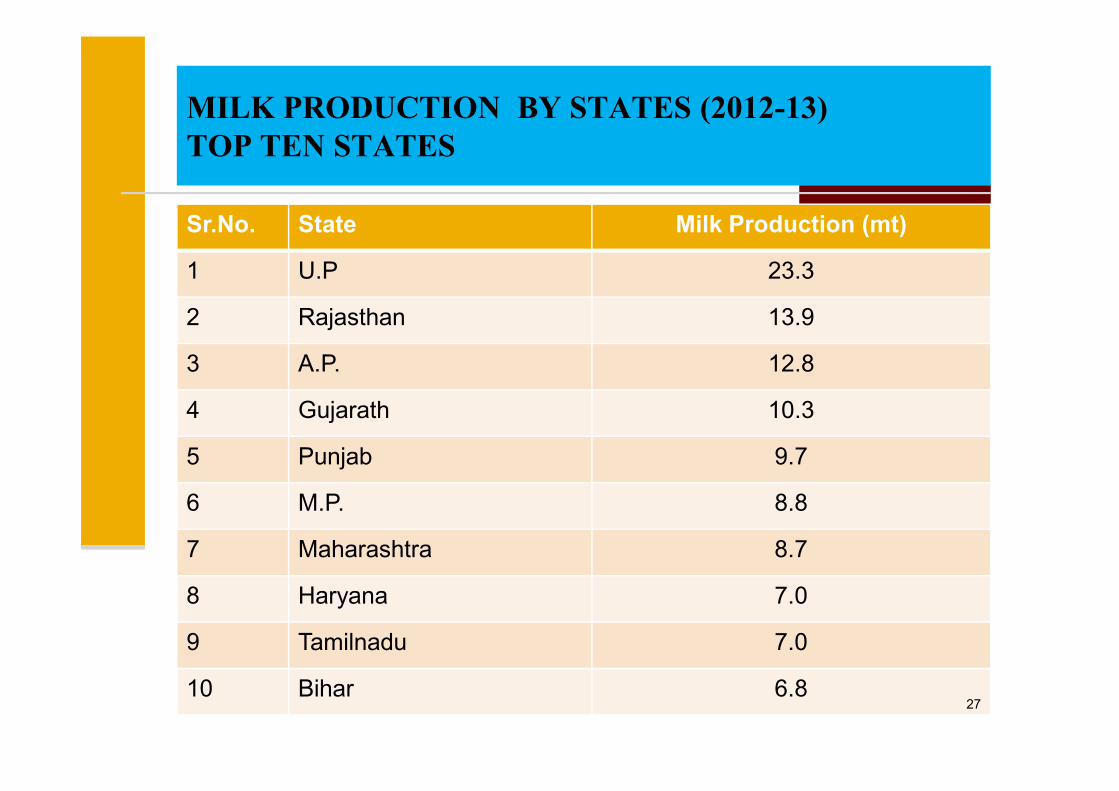
MILK PRODUCTION BY STATES (2012-13)
TOP TEN STATES
Sr.No. State Milk Production (mt)
1 U.P 23.3
2 Rajasthan 13.9
3 A.P. 12.8
4 Gujarath 10.3
5 Punjab 9.7
6 M.P. 8.8
7 Maharashtra 8.7
8 Haryana 7.0
9 Tamilnadu 7.0
10 Bihar 6.827
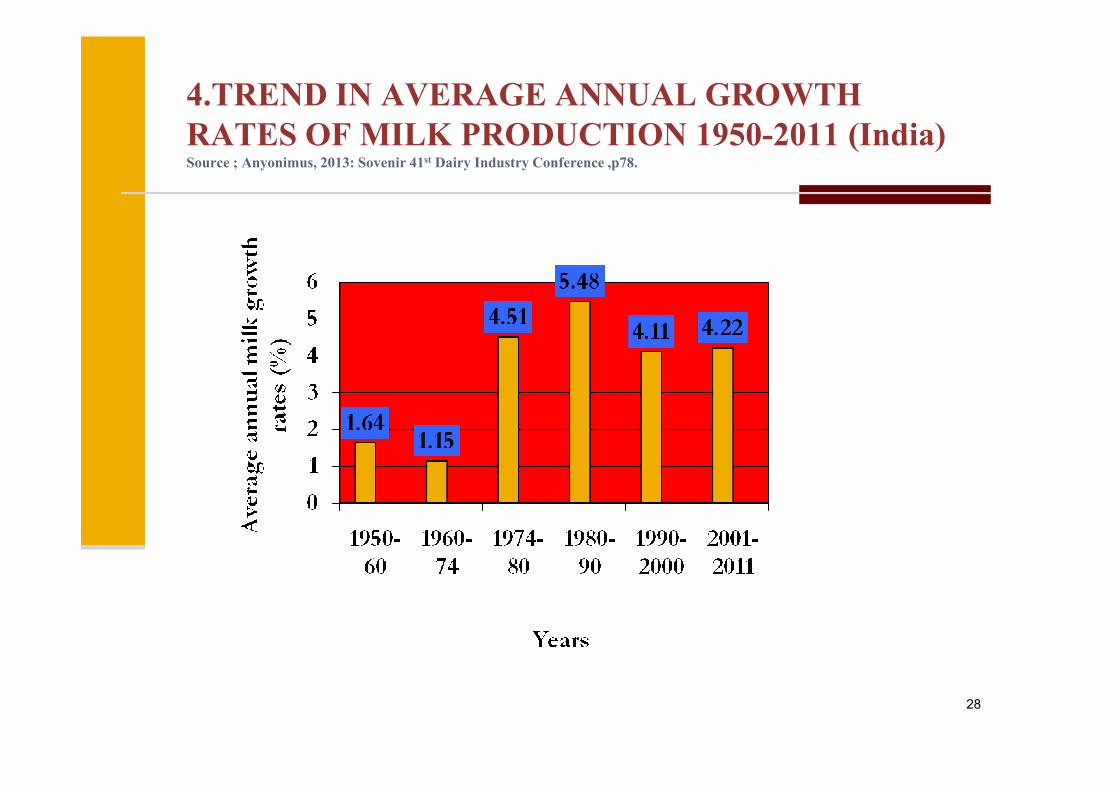
4.TREND IN AVERAGE ANNUAL GROWTH
RATES OF MILK PRODUCTION 1950-2011 (India)Source ; Anyonimus, 2013: Sovenir 41st Dairy Industry Conference ,p78.
28
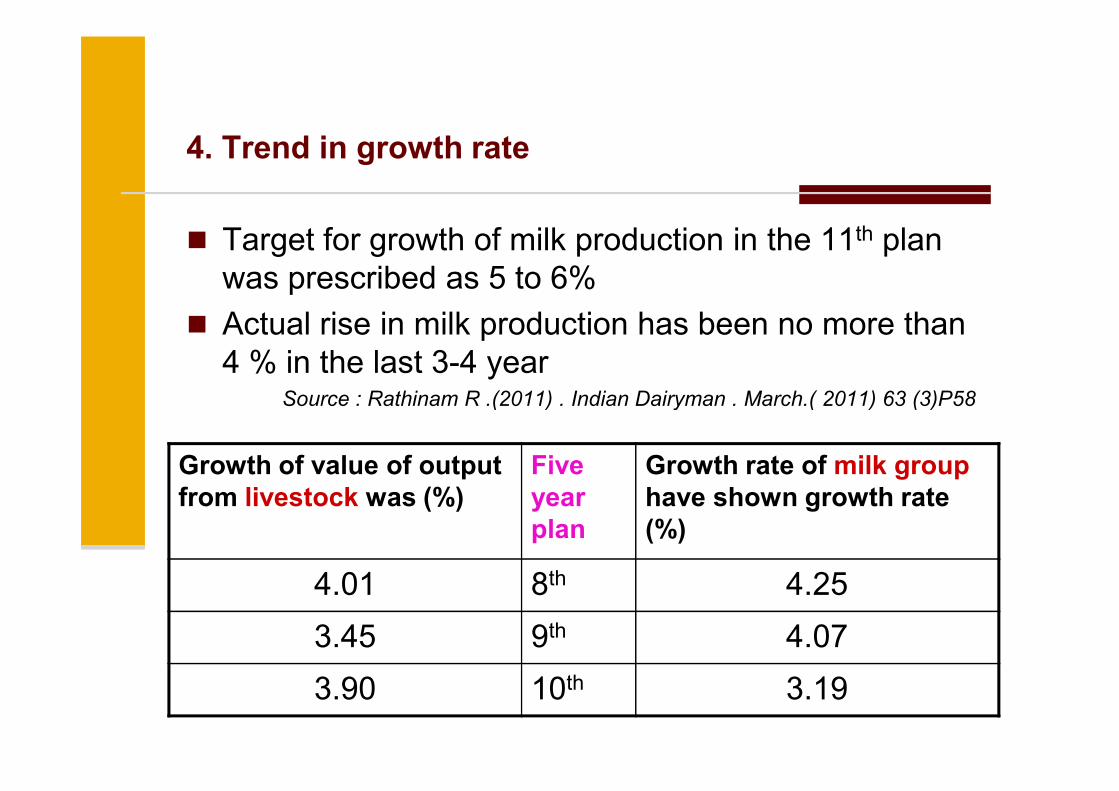
4. Trend in growth rate
� Target for growth of milk production in the 11th plan
was prescribed as 5 to 6%
� Actual rise in milk production has been no more than
4 % in the last 3-4 yearSource : Rathinam R .(2011) . Indian Dairyman . March.( 2011) 63 (3)P58Source : Rathinam R .(2011) . Indian Dairyman . March.( 2011) 63 (3)P58
Growth of value of output
from livestock was (%)
Five
year
plan
Growth rate of milk group
have shown growth rate
(%)
4.01 8th 4.25
3.45 9th 4.07
3.90 10th 3.19
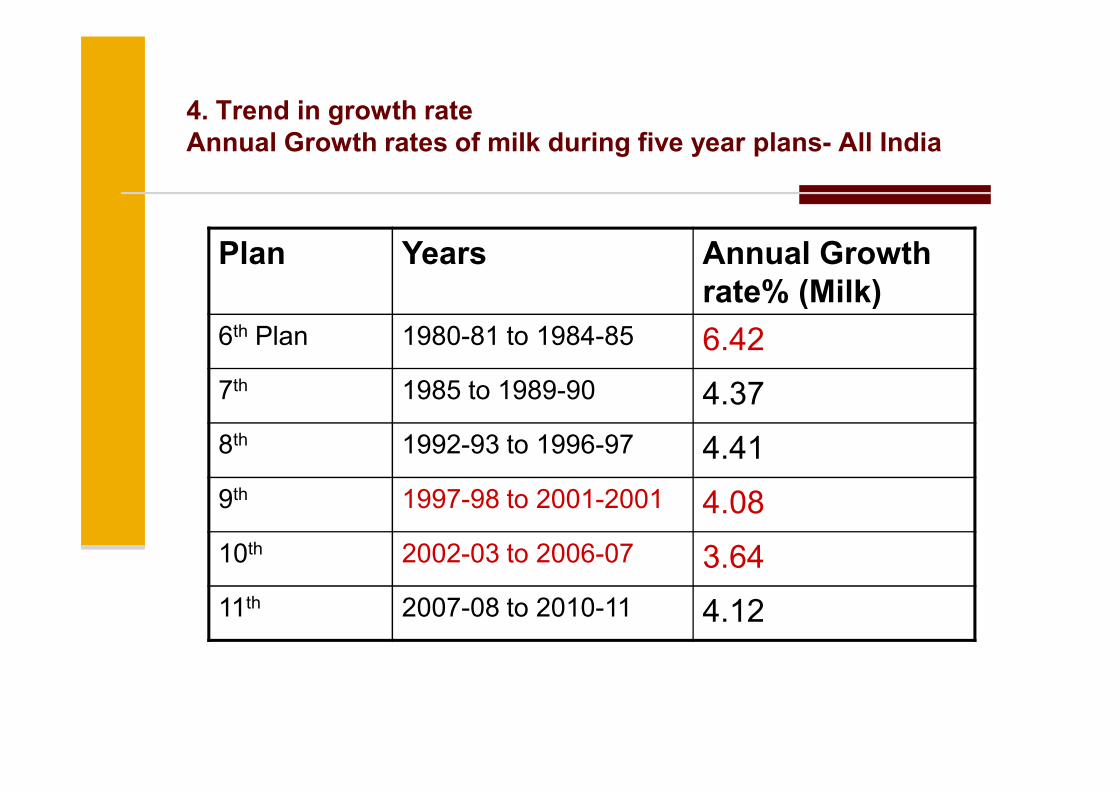
4. Trend in growth rate
Annual Growth rates of milk during five year plans- All India
Plan Years Annual Growth
rate% (Milk)
6th Plan 1980-81 to 1984-85 6.42
7th 1985 to 1989-90 4.377 1985 to 1989-90 4.37
8th 1992-93 to 1996-97 4.41
9th 1997-98 to 2001-2001 4.08
10th 2002-03 to 2006-07 3.64
11th 2007-08 to 2010-11 4.12
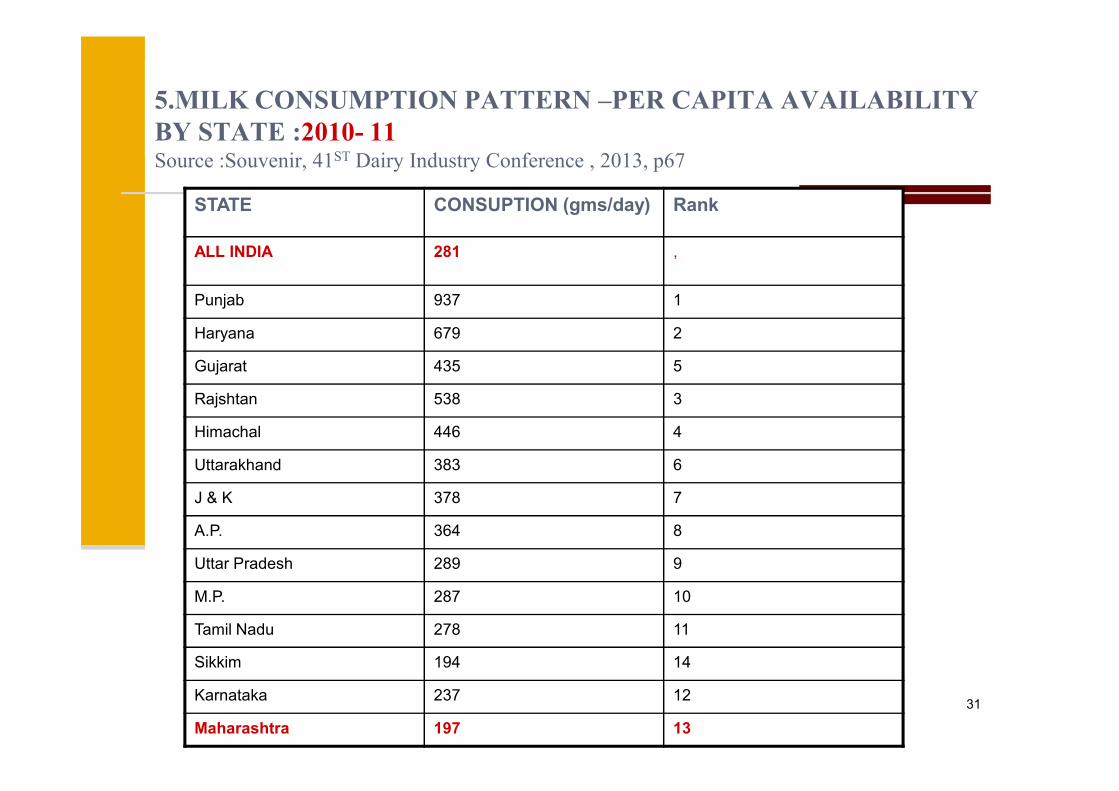
5.MILK CONSUMPTION PATTERN –PER CAPITA AVAILABILITY
BY STATE :2010- 11Source :Souvenir, 41ST Dairy Industry Conference , 2013, p67
STATE CONSUPTION (gms/day) Rank
ALL INDIA 281 ,
Punjab 937 1
Haryana 679 2
Gujarat 435 5
Rajshtan 538 3Rajshtan 538 3
Himachal 446 4
Uttarakhand 383 6
J & K 378 7
A.P. 364 8
Uttar Pradesh 289 9
M.P. 287 10
Tamil Nadu 278 11
Sikkim 194 14
Karnataka 237 12
Maharashtra 197 13
31

6. MILK UTILIZATION PATTERN :Technology of Indian Milk Products :By Aneja et al ,2000
Liquid Milk 46 %
Ghee/Butter 33 %
Curd/Dahi 7 %Curd/Dahi 7 %
Khoa 7 %
Chhana/Paneer 3 %
Western Products
(Powder,Cheese)
4 %
32
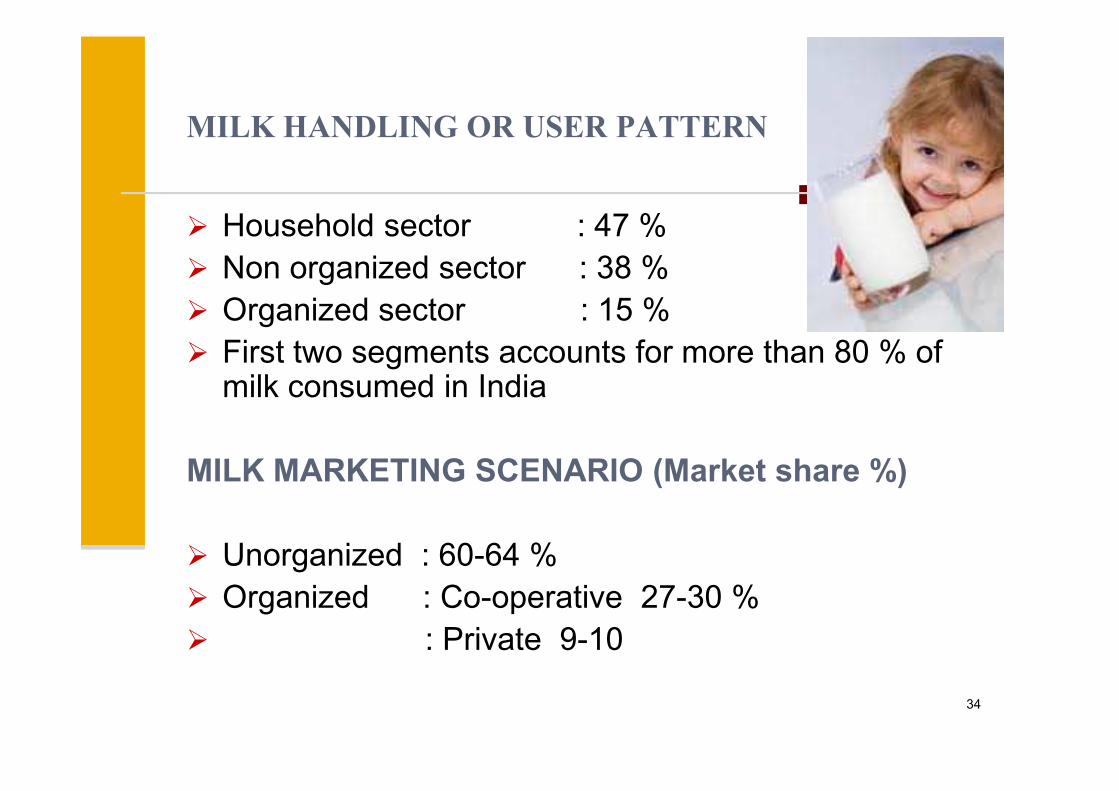
MILK HANDLING OR USER PATTERN
� Household sector : 47 %
� Non organized sector : 38 %
� Organized sector : 15 %
� First two segments accounts for more than 80 % of milk consumed in Indiamilk consumed in India
MILK MARKETING SCENARIO (Market share %)
� Unorganized : 60-64 %
� Organized : Co-operative 27-30 %
� : Private 9-10
34
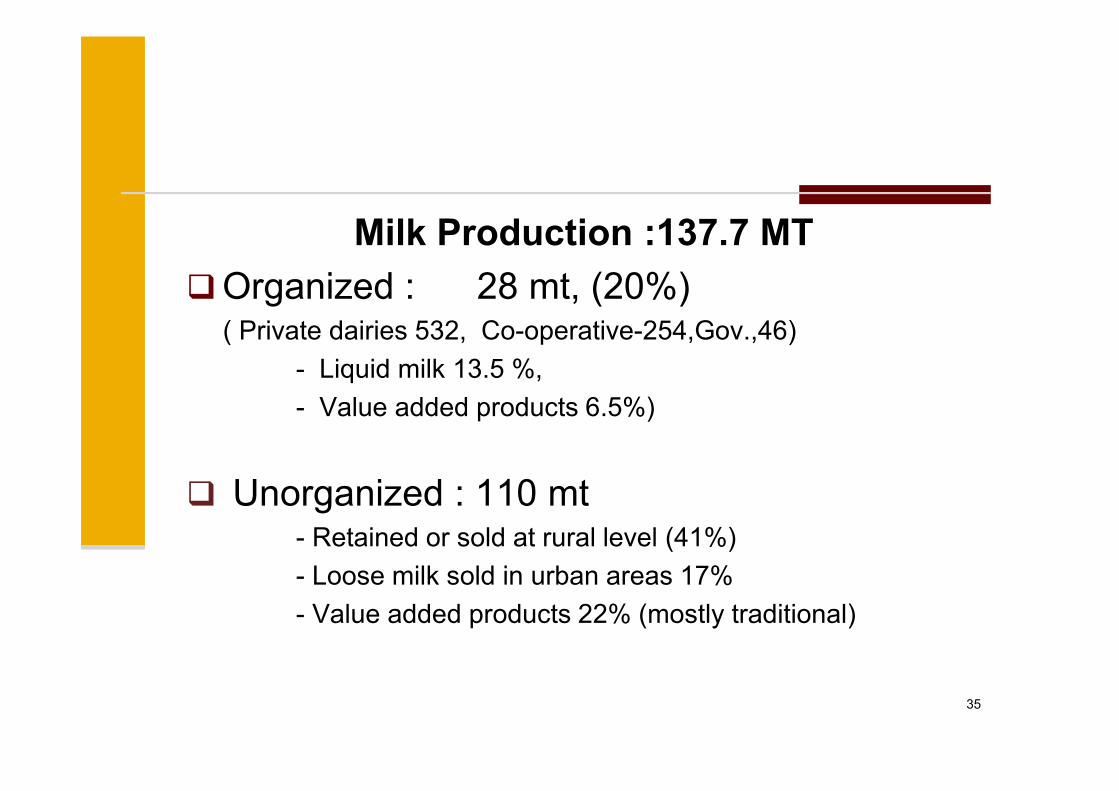
Milk Production :137.7 MT
�Organized : 28 mt, (20%)( Private dairies 532, Co-operative-254,Gov.,46)
- Liquid milk 13.5 %,
- Value added products 6.5%)- Value added products 6.5%)
� Unorganized : 110 mt- Retained or sold at rural level (41%)
- Loose milk sold in urban areas 17%
- Value added products 22% (mostly traditional)
35
7. MILK PROCESSING FACILITY
Current processing capacity 100 Million LPD
Capacity utilization : 65 – 68 %
Only 35 % is processed in country
36
8. Share of Agriculture and livestock sector in
GDP
Share of Agriculture in GDP : 15.18 (2009-10),15.28 % (2010-11), 15.18 (2011-12)
Share of Livestock sector in Agril GDP : 23.80 % (2010-11)
Share of Livestock sector in GDP : 3.64 % (2010-11),3.92(2011-12
Share of milk industry in Livestock sector GDP: 70%
(Source: National Accounts Division,
Central Statistical Office, M/O Statistics & Programme Implementation)
GROWTH RATE
Growth rate of Indian economy : %
Growth rate of Indian agriculture : %
Growth rate of livestock sector : 4%
37
� According to estimate of CSO , the gross
value added from livestock sector at current
price was about Rs 4,06,035 cr during 2013-
14 which is about 21.58 % of the gross value
added from total agriculture, forestry & fishing added from total agriculture, forestry & fishing
sector.
� Livestock sector is contributing about 3.88%
of total gross value added of the country at
current price
Source:Source: Annual Report,2014-15.Depatt. Of AH,D & Fisheries, MOA,GOI
38

9. EXPORT & IMPORT OF DAIRY PRODUCTS
Export : Skim milk powder (SMP) , Whole milk
powder (WHP) , Butter oil , Traditional dairy products
( shrikhand, gulabjamun, rasogolla)
Import : SMP, Butter oil
India's share in global milk export is merely 1.5 % in India's share in global milk export is merely 1.5 % in
2010 whereas its share in the milk imports is 1.8%
SMP accounted for the highest share of 44.07 in
India's dairy export in 2010
Asia & African countries remain the major
destination for India's dairy export
UAE largest importer of Indian dairy produce 18.5%
& Bangladesh 14.6% Source: Joshi, M.K.(2012).Indian Dairyman.64(2) . P133-134 39
� India's Export of Dairy products was 66,424.34 MT to
the world for the worth of Rs. 1,205.38 crores during
the year 2014-15.
� Major Export Destinations (2014-15) : Bangladesh,
United Arab Emirates, Pakistan, Nepal and Bhutan. United Arab Emirates, Pakistan, Nepal and Bhutan. (Source: APEDA Report ,2014-15 )
40
10. Employment generation
� Provide large self employment , opportunities.
� Total no of workers in usual status ,engaged in farming of
animals were 14.9 million in rural and urban areas combine(Source : NSS 66th round July 2009-June2010. )
� The livestock activities , among which dairy farming
predominates, employ about 8.5 million worker i.e.8 % of the
total labour force in the country. Women's constitutes about 71 total labour force in the country. Women's constitutes about 71
% of the labour force in livestock sector, where as in crop
farming they constitute only 33 % of the work forces.
(Source: Kumaresan et. al 2013) Souvenir :41st Dairy Industry Conference.)
41
11.Value of output
� According to CSO, the value of out put from livestock
& fisheries sector together at current price was) Rs.4,61,434 crore (2010-11)
Rs.4,59,051 crore (2011-12)
This is about 24.8% of the value of output from total agricultural
& allied sector at current price.
� Rs. 3,88,370 crore for livestock sector (at current price during
2010-11) which is about 23.9% of the value of output of
16,23,968 crore from total agricultural & allied sector.
� Rs. 3,05,484 crore for livestock sector (at current price during
2011-12).
42
12. Milk contribution
� The contribution of milk alone (Rs. 2, 62,214.51 crore) was
higher than paddy (Rs. 1,51,634 crore), wheat (Rs. 99,667
crore) and sugarcane (Rs 58, 470 crore) during 2010-11. The
value of output from meat group as per estimates of Central
Statistics Office (CSO) at current prices in 2010-11 was`
72,444.22 crore.
� The value of output of milk is 3,05,484 crore in 2011-12 , which
is higher than the value of output of paddy & wheat. (Annual Report,2012-13, Deptt. Of AH, D & F, MOA,GOI
43
13. Export Earning
� Total earning from livestock, poultry and related
products was Rs. 25,408.86 crore during 2010-11
44
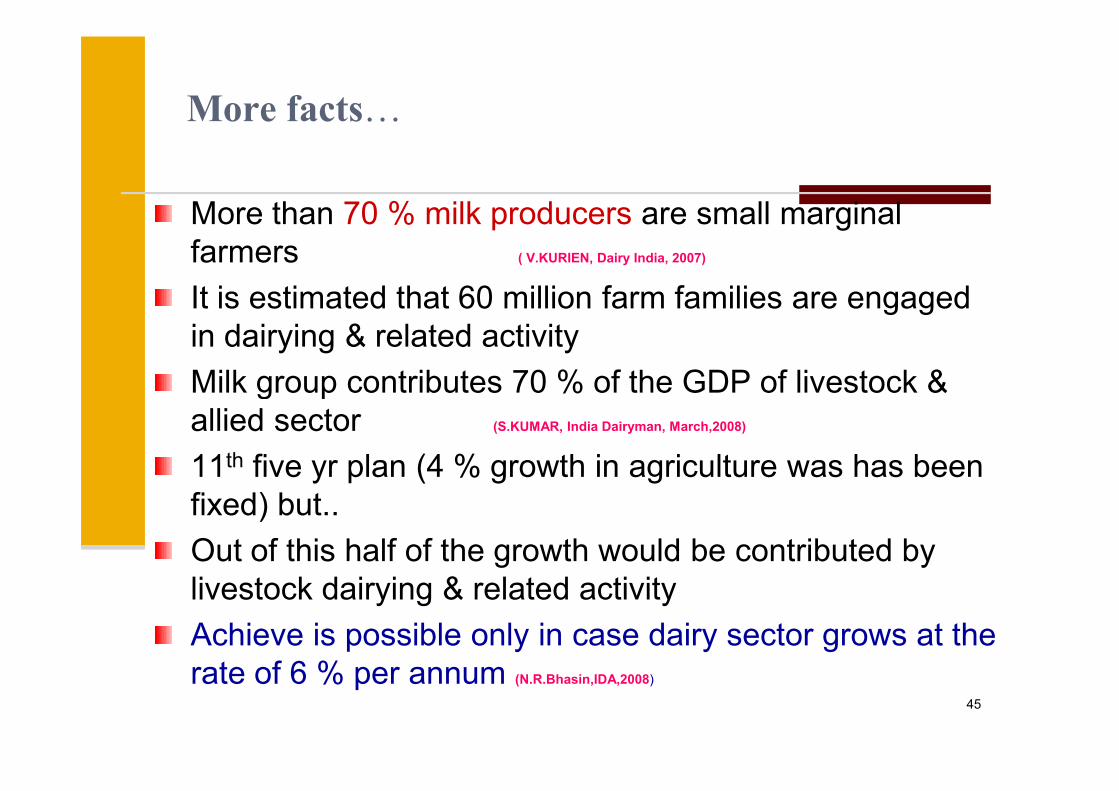
More facts…
More than 70 % milk producers are small marginal
farmers ( V.KURIEN, Dairy India, 2007)
It is estimated that 60 million farm families are engaged
in dairying & related activity
Milk group contributes 70 % of the GDP of livestock & Milk group contributes 70 % of the GDP of livestock &
allied sector (S.KUMAR, India Dairyman, March,2008)
11th five yr plan (4 % growth in agriculture was has been
fixed) but..
Out of this half of the growth would be contributed by
livestock dairying & related activity
Achieve is possible only in case dairy sector grows at the
rate of 6 % per annum (N.R.Bhasin,IDA,2008)
45
Rapidly growing domestic demand …
Milk production will have to grow from 100 MT to about 180 MT by 2021-22.
This is a challenge because milk production which has been growing annually on an average at 2.5 MT for the last 15 yrs will have to double i.e. increase by has been growing annually on an average at 2.5 MT for the last 15 yrs will have to double i.e. increase by 5 MT annually
This is possible only through increasing the productivity of our milch animals & achieving greater efficiency and lower transaction costs along the supply chain i.e. milk collection, processing product manufacturing & marketing
Source: Keynote Address by Miss Amrita Patel, Chairman, NDDB in Dairy Industry Conference,2008.
46
� The demand of milk & milk products in India is Projected to
increase to 142.9 million tonnes in 2015 & further to 191.3
million tonnes in 2020.
� At the existing rate of growth in milk production , in next ten
years supply is likely to fall short of the demand.
� For tapping the economic benefits of growing global demand of � For tapping the economic benefits of growing global demand of
milk & milk products, Indian dairy sector has to be geared
towards increasing milk production at the rate close to 7 % as
against the present 4 percent.
(Source : Srivastava, A.K. (2013) Indian
Dairyman, May , 2013 Vol 65, No. 05, p36)
INDIANINDIAN DAIRYDAIRY : : THE CONTRADICTIONTHE CONTRADICTION
48
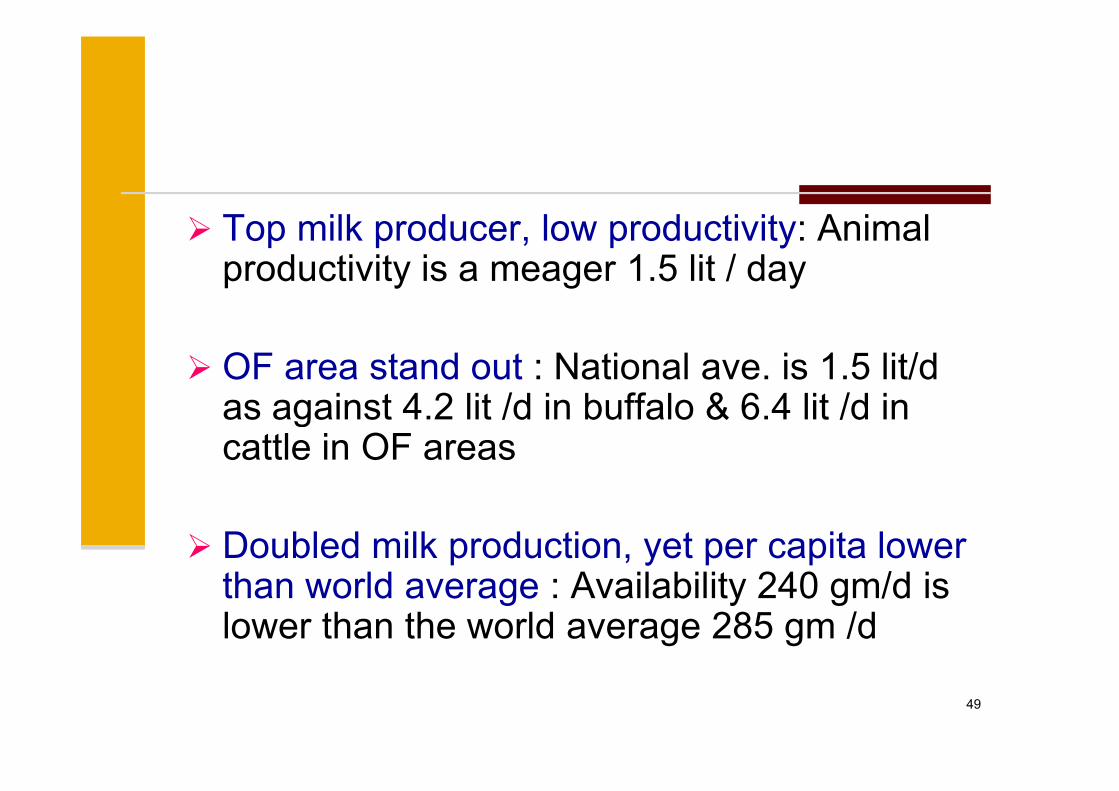
� Top milk producer, low productivity: Animal productivity is a meager 1.5 lit / day
� OF area stand out : National ave. is 1.5 lit/d as against 4.2 lit /d in buffalo & 6.4 lit /d in as against 4.2 lit /d in buffalo & 6.4 lit /d in cattle in OF areas
� Doubled milk production, yet per capita lower than world average : Availability 240 gm/d is lower than the world average 285 gm /d
49
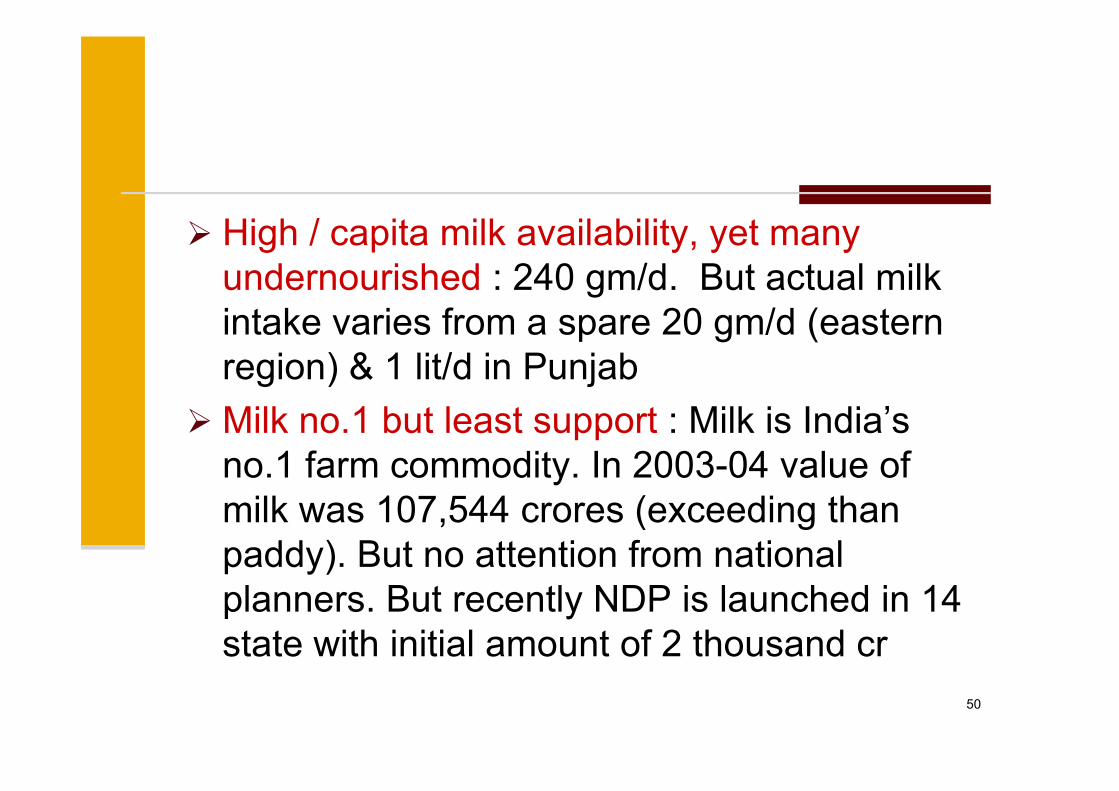
� High / capita milk availability, yet many
undernourished : 240 gm/d. But actual milk
intake varies from a spare 20 gm/d (eastern
region) & 1 lit/d in Punjab
� Milk no.1 but least support : Milk is India’s
no.1 farm commodity. In 2003-04 value of
milk was 107,544 crores (exceeding than
paddy). But no attention from national
planners. But recently NDP is launched in 14
state with initial amount of 2 thousand cr
50
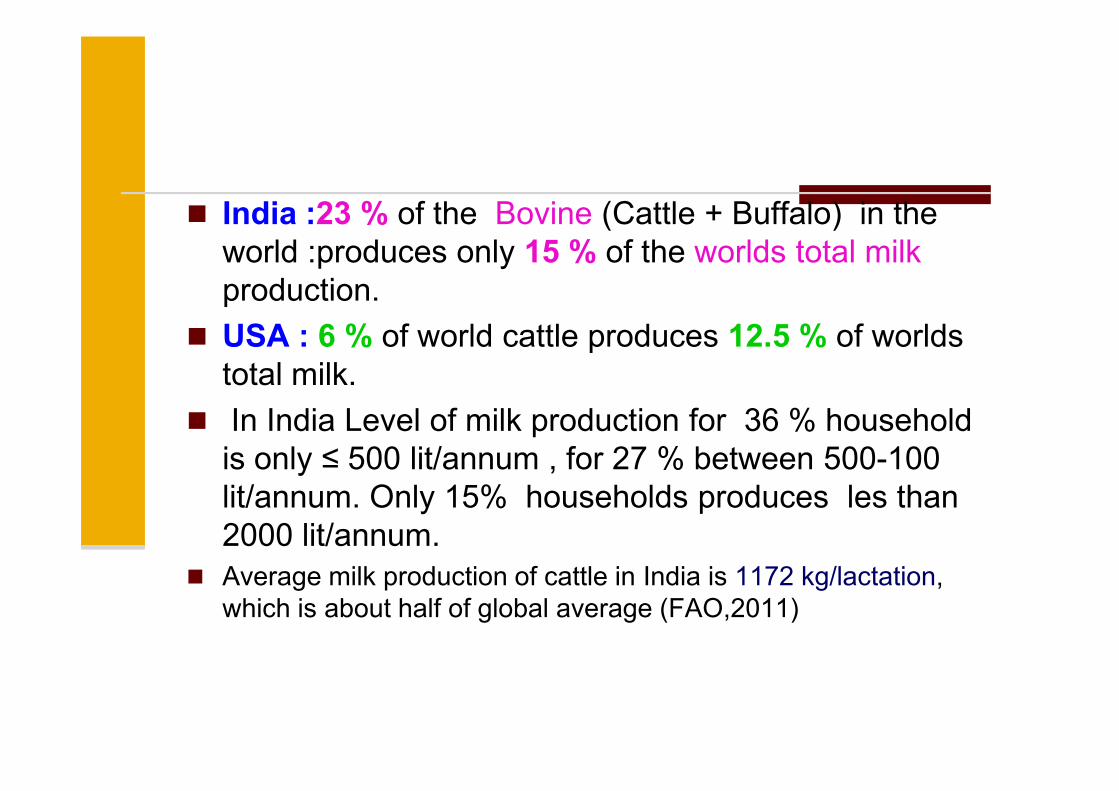
� India :23 % of the Bovine (Cattle + Buffalo) in the
world :produces only 15 % of the worlds total milk
production.
� USA : 6 % of world cattle produces 12.5 % of worlds
total milk.
� In India Level of milk production for 36 % household
is only ≤ 500 lit/annum , for 27 % between 500-100
lit/annum. Only 15% households produces les than
2000 lit/annum.
� Average milk production of cattle in India is 1172 kg/lactation,
which is about half of global average (FAO,2011)

Thank you…
52
Thank you…

““Eight hours for dairy, Eight hours for family and Eight hours for dairy, Eight hours for family and
Eight hours for sleep”Eight hours for sleep”Eight hours for sleep”Eight hours for sleep”
- Dr. Verghese Kurien
Thank you
53

54