Embed Size (px)
Citation preview
67
FACTORS AFFECTING CONSUMER EVALUATIONS OF
BRAND EXTENSIONS
ÖZGE SIĞIRCI A. MÜGE YALÇIN MarmaraUniversity MarmaraUniversity
ABSTRACT
Thepurposeofthestudyistoexaminetheeffectsofrelevancyofparentbrandspecificassociations(PBSA)totheextension,fit(Ft)betweentheparentbrand(PB)andtheextension,familiarity(Fml)withthePB,consumerattitudestowardPB,andconsumerinnovativeness(CI)onconsumerevaluationsofbrandextensions(BE’s).TwopretestsareconductedtofindoutthePBSAandtodefinethehypotheticalBE’s.Followingthepretests,questionnairesregardingtheimpactofthefiveindependentvariableson consumers’ evaluation of the hypotheticalBE’s are administered to 504 respondents by usingconveniencesampling.“FtbetweenPBandtheextension’isfoundtobethemostimportantfactoraffectingconsumerevaluations.“Consumerattitudes towardPB”and“relevancyofPBSA’s”arefoundtohaveaneffectonconsumerevaluations,too.Although,correlationanalyseshaveshownthatthereisarelationshipbetween“FmlwiththePB”,“CI”andconsumerevaluations,nodirecteffectisfoundinregressionanalysis.
Key words: brand extension (BE), parent brand specific associations (PBSA), fit (Ft), familiarity (Fml), consumer
innovativeness (CI).
MARKA GENİŞLEMELERİNDE TÜKETİCİ DEĞERLENDİRMELERİNİ ETKİLEYEN FAKTÖRLER
ÖZETÇalışmanınamacı,anamarkaçağrışımlarınınmarkauzantısı ileuygunluğu,anamarkavemarkauzantısı arasındaki benzerlik, anamarka aşinalığı, anamarkaya karşı tüketici tutumu ve tüketiciyenilikçiliğinin marka uzantılarında tüketici değerlendirmeleri üzerindeki etkilerini incelemektir.Tüketicizihnindekianamarkaçağrışımlarınıbelirleyebilmekvevarsayımsalmarkauzantılarıtespitedebilmekamacıylaikiönçalışmayapılmıştır.Önçalışmalarınardından,beşbağımsızdeğişkenintüketicilerinvarsayımsalmarkauzantısınayönelikdeğerlendirmelerininederecedeetkilediğiniölçenanketlerkolaydaörneklemyöntemiylebelirlenen504kişiyeuygulanmıştır.Geçmişçalışmalardaolduğugibibuaraştırmadada,tüketicideğerlendirmelerinietkileyenenönemliunsurunanamarkaveuzantıarasındaki‘benzerlik’olduğubulunmuştur.Anamarkayakarşıtutumveanamarkaçağrışımlarının
Boğaziçi JournalVol.24,no.1-2(2010),pp.67-90.
* Özge Sığırcı is an instructor in the Department of Management at Marmara University, Ressam Namık İsmail Sokak, No. 1, 34180, Bahçelievler, Istanbul, Turkey. E-mail: [email protected]
** A. Müge Yalçın is an Assistant Professor in the Department of Management at Marmara University, Ressam Namık İsmail Sokak, No. 1, 34180, Bahçelievler, Istanbul, Turkey. E-mail: [email protected]
68
markauzantısıylauygunluğunundatüketicideğerlendirmelerinietkilediğibelirlenmiştir.Korelasyontestlerinegöre,anamarkaaşinalığı,tüketiciyenilikçiliğivemarkauzantısıdeğerlendirmesiarasındailişkibulunmasınarağmen,regresyonanalizisonucundadoğrudanbiretkibulunamamıştır.
Anahtar kelimeler: marka genişlemeleri, ana marka çağrışımları, benzerlik, marka aşinalığı, tüketici yenilikçiliği.
Today’s highly informed consumers are looking for new solutions to their needs; as such they want to be continuously surprised by new products. Firms work hard to create new and innovative products to satisfy their consumers and to guarantee their success and survival in the marketplace. Not only creating but also marketing these new products is a challenge for companies. According to one estimate, 80 percent of the new products fail at the introductory stage of the Product Life Cycle (Ferrel and Hartline, 2008). For a new product to reach the growth stage, additional consumers other than early adopters need to want to try the product. To realize this desire for trial, the key factors are establishing brand awareness and brand trust. However, creating and maintaining brand awareness and positive brand attitudes require a lot of effort. They create many future expectations as paybacks for the companies in return. One of those paybacks is a strong brand name with equity which can be leveraged and then extended to the new products.
Brand extension can be defined as the use of an established brand name to introduce new product categories (Aaker and Keller, 1990; Reddy, et al., 1994; Batey, 2008; Heding, et al., 2009). From a broader perspective, which will be used in this study, brand extension strategy extends an established brand name to a new or modified product. The existing brand which gives birth to new brand extensions (BE’s) is called the “parent brand (PB)” and the product introduced by using the existing brand name is called the “extended product” (Keller, 2008). BE is a strategy frequently used by firms both in Turkey and elsewhere in the world to reach their growth objectives. For instance, Nivea, Kellogg’s, Sony, Virgin and Gillette are some global examples commonly using the BE strategy. On the other hand, in Turkey, Pınar, Tukaş and Kent can be given as examples of Fast Moving Consumer Goods FMCG(1) firms using the BE strategy (Öncel, 2005). BE’s are used in the FMCG sector frequently, and it is an important and necessary sector for the consumers. According to Nielsen (2008), the total FMCG market in Turkey in 2008 was 30,7 billion dollars and the monthly consumption per house in this sector averaged 311 TL. On the other hand, in Turkey, brand entrance costs to the supermarket shelves begin at 10 thousand dollars and go up to 60 thousand dollars. In the personal care products, the brand entrance costs to the supermarket shelves are even higher, ranging between 15 and 60 thousand dollars (Ateş, 2007). All these high market share and spending indicators regarding the FMCG and the costs for a new brand name to enter the sector reflect both the significance of the sector and the difficulty of using a new brand name in the FMCG sector. Thus, all these directed us towards conducting a study on brand extensions in the FMCG sector.
On the other hand, the main advantages of the BE strategy can be noted as reducing new brand development and entry costs and providing instant product recognition and faster acceptance, and, in turn, providing advertising efficiencies. Taylor (2004) sees BE’s as a “strong brand’s profitable offspring,” moreover, when a BE strategy is used, the consumer’s immediate brand awareness increases and risk perceptions decrease. These in turn provide fast growth and penetration for the brand in the market (Aaker and Keller, 1990; Kapferer, 2008; and Keller and Aaker, 1992).
69
Despite all the advantages explained above, the BE strategy may have many disadvantages such as weakening the PB’s favorable associations, hurting the PB’s image and diluting its meaning if it is not used properly (Gibson, 1990; Gronhaug, et al., 2002; and Holak, and Bhat, 1994). Therefore using the BE strategy by concentrating only on its benefits without considering the costs may damage the well-established PB name. In other words, BE strategy may not necessarily always be the best strategy for introducing a new product. It is important to understand under which conditions it is beneficial and which factors affect the BE’s success. Therefore, in this study since consumers’ attitudes and behavior determine the BE success, the consumer point of view has been taken into consideration.
Thus, the objective of this study was to examine the effect of various factors such as “relevancy of parent brand-specific associations to the extension (PBSA),” “fit (Ft) between the PB and the extension,” “familiarity (Fml) with the PB,” “consumer attitudes toward PB,” and “consumer innovativeness (CI)” on consumers’ evaluations of BE’s. The study is significant for both the practitioners and the academicians for many reasons. Firstly, although BE is an important subject both in brand strategy related practices and research, studies reflecting the Turkish consumers’ view are limited. Also, in this study, most of the important factors that were found to be important in previous studies (Aaker and Keller, 1990; Keller and Aaker, 1992; Lahiri and Gupta, 2005) were investigated under a single study. Moreover, it was conducted in the FMCG market in which the usage of BE strategy has been popular in practice (Kapferer, 2008; Keller, 2008).
LITERATURE REVIEW
According to the previous research about BE’s, many factors have been found to be important in consumers’ evaluations. Among these are the effect of PBSA (Aaker and Keller, 1990; Boush, et. al., 1987; Lahiri and Gupta, 2005), perceived quality (Aaker and Keller,1990; Kwun, 2004; Lahiri and Gupta, 2005; VanRiel, et al., 2001), Fml (Alba and Hutchinson, 1987; Broniarczyk and Alba, 1994), Ft (Aaker and Keller, 1990; and Boush, et. al., 1987), and intervening extensions (Keller and Aaker, 1992). In this section, each of these variables will be discussed briefly.
Relevancy of Parent Brand Specific Associations
Since they trust their strong brand names, marketers generally do not spend much for the promotion of their BE’s (Bhat and Reddy, 2001). Consumers usually first meet with the extended product when they see it on store shelves. Consequently, until they become familiar with an extension, consumers use their existing knowledge about the PB to evaluate the BE. Thus, the associations of the PB and their relevancy to the extension are accepted as an important element in BE evaluations (Aaker and Keller, 1990; and Broniarczyk and Alba, 1994). MacInnis and Nakamoto (1990) define “brand specific associations”as the attributes or benefits that differentiate a brand from competing brands. According to Keller (1993), brand associations are the information containing the meaning of the brand for the consumers. Associations can be the product attributes or characteristics that are created in the minds of consumers for positioning a brand and they must be unique, strong and favorable (Batey, 2008; Pitta and Katsanis, 1995). For example, BMW cars are associated with performance, Apple is associated with user-friendliness, and Mercedes is associated with wealth (Aaker and Keller, 1990). Also, the associations created for the PB can be transferred to the extension (Aaker and Keller, 1990). The good part of this assumption is that the associations of the PB can be helpful in the favorable evaluation of the extension. However, sometimes associations of the PB can be harmful for the extension category (Myers and Alpert, 1968). For instance, Zeithaml (1988) showed that viscosity is related to high
70
quality in tomato based juices but it is not a good association for children’s fruit flavored drinks. Also, pulp is a sign of high quality for orange juice but it signals low quality in apple juice. Thus, a PB which is associated with ‘pulp’ in the minds of consumers can not be successful if it extends to the apple juice category. Park, Milberg and Lawson (1991) found that when the PB and the extension category share the same association, evaluation of an extension is enhanced. Also, Broniarczyk and Alba (1994) and Glynn and Brodie (1998) found that PB specific associations are important in the evaluations of extensions.
Thus, based on the literature, it is hypothesized that:ThereisasignificantdifferencebetweentheBEevaluationsofconsumerswhofindthePBSA’srelevantorirrelevanttotheBE.
Consumer Attitudes toward Parent Brand
Attitude is described as “a person’s consistently favorable or unfavorable evaluations, feelings, and tendencies toward an object or idea” (Kotler and Armstrong, 2006). Moreover, the attitudes formed about products and brands are the overall dispositions toward the product or brand which, in turn, influence the consumers’ decisions to buy (Chaudhuri, 2006). In light of these definitions, attitudes toward the PB can be described as consumers’ overall favorable or unfavorable beliefs and feelings about the PB. Consumers tend to evaluate the BE based on their existing knowledge about the PB until they become familiar with the BE. Thus, it can be said that the positive or negative attitudes toward the PB are transferred to the extended product (Farquarr, 1990). Consequently, attitude toward the PB is an important basis of the consumers’ evaluation of the BE (Aaker and Keller, 1990; Lahiri and Gupta, 2005; and McWilliam, 1993). Perceived quality, trust, brand affect, innovativeness and image are the factors that affect the formation of attitudes toward the PB and, as a result, they are important for the consumers’ BE evaluations (Aaker and Keller, 1990; Bhat and Reddy, 2001; and Boush et al., 1987).
Thus; ConsumerattitudetowardthePBhasaneffectonBEevaluation.
Fit Between the Parent Brand and the Extension
Fit (Ft) is generally defined as being “the function of salient shared associations between the PB and the extension product” (Thorbjornsen, 2005) or as being “the degree to which consumers perceive the extensions to be like the original product” (Lahiri and Gupta, 2005). Also, Ft is defined in various studies as similarity, typicality and relatedness, but the differences between these terms are blurred and they are strongly intertwined (Muroma and Saari, 1996; Thorbjornsen, 2005). Based on the findings in the previous literature, Ft between the existing product and the extended product also has a distinctive role in consumers’ evaluations of the BE. Most commonly, when the Ft between the PB and the extension is high, PB associations are usually transferred to the extension. Also, if the Ft between the PB and the extension is high, the extension can be evaluated positively (Aaker and Keller, 1990; Bhat and Reddy, 2001; and Boush and Loken 1991). In Aaker and Keller’s (1990) study, Ft is conceptualized as including ‘Complement’, ‘Substitute’ and ‘Transfer’ dimensions. ‘Complement’ indicates the products that are consumed jointly to satisfy a particular need. ‘Substitute’ indicates that one product can be replaced by another one in usage and satisfy the same need. The last dimension, ‘Transfer,’ concerns the perception of consumers about the firm’s ability to make a product in the extension category (Aaker and Keller, 1990).
71
Thus; FtbetweenthePBandtheextensionhasaneffectonBEevaluation.
Familiarity with the Parent Brand
As the aim of the BE strategy is to reduce the risk perceptions of consumers in using an existing brand name, it is assumed by the firms that the brand which is extended is known by the consumers. However, the PB knowledge of consumers can vary: some can be very knowledgeable whereas others may have no idea about the PB. Familiarity (Fml) can be defined as “the number of product related experiences that have been accumulated by the consumer” (Alba and Hutchinson, 1987). Thus, it is thought that the PB knowledge of consumers affects their BE evaluations and it is examined in the BE literature (Broniarczyk and Alba, 1994; and Grophaug, et al., 2002). According to Broniarczyk and Alba (1994) consumers who are brand experts will know more about the brand and its associations, so they will be able to evaluate the appropriateness of the BE better than the brand novices who know less about the brand. Swaminathan, Fox and Reddy (2001) focused on the impact of the consumers’ experience with the PB on trial and repeat purchase of the BE. They concluded that the experience with the PB has a significant impact on the trial of the BE (Swaminathan, et al., 2001).
Thus; FamiliaritywiththePBhasaneffectonBEevaluation.
Consumer Innovativeness
Innovativeness is described as “the desire or willingness to try new and different experiences” (Hirschman, 1980). Rogers (1983) defines innovativeness in terms of “the degree to which a person is relatively earlier in adopting an innovation than other members of his or her social system.” In general, it is believed that people respond differently to new products (Gatignon and Robertson 1985; Hirschman, 1980; Klink, and Smith, 2001). Some people show resistance to change and try out new things after they are accepted by a few people (Lahiri, and Gupta, 2005). On the other hand, innovators are the early adopters who are first to accept new things in the market (Lahiri and Gupta, 2005; Venkatraman, 1991). BE’s are a specific case of new products, and innovativeness is correlated with personality traits which predispose consumers to purchase newly introduced products. Thus, since innovators initially try and accept the newly introduced products and influence the other consumers, there can be some relation between consumer innovativeness and BE’s. Lahiri and Gupta (2005) found a relation between adoption of extended brands and consumer innovativeness. They noted that innovative consumers are eager to adopt the BE’s and as the innovativeness increases, positive evaluation of a BE will increase (Lahiri and Gupta, 2005). Because of the limitedness of studies investigating the relationship between consumer innovativeness and BE evaluations, in this study this relationship was also examined. So it was hypothesized that;
ConsumerinnovativenesshasaneffectonBEevaluation.
Importance of Consumer Evaluations
Although using a BE strategy is a cost-efficient way of introducing new products, that strategy is not a sufficient incentive for encouraging the firms. The consumer point of view is also important for firms to consider as they choose the BE strategy. That is why understanding how consumers evaluate a BE
72
and which factors play a role in this evaluation are important issues. This study measured consumer evaluations of BE by assessing consumer attitudes toward the hypothetical extension and their purchaseintentionofthathypotheticalextension. In order to measure the consumer attitudes toward the hypothetical extension, the questions covered the following factors: perceived quality (Aaker, and Keller, 1990), trust (Aaker, and Keller, 1990; Dwyer, et al., 1987; Reast, 2005), brand affect (Wu and Yen, 2007), perceived image and perceived innovation. Lastly, the questions included the purchase intention (Klink and Smith, 2001) toward that extension.
THEORETICAL MODEL AND HYPOTHESES
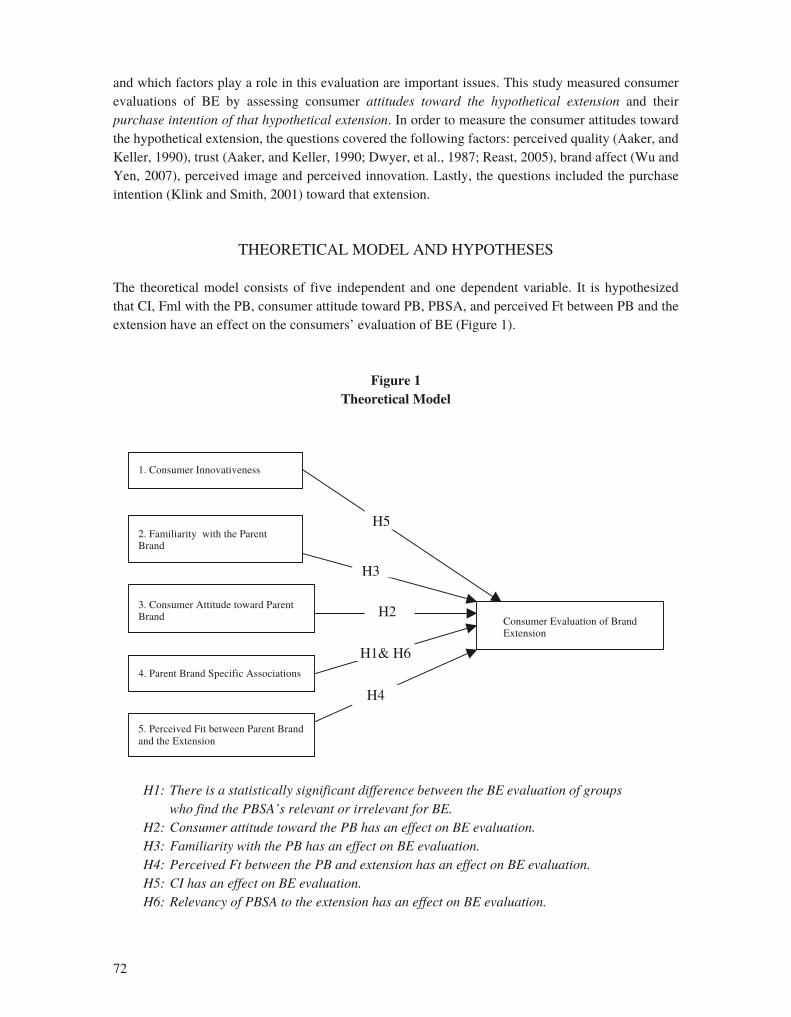
The theoretical model consists of five independent and one dependent variable. It is hypothesized that CI, Fml with the PB, consumer attitude toward PB, PBSA, and perceived Ft between PB and the extension have an effect on the consumers’ evaluation of BE (Figure 1).
Figure 1Theoretical Model
1. Consumer Innovativeness
4. Parent Brand Specific Associations
2. Familiarity with the Parent Brand
3. Consumer Attitude toward Parent Brand
Consumer Evaluation of Brand Extension
5. Perceived Fit between Parent Brand and the Extension
H4
H1& H6
H2
H3
H5
H1:ThereisastatisticallysignificantdifferencebetweentheBEevaluationofgroupswhofindthePBSA’srelevantorirrelevantforBE.
H2:ConsumerattitudetowardthePBhasaneffectonBEevaluation.H3:FamiliaritywiththePBhasaneffectonBEevaluation.H4:PerceivedFtbetweenthePBandextensionhasaneffectonBEevaluation.H5:CIhasaneffectonBEevaluation.H6:RelevancyofPBSAtotheextensionhasaneffectonBEevaluation.
73
RESEARCH METHODOLOGY
For the field study, the FMCG market and shampoos have been preferred. The FMCG market was chosen because it is a quickly growing market in which practice BE’s are used heavily (Kapferer, 2008; Öncel, 2005). However, the studies conducted academically to support and facilitate this practice are limited. Also, shampoos were chosen because, in the cosmetics industry there are lots of brands with very similar price ranges, and very similar promises. This is especially true for the brands sold in supermarkets and distributed extensively. Therefore, being different from the other shampoo brands in the market is difficult and they are among the products that require heavy advertisement expense to create brand awareness (Kelekçi, 2003). Thus, it can be advantageous for shampoo brands to use the BE strategy to leverage their successful brand names. Two pretests were conducted for choosing the shampoo brands to use in the field research in order to understand their associations for the consumers and to choose which hypothetical extensions to use in the field research.
Pretests
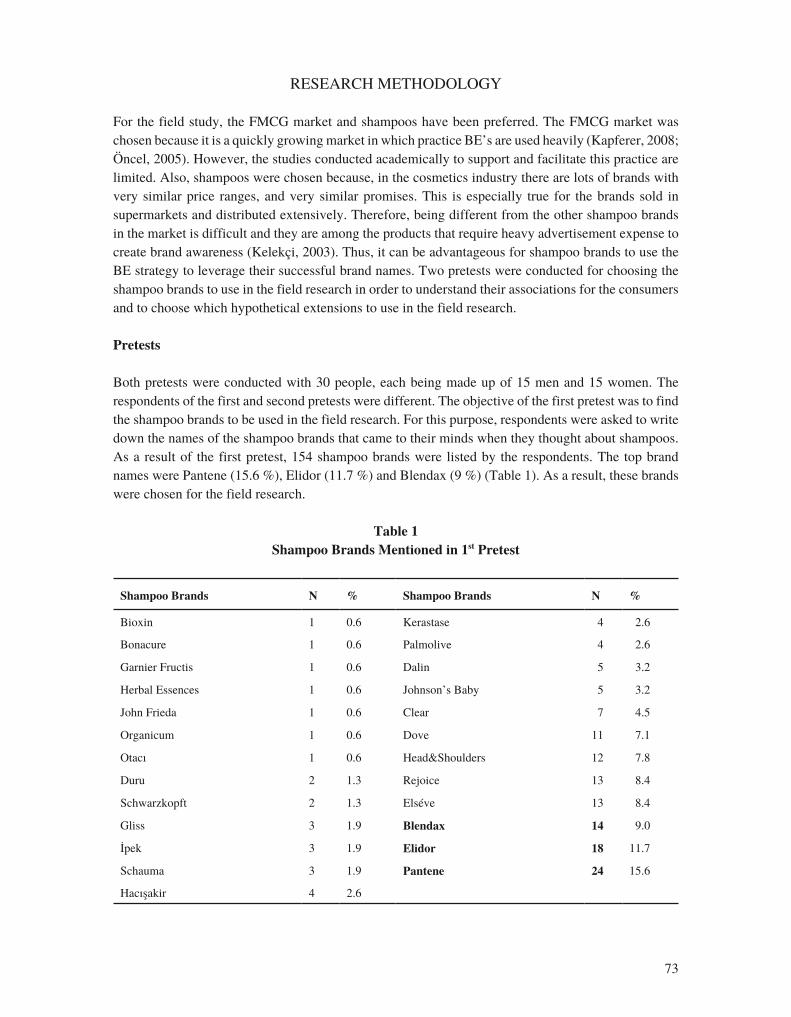
Both pretests were conducted with 30 people, each being made up of 15 men and 15 women. The respondents of the first and second pretests were different. The objective of the first pretest was to find the shampoo brands to be used in the field research. For this purpose, respondents were asked to write down the names of the shampoo brands that came to their minds when they thought about shampoos. As a result of the first pretest, 154 shampoo brands were listed by the respondents. The top brand names were Pantene (15.6 %), Elidor (11.7 %) and Blendax (9 %) (Table 1). As a result, these brands were chosen for the field research.
Table 1Shampoo Brands Mentioned in 1st Pretest
Shampoo Brands N % Shampoo Brands N %
Bioxin 1 0.6 Kerastase 4 2.6
Bonacure 1 0.6 Palmolive 4 2.6
Garnier Fructis 1 0.6 Dalin 5 3.2
Herbal Essences 1 0.6 Johnson’s Baby 5 3.2
John Frieda 1 0.6 Clear 7 4.5
Organicum 1 0.6 Dove 11 7.1
Otacı 1 0.6 Head&Shoulders 12 7.8
Duru 2 1.3 Rejoice 13 8.4
Schwarzkopft 2 1.3 Elséve 13 8.4
Gliss 3 1.9 Blendax 14 9.0
İpek 3 1.9 Elidor 18 11.7
Schauma 3 1.9 Pantene 24 15.6
Hacışakir 4 2.6
74
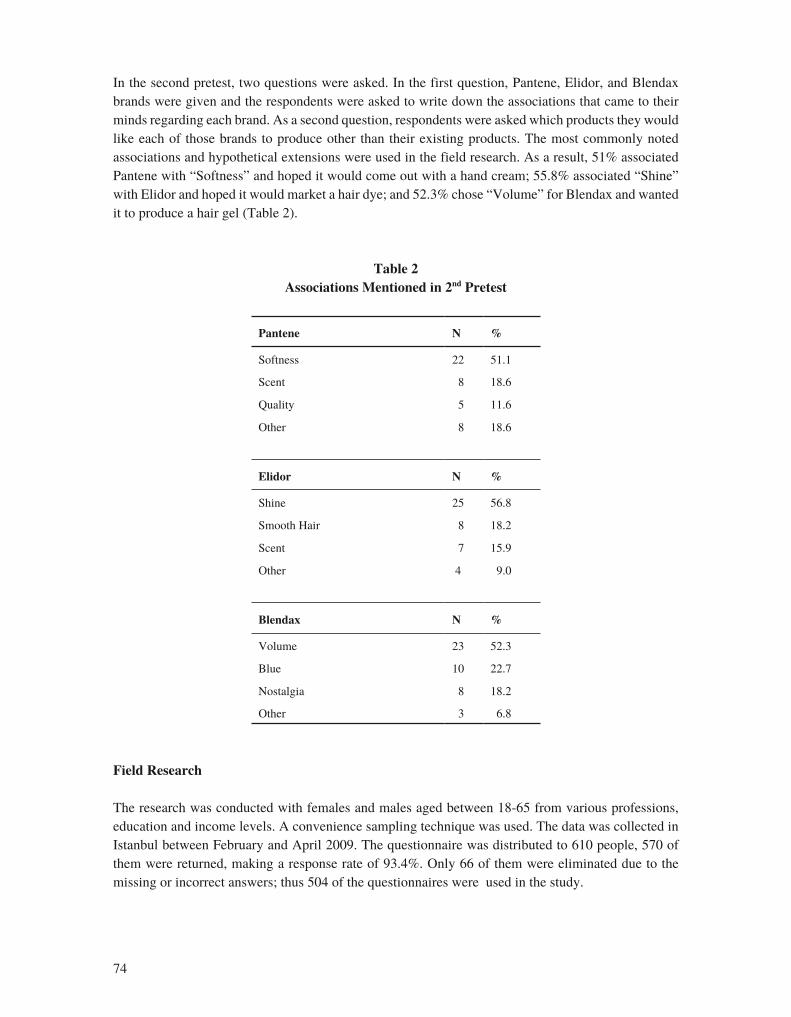
In the second pretest, two questions were asked. In the first question, Pantene, Elidor, and Blendax brands were given and the respondents were asked to write down the associations that came to their minds regarding each brand. As a second question, respondents were asked which products they would like each of those brands to produce other than their existing products. The most commonly noted associations and hypothetical extensions were used in the field research. As a result, 51% associated Pantene with “Softness” and hoped it would come out with a hand cream; 55.8% associated “Shine” with Elidor and hoped it would market a hair dye; and 52.3% chose “Volume” for Blendax and wanted it to produce a hair gel(Table 2).
Table 2Associations Mentioned in 2nd Pretest
Pantene N %
Softness 22 51.1
Scent 8 18.6
Quality 5 11.6
Other 8 18.6
Elidor N %
Shine 25 56.8
Smooth Hair 8 18.2
Scent 7 15.9
Other 4 9.0
Blendax N %
Volume 23 52.3
Blue 10 22.7
Nostalgia 8 18.2
Other 3 6.8
Field Research
The research was conducted with females and males aged between 18-65 from various professions, education and income levels. A convenience sampling technique was used. The data was collected in Istanbul between February and April 2009. The questionnaire was distributed to 610 people, 570 of them were returned, making a response rate of 93.4%. Only 66 of them were eliminated due to the missing or incorrect answers; thus 504 of the questionnaires were used in the study.
75
Questionnaire forms included 73 questions in total. In the first part of the questionnaire, consumer innovativeness was measured with seven questions. After the innovativeness questions, respondents were forced to choose one shampoo brand that they used most frequently among the three given shampoo brands. In the following questions regarding the PB familiarity and attitude toward the PB, respondents were asked to answer the questionnaire by thinking of the shampoo brand they had chosen. Then, for answering the questions about PBSA, about Ft and about the dependent variable BE evaluation, respondents who chose different shampoo brands were directed to different parts of the questionnaire. In addition, demographic questions were asked of the respondents. All the questions except demographics and the question asking the respondents to choose a shampoo brand that they used most frequently were asked on a 5-point Likert Scale (1= Strongly Disagree, 5= Strongly Agree).
Consumer Innovativeness was measured with seven questions which had been adapted from Klink and Smith (2001) and Lahiri and Gupta (2005). The 5-point Likert Scale (1= Strongly Disagree, 5= Strongly Agree) was used both for it and for the 6 questions concerning PB Fml. Two of the questions were for measuring experience with the brand by asking the trial and frequency of purchase adapted from Smith and Swinyard (1982) and Dawar (1996) respectively. The following questions were for measuring brand awareness according to brand recognition as adapted from Dawar (1996) and Marangoz (2007).
There were 27 questions about Consumer Attitude toward PB which used the 5-point Likert Scale and was adapted from Aaker and Keller (1990) and from various sources such as Chaudhuri and Holbrook (2001), Martinez and deChernatony (2004), Reast (2005) etc. The relevancy of PBSA to the Extension was generated by the author; again using the 5-point Likert Scale.
The 5-point Likert Scale was used for the hypothetical extensions’ fit to the PB, based on “suitability”, “complement,” “substitute” and “transfer” sub dimensions, as were the 18 questions measuring the dependent variable; consumer evaluation of BE’s that were based on the extensions created hypothetically. The Consumer Evaluation of BE’s was likewise measured by “consumer attitude toward extension” and “purchase intention” on the 5- point Likert Scale. The scales used in the study are given in Appendix 1.
FINDINGS
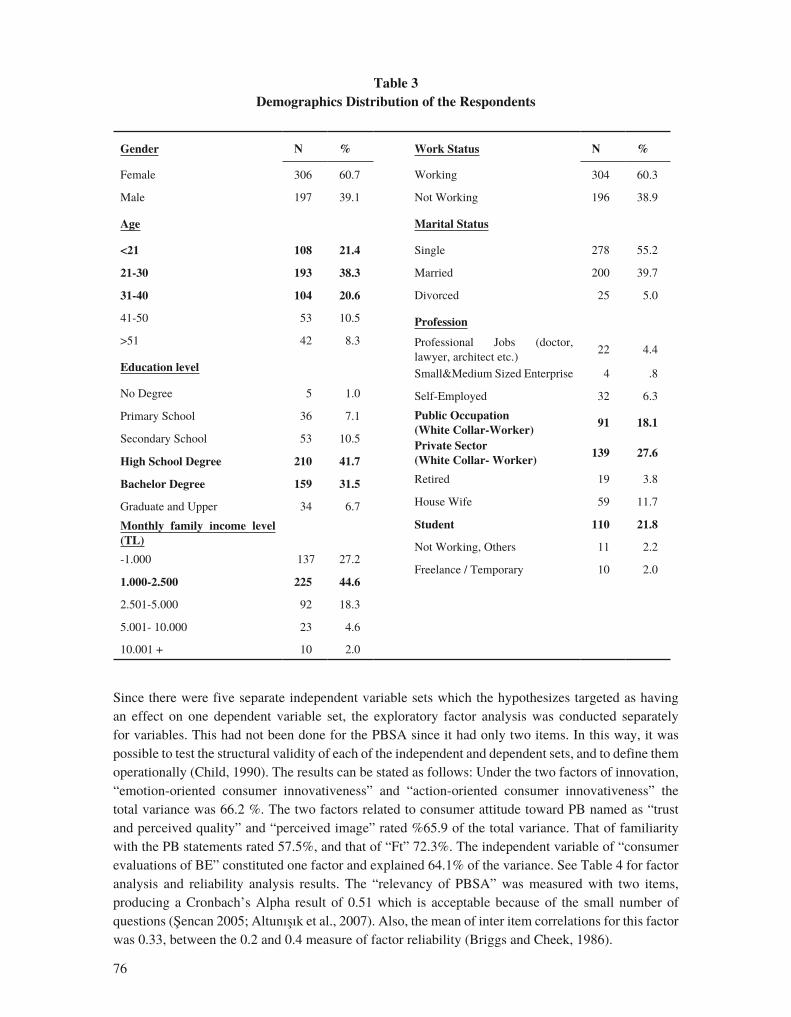
According to the demographics of the sample, from the 504 respondents, 60.7 % (306) were women and 39.1% (197) men. Of the respondents, the majority were between 21 and 30 years old (38.3%), and single (55.2%). According to education level distribution, the most had finished high school (41.7%), the second biggest group had a bachelor’s degree (31.5%). The percentage of the respondents who were working was 60.3%: of them the largest group was in the private sector (27.6%). The second largest group was students (21.8%), followed by 18.1% of the workers in the public sector (Table 3).
76
Table 3Demographics Distribution of the Respondents
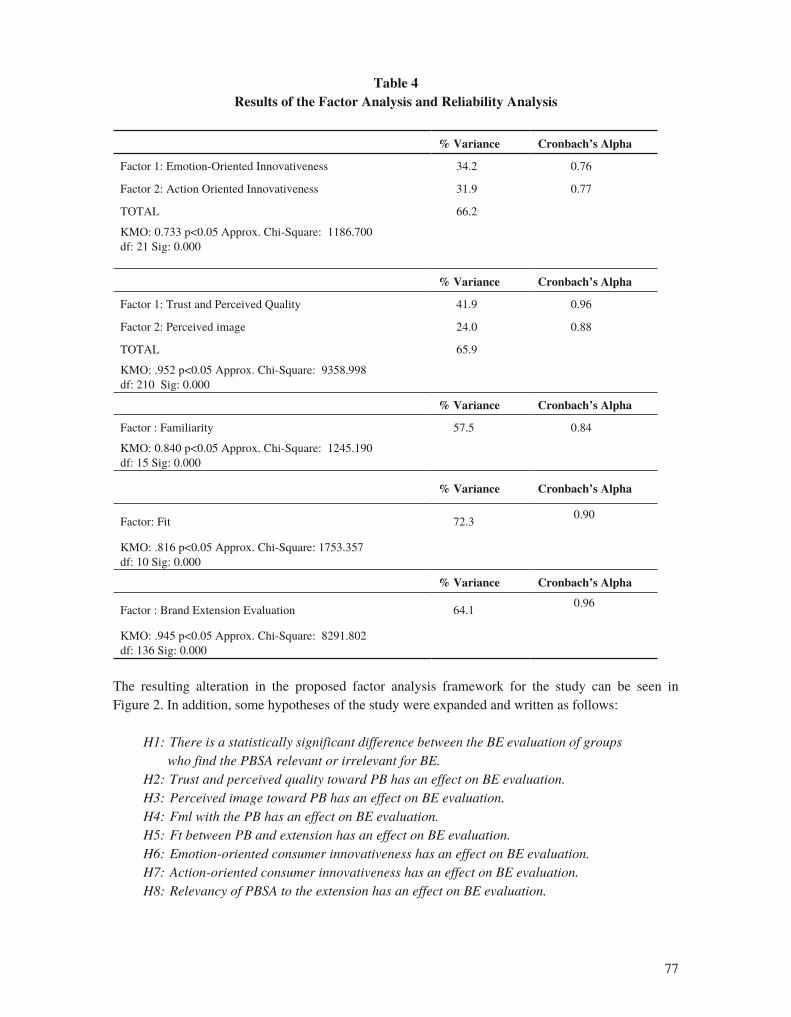
Since there were five separate independent variable sets which the hypothesizes targeted as having an effect on one dependent variable set, the exploratory factor analysis was conducted separately for variables. This had not been done for the PBSA since it had only two items. In this way, it was possible to test the structural validity of each of the independent and dependent sets, and to define them operationally (Child, 1990). The results can be stated as follows: Under the two factors of innovation, “emotion-oriented consumer innovativeness” and “action-oriented consumer innovativeness” the total variance was 66.2 %. The two factors related to consumer attitude toward PB named as “trust and perceived quality” and “perceived image” rated %65.9 of the total variance. That of familiarity with the PB statements rated 57.5%, and that of “Ft” 72.3%. The independent variable of “consumer evaluations of BE” constituted one factor and explained 64.1% of the variance. See Table 4 for factor analysis and reliability analysis results. The “relevancy of PBSA” was measured with two items, producing a Cronbach’s Alpha result of 0.51 which is acceptable because of the small number of questions (Şencan 2005; Altunışık et al., 2007). Also, the mean of inter item correlations for this factor was 0.33, between the 0.2 and 0.4 measure of factor reliability (Briggs and Cheek, 1986).
Work Status N %
Working 304 60.3
Not Working 196 38.9
Marital Status
Single 278 55.2
Married 200 39.7
Divorced 25 5.0
Profession
Professional Jobs (doctor, lawyer, architect etc.)
22 4.4
Small&Medium Sized Enterprise 4 .8
Self-Employed 32 6.3
Public Occupation (White Collar-Worker)
91 18.1
Private Sector (White Collar- Worker)
139 27.6
Retired 19 3.8
House Wife 59 11.7
Student 110 21.8
Not Working, Others 11 2.2
Freelance / Temporary 10 2.0
Gender N %
Female 306 60.7
Male 197 39.1
Age
<21 108 21.4
21-30 193 38.3
31-40 104 20.6
41-50 53 10.5
>51 42 8.3
Education level
No Degree 5 1.0
Primary School 36 7.1
Secondary School 53 10.5
High School Degree 210 41.7
Bachelor Degree 159 31.5
Graduate and Upper 34 6.7
Monthly family income level (TL)
-1.000 137 27.2
1.000-2.500 225 44.6
2.501-5.000 92 18.3
5.001- 10.000 23 4.6
10.001 + 10 2.0
77
Table 4Results of the Factor Analysis and Reliability Analysis
% Variance Cronbach’s Alpha
Factor 1: Emotion-Oriented Innovativeness 34.2 0.76
Factor 2: Action Oriented Innovativeness 31.9 0.77
TOTAL 66.2
KMO: 0.733 p<0.05 Approx. Chi-Square: 1186.700 df: 21 Sig: 0.000
% Variance Cronbach’s Alpha
Factor 1: Trust and Perceived Quality 41.9 0.96
Factor 2: Perceived image 24.0 0.88
TOTAL 65.9
KMO: .952 p<0.05 Approx. Chi-Square: 9358.998df: 210 Sig: 0.000
% Variance Cronbach’s Alpha
Factor : Familiarity 57.5 0.84
KMO: 0.840 p<0.05 Approx. Chi-Square: 1245.190 df: 15 Sig: 0.000
% Variance Cronbach’s Alpha
Factor: Fit 72.3 0.90
KMO: .816 p<0.05 Approx. Chi-Square: 1753.357 df: 10 Sig: 0.000
% Variance Cronbach’s Alpha
Factor : Brand Extension Evaluation 64.1 0.96
KMO: .945 p<0.05 Approx. Chi-Square: 8291.802 df: 136 Sig: 0.000
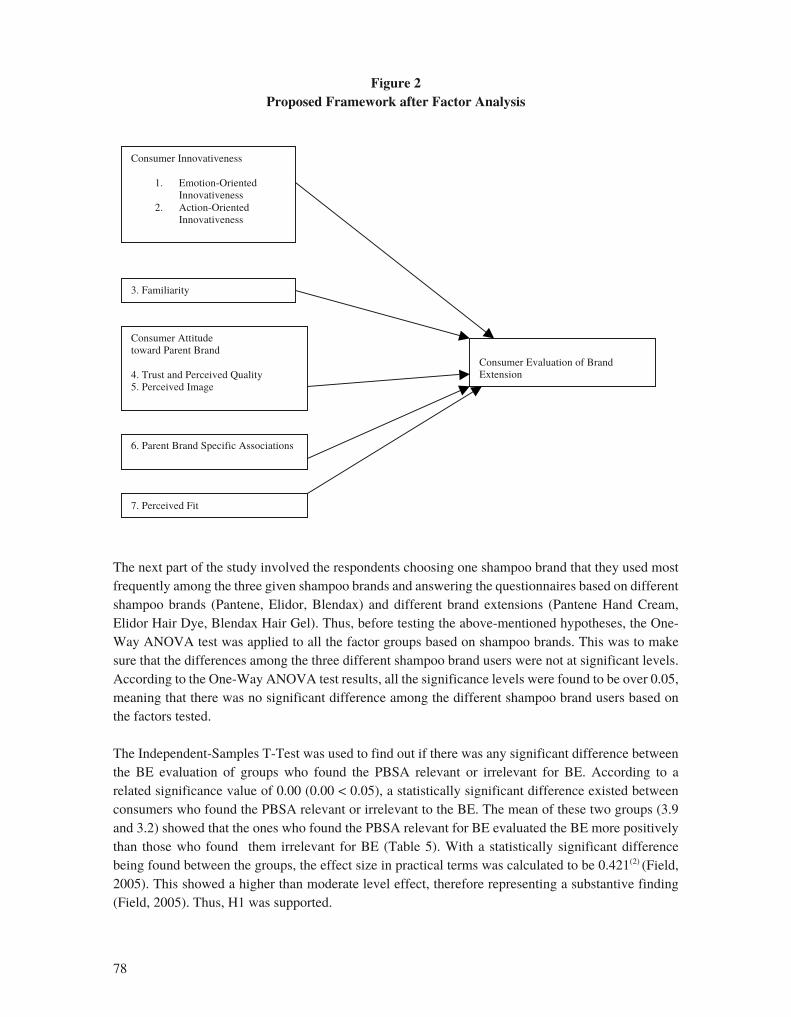
The resulting alteration in the proposed factor analysis framework for the study can be seen in Figure 2. In addition, some hypotheses of the study were expanded and written as follows:
H1:ThereisastatisticallysignificantdifferencebetweentheBEevaluationofgroupswhofindthePBSArelevantorirrelevantforBE.H2:TrustandperceivedqualitytowardPBhasaneffectonBEevaluation.H3:PerceivedimagetowardPBhasaneffectonBEevaluation.H4:FmlwiththePBhasaneffectonBEevaluation.H5:FtbetweenPBandextensionhasaneffectonBEevaluation.H6:Emotion-orientedconsumerinnovativenesshasaneffectonBEevaluation.H7:Action-orientedconsumerinnovativenesshasaneffectonBEevaluation.H8:RelevancyofPBSAtotheextensionhasaneffectonBEevaluation.
78
Figure 2Proposed Framework after Factor Analysis
Consumer Innovativeness
1. Emotion-Oriented Innovativeness
2. Action-Oriented Innovativeness
6. Parent Brand Specific Associations
3. Familiarity
Consumer Attitude toward Parent Brand 4. Trust and Perceived Quality 5. Perceived Image
Consumer Evaluation of Brand Extension
7. Perceived Fit
The next part of the study involved the respondents choosing one shampoo brand that they used most frequently among the three given shampoo brands and answering the questionnaires based on different shampoo brands (Pantene, Elidor, Blendax) and different brand extensions (Pantene Hand Cream, Elidor Hair Dye, Blendax Hair Gel). Thus, before testing the above-mentioned hypotheses, the One-Way ANOVA test was applied to all the factor groups based on shampoo brands. This was to make sure that the differences among the three different shampoo brand users were not at significant levels. According to the One-Way ANOVA test results, all the significance levels were found to be over 0.05, meaning that there was no significant difference among the different shampoo brand users based on the factors tested.
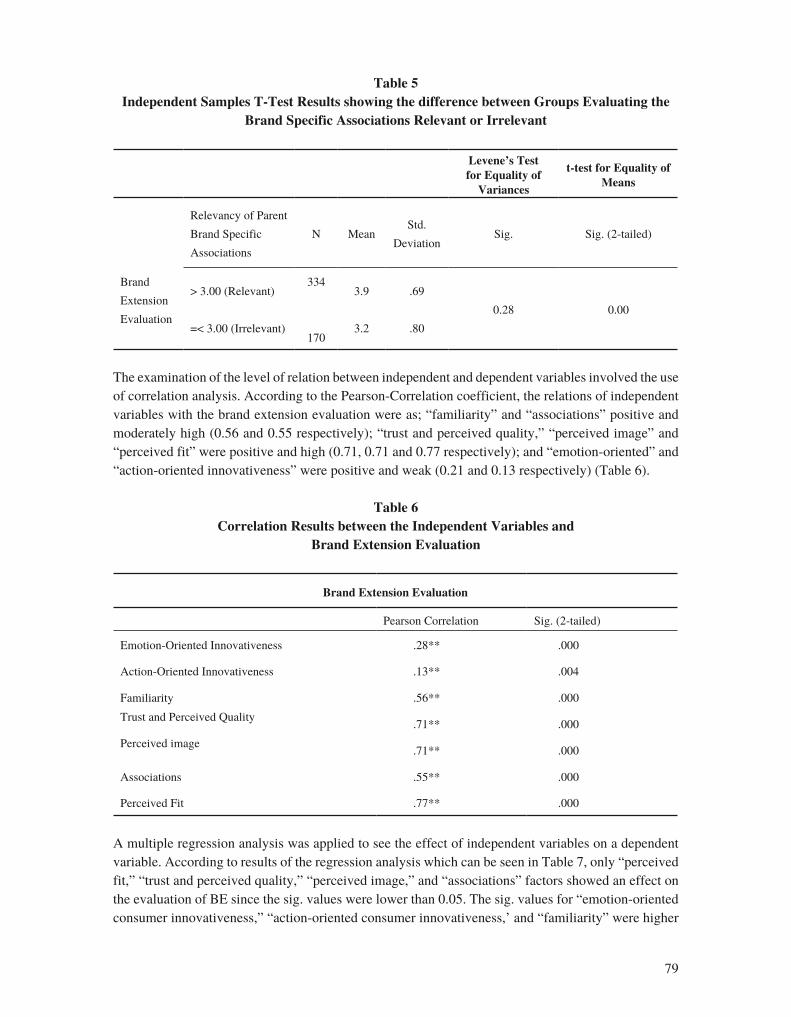
The Independent-Samples T-Test was used to find out if there was any significant difference between the BE evaluation of groups who found the PBSA relevant or irrelevant for BE. According to a related significance value of 0.00 (0.00 < 0.05), a statistically significant difference existed between consumers who found the PBSA relevant or irrelevant to the BE. The mean of these two groups (3.9 and 3.2) showed that the ones who found the PBSA relevant for BE evaluated the BE more positively than those who found them irrelevant for BE (Table 5). With a statistically significant difference being found between the groups, the effect size in practical terms was calculated to be 0.421(2) (Field, 2005). This showed a higher than moderate level effect, therefore representing a substantive finding (Field, 2005). Thus, H1 was supported.
79
Table 5Independent Samples T-Test Results showing the difference between Groups Evaluating the
Brand Specific Associations Relevant or Irrelevant
Levene’s Test for Equality of
Variances
t-test for Equality of Means
Relevancy of Parent
Brand Specific
Associations
N MeanStd.
DeviationSig. Sig. (2-tailed)
Brand
Extension
Evaluation
> 3.00 (Relevant)
=< 3.00 (Irrelevant)
334
170
3.9
3.2
.69
.80
0.28 0.00
The examination of the level of relation between independent and dependent variables involved the use of correlation analysis. According to the Pearson-Correlation coefficient, the relations of independent variables with the brand extension evaluation were as; “familiarity” and “associations” positive and moderately high (0.56 and 0.55 respectively); “trust and perceived quality,” “perceived image” and “perceived fit” were positive and high (0.71, 0.71 and 0.77 respectively); and “emotion-oriented” and “action-oriented innovativeness” were positive and weak (0.21 and 0.13 respectively) (Table 6).
Table 6Correlation Results between the Independent Variables and
Brand Extension Evaluation
Brand Extension Evaluation
Pearson Correlation Sig. (2-tailed)
Emotion-Oriented Innovativeness .28** .000
Action-Oriented Innovativeness .13** .004
Familiarity .56** .000
Trust and Perceived Quality .71** .000
Perceived image .71** .000
Associations .55** .000
Perceived Fit .77** .000
A multiple regression analysis was applied to see the effect of independent variables on a dependent variable. According to results of the regression analysis which can be seen in Table 7, only “perceived fit,” “trust and perceived quality,” “perceived image,” and “associations” factors showed an effect on the evaluation of BE since the sig. values were lower than 0.05. The sig. values for “emotion-oriented consumer innovativeness,” “action-oriented consumer innovativeness,’ and “familiarity” were higher
80
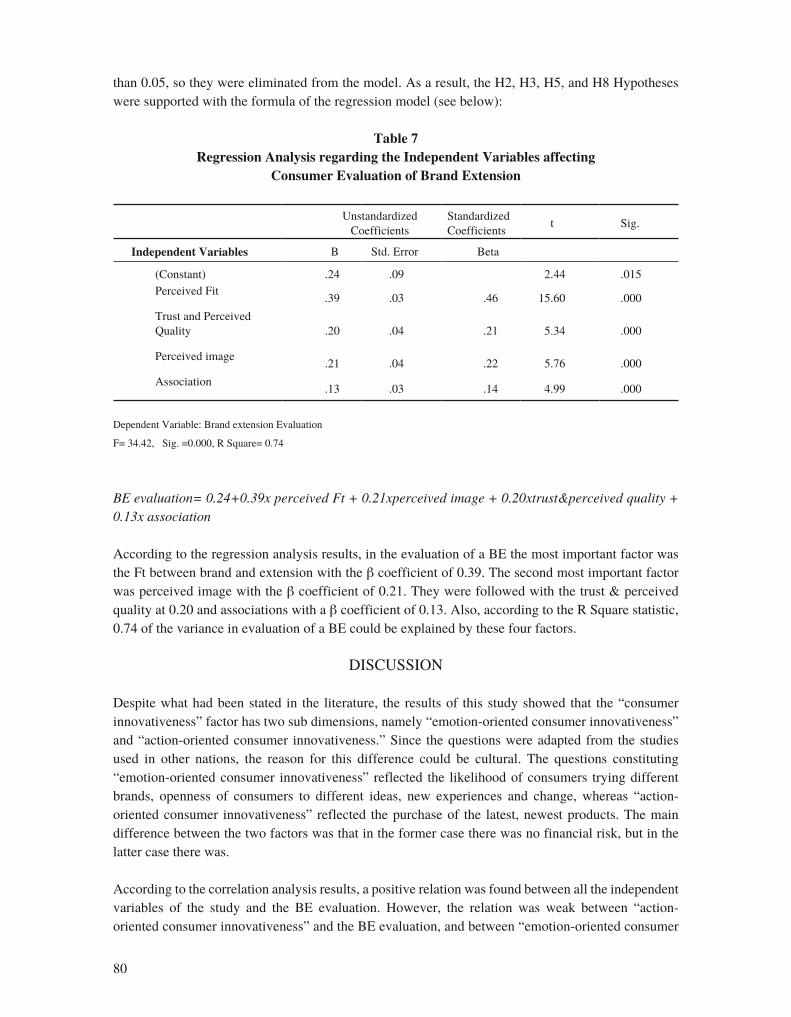
than 0.05, so they were eliminated from the model. As a result, the H2, H3, H5, and H8 Hypotheses were supported with the formula of the regression model (see below):
Table 7Regression Analysis regarding the Independent Variables affecting
Consumer Evaluation of Brand Extension
Unstandardized Coefficients
Standardized Coefficients
t Sig.
Independent Variables B Std. Error Beta
(Constant) .24 .09 2.44 .015Perceived Fit
.39 .03 .46 15.60 .000
Trust and Perceived Quality .20 .04 .21 5.34 .000
Perceived image.21 .04 .22 5.76 .000
Association.13 .03 .14 4.99 .000
Dependent Variable: Brand extension Evaluation
F= 34.42, Sig. =0.000, R Square= 0.74
BEevaluation=0.24+0.39xperceivedFt+0.21xperceivedimage+0.20xtrust&perceivedquality+0.13xassociation
According to the regression analysis results, in the evaluation of a BE the most important factor was the Ft between brand and extension with the β coefficient of 0.39. The second most important factor was perceived image with the β coefficient of 0.21. They were followed with the trust & perceived quality at 0.20 and associations with a β coefficient of 0.13. Also, according to the R Square statistic, 0.74 of the variance in evaluation of a BE could be explained by these four factors.
DISCUSSION
Despite what had been stated in the literature, the results of this study showed that the “consumer innovativeness” factor has two sub dimensions, namely “emotion-oriented consumer innovativeness” and “action-oriented consumer innovativeness.” Since the questions were adapted from the studies used in other nations, the reason for this difference could be cultural. The questions constituting “emotion-oriented consumer innovativeness” reflected the likelihood of consumers trying different brands, openness of consumers to different ideas, new experiences and change, whereas “action-oriented consumer innovativeness” reflected the purchase of the latest, newest products. The main difference between the two factors was that in the former case there was no financial risk, but in the latter case there was.
According to the correlation analysis results, a positive relation was found between all the independent variables of the study and the BE evaluation. However, the relation was weak between “action-oriented consumer innovativeness” and the BE evaluation, and between “emotion-oriented consumer
81
innovativeness” and BE evaluation. The reason why the correlation between action-oriented consumer innovativeness and BE evaluation was less than the correlation between action-oriented consumer innovativeness and BE evaluation could be attributed to the total monthly income of the respondents, since the biggest group in the sample of the study was the middle-class (44.6 %). Based on the total monthly income level of respondents who were middle-class, it appeared that although they had a tendency to be emotionally innovative, they could not take the risk of losing money. As a result, they could not be innovative in their actions. Also, the reason why the correlation between consumer innovativeness and BE evaluation was weak could be explained by the fact that, since innovative consumers were open to newness and tended to take higher risks, the relation between consumer innovativeness and new brand evaluations rather than BE evaluations could be stronger (Xie, 2008). In support of the previous studies, a positive and moderate level of correlation was found between “familiarity,” “associations” and brand extension evaluation and a positive and strong correlation between “trust & perceived quality,” “perceived image,” “perceived fit” and brand extension evaluation.
When the regression model of the study was examined, it could be seen that brand extension evaluation was not dependent on “emotion-oriented innovativeness,” “action-oriented innovativeness” or “familiarity.” Although there were some findings in the literature showing that consumer innovativeness” and “familiarity” affected brand extension evaluations, their effects were not supported in repeated studies. For instance, although Broniarczyk and Alba (1994), and Swaminathan, et al. (2001) found that PB knowledge and experience with the PB affected brand extension evaluations, according to Özüpak’s thesis (2008) conducted in Turkey there were no supporting results for the effect of PB familiarity on the evaluation of BE. On the other hand, although Lahiri and Gupta (2005) argued that as the consumer innovativeness increased the positive evaluation of BE would increase, Xie (2008) argued that consumer innovativeness was more related to the new brands instead of to BE’s.
“Perceived fit,” “trust & perceived quality of the parent brand,” “perceived image of the parent brand” and “parent brand-specific associations” were the factors that constituted the proposed regression model of the study. Except for “perceived fit,” the common point of the latter three were that they were transferred to the BE from the PB. So they were found to be directly related and most effective in the brand extension evaluations.
CONCLUSION AND SUGGESTIONS
According to the findings of the study, it was apparent that when evaluating a BE, Ft with the PB, trust & perceived quality in the PB, the perceived image of the PB, and the PB’s associations were weighed by the consumers. But being familiar with the PB, or being an innovative consumer had only some relation to the BE evaluations. For instance, familiarity with the PB reduced the perceived risk toward the PB and indirectly influenced the evaluation of the BE by supporting its success. Moreover, familiarity toward the PB could influence the trust & perceived quality, the perceived image of the PB and might possibly have an indirect relation to the BE evaluation.
Regarding the strategic implications for the practitioners, the conclusions of the study showed that firms should first try to differentiate their offerings and augment the desirable associations in their categories; these would strengthen the brands which were the firms’ most important assets. In this process, packages, logos, advertisements and jingles were important elements to be considered. When
82
firms want to diversify, they should concentrate on using the brand’s already established and favorable associations in their communication efforts. In this way, the BE would be more likely to be accepted by the consumers, and the overall value of the BE would be enhanced. Trying to extend a brand without taking into consideration associations of the PB could damage the already existing associations. Likewise, since perceived Ft and the relevancy of brand specific associations were important for a successful BE, for the future firms should think flexibly and avoid rigid associations and brand category descriptions. For example, since McDonald’s has broad associations, it could extend its brand to a child-related area although it is a fast food restaurant. In addition, it should be kept in mind that the first extension of the brand would affect the PB’s as well as the forthcoming extensions’ associations (Aaker, 1990). Thus, firms should be particularly careful with their first extensions.
Also, the importance of perceived Ft, trust & perceived quality, and perceived image should be considered. For all these, it would be good for firms to conduct marketing research to uncover their brand’s associations, trust & perceived quality, perceived image, and the perceived Ft of their proposed BE from the point of view of their targeted consumers. By using marketing research with the aforementioned factors in mind, firms could avoid making mistakes before deciding to use a brand extension strategy. The firms whose brands are trusted, perceived to be of quality and have a positive image can successfully use the BE strategy by considering the perceived Ft of the extension with the existing product/brand.
As another implication to marketing practitioners, it can be appropriate to mention that consumer innovativeness can be a good base for segmentation. If the firm can divide its market based on the level of the consumers’ innovativeness, it could use different marketing strategies for different consumer groups. For example, for the segments that are less innovative, the brand extension strategy could be used since it reduces the risk perception of consumers. The consumers who are emotionally innovative, on the other hand, could be motivated to buy the BE’s through sales promotions which would let the consumers try the product and reduce their financial risks.
Regarding future research, although only complement, substitute and transfer dimensions of Ft are examined in this study; Ft is a broad concept including the image Ft that goes beyond the functional Ft. So, in another study, it would be good to analyze the concept of Ft and all its dimensions, individually and broadly. For example, the transfer dimension of Ft reflects the consumers’ perceptions about the firm’s ability to produce the extension product. But the issues that should be included in further studies range from how consumers can know about the firm’s ability, the factors affecting their beliefs about this dimension, any communication or positioning strategies of the firm that might help convince consumers about the firm’s ability to produce the extension product, the value of these strategies before the introduction of the extension, and finally, to how the effect of the congruence of the positioning strategies of the parent brand and the extended product will affect the evaluation of the brand extension.
This study was conducted in the FMCG industry; it does not reflect the situation in other industries such as durable goods. In different industries, some other factors could also be important, such as the increase of consumer involvement. Moreover, the study could be replicated for the services, and for experiential goods such as movies or games, and the results could be compared. The sample profile could be changed. In considering the influential role of children in purchase decisions today and their cognitive process relative to the adults’ (Zhang and Sood, 2002), it would be good to explore how
83
children assess BE’s. In future studies, the symbolic vs. the functional brand divergence could be analyzed from the BE Evaluation perspective.
Instead of looking at cases from a single direction, it would also be enlightening to examine the effects of BE’s on the PB which direct the researchers to reciprocal impacts. Because in this study, as in most of the BE studies, hypothetical extensions have been used, studies using actual BE’s could have important contributions both to the literature and the practice. While the respondents were only given information about the product category of the extension, some more information about the extension, such as price or point of sales, might have other influences such as decreasing the PB effect. This study was limited, having been conducted by the PB users only. In future studies, the evaluations of both the PB users and non-users could be compared and the effect of being a user or owner seen.
Last but not least, it could be said that the findings of the study have shown the attitudes and purchase intention of consumers which might be very different in reality. Therefore, for such a study, it would be useful to observe the behavior of consumers in an experimental setting where there are the prototypes of the extensions.
NOTE
1. Fast Moving Consumer Goods (FMCG) are products that are sold quickly at relatively low cost. Examples include non-durable goods such as soft drinks, toiletries, grocery items etc.
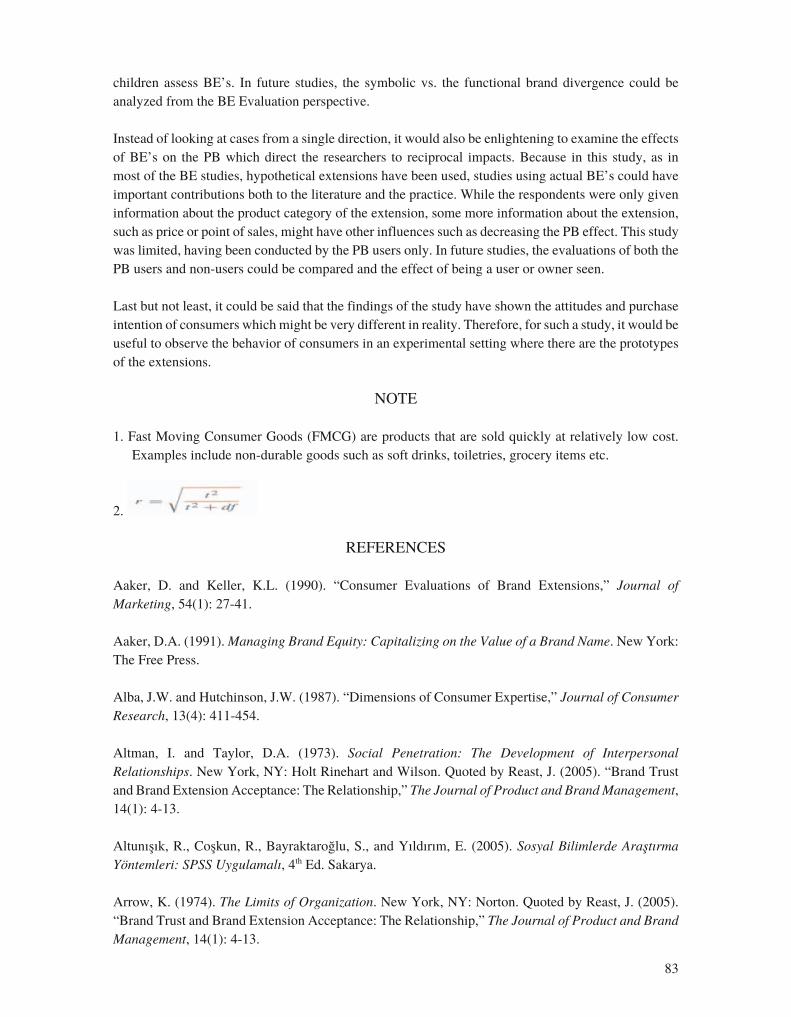
2.
REFERENCES
Aaker, D. and Keller, K.L. (1990). “Consumer Evaluations of Brand Extensions,” Journal ofMarketing, 54(1): 27-41.
Aaker, D.A. (1991). ManagingBrandEquity:CapitalizingontheValueofaBrandName. New York: The Free Press.
Alba, J.W. and Hutchinson, J.W. (1987). “Dimensions of Consumer Expertise,” JournalofConsumerResearch, 13(4): 411-454.
Altman, I. and Taylor, D.A. (1973). Social Penetration: The Development of InterpersonalRelationships. New York, NY: Holt Rinehart and Wilson. Quoted by Reast, J. (2005). “Brand Trust and Brand Extension Acceptance: The Relationship,” The JournalofProductandBrandManagement, 14(1): 4-13.
Altunışık, R., Coşkun, R., Bayraktaroğlu, S., and Yıldırım, E. (2005). SosyalBilimlerdeAraştırmaYöntemleri:SPSSUygulamalı, 4th Ed. Sakarya.
Arrow, K. (1974). TheLimitsofOrganization. New York, NY: Norton. Quoted by Reast, J. (2005). “Brand Trust and Brand Extension Acceptance: The Relationship,” The JournalofProductandBrandManagement, 14(1): 4-13.
84
Ateş, R. (2007). “Market Rafına Girmek Mucize mi?” Available [on line] at:http://www.sirketdoktoru.net/content/view /63/38/, (05.07.2010).
Batey, M. (2008). BrandMeaning. New York: Taylor and Francis.
Bhat, S, and Reddy, S.K. (2001). “The Impact of Parent Brand Attribute Associations and Affect on Brand Extension Evaluation,” JournalofBusinessResearch, 53(3): 111-122.
Bidault, F. and Jarillo, J.C. (1997). “Trust in Economic Transitions,” Trust,FirmandSociety: 81-94. London: Macmillan. Quoted by Reast, J. (2005). “Brand Trust and Brand Extension Acceptance: The Relationship,” TheJournalofProductandBrand Management, 14(1): 4-13.
Boush, D., Shipp, S., Loken, B., Gençtürk, E., Crockett, S., Kennedy, E., Minshall, B., Rochford, L., and Strobel, J. (1987). “Affect Generalization to Similar and Dissimilar Brand Extensions,” ConsumerBehaviorSeminar,PsychologyandMarketing, 4(3): 225-237.
Boush, D.M. and Loken, B. (1991). “A Process-Tracing Study of Brand Extension Evaluation,” JournalofMarketingResearch, 28(1): 16-28.
Briggs, S.R. and Cheek, J.M. (1986). “The Role of Factor Analysis in the Development and Evaluation of Personality Scales,” JournalofPersonality, 54(1): 106-148.
Broniarczyk, S.M. and Alba, J.W. (1994). “The Importance of Brand in Brand Extensions,” JournalofMarketingResearch, 31(2): 214-228.
Chaudhuri, A. (2006). EmotionandReasoninConsumerBehavior. Elsevier Inc.
Chaudhuri, A. and Holbrook, M.B. (2001). “The Chain of Effects from Brand Trust and Brand Affect to Brand Performance: The Role of Brand Loyalty,” Journalof Marketing, 65(2): 81-93.
Child, D. (1990). TheEssentialsofFactorAnalysis, 2nd Ed. London: Cassel Educational Limited.
Crosby, L.A., Evans, K.R., and Cowles, D. (1990). “Relationship Quality in Services Selling: An Interpersonal Influence Perspective.” JournalofMarketing, 54(3): 68-81. Quoted by Reast, J. (2005). “Brand Trust and Brand Extension Acceptance: The Relationship,” TheJournalofProductandBrandManagement, 14(1): 4-13.
Dacin, P.A. and Smith, D.C. (1994). “The Effect of Brand Portfolio Characteristics on Consumer Evaluations of Brand extensions,” JournalofMarketingResearch, 31(2): 229-342.
Dawar, N. (1996). “Extensions of Broad Brands: The Role of Retrieval in Evaluations of Fit,” JournalofConsumerPsychology, 5(2): 189-207.
Diamantopoulos, A., Smith, G., and Ian, G. (2005). “The Impact of Brand Extensions on Brand Personality: Experimental Evidence,” EuropeanJournalofMarketing, 39(1/2):129-149.
85
Dwyer, F., Schurr, P.H., and Oh, S. (1987). “Developing Buyer-Seller Relationships,” Journal ofMarketing, 51(2): 11-27. Quoted by Reast, J. (2005). “Brand Trust and Brand Extension Acceptance: The Relationship,” TheJournalofProductandBrand Management, 14(1): 4-13.
Farquarr, P.H., Herr, P.M., and Fazio, R.H. (1990). “A Relational Model for Category Extensions of Brands,” AdvancesinConsumerResearch, 17(1): 846-860.
Ferrel, O.C. and Hartline, M.D. (2008). MarketingStrategy,4th Ed. Thompson Higher Education.
Field, A. (2005). DiscoveringStatisticsUsingSPSS, 2nd Ed. Sage Publications.
Gatignon, H. and Robertson T.S. (1985). “A Propositional Inventory of New Diffusion Research,” JournalofConsumerResearch, 11(4): 849-867.
Gibson, R. (1990). “The End of Line? Overkill on Extensions,” WallStreetJournal, (June 18):1.
Glynn, M.S. and Brodie, R.J. (1998). “The Importance of Brand Specific Associations in Brand Extension: Further Empirical Results,” TheJournalofProductandBrandManagement, 7(6): 509-518.
Gronhaug, K., Hem, L., and Line R. (2002). “Exploring the Impact of Product Category Risk and Consumer Knowledge in Brand Extensions,” JournalofBrand Management, 9(6): 463-476.
Heding, T., Knudtzen, C.F., and Bjerre, M. (2009). Brand Management: Research, Theory andPractice, 1st Ed. Routledge.
Hirschman, E. (1980). “Innovativeness, Novelty Seeking, and Consumer Creativity,” Journal ofConsumerResearch, 7(3): 283-295.
Kapferer, J.N. (2008). New Strategic BrandManagement:Creating and SustainingBrandEquityLongTerm, 4th Ed. Kogan Page Limited.
Kelekçi, M. (2003). “Reklamda Şirket Sayısı Artmıyor,” Capital Aylık İş ve Ekonomi Dergisi. Available [on line]at: http://www.capital.com.tr/haber .aspx?hbr_kod=842, (06.01.2009).
Keller, K.L. (1993). “Conceptualizing, Measuring, and Managing Customer-Based Brand Equity,” JournalofMarketing, 57(1): 1-22.
------, (2008). StrategicBrandManagement:Building,Measuring,andManagingBrandEquity, 3rd Ed. Prentice Hall.
Keller, K.L. and Aaker, D.A. (1992). “The Effects of Sequential Introduction of Brand Extensions,” JournalofMarketingResearch, 29(1): 35-50.
Klink, R.R. and Smith, D.C. (2001). “Threats to the External Validity of Brand Extension Research,” JournalofMarketingResearch, 38(3): 326-335.
86
Kotler, P. and Armstrong, G. (2006). PrinciplesofMarketing, 11th Ed. Prentice Hall.
Kwun, J.W. (2004). “Consumers’ Evaluations of Brand Portfolios,” Unpublished Dissertation. Iowa State University.
Lahiri, I. and Gupta, A. (2005). “Brand Extensions in Consumer Non-durables, Durables and Services: A Comparative Study,” SouthAsianJournalofManagement, 12(4): 25-34.
Loken, B. and Ward, J. (1990). “Alternative Approaches to Understanding the Determinants of Typicality,”JournalofConsumerResearch, 17(2): 111-126.
Loken, B. and Deborah, R.J. (1993). “Diluting Brand Beliefs: When do Brand Extensions Have a Negative Impact?” JournalofMarketing, 57(3): 71-84.
MacInnis, D.I. and Nakamoto, K. (1990). “Cognitive Associations and Product Category Comparisons: The Role of Knowledge Structure and Context.” Working Paper, School of Business, University of Arizona.
Madhok, A. (1995). “Revisiting Multinational Firms’ Tolerance for Joint-Ventures: A Trust-Based Approach,” Journal of International Business Studies, 26(1): 30-43. Quoted by Reast, J. (2005). “Brand Trust and Brand Extension Acceptance: The Relationship,” TheJournalofProductandBrandManagement, 14(1): 4-13.
Marangoz, M. (2007). “Marka Değeri Algılamalarının Marka Yayılmaya Etkileri,” EgeAkademikBakış,7(2): 459-483.
McWilliam, G. (1993). “The Effect of Brand Typology on Brand Extension Fit: Commercial and Academic Research Finding,” EuropeanAdvancesinConsumer Research, 1(1): 485-491.
Muroma, M. and Saari, H. (1996). “Fit as Determinant of Success,” in J. Beracs, A. Bauer, and J. Simon (eds.), MarketingforanExpandingEurope,Proceedingsofthe25thAnnualConferenceoftheEuropeanMarketingAcademy, 1959-1963. Quoted by Thorbjørnsen, H. (2005). “Brand Extensions: Brand Concept Congruency and Feedback Effects Revisited,” The Journal of Product andBrand Management, 14(4/5): 250-257.
Myers, J.H. and Alpert M.I. (1968). “Determinant Buying Attitudes: Meaning and Measurement,” JournalofMarketing, 32(4): 13-20.
Nielsen, (2008). “Perakendeci Sayıları Tespit Çalışması,” GidaSanayii. Available [on line] at: http://www.gidasanayii.com/modules.php?name=News&file=article&sid= 14860, (05.07.2010)
Nkwocha, I., Bao, Y., Johnson, J.W., and Brotspies, H.V. (2005). “Product Fit and Consumer Attitude toward Brand Extensions: The Moderating Role of Product Involvement,” Journal of MarketingTheoryandPractice, 13(3): 49-61.
Öncel, S. (2005). “Bir Şemsiyeye Kaç Ürün Sığar?” CapitalAylıkİşveEkonomiDergisi. Available [on line] at: http://www.capital.com.tr /haber.aspx?hbr_kod=1935; (05.05.2009).
87
Özüpak, G. (2008). “Brand Extensions: The Role of Brand Familiarity, Similarity and Parent Brand Attitude in Consumer Evaluation,” Unpublished Master’s Thesis. Marmara Üniversitesi, Sosyal Bilimler Enstitüsü,.
Park, W.C., Milberg, S., and Lawson R. (1991). “Evaluation of Brand Extensions: The Role of Product Feature Similarity and Brand Concept Consistency,” JournalofConsumerResearch, 18(2): 185-193.
Pitta, D.A. and Katsanis, L.P. (1995). “Understanding Brand Equity for Successful Brand Extension,” TheJournalofConsumerMarketing, 12(4): 51-64.
Reast, J. (2005). “Brand Trust and Brand Extension Acceptance: The Relationship,” TheJournalofProductandBrandManagement, 14(1): 4-13.
Reddy, S.K., Holak, S.L., and Bhat, S. (1994). “To Extend or Not to Extend: Success Determinants of Line Extensions,” JournalofMarketingResearch, 31(2): 241-260.
Rogers, E.M. (1983). DiffusionofInnovations, 3rd Ed. New York, NY: The Free Press.
Scanzoni, J. (1979). “Social Exchange and Behavioral Independence,” in R.L. Burgess and T.L. Huston (eds.), Social Exchange inDevelopingRelations, New York: Academic Press. Quoted by Reast, J. (2005). “Brand Trust and Brand Extension Acceptance: The Relationship,” TheJournalof ProductandBrandManagement, 14(1): 4-13.
Schlenker, B.R., Helm, R., and Tedeschi, J.T. (1973). “The Effects of Personality and Situational Variables on Interpersonal Trust,” JournalofPersonalityandSocialPsychology, 25: 419-427. Quoted by Reast, J. (2005), “Brand Trust and Brand Extension Acceptance: The Relationship,” TheJournalofProductandBrandManagement, 14(1): 4-13.
Sharp, B.M. (1993). “Managing Brand Extensions,” TheJournalofConsumerMarketing, 10(3): 11-17.
Smith, D.C. and Park, W.C. (1992). “The Effects of Brand Extensions on Market Share and Advertising Efficiency,” JournalofMarketingResearch, 29(3): 296-313.
Smith, R.E. and Swinyard, W.R. (1982). “Information Response Models: An Integrated Approach,” JournalofMarketing, 46(1): 81-93.
Steenkamp, J.E.M. and Baumgartner, H. (1992). “The Role of Optimum Stimulation Level in Exploratory Consumer Behavior,” JournalofConsumerResearch, 19(3): 434-448.
Swaminathan, V., Fox, R.J., and Reddy, S. (2001). “The Impact of Brand Extension Introduction on Choice,” JournalofMarketing, 65(4): 1-15.
Şencan, H. (2005). SosyalveDavranışsalÖlçümlerdeGüvenilirlikveGeçerlilik. Seçkin Yayıncılık.
Tauber, E. (1981). “Brand Franchise Extensions: New Products Benefit from Existing Brand Names,” BusinessHorizons, 24(2): 36-41.
88
Tauber, E. (1988). “Brand Leverage: Strategy for Growth In a Cost Control World,” Journal ofAdvertisingResearch, 28(4): 26-30.
Taylor, D. (2004). BrandStretch:Why1in2ExtensionsFailandHowtoBeattheOdds:ABrandgymWorkout. John Wiley and Sons Ltd.
Thorbjørnsen, H. (2005). “Brand Extensions: Brand Concept Congruency and Feedback Effects Revisited,” TheJournalofProductandBrandManagement, 14(4): 250-257.
Uzun, Y. and Erdil, S.T. (2004). “Marka Yayma Stratejilerinde Ürün Benzerliğinin Etkisi ve Üç Ayrı Marka Üzerinde Bir Uygulama,” DoğuşÜniversitesiDergisi, 5(2): 227-241.
Vanhonacker, W.R. (2007). “Brand Extension Naming Strategies: An Exploratory Study of the Impact of Brand Traits,” MarketLetters, 18(1/2): 61-72.
VanRiel, A.C.R., Lemmink, J., and Ouwersloot, H. (2001). “Consumer Evaluations of Service Brand Extensions,” JournalofServiceResearch, 3(3): 220-231.
Venkatraman, M.P. (1991). “The Impact of Innovativeness and Innovation Type on Adoption,” JournalofRetailing,67(1): 51-67.
Wu, C. and Yen, Y. (2007). “How the Strength of Parent Brand Associations Influence the Interaction Effects of Brand Breadth and Product Similarity with Brand Extension Evaluations,” Journal ofProductandBrandManagement, 16(5): 334-341.
Xie, H.Y. (2008). “Consumer Innovativeness and Consumer Acceptance of Brand Extensions,” JournalofProductandBrandManagement,17(4): 235-243.
Yeniçeri, T. and Akturan, U. (2008). “Marka Yayma Stratejisinin Başarısını Farklı Değerlendiren Tüketicilerin Marka İmajı ve Risk Algılamaları Bakımından Farklılaşıp Farklılaşmadığının Belirlenmesi,” Öneri MarmaraÜniversitesiSosyalBilimlerEnstitüsüDergisi, 8(29): 83- 94.
Zeithaml, V.A. (1988). “Consumer Perceptions of Price, Quality, and Value: A Means-End Model and Synthesis of Evidence,” JournalofMarketing, 52(3): 2-22.
Zhang, S. and Sood, S. (2002). “Deep and Surface Cues: Brand Extension Evaluations by Children and Adults,” JournalofConsumerResearch, 29(1): 129-141.
Zimmer, M. R. and Bhat, S. (2004). “The Reciprocal Effects of Extension Quality and Fit on Parent Brand Attitude,” TheJournalofProductandBrandManagement, 13(1): 37-46.
Zucker, L.G. (1986). “Production of Trust: Institutional Sources of Economic Structure 1840-1920,” Research inOrganizationalBehavior, 8(1): 53-111. Quoted by Reast, J. (2005). “Brand Trust and Brand Extension Acceptance: The Relationship,” TheJournalof ProductandBrandManagement, 14(1): 4-13.
89
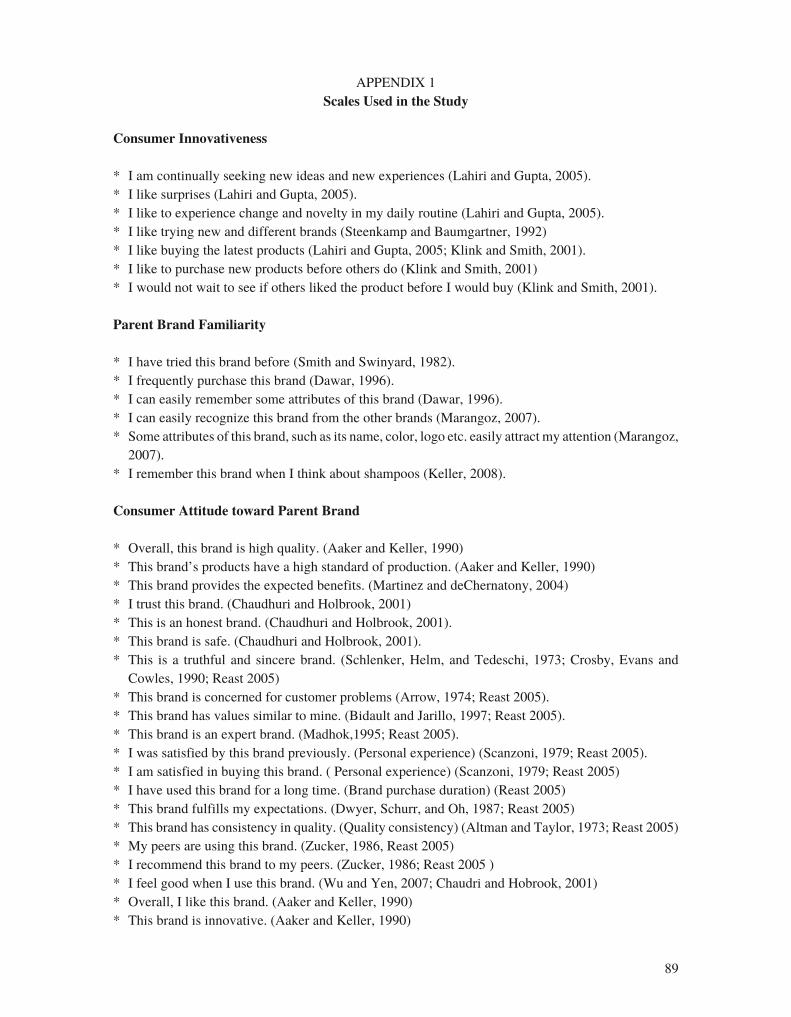
APPENDIX 1Scales Used in the Study
Consumer Innovativeness
* I am continually seeking new ideas and new experiences (Lahiri and Gupta, 2005).* I like surprises (Lahiri and Gupta, 2005).* I like to experience change and novelty in my daily routine (Lahiri and Gupta, 2005).* I like trying new and different brands (Steenkamp and Baumgartner, 1992)* I like buying the latest products (Lahiri and Gupta, 2005; Klink and Smith, 2001).* I like to purchase new products before others do (Klink and Smith, 2001)* I would not wait to see if others liked the product before I would buy (Klink and Smith, 2001).
Parent Brand Familiarity
* I have tried this brand before (Smith and Swinyard, 1982).* I frequently purchase this brand (Dawar, 1996).* I can easily remember some attributes of this brand (Dawar, 1996).* I can easily recognize this brand from the other brands (Marangoz, 2007).* Some attributes of this brand, such as its name, color, logo etc. easily attract my attention (Marangoz,
2007).* I remember this brand when I think about shampoos (Keller, 2008).
Consumer Attitude toward Parent Brand
* Overall, this brand is high quality. (Aaker and Keller, 1990)* This brand’s products have a high standard of production. (Aaker and Keller, 1990)* This brand provides the expected benefits. (Martinez and deChernatony, 2004)* I trust this brand. (Chaudhuri and Holbrook, 2001)* This is an honest brand. (Chaudhuri and Holbrook, 2001).* This brand is safe. (Chaudhuri and Holbrook, 2001).* This is a truthful and sincere brand. (Schlenker, Helm, and Tedeschi, 1973; Crosby, Evans and
Cowles, 1990; Reast 2005)* This brand is concerned for customer problems (Arrow, 1974; Reast 2005).* This brand has values similar to mine. (Bidault and Jarillo, 1997; Reast 2005).* This brand is an expert brand. (Madhok,1995; Reast 2005).* I was satisfied by this brand previously. (Personal experience) (Scanzoni, 1979; Reast 2005).* I am satisfied in buying this brand. ( Personal experience) (Scanzoni, 1979; Reast 2005)* I have used this brand for a long time. (Brand purchase duration) (Reast 2005)* This brand fulfills my expectations. (Dwyer, Schurr, and Oh, 1987; Reast 2005)* This brand has consistency in quality. (Quality consistency) (Altman and Taylor, 1973; Reast 2005)* My peers are using this brand. (Zucker, 1986, Reast 2005)* I recommend this brand to my peers. (Zucker, 1986; Reast 2005 )* I feel good when I use this brand. (Wu and Yen, 2007; Chaudri and Hobrook, 2001)* Overall, I like this brand. (Aaker and Keller, 1990)* This brand is innovative. (Aaker and Keller, 1990)
90
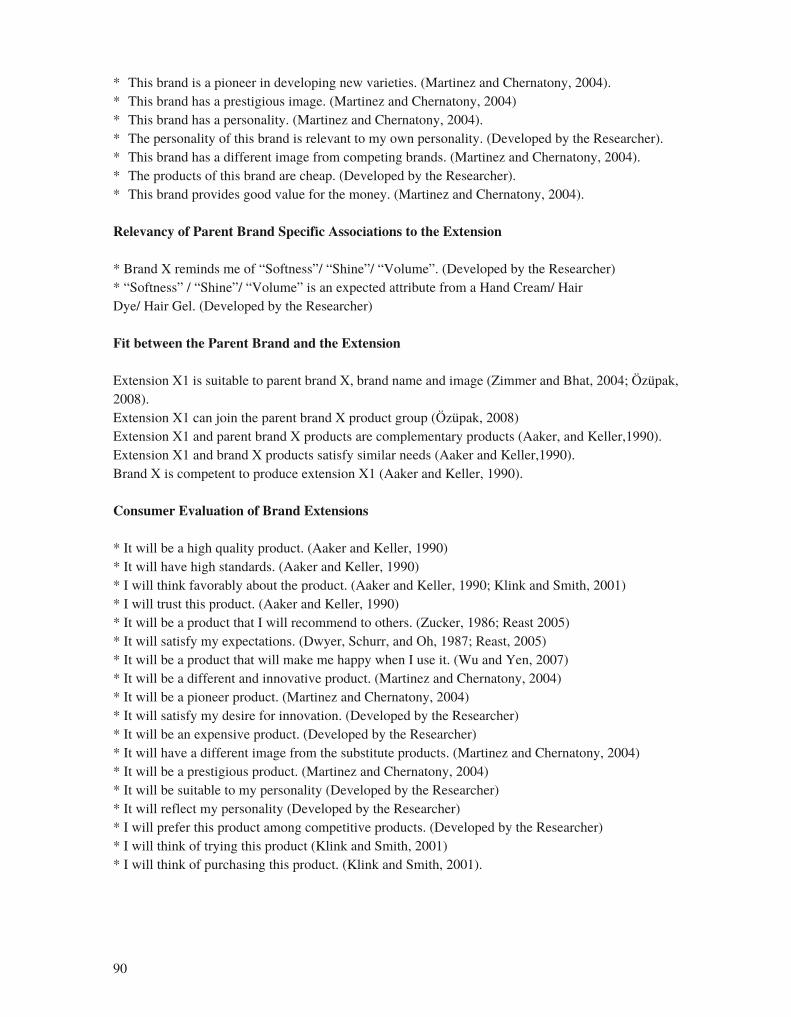
* This brand is a pioneer in developing new varieties. (Martinez and Chernatony, 2004).* This brand has a prestigious image. (Martinez and Chernatony, 2004)* This brand has a personality. (Martinez and Chernatony, 2004).* The personality of this brand is relevant to my own personality. (Developed by the Researcher).* This brand has a different image from competing brands. (Martinez and Chernatony, 2004).* The products of this brand are cheap. (Developed by the Researcher).* This brand provides good value for the money. (Martinez and Chernatony, 2004).
Relevancy of Parent Brand Specific Associations to the Extension
* Brand X reminds me of “Softness”/ “Shine”/ “Volume”. (Developed by the Researcher)* “Softness” / “Shine”/ “Volume” is an expected attribute from a Hand Cream/ HairDye/ Hair Gel. (Developed by the Researcher)
Fit between the Parent Brand and the Extension
Extension X1 is suitable to parent brand X, brand name and image (Zimmer and Bhat, 2004; Özüpak, 2008).Extension X1 can join the parent brand X product group (Özüpak, 2008)Extension X1 and parent brand X products are complementary products (Aaker, and Keller,1990).Extension X1 and brand X products satisfy similar needs (Aaker and Keller,1990).Brand X is competent to produce extension X1 (Aaker and Keller, 1990).
Consumer Evaluation of Brand Extensions
* It will be a high quality product. (Aaker and Keller, 1990)* It will have high standards. (Aaker and Keller, 1990)* I will think favorably about the product. (Aaker and Keller, 1990; Klink and Smith, 2001)* I will trust this product. (Aaker and Keller, 1990)* It will be a product that I will recommend to others. (Zucker, 1986; Reast 2005)* It will satisfy my expectations. (Dwyer, Schurr, and Oh, 1987; Reast, 2005)* It will be a product that will make me happy when I use it. (Wu and Yen, 2007)* It will be a different and innovative product. (Martinez and Chernatony, 2004)* It will be a pioneer product. (Martinez and Chernatony, 2004)* It will satisfy my desire for innovation. (Developed by the Researcher)* It will be an expensive product. (Developed by the Researcher)* It will have a different image from the substitute products. (Martinez and Chernatony, 2004)* It will be a prestigious product. (Martinez and Chernatony, 2004)* It will be suitable to my personality (Developed by the Researcher)* It will reflect my personality (Developed by the Researcher)* I will prefer this product among competitive products. (Developed by the Researcher)* I will think of trying this product (Klink and Smith, 2001)* I will think of purchasing this product. (Klink and Smith, 2001).