Embed Size (px)
Citation preview
FACTORS AFFECTING FOREIGN DIRECT
INVESTMENT DECISION IN MALAYSIA
BY
ONG KER XIN
P’NG GEOK THYE
POON DAO CHUN
TAN LAY YOKE
YONG KAH CHUN
A research project submitted in partial fulfillment of the
requirement for the degree of
BACHELOR OF FINANCE (HONS)
UNIVERSITI TUNKU ABDUL RAHMAN
FACULTY OF BUSINESS AND FINANCE
DEPARTMENT OF FINANCE
AUGUST 2012

Factors Affecting Foreign Direct Investment Decision in Malaysia
ii
Copyright @ 2012
ALL RIGHTS RESERVED. No part of this paper may be reproduced, stored in a
retrieval system, or transmitted in any form or by any means, graphic, electronic,
mechanical, photocopying, recording, scanning, or otherwise, without the prior
consent of the authors.

Factors Affecting Foreign Direct Investment Decision in Malaysia
iii
DECLARATION
We hereby declare that:
(1) This undergraduate research project is the end result of our own work and that
due acknowledgement has been given in the references to ALL sources of
information be they printed, electronic, or personal.
(2) No portion of this research project has been submitted in support of any
application for any other degree or qualification of this or any other university,
or other institutes of learning.
(3) Equal contribution has been made by each group member in completing the
research project.
(4) The word count of this research report is 21506 words.
Name of Student: Student ID: Signature:
1. Ong Ker Xin 10ABB01498 ______________
2. P’ng Geok Thye 10ABB01695 ______________
3. Poon Dao Chun 10ABB01696 ______________
4. Tan Lay Yoke 10ABB00364 ______________
5. Yong Kah Chun 10ABB01227 ______________
Date: _______________________
Factors Affecting Foreign Direct Investment Decision in Malaysia
iv
ACKNOWLEDGEMENT
Without the assistance, cooperation and guidance of several parties, this
research project would not be achievable. We would like to take this opportunity to
thank everyone who have helped and guided us in completing this research project.
Firstly, we would like to express our heartfelt gratitude and appreciation to
our supervisor, Ms. Wei Chooi Yi who had guided us throughout the duration of this
study. We appreciate the valuable time, guidance and advices she has given us for the
completion of this research project.
Furthermore, we would also like to thank the lecturers and tutors of UTAR
who have guided us directly and indirectly with new insights and ideas on the path of
completing this study. Besides, we deeply appreciate the moral support,
understanding and endless love in which our family have given unconditionally
throughout the process.
Lastly, the cooperation and support received from all the members who
contributed to this research was vital for the success of this project. The ideas,
suggestions, and perspective given greatly enhanced this research project. Once again,
we are in grateful and in appreciation of all the assistance contributed for our study.

Factors Affecting Foreign Direct Investment Decision in Malaysia
v
TABLE OF CONTENTS
Page
Copyright Page…………………………………………………….………………….ii
Declaration………………………………………………………….………………..iii
Acknowledgement…………………………………………………….……….……..iv
Table of Contents……………………………………………………….…….…….…v
List of Tables………………………………………………………………………....ix
List of Figures………………………………………………………….……………...x
List of Abbreviations……………………………………………………………....…xi
List of Appendices………………………………………………………..………....xiii
Preface………………………………………………………………………………..xv
Abstract………………………………………………………………………….…..xvi
CHAPTER 1 RESEARCH OVERVIEW
1.0 Introduction……………………………………………………….1
1.1 Research Background…………………………………..….…..…..1
1.1.1 Foreign Direct Investment in Malaysia……….…..........4
1.2 Problem Statement…..…………………………….…………........5
1.3 Research Objectives……………..…………………….………....12
1.3.1 General Objective……..……………….………….......12
1.3.2 Specific Objectives………..…………….………….....12
1.4 Research Questions………………………..……….………….…12
1.5 Hypotheses of the Study………………..………….………….…13
1.6 Significance of the Study………………………..….……….…...14
1.7 Chapter Layout…………………………………..….…...….........16
1.7.1 Chapter 1………………………………….…….….....16
1.7.2 Chapter 2………………………………….………......16
1.7.3 Chapter 3………………….…………….………....….17
1.7.4 Chapter 4………………….…………….……...….….17
1.7.5 Chapter 5………………………….…….………….....17
1.8 Conclusion…………………………………….….………….......18

Factors Affecting Foreign Direct Investment Decision in Malaysia
vi
CHAPTER 2 LITERATURE REVIEW
2.0 Introduction………………………………………………............19
2.1 Review of Literature…………………………………….….........19
2.1.1 Foreign Direct Investments……………………............19
2.1.2 Economic Growth…………….……………….…..…...20
2.1.3 Market Size……………………………………..…..….21
2.1.4 Inflation Rate…………………………………..…..…..23
2.1.5 China FDI Inflow…………………………….………..25
2.1.6 Exchange Rate……………………………….……...…27
2.1.7 Trade Openness……………..………….….….…….....28
2.1.8 Quality of Infrastructure………………..……….…..…30
2.2 Review of Relevant Theoretical Models………………..…...…...32
2.3 Proposed Conceptual Framework……………………..….….......33
2.4 Hypotheses Development…………...…………………..….….....35
2.5 Conclusion…………...…………………………………..…...…..37
CHAPTER 3 METHODOLOGY
3.0 Introduction……………………………………………..…….….38
3.1 Research Design……………………………………….…….…...39
3.2 Data Collection Methods…………………………………....……40
3.3 Data Processing………………………………………….….…....41
3.4 Data Analysis…………………………………………….….…...42
3.4.1 Eviews……………………………………….……...…42
3.4.2 Multiple Linear Regressions……………………...…...43
3.4.3 F-test Statistic………………………………….…..…..44
3.4.4 T-test Statistic……………………………………...…..45
3.4.5 Diagnostic Checking…………………………….….....45
3.4.5.1 Model Specification and Normality
Test……………………………………..…..46
3.4.5.2 Multicollinearity………………………...….47
3.4.5.3 Autocorrelation……………………………..48
3.4.5.4 Heteroscedasticity…………….…………….49
Factors Affecting Foreign Direct Investment Decision in Malaysia
vii
3.5 Conclusion……………………………..………………………....49
CHAPTER 4 DATA ANALYSIS
4.0 Introduction……………………………………………….…….…50
4.1 Empirical Result of Multiple Linear Regressions Model……........50
4.1.1 Diagnostic Checking of Multiple Linear Regressions
Model………………………………………………….51
4.2 Problem Solving………………………………………….…..........54
4.2.1 Problem Solving of Model Specification………….......54
4.2.1.1 Diagnostic Checking of Semi-Logarithmic:
Log-Lin Model……….……………….………55
4.2.1.2 Problem Solving of Multicollinearity….……..55
4.3 Empirical result of Model 1……………………………….…........57
4.3.1 Diagnostic Checking of Model 1………………..….....58
4.3.2 Heteroscedasticity Problem Solving of Model 1……...59
4.3.3 Autocorrelation Problem Solving of Model 1………...60
4.4 Empirical Result of Model 5…………………………..….…….…60
4.4.1 Diagnostic Checking of Model 5……………….…..…60
4.4.2 Problem Solving of Model 5…………………….….....61
4.5 Interpretation of Multiple Linear Regressions Results of Model 1
and 5………………………………………………….…….…......62
4.5.1 Interpretation of Model 1 Result……………….……...63
4.5.2 Interpretation of Model 5 Result……………….…..….64
4.6 Conclusion……………………………………………….………..65
CHAPTER 5 DISCUSSION, CONCLUSION AND IMPLICATIONS
5.0 Introduction…………………………………………….….……….67
5.1 Summary of Statistical Analyses………………………….….........67
5.2 Discussions of Major Findings………………………………..…...70
5.2.1 Market Size……………………………………….…..70
5.2.2 Economic Growth……………………………….…....71
5.2.3 Exchange Rate………………………..……….….......71
5.2.4 Quality of Infrastructure………………………….......72
Factors Affecting Foreign Direct Investment Decision in Malaysia
viii
5.2.5 Trade Openness………………………………...……..73
5.2.6 Inflation Rate……………………………..……..…....74
5.2.7 China FDI Inflows………………………………........75
5.3 Implications of the Study………………………………..…….........76
5.4 Limitations of the Study………………………………….………...78
5.5 Recommendations for Future Research……………..…..…….........79
5.6 Conclusion………………………………………………..…….......80
References…………………………………………………………………...…..…...81
Appendices…………………………………………………………………..….........88
Factors Affecting Foreign Direct Investment Decision in Malaysia
ix
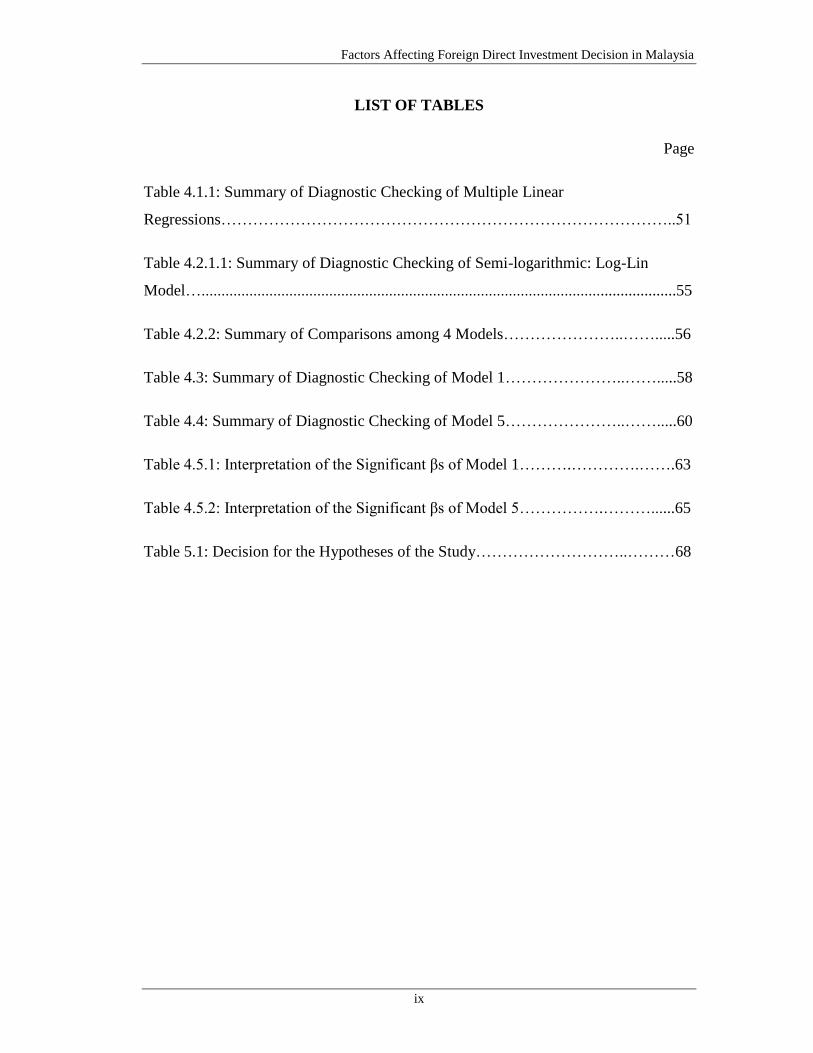
LIST OF TABLES
Page
Table 4.1.1: Summary of Diagnostic Checking of Multiple Linear
Regressions…………………………………………………………………………..51
Table 4.2.1.1: Summary of Diagnostic Checking of Semi-logarithmic: Log-Lin
Model….......................................................................................................................55
Table 4.2.2: Summary of Comparisons among 4 Models…………………..…….....56
Table 4.3: Summary of Diagnostic Checking of Model 1…………………..…….....58
Table 4.4: Summary of Diagnostic Checking of Model 5…………………..…….....60
Table 4.5.1: Interpretation of the Significant βs of Model 1……….………….…….63
Table 4.5.2: Interpretation of the Significant βs of Model 5…………….………......65
Table 5.1: Decision for the Hypotheses of the Study………………………..………68
Factors Affecting Foreign Direct Investment Decision in Malaysia
x
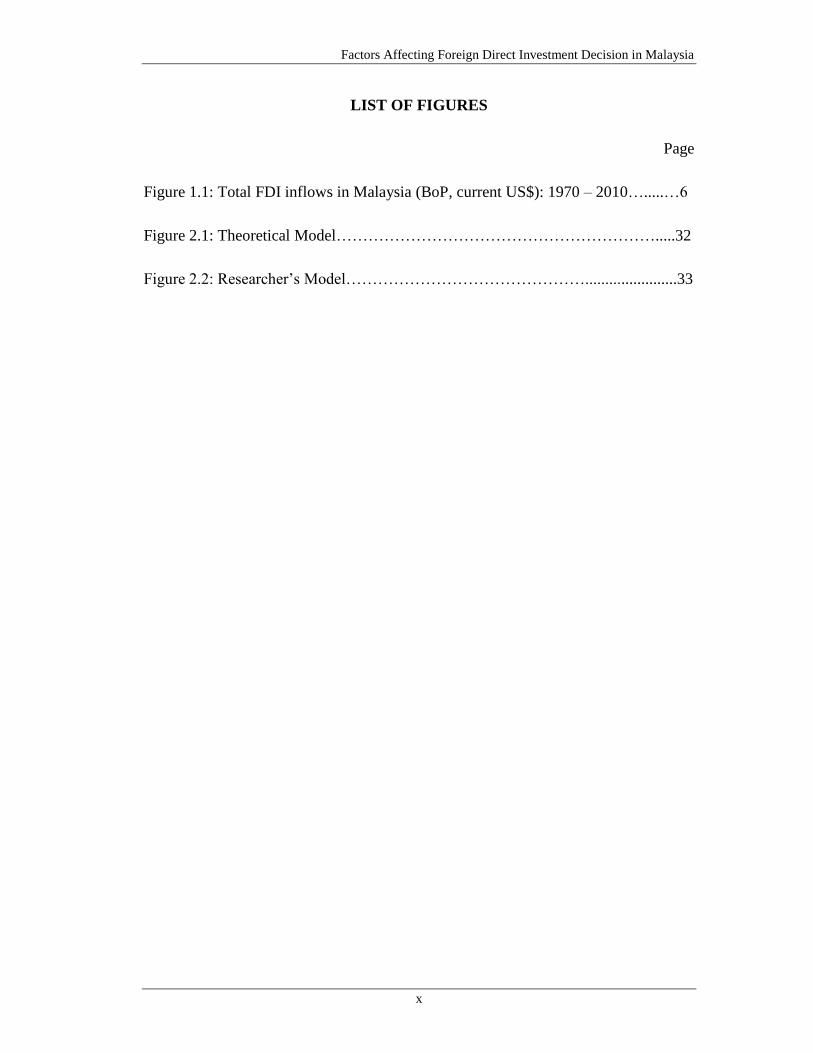
LIST OF FIGURES
Page
Figure 1.1: Total FDI inflows in Malaysia (BoP, current US$): 1970 – 2010….....…6
Figure 2.1: Theoretical Model…………………………………………………….....32
Figure 2.2: Researcher’s Model……………………………………….......................33
Factors Affecting Foreign Direct Investment Decision in Malaysia
xi
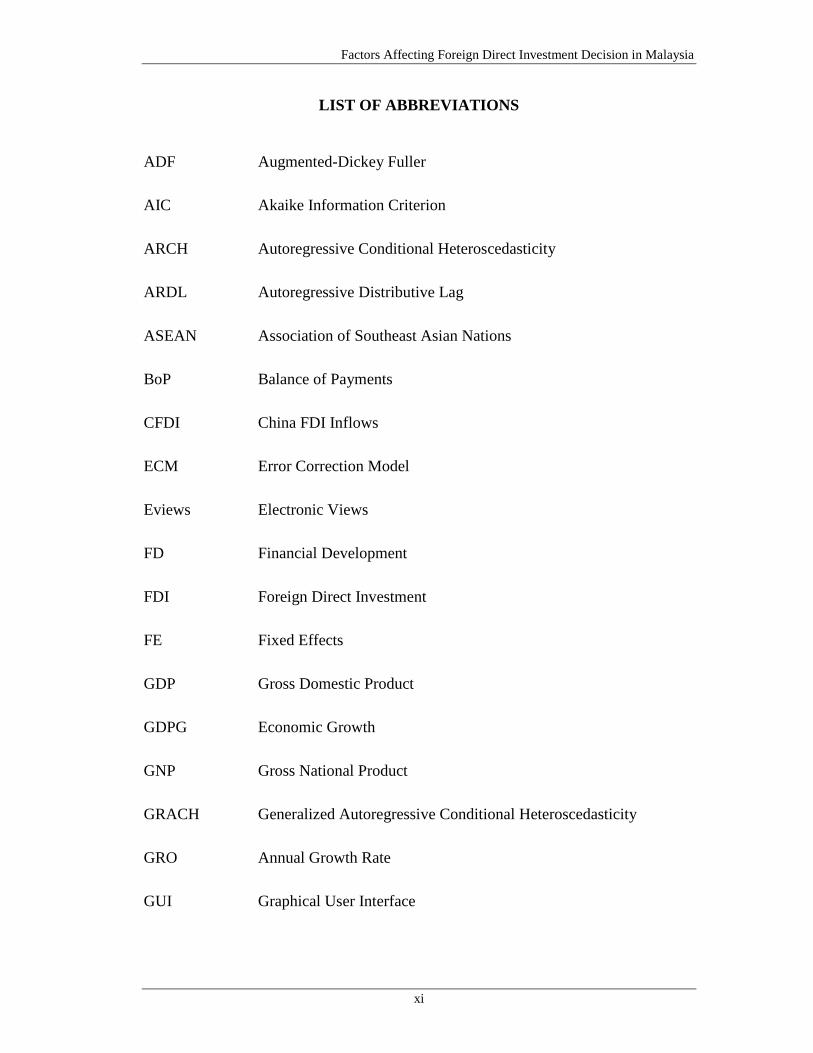
LIST OF ABBREVIATIONS
ADF Augmented-Dickey Fuller
AIC Akaike Information Criterion
ARCH Autoregressive Conditional Heteroscedasticity
ARDL Autoregressive Distributive Lag
ASEAN Association of Southeast Asian Nations
BoP Balance of Payments
CFDI China FDI Inflows
ECM Error Correction Model
Eviews Electronic Views
FD Financial Development
FDI Foreign Direct Investment
FE Fixed Effects
GDP Gross Domestic Product
GDPG Economic Growth
GNP Gross National Product
GRACH Generalized Autoregressive Conditional Heteroscedasticity
GRO Annual Growth Rate
GUI Graphical User Interface
Factors Affecting Foreign Direct Investment Decision in Malaysia
xii
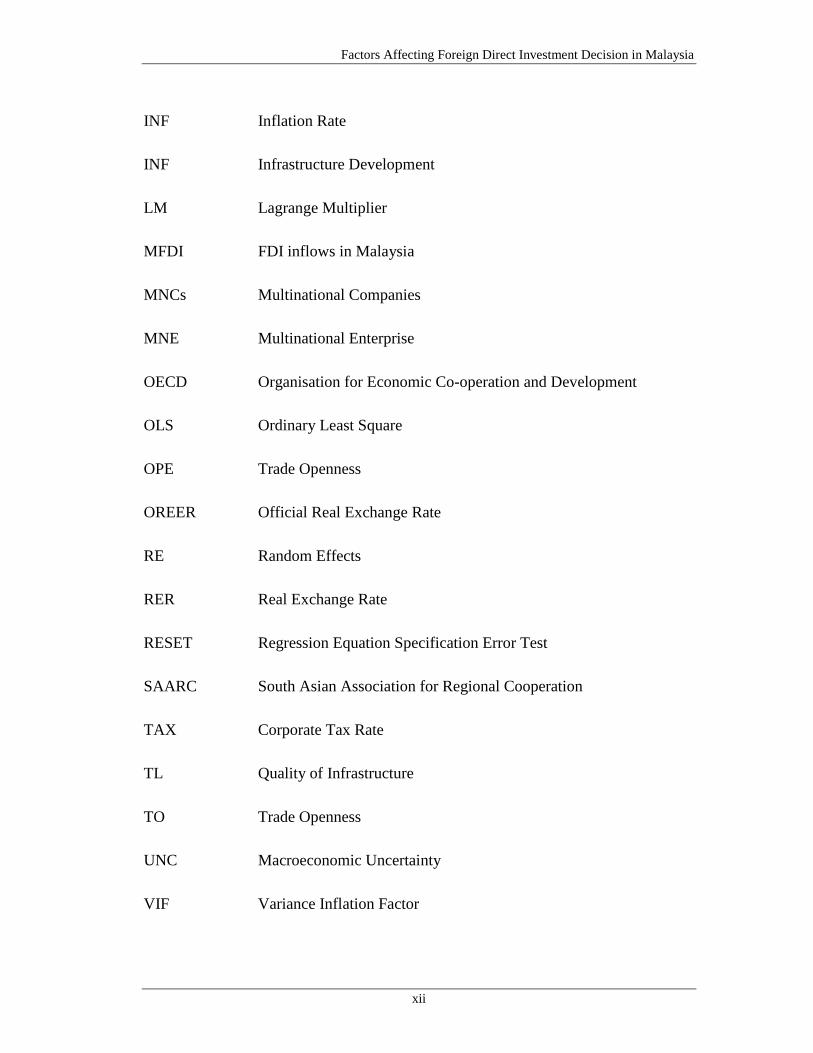
INF Inflation Rate
INF Infrastructure Development
LM Lagrange Multiplier
MFDI FDI inflows in Malaysia
MNCs Multinational Companies
MNE Multinational Enterprise
OECD Organisation for Economic Co-operation and Development
OLS Ordinary Least Square
OPE Trade Openness
OREER Official Real Exchange Rate
RE Random Effects
RER Real Exchange Rate
RESET Regression Equation Specification Error Test
SAARC South Asian Association for Regional Cooperation
TAX Corporate Tax Rate
TL Quality of Infrastructure
TO Trade Openness
UNC Macroeconomic Uncertainty
VIF Variance Inflation Factor
Factors Affecting Foreign Direct Investment Decision in Malaysia
xiii
LIST OF APPENDICES
Page
Appendix 1: Empirical Result of Multiple Linear Regression Model………..…..…88
Appendix 2: Normality Test of Multiple Linear Regression Model (Jarque-Bera
Normality Test)..………………………………………………….……………..…...89
Appendix 3: Model Specification Test of Multiple Linear Regression Model (Ramsey
RESET Test) ………………………….………………………………………..........90
Appendix 4: Multicollinearity Testing of Multiple Linear Regression
Model……………………………………………………………………….…..……91
Appendix 5: Heteroscedasticity Testing (Autoregressive Conditional
Heteroscedasticity (ARCH) Test) …………..….…....……………………................92
Appendix 6: Autocorrelation Testing (Breusch-Godfrey LM Test)………..........…..99
Appendix 7: Residual Graph of the Multiple Linear Regression Model………...…106
Appendix 8: Empirical Result of Semi-logarithmic: Log-Lin Model….………..…107
Appendix 9: Normality Test of Semi-logarithmic: Log-Lin Model (Jarque-Bera
Normality Test)………………………………………….……………………….....108
Appendix 10: Model Specification test of Semi-Logarithmic: Log-Lin Model
(Ramsey RESET Test)…………………………………….……………..…………109
Appendix 11: Empirical Result of Model 1……………….…………….……….…110
Appendix 12: Empirical Result of Model 2……………….……………….…….…111
Appendix 13: Empirical Result of Model 3……………….…………….……….…112
Appendix 14: Empirical Result of Model 4……………….…………….……….…113
Appendix 15: Normality Test of Model 1 (Jarque-Bera Normality Test)….……....114
Factors Affecting Foreign Direct Investment Decision in Malaysia
xiv
Appendix 16: Model Specification Test of Model 1 (Ramsey RESET Test)…..…..115
Appendix 17: Multicollinearity Testing of Model…………………………...……..116
Appendix 18: Heteroscedasticity Testing (Autoregressive Conditional
Heteroscedasticity (ARCH) Test) of Model 1…………………………..……..…...117
Appendix 19: Autocorrelation Testing (Breusch-Godfrey LM Test) of Model 1….124
Appendix 20: Residual Graph of Model 1………………………….……...….........131
Appendix 21: Heteroscedasticity Problem Solving of Model 1 by using White’s
Heteroscedasticity-consistent Variances and Standard Errors Methods………..….132
Appendix 22: Empirical Result of Model 5…………………………………......….133
Appendix 23: Normality Test of Model 5 (Jarque-Bera Normality Test)....….........134
Appendix 24: Model Specification Test of Model 5 (Ramsey RESET Test)……....135
Appendix 25: Heteroscedasticity Testing (Autoregressive Conditional
Heteroscedasticity (ARCH) Test) of Model 5……………………………..……….136
Appendix 26: Autocorrelation Testing (Breusch-Godfrey LM Test) of Model 5….143
Appendix 27: Residual Graph of Model 5…………………………………..….......150
Appendix 28: Heteroscedasticity Problem Solving of Model 5 by using White’s
Heteroscedasticity-consistent Variances and Standard Errors Methods…..………..151
Appendix 29: Hypothesis Testing Overall Significance and Individual Regression
Coefficients Significance of Multiple Regression of Model 1……………..………152
Appendix 30: Hypothesis Testing Overall Significance and Individual Regression
Coefficients Significance of Multiple Regression of Model 5………………..……156
Factors Affecting Foreign Direct Investment Decision in Malaysia
xv
PREFACE
This research paper is submitted as a part of the requirement to fulfill for the
Bachelor of Finance (Hons) course. The title chosen for this research project is
“Factors affecting foreign direct investment decisions in Malaysia”. It revolves
around the determinants of the foreign direct investment inflows in Malaysia.
Foreign Direct Investment (FDI) is one of the key drivers in speeding up the
development and economic growth in Malaysia. Sound macroeconomic management,
presence of a well functioning financial system and sustained economic growth has
made Malaysia an attractive country for FDI. Moreover, FDI plays a crucial role in
Malaysia economy as it generates economic growth by increasing capital formation
through the expansion of production capacity.
It is reported that the charm of Malaysia in attracting FDI had declined
eventually from 1992 until 2001. It was then increased from 2002 to 2006 but
dropped significantly from 2007 to 2009. Surprisingly, FDI inflow in Malaysia
increased dramatically in 2010. The high volatility of FDI inflows to Malaysia has
drawn attention to the further study of the determinants of FDI inflow in Malaysia.
Factors Affecting Foreign Direct Investment Decision in Malaysia
xvi
ABSTRACT
Foreign Direct Investment (FDI) plays a crucial role in speeding up the
development and economic growth of a country. In particular, developing countries
rely heavily on FDI to promote their economy as they face capital shortage for their
development process. FDI not only brings in capitals and technology, but also skills
into developing countries. And these ended up helping the countries to grow faster by
satisfying the country’s needs.
The strong growth performances experienced by Malaysia economy greatly
depends on the FDI. FDI generates economic growth by increasing capital formation
through the expansion of production capacity, promotion of export growth and
creation of employment in Malaysia. FDI inflows of Malaysia started fluctuating
from 1996 to 2010 and this high volatility of Malaysia FDI inflows drew the
researchers’ attention to examine the factors affecting FDI inflows in Malaysia by
using the annual data from year 1982-2010. Multiple linear regressions model is
applied to study the relationship between explanatory variables (market size,
economic growth, exchange rate, quality of infrastructure, trade openness, inflation
rate and China FDI inflow) and explained variable (Malaysia FDI inflow).
Empirical results show that market size, economic growth, trade openness,
inflation rate and China FDI inflow significantly and positively affect Malaysia FDI
inflows. Other than that, exchange rates also significantly affect Malaysia FDI
inflows; when Ringgit Malaysia depreciates against other currencies, FDI inflows of
Malaysia decrease. Last but not least, quality of infrastructure failed to establish a
significant relationship with Malaysia FDI inflows.
Factors Affecting Foreign Direct Investment Decision in Malaysia
Page 1 of 157
CHAPTER 1: RESEARCH OVERVIEW
1.0 Introduction
Chapter 1 covers the brief introduction on the topic researchers chose to do in this
study, starting from the big picture narrowing down to the field for which
researchers focused on. First off, some studies are done on Foreign Direct
Investment (FDI), defining and explaining how it works. The effects FDI brought
on to a country will also be discussed in this section. Follow on, the topic are
narrowed down on to the chosen country – Malaysia. In this section, problem
statements regarding the FDI in Malaysia and the involved independent variables
will be introduced. Research objectives are then written down with more in depth
as researchers go on further into the topic. Research questions and hypothesis on
the study will also be inscribed accordingly. Under the sub topic significance of
study, the importance and contributions of the research will be discussed. Before
the chapter ends, a layout on each chapter will also be briefly outlined. Altogether,
there will be 5 chapters including: Chapter 1: Research Overview, Chapter 2:
Literature Review, Chapter 3: Methodology, Chapter 4: Data Analysis, and
Chapter 5: Discussion, Conclusion and Implications. Last but not least, Chapter 1
is concluded by providing a summary and linkage to the next chapter covering the
literature review.
1.1 Research Background
The Economy Watch (2010) defines Foreign Direct Investment (FDI) as a type of
investment involving the injection of foreign funds into an enterprise that operates
in a different country of origin from the investor. More specifically, FDI refers to
the investment of foreign asset into domestic goods and services and this does not
include the foreign investments in stock markets. FDI can be carried out through
joint ventures, Greenfield investments and cross-border acquisitions. Joint venture
Factors Affecting Foreign Direct Investment Decision in Malaysia
Page 2 of 157
is a shared ownership with the local investors in a foreign business. This strategy
will turns out good if the MNE finds the right local partner as it can reduce
political and country risks, which in turn, increase the understanding on the local
market. However, if the wrong partner is chosen instead, political risk and agency
costs may occur. Meanwhile, a Greenfield investment is to establish a production
or service facility “starting from ground up”. It usually requires extended periods
of physical construction and organizational development. Cross-border acquisition,
on the other hand, is to directly acquire a company in the targeted country. This
requires a short period of time to gain presence and it is also a cost-effective way
of gaining competitive advantages such as brand names valued in the targeted
market (Moffett, Stonehill, & Eitheman, 2009).
According to Awan, Khan, and Zaman (2011), FDI is an essential component to
the efficient functioning of International Economic system as it speeds up the
development and economic growth of a country. However, the FDI benefits in
which host countries can expect to receive depend on the co-operation of their
government. The authors also pointed out that FDI mobilizes the capital from rich
countries to capital scarce countries. As a result, both countries can gain from this
capital movement. Shortage of capital for the development process has always
been a key problem in developing countries (Aqeel & Nishat, 2004). This is
mainly because domestically generated resources are insufficient to satisfy the
growing needs of investments in education, infrastructure and exploitation of
natural resources, thus, resulting in their inability to generate internal savings that
meet their investment needs (Vadlamannati, Tamazian, & Irala, 2009). FDI
inflows act as the lifeblood to developing countries as it brings capital to their
countries. Other than that, it made possible the transfer of technology and
managerial skills, increase in employment and enhancement in the productivity of
home country (Awan, Khan, & Zaman, 2011). Besides, FDI also benefits
investors in developed countries by enabling them to take ownership advantage in
the host country and gain profits. As a result, there is mutual benefit in the
international movement of capital among countries.
Factors Affecting Foreign Direct Investment Decision in Malaysia
Page 3 of 157
Despite the advantages of FDI, it had also led to a few negative effects. First and
foremost is the repatriation of investment income. When foreign investors invest
in the host country, they are compensated in the form of dividends. It will then be
brought back to their country, thus, causing an outflow of fund for the host
country. The next problem is the high import content. The large inflow of FDI into
the country has brought about an increase in the imports of intermediate goods,
consequently, growth in the import bill. “Crowding-out” effects also make up as
another problem of FDI. As foreign investors invest in the host country, it
increases industry concentration and market power of a few large firms. This in
turns, create barriers for other small firms to enter (Wong & Jomo, 2005). In
conclusion, FDI brings both advantages and disadvantages to the nation‟s
economy.
Moffett, Stonehill, and Eitheman (2009) also explained that the motives of
Multinational Enterprise (MNE) investing abroad can be summarized into 5
categories comprising of market seekers, raw material seekers, production
efficiency seekers, knowledge seekers and political seekers. Market seekers
produce in foreign countries and can either export to other markets or used to
satisfy the local demands. On the other hand, raw material seekers extract raw
materials that they can find in other countries. They then either use them for
export or further processed and sell it in the country in which the raw materials are
found. Production efficiency seekers have similar concept with the raw material
seekers. They prefer to produce in countries where one or more factors of
production are underpriced in relation to their productivity. Following are the
knowledge seekers who operate in foreign countries to gain access to technology
or managerial expertise. With better technology or managerial expertise, one can
increase productivity and reduce the cost. Hence, achieving the primary objective
of MNE investing abroad – reduction of cost. Last but not least, political safety
seekers acquire or establish new operations in countries with low economy and
political risks.
Factors Affecting Foreign Direct Investment Decision in Malaysia
Page 4 of 157
1.1.1 Foreign Direct Investment in Malaysia
Foreign direct investment is the key driver underlying the strong growth
performances experienced by the Malaysian economy. Sound
macroeconomic management, presence of a well functioning financial
system and sustained economic growth has made Malaysia an attractive
country for FDI. Other than that, the government policy reforms like
introduction of the Investment Incentives Act in 1968, establishment of
free trade zones in the early 1970, and the provision of export incentives
alongside the acceleration of open policy in the 1980s has attracted a large
amount of FDI inflow in the late 1980s (Ang, 2008). The sharp increase in
FDI of Malaysia was due to the coincidence of the foreign investment
regime which was further liberalized as part of the structural adjustment
reforms implemented in response to the macroeconomic crisis in the mid-
1980. In addition, the move by firms from Japan, South Korea, United
States and Taiwan in relocating their production bases to low-cost
countries due to the rising wages in the domestic countries also plays a part
in the increment of FDI in Malaysia (Athukorala & Waglé, 2011).
In the second half of 1980s and 1990s, the total FDI inflow into ASEAN
countries increased dramatically from an annual level of US$3 billion to
US$30 billion. Singapore remained by far the largest recipient of FDI in
the region, whereas Malaysia accounted for 25% of the total inflows into
ASEAN countries (Athukorala & Waglé, 2011). According to Karimi,
Yusop, and Law (2010), based on the result of TOPSIS method which is
used in ranking ASEAN countries in term of attraction and capacity for
FDI in 2005, Malaysia was at the second place whereas the first ranking
belongs to Singapore. This shows that Malaysia is the most attractive
country for FDI among the ASEAN countries right after Singapore.
FDI plays several crucial roles in Malaysia economy; the most crucial one
is to generate economic growth by increasing capital formation through the
expansion of production capacity. The second role is to promote export
Factors Affecting Foreign Direct Investment Decision in Malaysia
Page 5 of 157
growth. Investing firms which have its own product reputation and brand
image in the international market reduces the need for domestic firms to
spend resources and time to penetrate and acquire foreign markets. The
facilitation of the new technology transfer to the host country and
reduction in unemployment through the expansion of the economy and job
creations resume as the third role of FDI. In addition, FDI also acts as an
agent of transformation in the Malaysian economy. This is proven with the
dominance of the influx of FDI into the manufacturing sector in its
transformation from agricultural economy to industrialized economy
(Abdul Rahim, 2006). Wong and Jomo (2005) point out that FDI can bring
in foreign exchange to be used in the payment of necessary capital and
intermediate goods imports, consequently, solving the foreign exchange
problems.
1.2 Problem Statement
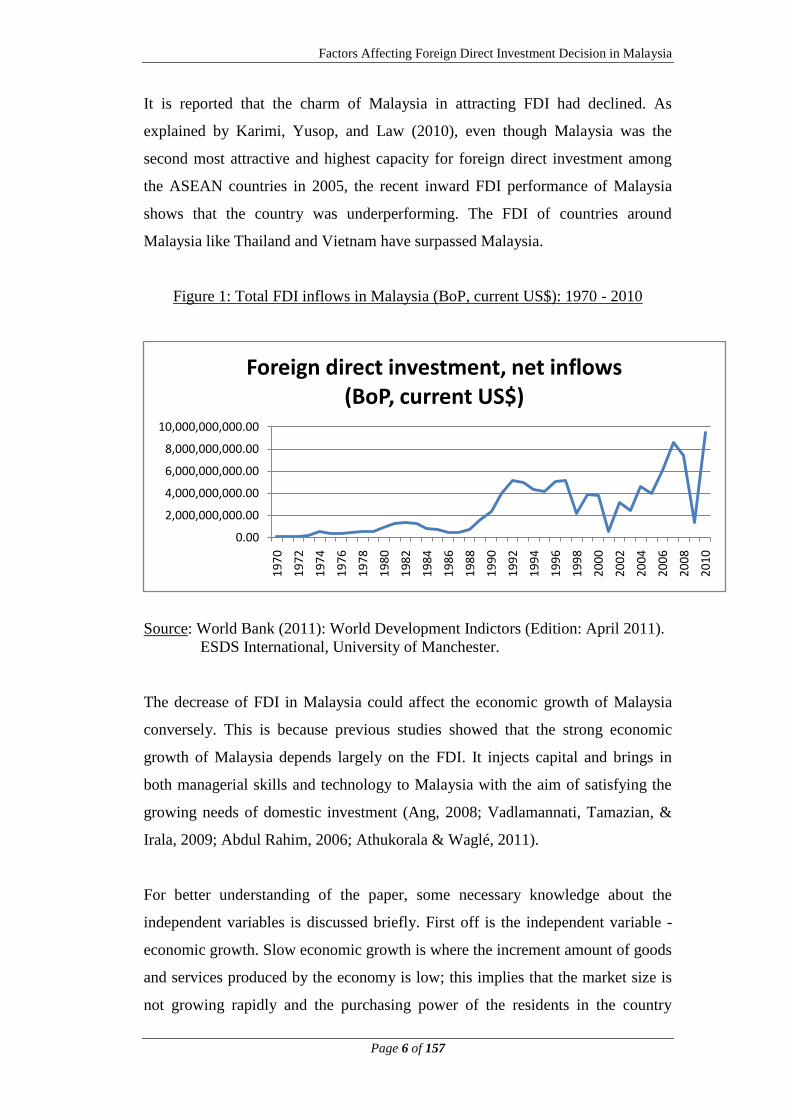
As observed from Figure 1, researchers found that Malaysia‟s FDI net inflows
(BoP, current US$) were decreasing from 1992 reaching to a minimum point in
2001 with a total amount of FDI net inflows (BoP, current US$) of
US$ 553,947,368.42 only. This is the lowest amount attained since 1980s. The
average FDI net inflows (BoP, current US$) that was decreasing since 1992 was
able to increase later from 2002 to 2006. However, the FDI net inflows (BoP,
current US$) dropped significantly from US$ 8,590,185,403.74 in 2007 to
US$ 1,387,393,683.06 in 2009. Surprisingly, things turned the other way round in
2010 as the FDI inflow in Malaysia increased dramatically and reached a net
amount of US$ 9,509,265,455.11. It is by far the highest amount achieved among
the recent years. According to Athukorala and Waglé (2011), Malaysia‟s
impressive FDI inflow was severely disrupted by the financial crisis from 1997 to
1998 as they see the magnitude of FDI in Malaysia dipped during the period. The
high volatility of FDI inflows in Malaysia has drawn attention to the further study
of the determinants of FDI inflow in Malaysia.
Factors Affecting Foreign Direct Investment Decision in Malaysia
Page 6 of 157
It is reported that the charm of Malaysia in attracting FDI had declined. As
explained by Karimi, Yusop, and Law (2010), even though Malaysia was the
second most attractive and highest capacity for foreign direct investment among
the ASEAN countries in 2005, the recent inward FDI performance of Malaysia
shows that the country was underperforming. The FDI of countries around
Malaysia like Thailand and Vietnam have surpassed Malaysia.
Figure 1: Total FDI inflows in Malaysia (BoP, current US$): 1970 - 2010
Source: World Bank (2011): World Development Indictors (Edition: April 2011).
ESDS International, University of Manchester.
The decrease of FDI in Malaysia could affect the economic growth of Malaysia
conversely. This is because previous studies showed that the strong economic
growth of Malaysia depends largely on the FDI. It injects capital and brings in
both managerial skills and technology to Malaysia with the aim of satisfying the
growing needs of domestic investment (Ang, 2008; Vadlamannati, Tamazian, &
Irala, 2009; Abdul Rahim, 2006; Athukorala & Waglé, 2011).
For better understanding of the paper, some necessary knowledge about the
independent variables is discussed briefly. First off is the independent variable -
economic growth. Slow economic growth is where the increment amount of goods
and services produced by the economy is low; this implies that the market size is
not growing rapidly and the purchasing power of the residents in the country
0.00
2,000,000,000.00
4,000,000,000.00
6,000,000,000.00
8,000,000,000.00
10,000,000,000.00
19
70
19
72
19
74
19
76
19
78
19
80
19
82
19
84
19
86
19
88
19
90
19
92
19
94
19
96
19
98
20
00
20
02
20
04
20
06
20
08
20
10
Foreign direct investment, net inflows (BoP, current US$)
Factors Affecting Foreign Direct Investment Decision in Malaysia
Page 7 of 157
increase sluggishly. The retarded economic growth in host country discourages
investors to invest in the host country itself as it does not offer any beneficial
opportunities for investors. Foreign investors aiming at making profits prefer
growing economies to large economies (Demirhan & Masca, 2008). There is no
reason for the investors to invest in a sluggishly growing economy as the rates of
return for the investors is low and the duration to get back their principal is longer
in comparison to investing in a rapidly growing economy. This is because slow
growing economy affects the product sales, and thus, the growth of profit.
Therefore, given that the percentage of return receives year after year comes short,
investors will not be satisfied and will no longer be motivated to make any further
investment anymore. In particular, this will be in controversial with the ultimate
objective of market-seeking firm, which is to expand the business to a larger
market in order to earn more profit. In short, economic growth is an important
independent variable to be included in this study.
The next independent variable is the market size. Jordaan (as cited in Demirhan
and Masca, 2008) mentioned that FDI will move to large expanding markets with
greater purchasing power in which firms can potentially get profit from
investment. The main objective multinational enterprises expand their business
abroad is so that they can produce abroad as locals and serve the local and
regional markets without any imposition of import tax. Small market size implies
that the purchasing power and the demand of residents are low. There are not
many opportunities for foreign investors to expand business into small market as
small market size provides less efficient utilization of resources and exploitation
of economies scale. Firms always take advantage of economies of scale so that
they can produce in a larger quantity at a reduced cost. Small market size prohibits
the firm from enjoying such advantage because with the given market size and
demand of product, there is no reason for the firm to produce more than what the
market demand. As the quantity of products produced is small, the fixed cost per
unit increase. This is because fixed cost like rental and salary of employee are
invariant to the number of product produced. Thus, the lower the number of
production, the higher the average cost of product. This process is better known as
the “diseconomies of scale”. With the higher product cost, firms are unable to earn
more profit or increase their competency by setting a lower selling price. This
Factors Affecting Foreign Direct Investment Decision in Malaysia
Page 8 of 157
creates more opportunities for producers who are capable of producing at a lower
cost and sell it at a lower price to enter the industry. The level of competition both
from and for the foreign investors has increased. Hence, if the foreign firms are
unable to compete with the other firms, the possibility of the firms coming down
to bankruptcy is high. For this reason, the risk that foreign investors have to bear
with the choice of investing in small market size is further increased. Thus, it is an
obvious fact that FDI is not in favour to be invested in small market size country.
From the explanation above, researchers can see clearly that market size is an
important factor that affects the decision of FDI.
The third independent variable is China FDI inflow which is less studied as the
factor of FDI in Malaysian case. China could be a threat to other countries nearby
like Malaysia, Thailand, Vietnam and Indonesia. According to Chantasasawat,
Fung, Iizaka, and Siu (2004), several governments have publicly noted that the
emergence of China has diverted direct investment away from their economies.
And policymakers throughout the region are convinced that the rise of China has
contributed to the foreign and domestic investors leaving their countries and
investing in China instead. China is a large country with an outstanding capability
to attract more FDI into its country than any others countries. With the high
population and market size of billions of people and the availability of large lands
for foreign investors to build their business, no wonder there is so many foreign
investors interested in the country. In other countries where there is limited land,
the price of land might be higher due to the short of supply. High population in
China creates high labour force, thus, reducing the cost of labour. Foreign
investors are attracted by these benefits and lots of the manufacturers choose to
build their factory in China to take advantage of the cheap production costs and
increased profits. With China‟s large market size and high demand, foreign
investors will be able to enjoy the benefits of economies of scale as they produce
and invest in China. Consequently, as large amount of FDI goes into China, the
neighbouring countries will only be able to shares out the remaining amount of
FDI. This leaves negative effects on the countries that heavily rely on FDI. As a
result, it is crucial to take account of China FDI inflow in the determination of
FDI inflow in Malaysia.
Factors Affecting Foreign Direct Investment Decision in Malaysia
Page 9 of 157
Other than China FDI inflows, exchange rate is also an important factor that
affects FDI. Exchange rate is of the main concern when foreign firms make
decisions on the choice of investment because it has large impact on the capital
invested. Foreign investors do not like to invest in country with high currency
value. This is because high currency value reduces the capital of the investments.
For instance, the exchange rate of Malaysia and United States is RM3.5 / US$ 1
and RM 2.5 / US$ 1 respectively. When US firms choose to invest in Malaysia
with the amount of US$ 10, 000,000, the firm can acquire RM 35, 000,000 of
capital in Malaysian Ringgit if the exchange rate is RM 3.5 / US$ 1. However, if
the Malaysian Ringgit appreciate to RM 2.5 / US$ 1, the capital that can be used
in Malaysia to make investment is substantially reduce to RM 25,000,000. From
the above situation, researchers can see that the appreciation in the currency value
of the host country (Malaysia) reduce the capital that the investors can use to
make investment in host country. Smaller amount of fund have to be distributed
among the purchase of raw materials, hire of labour and construction of building.
As a result, high currency value is not preferable by investors. Foreign investors
like depreciated currency value because it would lead to higher relative wealth
position of foreign investors, and hence, lower relative cost of capital (Ang, 2007).
Due to the effect of the exchange rate, it is vital to include exchange rate in our
study of factors affecting FDI in Malaysia.
The fifth factor which is the inflation rate represents the stability of economy. The
higher the inflation rate, the lower the economic stability. The low inflation rates
have been effective in attracting FDI to developing country (Demirhan & Masca,
2008). The low economic stability increases the risk of the investors in face of
losses. During high inflation period, the general prices of goods and services rise.
This erodes the purchasing power of public as they need more money to buy a
product in comparison to the time period before inflation. Eventually, the quantity
of goods and services demanded will decrease. The drop in the quantity demanded
will also lead to the decrease in sales. Moreover, the cost of raw materials needed
for production increase as well and firms will not be able to exploit the advantage
of low production costs. For instance, previously RM 10,000 can purchase 1000
units of woods to produce chairs. However, with the same amount of money
during inflation period, the producer will only be able to purchase 800 units of
Factors Affecting Foreign Direct Investment Decision in Malaysia
Page 10 of 157
wood. As the average cost of production rise, the selling prices of the product
increase, leading the public to the inability to meet up with the expenses. And in
the end, it will negatively affect the profit of the business and indirectly affects the
return of the investors. As a result, due to the impact inflation rate have on the
profitability of business, it is important to be considered by investors before
making any investment in that country.
Other than that, infrastructure quality is also another determinant of FDI.
Infrastructures such as road, ports, railways and telecommunication system are the
basic needs of firms in support of daily business routine. Poor infrastructures that
reduce productivity and potential of investments are major constraint for low-
income countries. Cost of transport and delivery time will be increased due to the
poor infrastructure. OECD points out that although a lot of interest arose among
foreign investors on the country of China emerged after 1979, large FDI inflow
did not occur in the initial period due to the poor infrastructure (as cited in Ali and
Guo, 2005). As market-seeking firms invest and produce in foreign countries, it
will have to deliver it to different regions of the countries after production so as to
serve the local consumers‟ needs. Poor road and railway condition would increase
the possibility of transport break down, delay in delivery time and damage of
products on the way to its destination. Multinational enterprise that set up
subsidiary in host country takes telecommunication seriously because of its role as
a bridge that connects both the parent and subsidiary company. Poor
telecommunication services such as problematic internet connection restraint
parent company from doing distance monitoring and supervising the activities of
their subsidiary. Nowadays, company use video conferencing to monitor their
subsidiary and conduct meeting with other company in order to save time and cost.
For all these reasons, researchers are convinced that infrastructure quality is
significant in attracting FDI.
Last but not least is the trade openness of the host country. Trade openness
indicates the degree host country response to trade, and it involves both import
and export activities. Country which dislikes import and export would impose a
high tariff on both imported and exported goods. This would discourage foreign
investors to make investment in host country, in particular, export-oriented firms.
Factors Affecting Foreign Direct Investment Decision in Malaysia
Page 11 of 157
According to Aqeel and Nishat (2005), horizontal FDI is motivated by lower trade
cost, hence, high tariff barriers induce firm to engage in horizontal FDI to replace
exports with production abroad by foreign affiliates. Export-oriented firms import
materials that cannot be found in host country to be further processed and
exported to other countries for sale. So if high tariff is imposed on imported goods,
the cost of producing the product would increase and the volume of import will
decrease. This will harm both the productivity and the profitability of the firm.
Vertical FDI can be characterized by individual affiliates specializing in different
stages of production output and semi products, which in turns, are exported to
other affiliates for further processing (Aqeel & Nishat, 2005). By using this
fragmenting production process, it enables company to take on different cost
advantages at different countries. For instance, ABC Company faces the problem
of high assembling cost and less profitable sales in country A but yet do not want
to give up on their business. Fortunately, the cost of labour in country B is very
low. Company A can opt to reduce their cost significantly with the assembly of
products done in country B and then export back to country A for sale. Therefore,
by acquiring the material at a lower cost in country A and assembling the final
product in country B, the cost of the product is reduced in comparison to it is
finished in either of the country. This fragmentation process gives ABC Company
an opportunity to invest abroad and reduce the cost of production. However, given
that the trade openness in country B is low with the imposition of high tariff on
import and export product, the cost after the taxes will be much higher than before
the fragmentation process. The imposed taxes in country B have given up the
chance to attract foreign direct investment into country B.
In conclusion, the seven factors which are made up of economic growth, market
size, China FDI inflow, exchange rate, inflation rate, infrastructure quality and
trade openness are important in the decision making of FDI. Therefore,
researchers have included them in this study to verify whether there is relationship
between these factors and FDI in Malaysia.
Factors Affecting Foreign Direct Investment Decision in Malaysia
Page 12 of 157
1.3 Research Objectives
1.3.1 General Objective
The general objective is to examine the relationship between FDI inflows
and the independent variables in Malaysia from 1982-2010.
1.3.2 Specific Objectives
i. To examine the relationship between economic growth and FDI
inflows in Malaysia from 1982-2010.
ii. To examine the relationship between market size and FDI inflows
in Malaysia from 1982-2010.
iii. To examine the relationship between China FDI inflows and
Malaysia FDI inflows 1982-2010.
iv. To examine the relationship between exchange rate and FDI
inflows in Malaysia from 1982-2010.
v. To examine the relationship between inflation rate and FDI inflows
in Malaysia from 1982-2010.
vi. To examine the relationship between quality of infrastructure and
FDI inflows in Malaysia from 1982-2010.
vii. To examine the relationship between trade openness and FDI
inflows in Malaysia from 1982-2010.
1.4 Research Questions
i. Is there any significant relationship between FDI inflows and at
least one of the independent variables in Malaysia from year 1982-
2010?
ii. Is there any significant relationship between economic growth and
FDI inflows in Malaysia from year 1982-2010?
Factors Affecting Foreign Direct Investment Decision in Malaysia
Page 13 of 157
iii. Is there any significant relationship between market size and FDI
inflows in Malaysia from year 1982-2010?
iv. Is there any significant relationship between China FDI inflows and
Malaysia FDI inflows from year 1982-2010?
v. Is there any significant relationship between exchange rate and FDI
inflows in Malaysia from year 1982-2010?
vi. Is there any significant relationship between inflation rate and FDI
inflows in Malaysia from year 1982-2010?
vii. Is there any significant relationship between quality of infrastructure
and FDI inflows in Malaysia from year 1982-2010?
viii. Is there any significant relationship between trade openness and FDI
inflows in Malaysia from year 1982-2010?
1.5 Hypotheses of the Study
H0: There is no relationship between all independent variables and FDI
inflow in Malaysia.
H1: At least one independent variable has relationship with FDI inflow in
Malaysia
H0: There is no relationship between economic growth and FDI inflow in
Malaysia.
H1: There is relationship between economic growth and FDI inflow in
Malaysia.
H0: There is no relationship between market size and FDI inflow in
Malaysia.
H1: There is relationship between market size and FDI inflow in Malaysia.
H0: There is no relationship between China FDI inflows and FDI inflow in
Malaysia.
H1: There is relationship between China FDI and FDI inflow in Malaysia.
H0: There is no relationship between exchange rate and FDI inflow in
Malaysia.
Factors Affecting Foreign Direct Investment Decision in Malaysia
Page 14 of 157
H1: There is relationship between exchange rate and FDI inflow in
Malaysia.
H0: There is no relationship between inflation rate and FDI inflow in
Malaysia.
H1: There is relationship between inflation rate and FDI inflow in Malaysia.
H0: There is no relationship between quality of infrastructures and FDI
inflow in Malaysia.
H1: There is relationship between quality of infrastructures and FDI inflow
in Malaysia.
H0: There is no relationship between trade openness and FDI inflow in
Malaysia.
H1: There is relationship between trade openness and FDI inflow in
Malaysia.
1.6 Significance of the Study
Determinant of FDI is a popular topic among the researchers. Even though, there
have been many previous studies done on the determinants of FDI in Malaysia, in
this case, researchers have added a relatively new variables - FDI inflow of China
- into the model in order to find out whether the amount of FDI inflow to China
affects the FDI inflow of Malaysia. There have not been many researches that
included China FDI inflows as an independent variable in the examination of the
determinants of FDI inflow in Malaysia. Other than that, researchers form a new
conceptual model which differs from previous studies. Researchers modify the
theoretical framework by picking out the factors they are interested in examining
and also adding in a new variable, China FDI inflows.
This study will contributes to policymakers like Bank Negara Malaysia and the
Federal Government as it gives them a picture of what variables are significantly
affecting FDI inflows in Malaysia. Researchers have included some important
economic factors like economic growth, market size, exchange rate, inflation rate,
quality of infrastructures and trade openness. The most important factors are of
Factors Affecting Foreign Direct Investment Decision in Malaysia
Page 15 of 157
course the FDI inflows of China. Bank Negara Malaysia and Federal Government
play an important role in affecting Malaysia‟s economic environment through the
monetary policy and fiscal policy. Monetary policy is used by Bank Negara
Malaysia to stimulate economic by controlling both the money supply and
demand. On the other hand, fiscal policy is where the government uses the
expenditure and revenue (taxes) to influence the economy. This study results can
serve as a guideline or reference to Bank Negara Malaysia and the Federal
Government in formulating monetary and fiscal policy to meet up with the
preference of direct investors who consider investing in Malaysia. Besides, these
can prevent policymakers from focusing on the unnecessary areas wasting
resources in an effort to attract more FDI. With the huge amount of FDI, it will be
able to stimulate Malaysia‟s growth, increase employment rate, living standards
and technology transfer and also shorten the period to achieve Vision 2020.
China is a large country with low labour cost, large market size, and high
productivity level. For all these reasons, China easily out wins other countries in
attracting a much higher FDI into its own country. Most of the manufacturing
firms choose to invest in China to exploit the cost advantage. If in this study,
researchers found out that FDI inflow of China has significant negative
relationship with the amounts of FDI inflows in Malaysia, then the Federal
Government of Malaysia should avoid direct competition with China. In contrast,
if it is found that there is a significant positive relationship between the both,
Malaysia should maintain a good relationship with China. They may consider
improving the trading transaction with China or may be even come together with
China in constructing policy which benefits both Malaysia‟s and China‟s economy.
Other than the contribution to Bank Negara Malaysia and the Federal Government,
this study also provides guidelines or serves as a reference to potential direct
investors who wish to invest in Malaysia. Before direct investors decide on
investing in Malaysia, they will perform a series of examination on Malaysia‟s
situation to determine whether or not it is profitable for them to invest in. This
study will guide them through the determinants which have significant effect on
the FDI inflows of Malaysia. It will also prevent potential direct investors from
investing in countries with high risks and negative return.
Factors Affecting Foreign Direct Investment Decision in Malaysia
Page 16 of 157
In short, by conducting this study, researchers are able to understand more about
the determinants of FDI in Malaysia and provide a more robust result to Bank
Negara Malaysia and potential direct investors on the impact of economic growth,
market size, China FDI inflows, exchange rate, inflation rate, infrastructure
quality and trade openness have on Malaysia‟s FDI in flow.
1.7 Chapter Layout
1.7.1 Chapter 1
Chapter 1 discusses about the topic that researchers are interested to study,
introduce the topic and write out the problem statement. Other than that,
researchers will also be going through on the objective of conducting this
study, what researchers are going to investigate and also the contributions
and the importance of the study.
1.7.2 Chapter 2
Chapter 2 is the literature review part. Researchers will be summarizing on
what they understand as they read through the past researchers‟ work. This
increases researchers‟ understanding on the topic that researchers are going
to do. Besides, researchers will also review on any relevant theoretical
models and come out with the conceptual framework for the research.

Factors Affecting Foreign Direct Investment Decision in Malaysia
Page 17 of 157
1.7.3 Chapter 3
Chapter 3 is the methodology part in which there will be a description on
how the research is carried out in term of design, data collection methods,
sampling design, operational definitions of constructs, measurement scales,
and methods of data analysis. It mainly discusses the preparation work
before moving on to the data analysis part which constitutes the next
chapter.
1.7.4 Chapter 4
Chapter 4 presents pattern of result using the data and methods previously
described in chapter 3. Then, researchers will analyse the results to answer
the research questions and hypothesis written down in Chapter 1.
1.7.5 Chapter 5
Chapter 5 is the last chapter of the research in which there will be
discussion, conclusion and implications. It summarizes the whole study
and converse the major finding, what can be recommended to policy
makers and practitioners from the result obtained in the research. Other
than that, it also point out the limitations of the study and provide
recommendation so that next researcher can further the study if he / she is
interested.
Factors Affecting Foreign Direct Investment Decision in Malaysia
Page 18 of 157
1.8 Conclusion
This research paper introduce FDI in details with its definition, types of FDI,
motives of FDI, advantages and disadvantages of FDI and also how FDI works.
Moreover, this study discuss on the seven determinants of FDI that researchers are
interested in, including economic growth, market size, China FDI inflows,
exchange rate, inflation rate, infrastructure quality and trade openness.
Researchers also explained on this research‟s objectives - to understand the
determinants of FDI inflow in Malaysia in order to improve the future
performance of FDI inflow. In terms of the contribution, researchers hope this
research will provide policymakers with a better understanding of the factors
affecting FDI so that an appropriate policy can be developed. Other than that,
researchers also explain on the chapter layout of this study. After clearing up on
what need to do in this research, researchers proceed to the next chapter which is
the literature review. This research paper will also study on the past researchers‟
work on the relationship between FDI inflows and the seven determinants and
summaries it under the next chapter.
Factors Affecting Foreign Direct Investment Decision in Malaysia
Page 19 of 157
CHAPTER 2: LITERATURE REVIEW
2.0 Introduction
Past research studies relating to the determinants of FDI inflows in this research
paper are summarized in this chapter. This provides a better understanding of the
nature of FDI, economic growth, market size, China FDI inflows, exchange rate,
inflation rate, quality of infrastructure and trade openness. Other than that, the
relationships between the dependent variable and independent variables are
studied as well. With the help of the previous studied models, researchers are able
to formulate a new proposed framework for this study.
2.1 Review of the Literature
2.1.1 Foreign Direct Investments
According to Moffett, Stonehill, and Eitheman (2009), foreign direct
investment (FDI) is investment undertaken by an entity resident of one
economy in an enterprise resident in another economy, with the objectives
of obtaining and sustaining a lasting interest (profits) in the enterprise and
also to exercise a significant degree of influence in its management.
Management and voting rights are granted to the investors if the investors‟
ownership level is greater than or equal to 10% of the ordinary shares.
Shares ownership less than 10% is termed portfolio investment and is not
categorized as FDI (Economy Watch, 2010). FDI can be classified into
inward FDI and outward FDI, depending on the direction of the flow of the
money. Inward FDI occurs when foreign capital is invested in local
resources whereas outward FDI refers to local resources invested in
foreign country, also named as “direct investment abroad”.
Factors Affecting Foreign Direct Investment Decision in Malaysia
Page 20 of 157
According to Vadlamannati, Tamazian, and Irala (2009), the determinants
of FDI are divided into macroeconomic factors, institutional factors,
political factors and socioeconomic factors. Macroeconomic factors
include labor and potential macroeconomic risk like inflation rate and
unemployment rate. Institutional factors are track record of government,
corruption and civil liberties whereas political factors include political
regime and political instability. Lastly, socioeconomic factor uses literacy,
infant death and infant mortality rate as indicators. Infrastructure quality
can be considered as a factor that affects foreign direct investment as well.
According to OECD (as cited in Ali & Guo, 2005), although there was
emerging interest among foreign investors in China after 1979, large FDI
inflows did not happen in the initial period due to poor infrastructure.
2.1.2 Economic Growth
The relationship between Foreign Direct Investment (FDI) and economic
growth has been a topical issue for several decades. Many researchers have
conducted studies to investigate the positive causal relationship between
FDI and economic growth, either in the short run, or in the long run, or
both. On top of recognizing the importance of FDI to growth, economic
growth itself has also been identified frequently as an important
determinant of FDI inflow into the host countries (Benacek, Gronicki,
Holland, & Sass, 2000).
According to Hansen and Rand (2006), rapid growth of an economy might
attract more FDI by multi-national companies (MNCs) as they locate new
profit opportunities. Dunning (1995) argued that MNCs with certain
ownership advantages will invest in another country with locational
advantages, and both advantages can be captured effectively by
“internalizing” production through FDI. This market hypothesis has been
tested in many empirical papers (Chakraborty & Basu, 2002; Moosa,
Factors Affecting Foreign Direct Investment Decision in Malaysia
Page 21 of 157
2002). High GDP growth rate represents soundness and stability of
economic policies, and the effectiveness of the government institutions
which are mainly looked for in international transactions. Thus, it will
cause the levels of aggregate demand for investments (both domestic and
foreign) to rise (Zhang, 2001).
Fan, Morck, Xu, and Yeung (2007) encouraged by past growth
performance, also note that foreign investors overflow China in
anticipation of improved institutions. With the aid of panel data for 80
developed and developing countries, Choe (2003) conducted a Granger
causality test for GDP and FDI. It is found that the causality between
economic growth and FDI runs in either direction but with a tendency
towards growth causing FDI; there is little evidence that FDI causes host
country‟s growth. Thus, a significant and positive relation is once again
proven between GDP growth rate and FDI inflows in a country.
While most studies found the importance of economic growth on FDI,
there are also other studies which failed to validate the hypothesis. For
instance Kahai (2011), on the other hand, could not established a
significant relationship between economic growth (measured as the annual
real GDP growth rate) and FDI using the data from 1998 and 2000 for
fifty-five developing countries. Although all these studies provide ample
evidence of the relationship between economic growth and FDI in both
developed and developing countries, few studies have been done in the
case of Malaysia. Therefore, economic growth is included as one of the
independent variables in this research paper.
2.1.3 Market Size
Market size has been proved to be one of the most important determinants
of FDI by numerous past empirical studies (Lim, 2008; Luiz &
Charalambous, 2009; Ang, 2008; Athukorala & Waglé, 2011).Market size
Factors Affecting Foreign Direct Investment Decision in Malaysia
Page 22 of 157
of a country represents the potential demand for the country‟s output and
also its economic conditions. It is an important element that will determine
the foreign direct investors‟ investment in a particular country (Asiedu,
2002). For those countries which have large markets, the stock of FDI is
expected to be larger than those of the small markets‟. Market size is
normally measured by real GDP or GDP per capita GNP. At times, private
and public consumption are also used as alternatives.
Majority of studies use GDP and GDP per capita as a proxy for market
size and it is found that there is a positive relationship between market size
and FDI inflow to the country (Artige & Nicolini, 2005). According to
Sharma & Bandara (2010), investors are easily attracted to large expanding
market. Although there still remains other factors that might affect foreign
investors‟ decision making, the first things to make them have the
intention to invest in a country is none other than the size of market (Awan,
Khan, & Zaman, 2011). This is because market that is small and unable to
expand rapidly does not possess any inherent attractiveness. Charkrabarti
(2001) (as cited in Moosa & Cardak, 2006) stated that a larger market size
of a country indicates that the country will be more efficient in utilizing
their resources and exploitation of economic of scale. Hence, small market
size country will lose its competitiveness in comparison to such countries
in attracting more investors (Medvedev, 2012).
As mentioned above, it is necessary to consider market size as an
important factor in determining FDI inflows in a country (Asiedu, 2002).
However, at the same time, it is not the only factor influencing FDI.
Medvedev (2012) argued that the barrier of trade in a country will affect
the FDI inflow to the country even when the market size is large. On the
other hand, Nurudeen, Wafure, and Auta (2011) and Bevan and Estrin
(2004) found that GDP have significant but negative effect on the FDI.
Despite the increasing country size, foreign investors are less willing to
invest in a particular country which they have less perceivability on the
economy (Nurudeen, Wafure, & Auta, 2011).
Factors Affecting Foreign Direct Investment Decision in Malaysia
Page 23 of 157
Also, some studies found that GDP is not suitable to be used as a proxy for
market size. According to Demirhan and Masca (2008), the empirical
results showed GDP insignificant to FDI because absolute GDP reflects
the size of population rather than the income. It is also suggested that GDP
growth rate and growth per capita GDP will be a more suitable proxy of
market size. However, this argument has been less supported by other
researchers.
Many researchers have proved through empirical studies for market size
that using GDP or GDP per capita showed significant and positive
correlation with FDI inflow to both developing and developed countries
(Quer & Claver, 2007; Rodriguez & Pallas, 2008; Vadlamannati,
Tamazian & Irala, 2009; Trevino & Mixon Jr, 2004). Therefore, in this
study, researchers will be using GDP or GDP per capita as a proxy to
market size and proved on the significant positive relationship it has with
the FDI in Malaysia.
2.1.4 Inflation Rate
Inflation rate is taken as a proxy for the level of macroeconomic stability
of a country. Usually, high rate of inflation, so called the unbridled
inflation, in a country will reduce the return on investment and act as an
indicator of macroeconomic instability. It is considered as a sign of
economic tension and unwillingness of the government to balance its
budget and failure of the central back to conduct appropriate monetary
policy (Azam, 2010). A low inflation rate is taken as a sign of internal
economic stability in the host country, reflecting a lesser degree of
uncertainty which encourage foreign direct investment (Asiedu, 2002). In
short, there is a negative relationship between inflation rate and foreign
direct investment. Demirhan and Masca (2008) did a research on the
determining factors of foreign direct investment inflow in 38 developing
countries over the period of 2000-2004 by estimating a cross-sectional
Factors Affecting Foreign Direct Investment Decision in Malaysia
Page 24 of 157
econometric model. According to the econometric results of this past
research, it is found that inflation rate has a negative sign and is
statistically significant to foreign direct investment. It means that low
inflation rates have been effective in attracting foreign direct investment
into developing countries. Besides that, other researchers like Azam (2010)
and Shamsuddin (1994) also found that there is a significant negative
relationship between inflation rate and foreign direct investment.
On the other hands, some researchers think that there might be a positive
relationship between inflation rate and foreign direct investment.
Srinivasan (2011) states that higher inflation indicates higher price levels
and increased in the production activities of the host country and attraction
of investments from foreign firms, which then leads to an increased
expected level of profitability. In this research paper, Srinivasan (2011)
used fixed effects and random effects models to explore the determinants
of foreign direct investment in the selected South Asian Association for
Regional Cooperation (SAARC) countries for the period of 1970-2007.
This paper showed that inflation rate is one of the most significant factors
in determining foreign direct investment in SAARC countries. However,
there is some past research papers that indicated inflation rate is
insignificant to foreign direct investment (Vijayakumar, Sridharan & Rao,
2010; Nurudeen & Wafure, 2010). Nurudeen, Wafure, and Auta (2011)
examined the major determinants of foreign direct investment in Nigeria
by analyzing the annual data over the period 1970 – 2008. Using the
ordinary least squares and error correction techniques, the regression
results showed that inflation rate is insignificant but have positive
influence on the foreign direct investment inflows.
In a nutshell, based on the past researches, inflation rate may have both
significant or insignificant and negative or positive influence on foreign
direct investment.
Factors Affecting Foreign Direct Investment Decision in Malaysia
Page 25 of 157
2.1.5 China FDI Inflow
China FDI inflow is the main variable that we will be examining in this
paper. There has been a few past research papers determining the influence
of China FDI inflow on the foreign direct investment. Most of the past
research papers showed that there will be a significant relationship
between China FDI inflow and foreign direct investment either in a
positive or negative relation (Salike, 2010; Chantasasawat, Fung, Iizaka, &
Siu, 2004; Eichengreen & Tong, 2007).
According to past researchers, two types of effects will most probably be
incurred in the event. The first one is known as the investment-diversion
effect. In choosing between China and other Asian countries, multinational
enterprises may consider a host of factors including wage rates, political
risks and infrastructure that would make a particular destination desirable
as the site for low-cost production. As proven, China‟s labour cost which
is low may lure multinational enterprises away from sites in other
developing countries like Thailand during the consideration of an
alternative location for low-cost export platforms. Investing in China will
then reduce the FDI in other countries. Therefore, it will be in a negative
sign and so called the investment-diversion effect.
Second effect is the investment creation effect. The production and
resources linkages between China and other countries takes place in the
form of further fragmentation and specialization of production process.
This linkage takes advantage of the respective competitiveness of different
economies in the distinct stages of production. When components and
parts are traded between China and another economy, an increase in
China‟s foreign direct investment will be positively related to an increase
in the other economy‟s foreign direct investment. Another complementary
argument is that as China‟s economy grows, its market increases and its
appetite for minerals and resources rise too. This will lead to the
investment by other multinational enterprises in some other countries to
Factors Affecting Foreign Direct Investment Decision in Malaysia
Page 26 of 157
extract minerals and resources in order to export it to China in need of the
whole spectrum of raw materials. In this case, there will be a positive sign
of China FDI inflow or the so called investment creation effect.
Athukorala and Waglé (2011) have examined patterns and determinants of
foreign direct investment in Malaysia from a comparative Southeast Asian
perspective. In that research paper, foreign direct investment flows into
China is taken as an additional explanatory variable to test whether foreign
direct investment in ASEAN is crowded out by foreign direct investment
into China, which has become more attractive for foreign direct investment
among the developing countries in recent years. The result of this paper
showed that there is no evidence that foreign direct investment in
Southeast Asian countries is crowded out by the increasing flow of foreign
direct investment into China. On the contrary, Malaysia (or Southeast
Asian countries) benefits from a complementary foreign direct investment
relationship with China as it becomes a favored location for high-end tasks
within the global production networks.
Eichengreen and Tong (2006) employ a gravity model to examine the
impact China have on the exports and foreign direct investment receipts of
other countries. It was asked whether there are grounds for “fear of China”.
This research showed that China‟s emergence has very different effects on
different groups of countries. They found that there is a complementarity
between inflows of foreign direct investment in China and those into other
Asian countries, but substitutability for those in Organisation for
Economic Co-operation and Development (OECD) countries. Wang, Wei
and Liu (2007) used data from a longer interval of 1980 to 2003 in
assessing the China‟s effect on individual economies. They found that
there is a significant foreign direct investment creation effect on India and
Philippines but a significant foreign direct investment diversion effect on
Indonesia, Korea, Malaysia and Taiwan.
Factors Affecting Foreign Direct Investment Decision in Malaysia
Page 27 of 157
As a result, theoretically, the net effect of investment creation and
investment diversion for China cannot be determined prior and must be
examined empirically.
2.1.6 Exchange Rate
The effect of exchange rate volatility on FDI movement is also a fairly
well studied topic. Froot and Stein (1991), Klein and Rosengren (1994),
Guo and Trivedi (2002) and Kiyota and Urata (2004) found that
depreciation of exchange rate in the host country will in turns increase FDI
of the host country. Conversely, when the host country‟s exchange rate
appreciates, the FDI in that particular country will decrease. Nurudeen,
Wafure and Auta (2011) had used the Ordinary Least Squares and Error
Correction Techniques to study the relationship between FDI and
exchange rate depreciation. Their finding was found to be in line with the
research by Hara and Razafimahefa (2005) in which the exchange rate
depreciation significantly and positively affects FDI inflows. This means
that when a country‟s exchange rate depreciates, it will attract the foreign
investors to invest in the country as it has a lower dollar price in its
domestic industries. Besides, investors are more likely to invest in the
market when the targeted market has a weak currency. They will postpone
their investment to the period when the currency depreciates because they
believe that they will earn a higher profit in their investment at a later date.
This shows that there is a significant time lag between exchange rate
volatility and FDI movement (Barrell & Pain, 1996).
However, Aqeel and Nishat (2004) had found a controversial result. They
applied Cointegration and Error Correction Techniques in their study to
identify the variables in explaining the relationship between exchange rate
and FDI. With the average annual exchange rate of the host country as the
indicator, it is found that there is a significant and positive relationship
between the both. Hence, it is indicated that when the currency appreciates,
Factors Affecting Foreign Direct Investment Decision in Malaysia
Page 28 of 157
FDI increases too. This is simply because investors have high expectation
on the economy and the returns. Study by Campa (1993) in US also found
that an appreciation of exchange rate in the host country will in fact
increase the FDI in the host country. This is because investors believe that
an appreciation of exchange rate in the host country will most likely
increase the future profitability in terms of the home currency.
In explaining the case of South Asian Association for Regional
Cooperation (SAARC) countries, Srinivasan (2011) found that the real
exchange rate are insignificant and in fact has a negative relationship with
the FDI. It seems that real exchange rate do not play a significant role in
attracting FDI in SAARC countries.
2.1.7 Trade Openness
The competition for inward FDI in many developing countries are
increased due to the ongoing process of integration of the world economy
and liberalization of the economies, the controls and restrictions over the
entry and operations of foreign firm which are now being replaced by
selective policies aiming at FDI inflows (Aqeel & Nishat, 2005). The
liberalization of the economies always refers to the openness of the
economy or trade and it is one of the common variables in explaining the
FDI inflows for a country. Normally, it is measured by the share of exports
and imports in GDP. According to Moosa and Cardak (2006), Demirhan
and Masca (2008), and Sawkut, Boopen, Taruna, and Vinesh (2009), trade
openness is significant and has a positive effect on FDI inflows. A
country‟s willingness to accept foreign investment is important to the FDI
of the country. In the research of Chantasasawat, Iizaka and Siu (2010), the
result is found to be the same with the previous study which show positive
significance. The study also interestingly stated that the openness of a
country includes the degree of both tariff and nontariff measures. The
reductions in different types of trade barriers will in turns increase FDI in a
Factors Affecting Foreign Direct Investment Decision in Malaysia
Page 29 of 157
country. Awan, Khan, and Zaman (2011) also studied the relationship
between the degree of trade openness and FDI by using Augmented-
Dickey Fuller (ADF) test and Co-integration and Error Correction Model
(ECM) in their research. They took the sum of exports and imports each
year as the indicator of trade openness. The result showed that the degree
of trade openness is highly significant with a positive sign in both ADF
test and ECM. This means that the foreign investors would prefer making
investment in countries with a higher degree of trade openness. A few
studies applied the Fixed Effects (FE) model and the Random Effects (RE)
model to examine the effect of trade openness on FDI. In Srinivasan (2011)
case, it is found that the openness of trade is positive and statistically
significant to the FDI inflows. Thus, it is an obvious fact that investors will
more likely make investment in those countries which have opened up to
the outside world.
However, Kolstad and Villanger (2008) (as cited in Awan, Khan, &
Zaman, 2011) found that trade openness is insignificant in explaining the
inflows of FDI. Busse and Hefeker (2007) confirm this and add that trade
openness negatively affects FDI inflows. According to Goodspeed,
Martinez-Vazquez, and Zhang (2006), the effect of trade openness on FDI
is inconclusive because thus far different studies show different results.
Sometimes, trade openness is significant and has a positive relationship
with FDI inflows but at times it is insignificant with the other conditions of
the empirical model.
In the Organization for Economic Co-operation and Development (OECD)
countries, trade openness and FDI inflows have displayed a positive
relationship. On the other hand, small effects have been reported on non-
OECD countries and resource-rich fuel exporting countries‟ FDI inflows
(Seim, 2009). Last but not least, the author found trade openness and FDI
inflows have negative relationship in the transition countries.
Factors Affecting Foreign Direct Investment Decision in Malaysia
Page 30 of 157
2.1.8 Quality of Infrastructure
Amongst huge literature on FDI, few scholars have actually acknowledged
the significant contribution of infrastructure in stimulating FDI inflows.
The few proponents featured are Wheeler and Mody (1992), Asiedu (2002),
Quazi (2007), Kahai (2011), and Rehman, Ilyas, Alam, and Akram (2011).
These authors have argued that good infrastructure is a necessary condition
for foreign investors to operate successfully. Poor infrastructure or
unavailable public inputs increase costs for firms. Thus to the extent that
the public input is non-excludable and non-congestible, it will lower the
costs of doing business for multinational and indigenous firms alike.
In their influential paper, Wheeler and Mody (1992) employed a translog
specification and uses a panel of 42 countries for the period 1982-1988 to
analyze the determinants of FDI. They interestingly reported that
infrastructure quality (quality of transport, communications, energy
infrastructure and degree of industrialization) exhibit a high degree of
statistical significance and thus have large, positive impacts (1.57 to 2.54)
on investment. In addition, Asiedu (2002) who analyzed 34 countries in
Africa over the period 1980-2000 using the number of telephones per 1000
population (as a measure of infrastructure development) and at the same
time controlling for the classical FDI determinants supported it and
concluded that countries that improved their infrastructure were “rewarded”
with more investments.
Meanwhile, Rehman, Ilyas, Alam, and Akram (2011) also constructed an
indicator for infrastructure that encompassed number of telephones
available per 1,000 people as measures. By using time series data from
1975 to 2008 and applying autoregressive distributive lag (ARDL)
approach to cointegration, it is concluded that there are significant positive
impact in both the short and long run of infrastructure on FDI inflows in
Pakistan. In short run, one percent increase in infrastructure results in
uplifting FDI of 1.03% and in long run, one percent rise in infrastructure
Factors Affecting Foreign Direct Investment Decision in Malaysia
Page 31 of 157
enhances FDI inflows by 1.31%.This further proves that infrastructure has
a significant attractiveness for FDI inflows in developing economies
(Asiedu, 2002; Kahai, 2011; Mengistu & Adhikary, 2011).
While most studies found the importance of infrastructure for FDI, there
are also other studies which failed to validate the hypothesis. For instance
Quazi (2007), on the other hand, could not established positive and
significant relationship between infrastructure ( measured as the number of
telephones per 1,000 people) and FDI using panel data from 1995-2000 for
a sample of seven East Asian countries. The authors however admitted that
„it is plausible that their proxy variables - the natural log of the number of
telephones available per 1,000 people and the adult literacy rates,
respectively, perhaps inadequately capture their true effects on FDI.
Moreover, Addison et. Al. (2006) as cited in Rehman, Ilyas, Alam, and
Akram (2011) acknowledge such promotional impact only for developed
nations but, on the other hand, such situation does not exist for developing
countries.
A review of literature suggests that while the role of infrastructure in
attracting FDI has received increasing interest from academic scholars
lately, yet these studies focused on the general level of infrastructure and
moreover have largely ignored developing country cases, particularly
Malaysia economies. Thus, the current study attempts to fill in this gap and
thus supplements the growing literature on FDI.

Factors Affecting Foreign Direct Investment Decision in Malaysia
Page 32 of 157
2.2 Review of Relevant Theoretical Models
Figure 2.1: Theoretical Model
Source: Ang, J.B. (2008).Determinants of foreign direct investment in Malaysia.
Journal of Policy Modeling, 30, 185-189.
FDIt = β0 + β1FDt + β2GDPt + β3GROt + β4INFt + β5OPEt + β6RERt + β7TAXt +
β8UNCt + β9D97-98
The chart above (Figure 2.1) showed the theoretical model by Ang (2008). This
study explore the effect of financial development, market size, economic growth,
infrastructure development, trade openness, real exchange rate, and statutory
corporate tax rate in Malaysia towards foreign direct investment inflows in
Malaysia. The study examines the determinants of FDI for Malaysia to enlighten
analytical and policy debates.
As seen from the model of Ang (2008), the independent variables involved are
financial development, gross domestic product, annual growth of gross domestic
product, infrastructure development, trade openness, real exchange rate, and
statutory corporate tax rate in Malaysia. On the other hand, the dependent variable
is foreign direct investment inflows in Malaysia.
FDIt
FD
UNC
D97-98
RER
GRO
TAX
GDP
INF
OPE
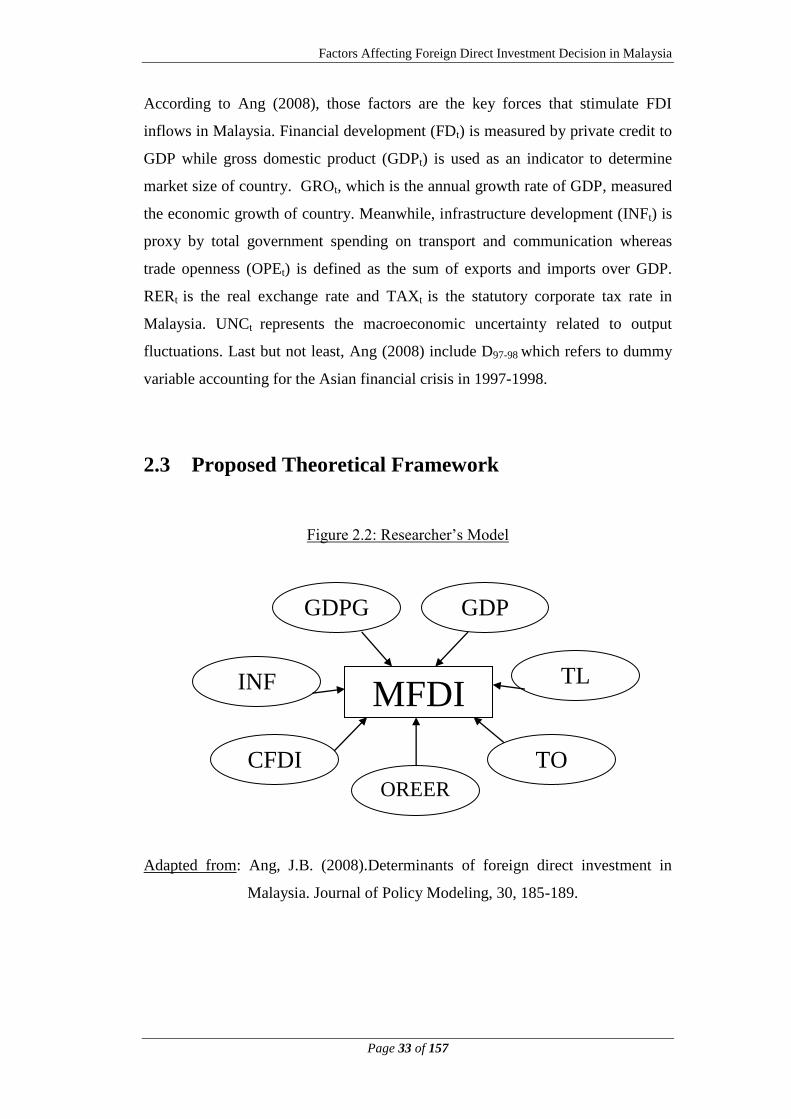
Factors Affecting Foreign Direct Investment Decision in Malaysia
Page 33 of 157
According to Ang (2008), those factors are the key forces that stimulate FDI
inflows in Malaysia. Financial development (FDt) is measured by private credit to
GDP while gross domestic product (GDPt) is used as an indicator to determine
market size of country. GROt, which is the annual growth rate of GDP, measured
the economic growth of country. Meanwhile, infrastructure development (INFt) is
proxy by total government spending on transport and communication whereas
trade openness (OPEt) is defined as the sum of exports and imports over GDP.
RERt is the real exchange rate and TAXt is the statutory corporate tax rate in
Malaysia. UNCt represents the macroeconomic uncertainty related to output
fluctuations. Last but not least, Ang (2008) include D97-98 which refers to dummy
variable accounting for the Asian financial crisis in 1997-1998.
2.3 Proposed Theoretical Framework
Figure 2.2: Researcher‟s Model
Adapted from: Ang, J.B. (2008).Determinants of foreign direct investment in
Malaysia. Journal of Policy Modeling, 30, 185-189.
MFDI
GDP GDPG
INF TL
CFDI TO
OREER
Factors Affecting Foreign Direct Investment Decision in Malaysia
Page 34 of 157
Based on the model from Ang (2008), we remodeled the model into (Figure 2.2):
MFDIt = β0 + β1GDPt + β2GDPGt + β3OREERt + β4TLt + β5TOt + β6INFt +
β7CFDIt
As seen from the model above, the independent variables we used as determinant
of FDI inflows in Malaysia are market size, economic growth, infrastructure, trade
openness, real exchange rate, China FDI, and inflation rate in a country. The
dependent variable is the FDI inflows in Malaysia (MFDI).
The independent variable GDP, which were initially symbolized as GDP in the
theoretical model, is the indicator for market size. According to Chakraborty and
Basu (2002), larger market size will induce more foreign investment into the
country. Hence, GDP are expected to have positive relationship with the foreign
direct investment inflows in Malaysia (Artige & Nicolini, 2005).
Independent variable GDPG is the indicator for economic growth which is
commonly proxy by annual growth domestic product growth rate. Based on
Globerman and Shapiro (2003), higher gross domestic product growth rate
indicates that the country is doing well in development. Ang (2008) proved that
growth domestic product growth rate is important and has positive impact on FDI
inflows. Thus, higher gross domestic product growth rate tends to attract more
foreign investor to invest in that particular country.
The independent variable OREER refers to the indicator for official real exchange
rate. Hara and Razafimahefa (2005) stated that when the exchange rate of a
country depreciates, it will attract more FDI inflows. Theoretically, it is true
because foreigners tend to invest in lower capital countries as they wish to
generate higher income when the exchange rate of the country they invest in
appreciate in the possible future.
Independent variable TL is the indicator for quality of infrastructure. Wheeler and
Mody (1992), Loree and Guisinger (1995), Morisset (2000), and Asiedu (2002)
stated that infrastructure is one of the key indicators in determining the FDI
Factors Affecting Foreign Direct Investment Decision in Malaysia
Page 35 of 157
inflows of a country. Good infrastructure such as increased number of telephone
line in the country allows firms to operate or promote their businesses more easily.
This in turns, increase the opportunity of foreign investor investing in the country.
Independent variable TO represents the indicator for trade openness. Theoretically,
open economies will generally generate greater market opportunity. According to
Moosa and Cardak (2006) and Demirhan and Masca (2008), trade openness is
crucial to a country‟s foreign direct investment. This is because most of the
investors prefer investing in the country which has less trade barriers.
Independent variable INF is the indicator for inflation rate of the country. In
theory, the higher the inflation rate, the more expensive the cost of domestic
product become. This will then decrease the foreigners investing in the country
due to their need to take out more cost of capital to buy resources or hire worker
in that country. Demirhan and Masca (2008) also found that inflation rate has a
significant but negative relationship with foreign direct investment.
Last but not least, independent variable CFDI is the indicator for China FDI
inflows. This variable is used to determine whether China‟s increased in its FDI
inflows will affect Malaysia FDI inflows. Based on Wang, Wei and Liu (2007),
China FDI is significant and will affect other countries‟ FDI. This is because
China imposed lower labour cost compare to other countries, so foreign investors
will most probably shift their interest and invest in China due to the need of lower
capital to operate the firms. It is predicted that an increase in China FDI will lead
to a decrease in Malaysia FDI.
2.4 Hypotheses Development
After forming a conceptual framework based on the past researcher‟s reviews,
researchers have also formed hypotheses on the model and also each variable to
examine whether the theory formulated is valid or not. Below are the hypotheses:
Factors Affecting Foreign Direct Investment Decision in Malaysia
Page 36 of 157
H0: There is no relationship between all independent variables and FDI inflow in
Malaysia.
H1: There is relationship between all independent variables and FDI inflow
in Malaysia.
H0: β1 = 0 (There is no relationship between market size and FDI inflow in
Malaysia.)
H1: β1 ≠ 0 (There is relationship between market size and FDI inflow in
Malaysia.)
H0: β2 = 0 (There is no relationship between economic growth and FDI inflow in
Malaysia.)
H1: β2 ≠ 0 (There is relationship between economic growth and FDI inflow
in Malaysia.)
H0: β3 = 0 (There is no relationship between quality of infrastructures and FDI
inflow in Malaysia.)
H1: β3 ≠ 0 (There is relationship between quality of infrastructures and FDI
inflow in Malaysia.)
H0: β4 = 0 (There is no relationship between trade openness and FDI inflow in
Malaysia.)
H1: β4 ≠ 0 (There is relationship between trade openness and FDI inflow in
Malaysia.)
H0: β5 = 0 (There is no relationship between exchange rate and FDI inflow in
Malaysia.)
H1: β5 ≠ 0 (There is relationship between exchange rate and FDI inflow in
Malaysia.)
H0: β6 = 0 (There is no relationship between China FDI inflows and FDI inflow in
Malaysia.)
H1: β6 ≠ 0 (There is relationship between China FDI inflows and FDI
inflow in Malaysia.)
H0: β7 = 0 (There is no relationship between inflation rate and FDI inflow in
Malaysia.)
H1: β7 ≠ 0 (There is relationship between inflation rate and FDI inflow in
Malaysia.)
Factors Affecting Foreign Direct Investment Decision in Malaysia
Page 37 of 157
2.5 Conclusion
This research has used 7 independent variables constituting of market size,
economic growth, quality of infrastructure, trade openness, exchange rate, China
FDI inflow, and inflation rate. As supported by previous studies, researchers
assume that those variables are significant in determining the foreign direct
investment inflows in Malaysia. Therefore, researchers will be collecting those
indicators‟ observations from reliable database and plan carefully for the research
methodology so as to obtain a proper analysis to prove what they assumed is
correct and accurate.
Factors Affecting Foreign Direct Investment Decision in Malaysia
Page 38 of 157
CHAPTER 3: METHODOLOGY
3.0 Introduction
Research methodology is a way to systematically solve the research problem. It
may be understood as a science of studying how research is done scientifically. At
each operational step of the research process, researchers are required to choose
from a multiplicity of methods, procedures and models of research methodology
to achieve the objectives. So in this chapter, researchers will list out the various
steps that are generally adopted in researching the determinants of foreign direct
investment along with the logic behind them. What data have been collected and
what particular method has been adopted, why a particular technique of analyzing
data has been used and a host of similar other questions will be answered as
researchers get deeper in the research methodology concerning the research study.
The choices and decisions made in this part of the research take into consideration
the literature review as done in the previous chapter. Literature review tells if
others have used procedures and methods similar to the ones that researcher are
proposing, which procedures and methods have worked well for them, and what
problems they have faced with them. Thus, it allows researcher to better position
in selecting a methodology that is capable of providing a valid answer to our
research questions.
Last but not least, the research design, data collection methods, data processing,
and methods of data analysis will be discussed in the following sub topics.
Factors Affecting Foreign Direct Investment Decision in Malaysia
Page 39 of 157
3.1 Research Design
Researchers use research design as the fundamental directions to carry out the
study. In this study, researchers opted to use quantitative research. Quantitative
research involves a collection of numerical data to answer a specific research
question. In this case, the research is to examine the relationship between the
independent variables which are China FDI inflow (CFDI) as measured by China
FDI (Athukorala & Waglé, 2011; Wang, Wei ,& Liu, 2007 and Salike, 2010),
quality of infrastructure (TL) as measured by telephone line per 100 people
(Asiedu, 2002; Mengistu & Adhikary ,2011), exchange rate (OREER) as
measured by official real effective exchange rate (Hara & Razafimahefa, 2005),
trade openness (TO) as measured by ratio of exports plus imports to GDP
(Demirhan & Masca, 2008; Nurudeen, Wafure & Auta, 2011), inflation rate (INF)
as measured by inflation, consumer price (Demirhan & Masca, 2008), market size
(GDP) as measured by real GDP per US$( Sharma & Bandara, 2010 ; Awan,
Khan , & Zaman, 2010), and economic growth (GDPG) as measured by annual
gross domestic product growth rate (Kahai, 2011 & Ang, 2008) and the
dependent variable which is foreign direct investment inflows in Malaysia.
Besides that, researchers collect data on predetermined instruments to yield
statistical data. It is a more structured data collection technique. Quantitative
research not only provides the summary of the information on the characteristic,
but it is also useful in tracking the trend. There are three type of research design:
exploratory research, descriptive research, and causal research (McDaniel & Gates,
2010). According to McDaniel and Gates (2010), exploratory research is useful
when the research question is unclear to guide the progress of the hypotheses. This
research is also used to develop a better understanding on a problem or
opportunity. Descriptive research explains more on some situation by providing a
measure of the event or activity and it is accomplished by using descriptive
statistic. Meanwhile, causal research is the most complex compare to the other
two. This is because such research design is used to test whether one event or
activity causes another (McDaniel & Gates, 2010). In this research paper,
exploratory research is used for there are some unclear research questions. As
Factors Affecting Foreign Direct Investment Decision in Malaysia
Page 40 of 157
researchers have included some new indicators like China FDI inflow and
infrastructure that have not been used by past researchers on the country of
Malaysia, it was unsure whether or not there will be a significant influence by the
new indicators on Malaysia‟s foreign direct investment inflows.
3.2 Data Collection Methods
In order to study the effects the variables have on the FDI inflows in Malaysia,
researchers had obtained data on the indicators of market size, economic growth,
inflation rate, exchange rate, trade openness, quality of infrastructure and China
FDI inflow from the World Bank database. For the study, data researchers used
the annual times series data from the year 1982 to 2010 which consists of 29
observations. The GDP per US$ is used as the proxy for market size while the
annual GDP growth rate is used as the proxy for economic growth. Besides, the
indicator for inflation is inflation, consumer price while the real effective
exchange rate is the indicator for exchange rate. Meanwhile, researchers employed
the ratio of exports plus imports to GDP as the proxy for trade openness. Quality
of infrastructure, on the other hand, has the indicator of telephone line per 100
people. Last but not least, the FDI inflows in China are used for the China FDI.
In the research project, quantitative research is done since all the data obtained are
quantitative data. Quantitative research as defined by Cohen (1980) (as cited in
Sukamolson, 2005) is the social research that uses empirical methods and
empirical statements which are expressed in numerical terms. Besides,
Sukamolson (2005) defined quantitative research as explaining phenomena by
collecting quantitative data that are analyzed using mathematically based methods.
Since the data researchers obtained from World Bank are in numerical terms, it
qualifies as the quantitative data as indicated in the statement made by
Sukamolson (2005).
Time series data is a collection of observations on the values that a variable takes
over a period such as daily, monthly, quarterly, and annually (Gujarati & Porter,
Factors Affecting Foreign Direct Investment Decision in Malaysia
Page 41 of 157
2009). Researchers used time series data in the study since the data is collected at
a regular time intervals which is from 1982 to 2010. All the data researchers used
are secondary data as the data have already been collected by someone else for
other purposes. The reasons researchers use secondary data is because working
with secondary data is more economic. Since the data had previously been
collected by someone else for other research purposes, there is no need for current
researchers to spend time in collecting the data by themselves. This in turns save
time so that researchers can focus more on the analysis. Besides, it also saves cost
as the data needed can be easily found and obtained from online sites such as
World Bank both at a price or for free.
3.3 Data Processing
In order to make sure accurate data are selected for the analysis, researchers
constantly check through, update and edit the data. Firstly, referral on several past
researches confirms that the indicators researchers choose to use is fully supported
and proved by past researchers. While collecting the data, researchers double
confirm the data and indicators used are in line with what was used by past
researchers previously. As some of the data obtained from World Bank contained
omitted observations (e.g. FDI china only has 29 observations while GDP has 34
observations), researchers had to make some adjustment on it so as to make sure
all observations are in the same observations‟ years. Even when the researchers
key in the data into E-views, the figures are checked on a few times to make sure
that there is no error. This step further improves the accuracy of the data before
the conduction of the analysis.
Factors Affecting Foreign Direct Investment Decision in Malaysia
Page 42 of 157
3.4 Data Analysis
In this research, Electronic Views (Eviews) is used to run and test the regression
analysis.
3.4.1 Eviews
Eviews is one of the most popular econometric packages around. It can be
used for general statistical analysis and econometric analyses, such as
cross-section and panel data analysis, time series estimation and
forecasting. It combines both spreadsheet and relational database
technology with the traditional tasks found in statistical software. It also
can use Windows GUI to combine with a programming language which
displays limited object orientation (Renfro, 2004).
Eviews relies heavily on a proprietary and undocumented file format for
data storage. However, for input and output, it supports numerous formats,
including databank format, Eel formats, PSPP or SPSS, DAP or SAS, Stata,
Rats, and TSP. Furthermore, it can access OECD databases. According to
Startz (2009), Eviews can estimate a regression and show the information
on each estimated coefficient from the Eviews output. In addition to
regression coefficients, Eviews also can provide a great deal of summary
information about each estimated equation.
In the research paper, Eviews is used to run the estimated multiple
regressions model and also to do the diagnostic checking for determining
whether multicollinearity, autocorrelation and heteroscedasticity problems
exist or not. Besides that, researchers also run the model specification test
and normality test using Eviews.
Factors Affecting Foreign Direct Investment Decision in Malaysia
Page 43 of 157
3.4.2 Multiple Linear Regressions
Unlike simple linear regression model, multiple linear regressions model is
linear regression models that contain one dependent variable (Y) and two
or more independent variables (Xi) (Gujarati & Porter, 2009). The
independent variables act as explanatory variables in predicting the result
of dependent variable. An equation of multiple linear regressions models is
as below:
Y = β0 + β1X1i + β2 X2i +…..βkXki+ μi
One of the reasons researchers opted to use multiple linear regressions
model instead of simple linear regression model is most probably because
the outcomes of their estimation does not only involve one independent
variable influencing it. In real life, there are multiple factors influencing
the outcomes. Thus, multiple linear regressions model is used to ensure
that the estimated result does not divert from the actual results. In order to
obtain a rather accurate estimation, 7 variables have been included into the
estimated models by researchers. The fewer variables are omitted from the
estimation, the more accurate results will it be. As follow is the estimated
economic model researchers formed:
FDIt= β0 + β1GDPt + β2GDPGt + β3OREERt + β4TLt + β5TOt + β6INFt +
β7CFDIt
Where FDI refers to foreign direct investment inflows in Malaysia, β is the
coefficients used to explain the degree it will affect FDI. GDP is market
size, GDPG is economic growth, OREER is real effective exchange rate,
TL is infrastructure, TO is trade openness, INF is inflation rate and CFDI
is China FDI inflows.
One of the characteristics of multiple linear regressions function is that the
parameters (βk) in the model should be linear and there is no relationship
Factors Affecting Foreign Direct Investment Decision in Malaysia
Page 44 of 157
among the independent variables. The main reasons researchers need to
avoid any two independent variables with relationship with each other is
because if the two independent variables are highly correlated
(multicollinearity), researchers may be getting biased information from the
model.
In multiple linear regressions models, the β1 and β2 are partial regression
coefficients (with two predictor variables). Partial regression coefficients
indicate how the independent variables (Xi) take effect on dependent
variable (Y), withholding other variables constant. On the other hand, in
examining whether the multiple linear regressions model is fitted with the
data, adjusted R2
is preferred instead of R2. This is because R
2 never
decrease as the number of independent variables included in the model
increases.
3.4.3 F- test Statistic
F- test is a measure on the overall significance of the estimated regression.
It is any statistical test in which the test statistic has an F-distribution under
the null hypothesis. F- test is used when multiples parameters are involved
in the model. It is most commonly used in comparing statistical
models that have been fit to a data set to identify the model that best fits
the population from which the data were sampled.
Statistics F-test helps to analyze data by using the F-test statistic to
determine a P-value that indicates how likely one could have gotten the
results by chance. Therefore, if there is a less than either 1%, 5%, or 10%
chance of getting the observed differences by chance, researchers will
reject the null hypothesis and find it statistically significant for the whole
model. This also means that if the P-value of F-test is lower than 0.01, 0.05,
or 0.1, they will reject the null hypothesis and conclude that it is significant
for the whole model to explain the dependent variable.
Factors Affecting Foreign Direct Investment Decision in Malaysia
Page 45 of 157
3.4.4 T- test Statistic
T-test is probably the most commonly used Statistical Data Analysis
procedure for hypothesis testing of the means of the variables associated
with two independent samples or groups (Lucey, 2002). T-test requires
interval or ratio data and assumes the sample populations have normal
distribution while the variances are equal. This test assess whether the
observed differences between two sample means occurred by chance.
According to Lucey (2002), statistics T-test helps to analyze the data by
using the t-test statistic to determine a P-value that indicates how likely
one could have gotten the results by chance. Therefore, if there is a less
than either 1%, 5%, or 10% chance of getting the observed differences by
chance, researchers will reject the null hypothesis and find a statistically
significant difference between the two groups. This also means that if the
P-value of T-test is lower than 0.01, 0.05, or 0.1, they will reject the null
hypothesis and conclude that there is significance between the independent
variable and dependent variable.
In short, statistics T- test is used to test the significance of each
independent variable to dependent variable.
3.4.5 Diagnostic Checking
As mentioned above, there might be an existence of econometric problems
in the model. Hence, researchers need to conduct several hypotheses
testing to check and detect whether the model is free from multicollinearity,
autocorrelation and heteroscedasticity problems. Furthermore, researchers
will also need to test for model specification and carry out normality test as
well.
Factors Affecting Foreign Direct Investment Decision in Malaysia
Page 46 of 157
3.4.5.1 Model Specification and Normality test
Model specification refers to the determination of which independent
variables should be included in or excluded from a regression equation
(Gujarati & Porter, 2009). Indeed, it can be observed that regression
analysis involve three distinct stages: the specification of a model, the
estimation of the parameters of the model, and the interpretation of these
parameters. Model specification is the first and most critical of these stages.
Researchers‟ estimates on the parameters of a model and their
interpretation of them depend on the correct specification of the model.
Therefore, problems can arise whenever researchers wrongly specify a
model. Model specification error occurs when there involve any omission
of relevant variable or inclusion of unnecessary or irrelevant variable or
due to the wrong functional form (Gujarati & Porter, 2009). When
legitimate variables are omitted from a model, the Ordinary Least Square
estimators of the variable retained in the model will be biased and
inconsistent. That is the variances and standard errors of these coefficients
will be incorrectly estimated and vitiate the actual hypothesis-testing. On
the contrary, the consequences of including irrelevant variables in the
model are less serious. Estimators of the coefficients of the relevant as well
as irrelevant variables will remain unbiased and consistent while the error
variance remains correctly estimated. The only problem is that the
estimated variances tend to be larger than necessary, thereby leading to a
less precise estimation of the parameters. Or in other words, the confidence
intervals tend to be larger than necessary. Test can be used to detect on the
model specification error is Ramsey‟s RESET test.
Right behind the model specification test is another test which also cannot
be ignored. The normality test is used to check whether the error term of
the model is normally distributed or not. If the error term of the model is
not normally distributed, the estimated model will be biased and the
hypothesis testing result will be affected as well. If researchers are dealing
with a small or finite sample size which is less than 100 observations, the
normality assumption assumes a critical role. It not only helps us in
Factors Affecting Foreign Direct Investment Decision in Malaysia
Page 47 of 157
deriving the exact probability distributions of Ordinary Least Square
estimators but also enable us to use the T-test, F-test and other statistical
tests for regression models (Gujarati & Porter, 2009).
Therefore, before proceeding to diagnostic checking and other statistical
tests, researchers have to make sure that their model is well specified and
its error term is normally distributed. In this research paper, Ramsey‟s
RESET test will be used to check on the model specification while Jarque-
Bera normality test will be used to see through the normality of the error
term.
3.4.5.2 Multicollinearity
Researchers have utilized the term independent variable to refer to variable
being used in the forecast or clarification of the value of dependent
variable. This does not mean the independent variables are independent in
a statistical sense. However, there is high probable that most of the
independent variables are correlated.
At the outset, researchers have planned to run some test on the
multicollinearity problem in order to assess whether the independent
variables in the model are highly related among each other or not.
Researchers will be applying covariance analysis to find out whether there
is correlation between the independent variables.
Multicollinearity can lead to a numbers of problems with regression. In
some cases, multicollinearity will cause the regression coefficients to have
a sign opposite that of the actual relationship. Therefore, when there is a
high degree of multicollinearity, researchers cannot rely on the individual
coefficients to interpret the results. This is because it is certain that the
problem had affect the statistical significant of the individual regression
coefficients and the ability to use them to explain the relationships. It is
agreed by Larget (2007) that when multicollinearity is present, important

Factors Affecting Foreign Direct Investment Decision in Malaysia
Page 48 of 157
variables can appear to be non-significant and the standard errors can be
large than it is supposed to be.
To assess multicollinearity, the correlation among the independent
variables should be known. The results are shown both as an individual R-
squared and a Variance Inflation Factor (VIF). When the R-squared and
VIF values are high for any of the variables, the model is affected by
multicollinearity (Motulsky, 2002).
3.4.5.3 Autocorrelation
According to Gujarati and Porter (2009), autocorrelation may be defined
as correlation between members of the observations ordered in time and
place. As in time series data, there might be the correlation between
disturbance terms. Another possible reason that autocorrelation will
occurred is because researchers omitted some important variables from the
model or used the wrong functional form. If autocorrelation occurs in the
stated model, researchers might get bias results.
Therefore, researchers need to check for autocorrelation problem as it
might occur in the studied model if the error is correlated. In detecting the
autocorrelation problem, researchers have selected Breusch-Godfrey Serial
Correlation LM Test to run the test. Since research sample size is small
which has 29 observations, researchers also include informal way
(graphical method) to detect autocorrelation problem. This is because the
sample is small and graphical method will provide a more accurate answer
compare to hypothesis testing, so the final conclusion will be drawn base
on graphical result.
Factors Affecting Foreign Direct Investment Decision in Malaysia
Page 49 of 157
3.4.5.4 Heteroscedasticity
Follow on, researchers run the heteroscedasticity test to test for the
constant variance of error terms. Researchers use ARCH test to identify
the heteroscedasticity problem in this model. As stated by Gujarati and
Porter (2009), model with heteroscedasticity problem have error terms that
do not have a constant variance. There may be larger variance when values
of some independent variables tend to be larger or smaller. Hence, the
model with heteroscedasticity problem will no longer have minimum
variances or be efficient. This will lead to the incorrect conclusion.
As stated in the theory, if heteroscedasticity occurs, it will not be easy to
correct them. If the sample size is large, White‟s Heteroscedasticity-
consistent Variances and Standard Errors can be used to correct the
standard errors of OLS estimators and conduct statistical inference based
on these standard errors (Gujarati & Porter, 2009). Since research sample
size is small which has 29 observations, researchers also include informal
way (graphical method) to detect heteroscedasticity problem. This is
because the sample is small and graphical method will provide a more
accurate answer compare to hypothesis testing, so the final conclusion will
be drawn base on graphical result.
3.5 Conclusion
After identifying both the data and methodology that researcher opted to use, the
analysis on the data will be done in Chapter 4 using the Ordinary Least Square
(OLS) estimator.
Factors Affecting Foreign Direct Investment Decision in Malaysia
Page 50 of 157
CHAPTER 4: DATA ANALYSIS
4.0 Introduction
This chapter revolved the analysis of data that had been collected for the study.
Using multiple linear regression method, researchers analyse the data to identify
which independent variables significantly affect the dependent variable, FDI
inflows to Malaysia (MFDI). On top of that, relationship between the independent
variables and the dependent variable are also figured out. Throughout this chapter,
data analysis would be carried out so as to fulfil both the objectives and
hypothesis which was mentioned in Chapter 1.
4.1 Empirical Result of Multiple Linear Regressions
Model
With the annual data from the year 1982 to 2010, researchers run the model using
E-views and the following results are obtained:
𝑀𝐹𝐷𝐼𝑡 = 2.00E+09- 0.010788GDPt+ 1.53E+08GDPGt-2.32E+09OREERt
se = (2.09E+09) (0.021409) (86462339) (9.89E+08)
p-value = (0.3497) (0.6196) (0.0917)* (0.0289)*
+8122953TLt+3.78E+09 TOt+ 14902615 INFt+ 0.044008CFDIt
se = (1.93E+08) (2.94E+09) (1.26E+08) (0.021564)
p-value = (0.9668) (0.2124) (0.9070) (0.0540)*
n = 29 R2= 0.832961 R 2 = 0.777282 Prob(F-statistic) = 0.000001*
*significant at 0.10 significance level
Following the attainment of the empirical results of multiple linear regressions,
researchers carried out diagnostic checking tests to ensure the error terms of the
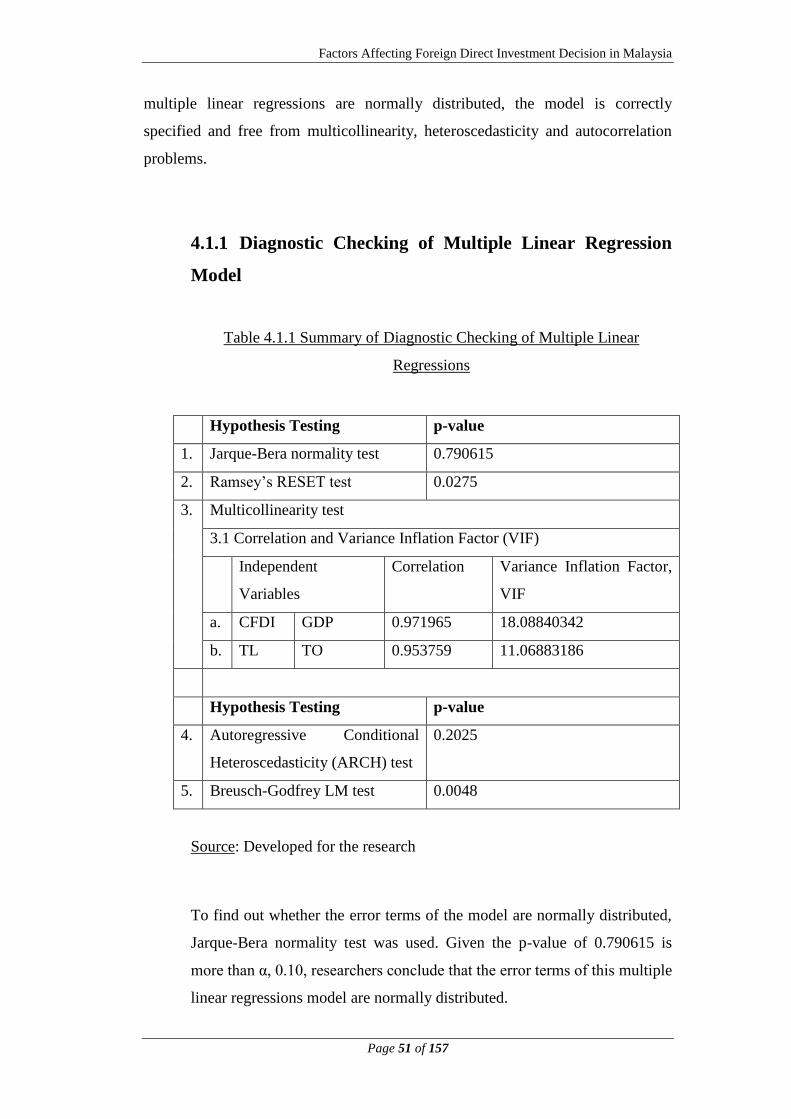
Factors Affecting Foreign Direct Investment Decision in Malaysia
Page 51 of 157
multiple linear regressions are normally distributed, the model is correctly
specified and free from multicollinearity, heteroscedasticity and autocorrelation
problems.
4.1.1 Diagnostic Checking of Multiple Linear Regression
Model
Table 4.1.1 Summary of Diagnostic Checking of Multiple Linear
Regressions
Hypothesis Testing p-value
1. Jarque-Bera normality test 0.790615
2. Ramsey‟s RESET test 0.0275
3. Multicollinearity test
3.1 Correlation and Variance Inflation Factor (VIF)
Independent
Variables
Correlation Variance Inflation Factor,
VIF
a. CFDI GDP 0.971965 18.08840342
b. TL TO 0.953759 11.06883186
Hypothesis Testing p-value
4. Autoregressive Conditional
Heteroscedasticity (ARCH) test
0.2025
5. Breusch-Godfrey LM test 0.0048
Source: Developed for the research
To find out whether the error terms of the model are normally distributed,
Jarque-Bera normality test was used. Given the p-value of 0.790615 is
more than α, 0.10, researchers conclude that the error terms of this multiple
linear regressions model are normally distributed.
Factors Affecting Foreign Direct Investment Decision in Malaysia
Page 52 of 157
Next, Ramsey‟s RESET test was performed to determine whether the
model is correctly specified. The researchers easily verify that the p-value
(0.0275) was less than the significance level of 0.10, indicating that the
multiple linear regressions model is mis-specified. Researchers, however,
did come to a conclusion that Ramsey‟s RESET test does not apply in this
study as the sample size was too small with only 29 observations. A test
such as RESET will only provide an accurate conclusion on the model
specification if the sample size is reasonably large.
Follow on, researchers proceed with multicollinearity testing. Base on the
precedent studies, the official real exchange rate, OREER is expected to
have relationship with the trade openness, TO. Adding on to the high R-
squared value, only one independent variable was found to be significant.
Hence, this further increases the researchers‟ suspicion that the model has
multicollinearity problem. Researchers then carried out correlation test and
variance inflation factor (VIF) to see which variables are highly correlated.
The correlation table shows that official real exchange rate and trade
openness has a low correlation of 0.828626 and a variance inflation factor
of3.191024765 which put them in a no serious multicollinearity problem
range of 1 and 5. However, the pair-wide correlations of gross domestic
product (GDP) and China foreign direct investment inflows (CFDI); and
telephone lines (per 100 people) (TL) and trade openness (TO) shows high
correlations that is 0.971965 and 0.953759 respectively. The variance
inflation factor, VIF calculated also indicated these 2 pairs have high value
of variance inflation factor which are 18.08840342 and 11.06883186
respectively. Since the values are more than 10, the pairs of gross domestic
product (GDP) and China foreign direct investment inflows (CFDI); and
telephone lines (per 100 people) (TL) and trade openness (TO) are
concluded as having serious multicollinearity problem.
Despite Jarque-Bera normality test proved that the error terms are
normally distributed, it does not free the model from heteroscedasticity and
autocorrelation problems. In order to detect heteroscedasticity and
Factors Affecting Foreign Direct Investment Decision in Malaysia
Page 53 of 157
autocorrelation problems, hypothesis checking has to be carried out.
Autoregressive Conditional Heteroscedasticity (ARCH) test is chosen to
detect heteroscedasticity problem while Breusch-Godfrey LM test is used
to detect autocorrelation problem. Researchers use a maximum of 6 lag
lengths to detect heteroscedasticity and autocorrelation problems as the
sample size is small. If researchers were to include too many lag length
inside, the degree of freedom would decrease and incurred inappropriate
hypothesis testing result. Among the 6 lag length, researchers chose p-
value from the lag length with the lowest Akaike Information Criterion
(AIC) to make decision. Owing to the small sample size, graphical method
is deemed to be more appropriate than hypothesis testing in detecting both
the problems. Somehow, we do both hypothesis testing and graphical
method to compare and detect the problems.
Autoregressive Conditional Heteroscedasticity (ARCH) test indicates that
the model is free from heteroscedasticity problem as the p-value is 0.2025,
greater than the critical value of 0.10. From this, researchers conclude that
the model does not have heteroscedasticity problem. But somehow, the
model does appear to have autocorrelation problem. The p-value of the
model which is 0.0048 is smaller than the significance level of 0.10. Using
the hypothesis testing method, researchers conclude that the model has
autocorrelation problem but not heteroscedasticity problem.
However, the residual graph shows that the model has both
heteroscedasticity and autocorrelation problem. The high volatility of error
terms point out the existence of heteroscedasticity problem. In addition,
the decreasing trend of the error terms indicates the autocorrelation
problem.
In conclusion, the error terms of multiple linear regressions model are
normally distributed, but the model specification is incorrect and has
multicollinearity, heteroscedasticity and autocorrelation problems.
Researchers conclude that the estimated coefficient values are biased and
inefficient for the problems encountered. The standard errors, t-statistics
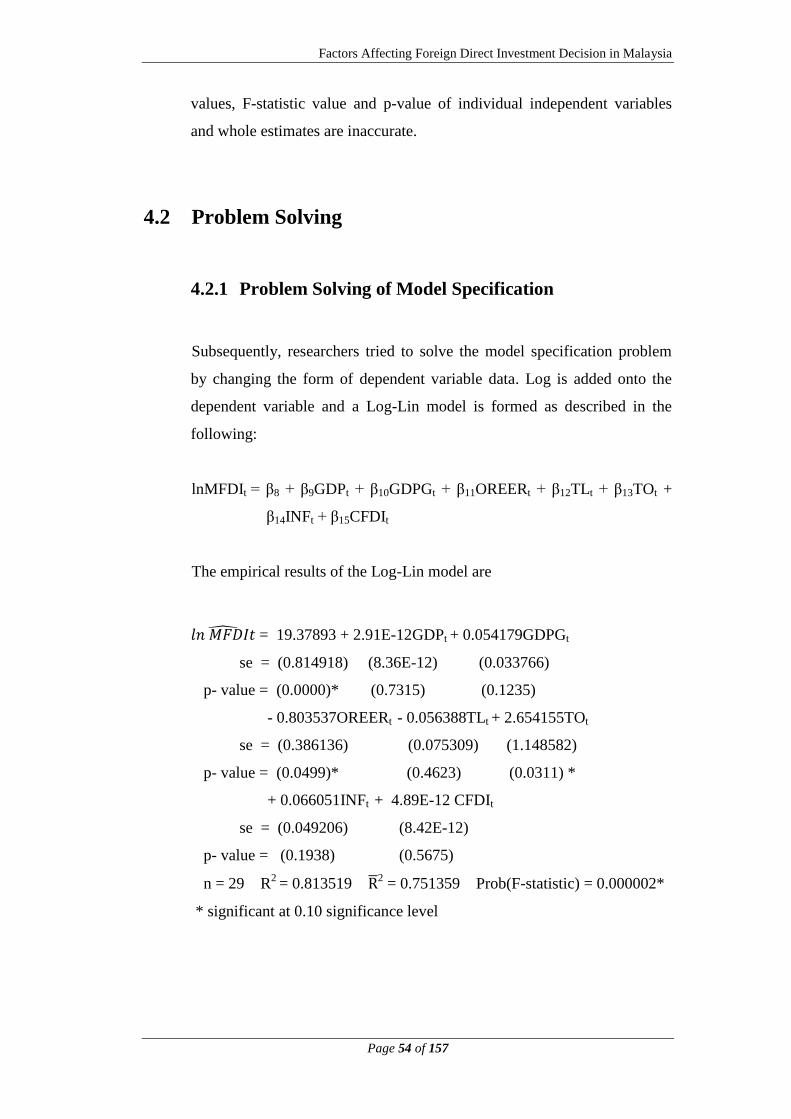
Factors Affecting Foreign Direct Investment Decision in Malaysia
Page 54 of 157
values, F-statistic value and p-value of individual independent variables
and whole estimates are inaccurate.
4.2 Problem Solving
4.2.1 Problem Solving of Model Specification
Subsequently, researchers tried to solve the model specification problem
by changing the form of dependent variable data. Log is added onto the
dependent variable and a Log-Lin model is formed as described in the
following:
lnMFDIt = β8 + β9GDPt + β10GDPGt + β11OREERt + β12TLt + β13TOt +
β14INFt + β15CFDIt
The empirical results of the Log-Lin model are
𝑙𝑛 𝑀𝐹𝐷𝐼𝑡 = 19.37893 + 2.91E-12GDPt + 0.054179GDPGt
se = (0.814918) (8.36E-12) (0.033766)
p- value = (0.0000)* (0.7315) (0.1235)
- 0.803537OREERt - 0.056388TLt + 2.654155TOt
se = (0.386136) (0.075309) (1.148582)
p- value = (0.0499)* (0.4623) (0.0311) *
+ 0.066051INFt + 4.89E-12 CFDIt
se = (0.049206) (8.42E-12)
p- value = (0.1938) (0.5675)
n = 29 R2
= 0.813519 R 2 = 0.751359 Prob(F-statistic) = 0.000002*
* significant at 0.10 significance level
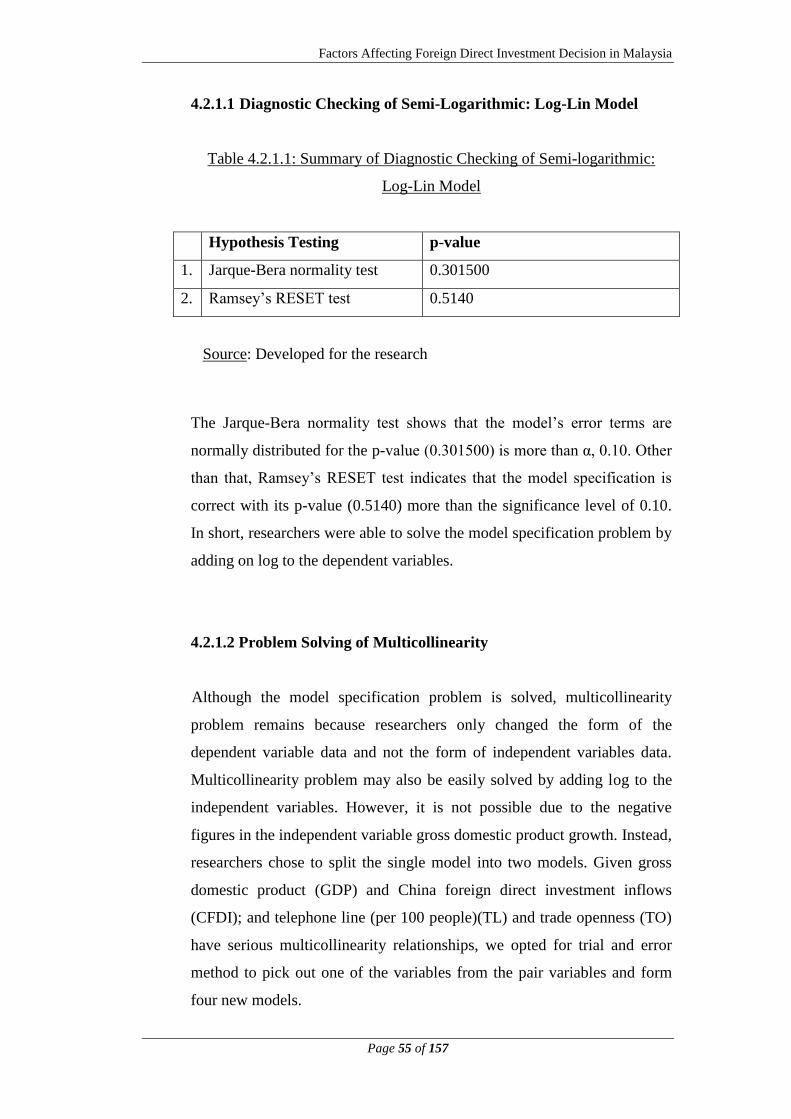
Factors Affecting Foreign Direct Investment Decision in Malaysia
Page 55 of 157
4.2.1.1 Diagnostic Checking of Semi-Logarithmic: Log-Lin Model
Table 4.2.1.1: Summary of Diagnostic Checking of Semi-logarithmic:
Log-Lin Model
Hypothesis Testing p-value
1. Jarque-Bera normality test 0.301500
2. Ramsey‟s RESET test 0.5140
Source: Developed for the research
The Jarque-Bera normality test shows that the model‟s error terms are
normally distributed for the p-value (0.301500) is more than α, 0.10. Other
than that, Ramsey‟s RESET test indicates that the model specification is
correct with its p-value (0.5140) more than the significance level of 0.10.
In short, researchers were able to solve the model specification problem by
adding on log to the dependent variables.
4.2.1.2 Problem Solving of Multicollinearity
Although the model specification problem is solved, multicollinearity
problem remains because researchers only changed the form of the
dependent variable data and not the form of independent variables data.
Multicollinearity problem may also be easily solved by adding log to the
independent variables. However, it is not possible due to the negative
figures in the independent variable gross domestic product growth. Instead,
researchers chose to split the single model into two models. Given gross
domestic product (GDP) and China foreign direct investment inflows
(CFDI); and telephone line (per 100 people)(TL) and trade openness (TO)
have serious multicollinearity relationships, we opted for trial and error
method to pick out one of the variables from the pair variables and form
four new models.
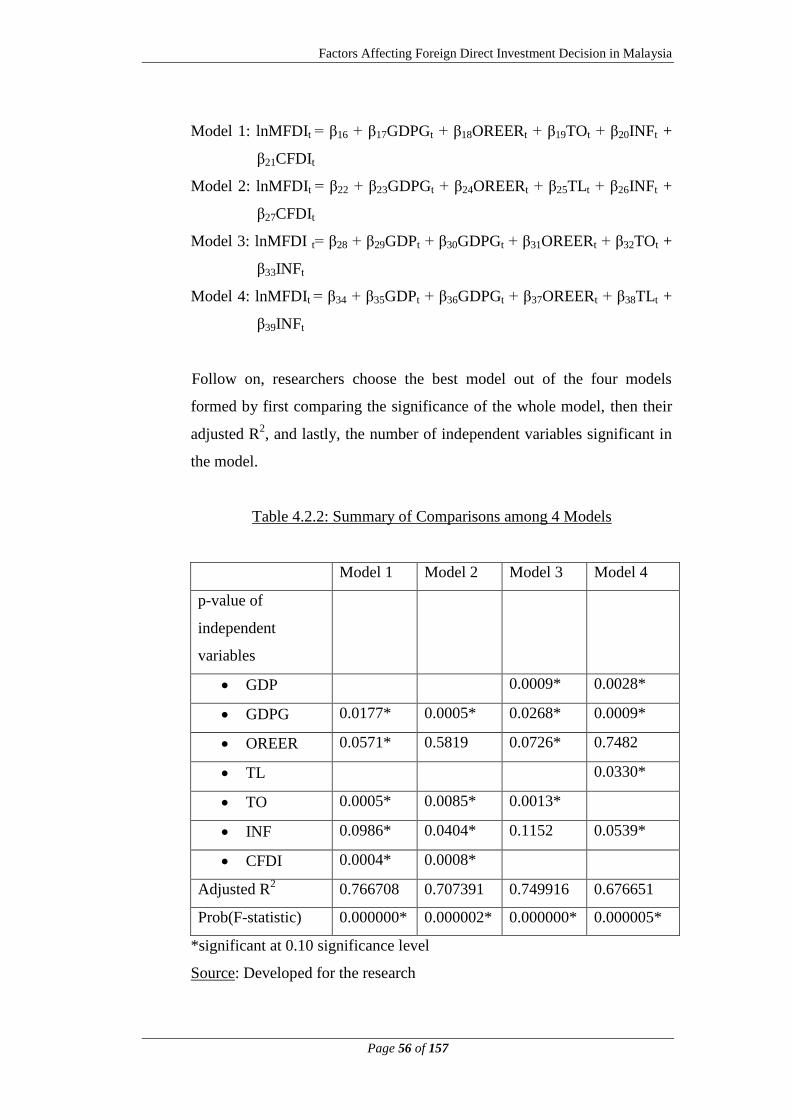
Factors Affecting Foreign Direct Investment Decision in Malaysia
Page 56 of 157
Model 1: lnMFDIt = β16 + β17GDPGt + β18OREERt + β19TOt + β20INFt +
β21CFDIt
Model 2: lnMFDIt = β22 + β23GDPGt + β24OREERt + β25TLt + β26INFt +
β27CFDIt
Model 3: lnMFDI t= β28 + β29GDPt + β30GDPGt + β31OREERt + β32TOt +
β33INFt
Model 4: lnMFDIt = β34 + β35GDPt + β36GDPGt + β37OREERt + β38TLt +
β39INFt
Follow on, researchers choose the best model out of the four models
formed by first comparing the significance of the whole model, then their
adjusted R2, and lastly, the number of independent variables significant in
the model.
Table 4.2.2: Summary of Comparisons among 4 Models
Model 1 Model 2 Model 3 Model 4
p-value of
independent
variables
GDP 0.0009* 0.0028*
GDPG 0.0177* 0.0005* 0.0268* 0.0009*
OREER 0.0571* 0.5819 0.0726* 0.7482
TL 0.0330*
TO 0.0005* 0.0085* 0.0013*
INF 0.0986* 0.0404* 0.1152 0.0539*
CFDI 0.0004* 0.0008*
Adjusted R2 0.766708 0.707391 0.749916 0.676651
Prob(F-statistic) 0.000000* 0.000002* 0.000000* 0.000005*
*significant at 0.10 significance level
Source: Developed for the research
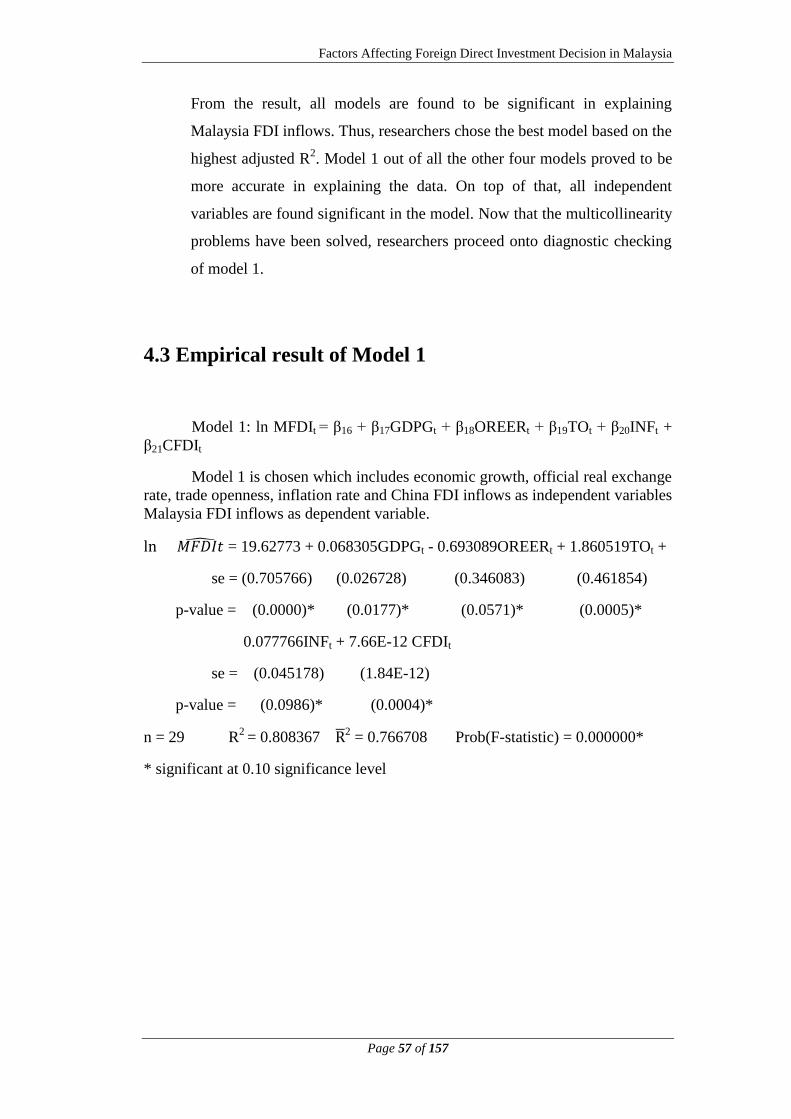
Factors Affecting Foreign Direct Investment Decision in Malaysia
Page 57 of 157
From the result, all models are found to be significant in explaining
Malaysia FDI inflows. Thus, researchers chose the best model based on the
highest adjusted R2. Model 1 out of all the other four models proved to be
more accurate in explaining the data. On top of that, all independent
variables are found significant in the model. Now that the multicollinearity
problems have been solved, researchers proceed onto diagnostic checking
of model 1.
4.3 Empirical result of Model 1
Model 1: ln MFDIt = β16 + β17GDPGt + β18OREERt + β19TOt + β20INFt +
β21CFDIt
Model 1 is chosen which includes economic growth, official real exchange
rate, trade openness, inflation rate and China FDI inflows as independent variables
Malaysia FDI inflows as dependent variable.
ln 𝑀𝐹𝐷𝐼𝑡 = 19.62773 + 0.068305GDPGt - 0.693089OREERt + 1.860519TOt +
se = (0.705766) (0.026728) (0.346083) (0.461854)
p-value = (0.0000)* (0.0177)* (0.0571)* (0.0005)*
0.077766INFt + 7.66E-12 CFDIt
se = (0.045178) (1.84E-12)
p-value = (0.0986)* (0.0004)*
n = 29 R2
= 0.808367 R 2 = 0.766708 Prob(F-statistic) = 0.000000*
* significant at 0.10 significance level
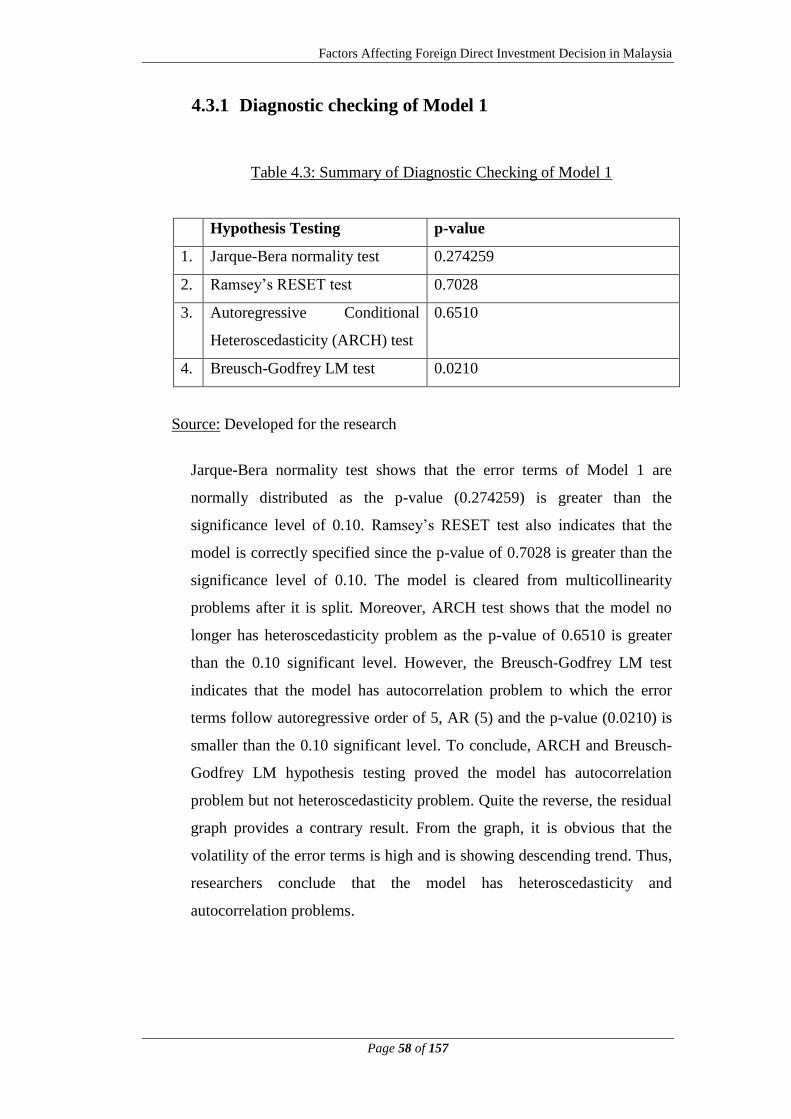
Factors Affecting Foreign Direct Investment Decision in Malaysia
Page 58 of 157
4.3.1 Diagnostic checking of Model 1
Table 4.3: Summary of Diagnostic Checking of Model 1
Hypothesis Testing p-value
1. Jarque-Bera normality test 0.274259
2. Ramsey‟s RESET test 0.7028
3. Autoregressive Conditional
Heteroscedasticity (ARCH) test
0.6510
4. Breusch-Godfrey LM test 0.0210
Source: Developed for the research
Jarque-Bera normality test shows that the error terms of Model 1 are
normally distributed as the p-value (0.274259) is greater than the
significance level of 0.10. Ramsey‟s RESET test also indicates that the
model is correctly specified since the p-value of 0.7028 is greater than the
significance level of 0.10. The model is cleared from multicollinearity
problems after it is split. Moreover, ARCH test shows that the model no
longer has heteroscedasticity problem as the p-value of 0.6510 is greater
than the 0.10 significant level. However, the Breusch-Godfrey LM test
indicates that the model has autocorrelation problem to which the error
terms follow autoregressive order of 5, AR (5) and the p-value (0.0210) is
smaller than the 0.10 significant level. To conclude, ARCH and Breusch-
Godfrey LM hypothesis testing proved the model has autocorrelation
problem but not heteroscedasticity problem. Quite the reverse, the residual
graph provides a contrary result. From the graph, it is obvious that the
volatility of the error terms is high and is showing descending trend. Thus,
researchers conclude that the model has heteroscedasticity and
autocorrelation problems.

Factors Affecting Foreign Direct Investment Decision in Malaysia
Page 59 of 157
In short, the error terms of Model 1 are normally distributed and the model
is correctly specified. Furthermore, it has no multicollinearity problem
only heteroscedasticity and autocorrelation problems.
4.3.2 Heteroscedasticity Problem Solving of Model 1
Based on the residual graph of model 1, researchers identified the model
with heteroscedasticity problem but were not aware of the severity of the
problem as Breusch-Godfrey LM hypothesis testing indicated that the
model has no heteroscedasticity problem. There was no empirical result
allowing researchers to know the degree of heteroscedasticity problem in
the model. In face of this problem, the estimated coefficient values are
assumed to have become inefficient. So in order to obtain a better result,
researchers used White‟s Heteroscedasticity-consistent Variances and
Standard Errors to minimize the heteroscedasticity problem. By using this
method, not only the standard error of the dependent variables, t-statistic as
well as p-value of the independent variables will also be largely improved.
𝑙𝑛 𝑀𝐹𝐷𝐼𝑡 = 19.62773 + 0.068305GDPGt - 0.693089OREERt
se = (0.522269) (0.035372) (0.304931)
p-value = (0.0000)* (0.0659)* (0.0327)*
+ 1.860519TOt + 0.077766INFt + 7.66E-12 CFDIt
se = (0.483130) (0.035864) (1.69E-12)
p-value = (0.0008)* (0.0407)* (0.0001)*
n = 29 R2
= 0.808367 R 2 = 0.766708 Prob(F-statistic) = 0.000000*
*significant at 0.10 significance level
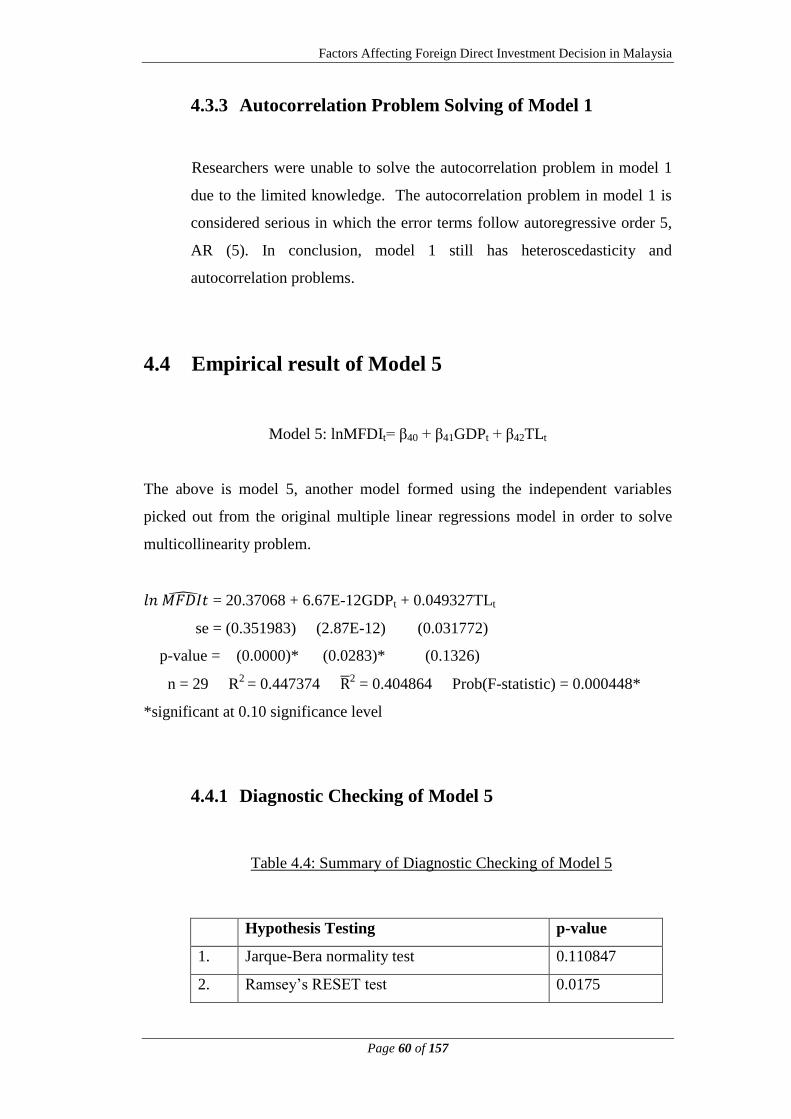
Factors Affecting Foreign Direct Investment Decision in Malaysia
Page 60 of 157
4.3.3 Autocorrelation Problem Solving of Model 1
Researchers were unable to solve the autocorrelation problem in model 1
due to the limited knowledge. The autocorrelation problem in model 1 is
considered serious in which the error terms follow autoregressive order 5,
AR (5). In conclusion, model 1 still has heteroscedasticity and
autocorrelation problems.
4.4 Empirical result of Model 5
Model 5: lnMFDIt= β40 + β41GDPt + β42TLt
The above is model 5, another model formed using the independent variables
picked out from the original multiple linear regressions model in order to solve
multicollinearity problem.
𝑙𝑛 𝑀𝐹𝐷𝐼𝑡 = 20.37068 + 6.67E-12GDPt + 0.049327TLt
se = (0.351983) (2.87E-12) (0.031772)
p-value = (0.0000)* (0.0283)* (0.1326)
n = 29 R2
= 0.447374 R 2 = 0.404864 Prob(F-statistic) = 0.000448*
*significant at 0.10 significance level
4.4.1 Diagnostic Checking of Model 5
Table 4.4: Summary of Diagnostic Checking of Model 5
Hypothesis Testing p-value
1. Jarque-Bera normality test 0.110847
2. Ramsey‟s RESET test 0.0175
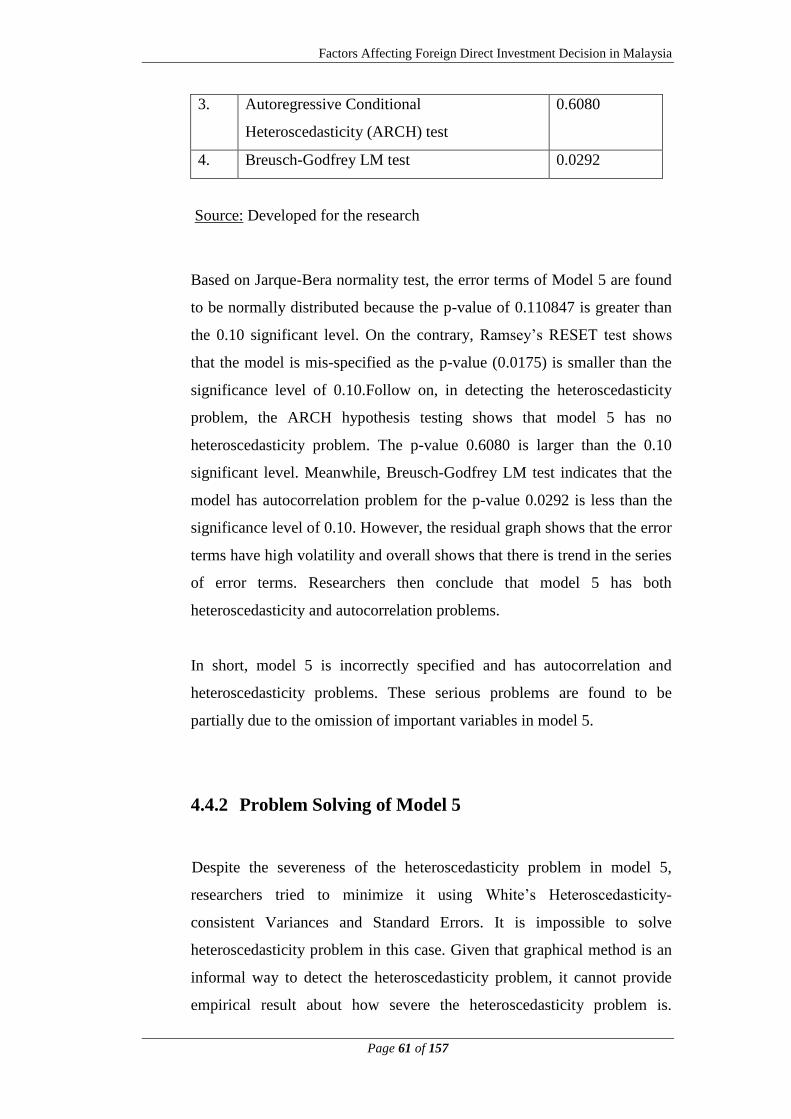
Factors Affecting Foreign Direct Investment Decision in Malaysia
Page 61 of 157
3. Autoregressive Conditional
Heteroscedasticity (ARCH) test
0.6080
4. Breusch-Godfrey LM test 0.0292
Source: Developed for the research
Based on Jarque-Bera normality test, the error terms of Model 5 are found
to be normally distributed because the p-value of 0.110847 is greater than
the 0.10 significant level. On the contrary, Ramsey‟s RESET test shows
that the model is mis-specified as the p-value (0.0175) is smaller than the
significance level of 0.10.Follow on, in detecting the heteroscedasticity
problem, the ARCH hypothesis testing shows that model 5 has no
heteroscedasticity problem. The p-value 0.6080 is larger than the 0.10
significant level. Meanwhile, Breusch-Godfrey LM test indicates that the
model has autocorrelation problem for the p-value 0.0292 is less than the
significance level of 0.10. However, the residual graph shows that the error
terms have high volatility and overall shows that there is trend in the series
of error terms. Researchers then conclude that model 5 has both
heteroscedasticity and autocorrelation problems.
In short, model 5 is incorrectly specified and has autocorrelation and
heteroscedasticity problems. These serious problems are found to be
partially due to the omission of important variables in model 5.
4.4.2 Problem Solving of Model 5
Despite the severeness of the heteroscedasticity problem in model 5,
researchers tried to minimize it using White‟s Heteroscedasticity-
consistent Variances and Standard Errors. It is impossible to solve
heteroscedasticity problem in this case. Given that graphical method is an
informal way to detect the heteroscedasticity problem, it cannot provide
empirical result about how severe the heteroscedasticity problem is.
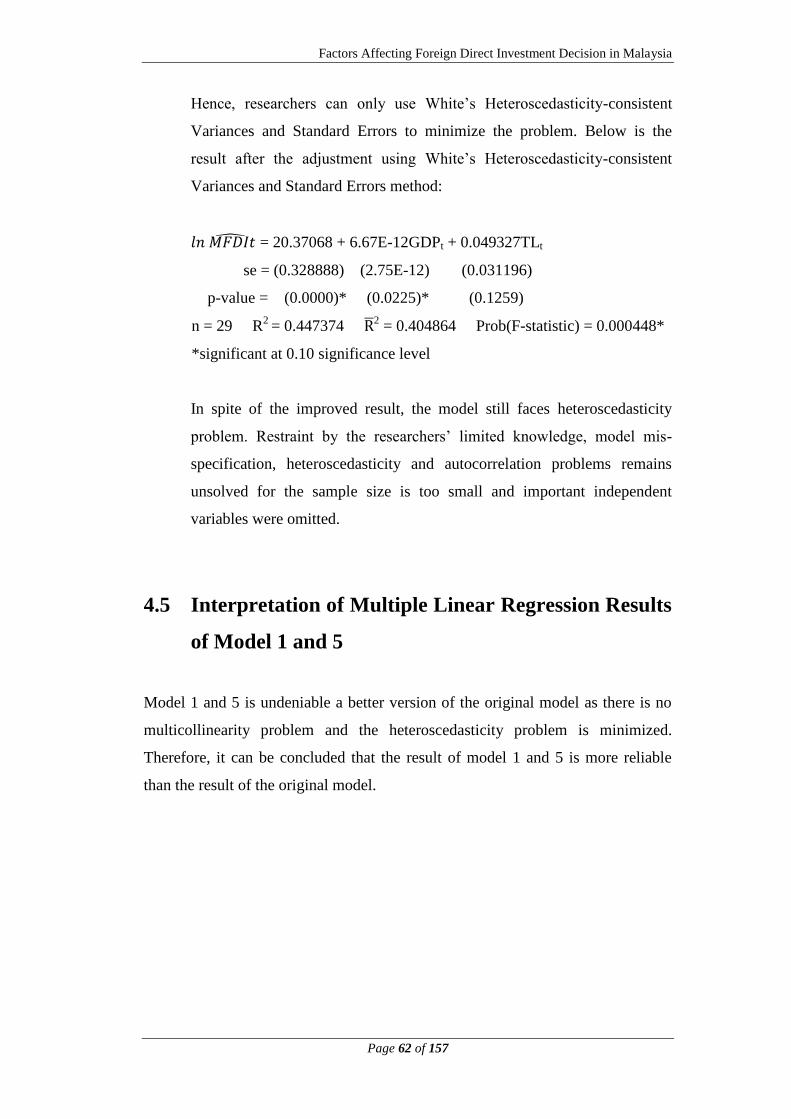
Factors Affecting Foreign Direct Investment Decision in Malaysia
Page 62 of 157
Hence, researchers can only use White‟s Heteroscedasticity-consistent
Variances and Standard Errors to minimize the problem. Below is the
result after the adjustment using White‟s Heteroscedasticity-consistent
Variances and Standard Errors method:
𝑙𝑛 𝑀𝐹𝐷𝐼𝑡 = 20.37068 + 6.67E-12GDPt + 0.049327TLt
se = (0.328888) (2.75E-12) (0.031196)
p-value = (0.0000)* (0.0225)* (0.1259)
n = 29 R2
= 0.447374 R 2 = 0.404864 Prob(F-statistic) = 0.000448*
*significant at 0.10 significance level
In spite of the improved result, the model still faces heteroscedasticity
problem. Restraint by the researchers‟ limited knowledge, model mis-
specification, heteroscedasticity and autocorrelation problems remains
unsolved for the sample size is too small and important independent
variables were omitted.
4.5 Interpretation of Multiple Linear Regression Results
of Model 1 and 5
Model 1 and 5 is undeniable a better version of the original model as there is no
multicollinearity problem and the heteroscedasticity problem is minimized.
Therefore, it can be concluded that the result of model 1 and 5 is more reliable
than the result of the original model.
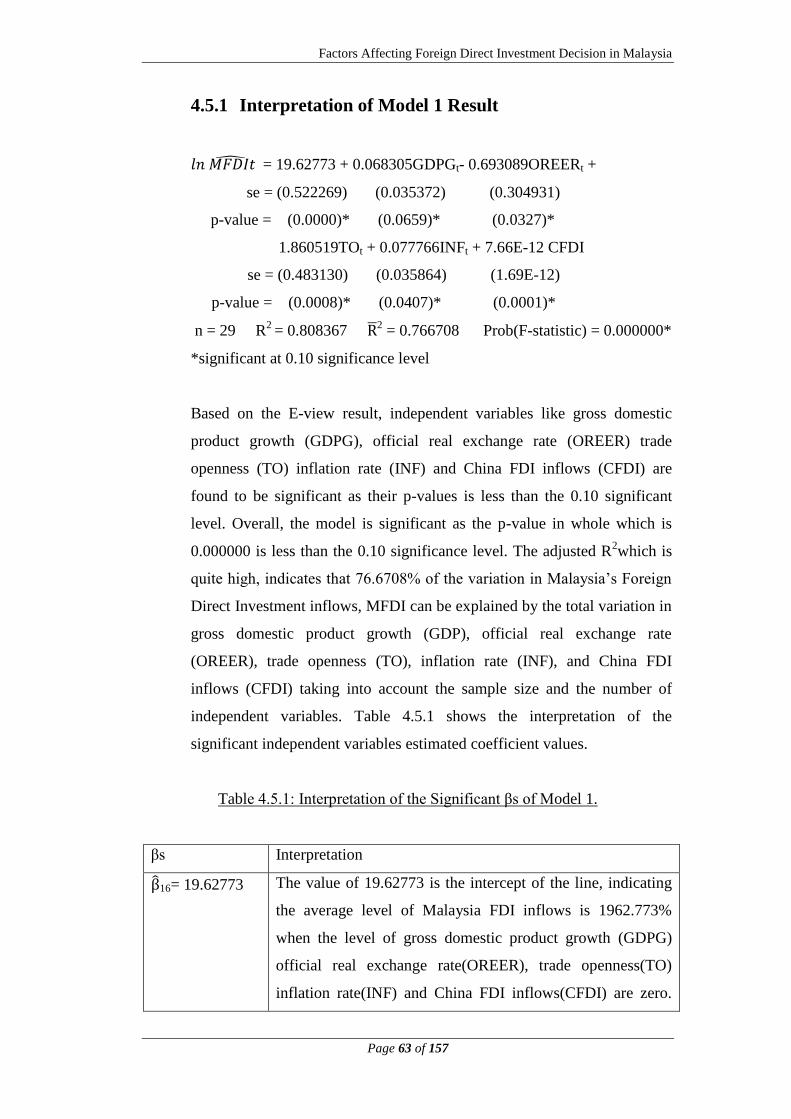
Factors Affecting Foreign Direct Investment Decision in Malaysia
Page 63 of 157
4.5.1 Interpretation of Model 1 Result
𝑙𝑛 𝑀𝐹𝐷𝐼𝑡 = 19.62773 + 0.068305GDPGt- 0.693089OREERt +
se = (0.522269) (0.035372) (0.304931)
p-value = (0.0000)* (0.0659)* (0.0327)*
1.860519TOt + 0.077766INFt + 7.66E-12 CFDI
se = (0.483130) (0.035864) (1.69E-12)
p-value = (0.0008)* (0.0407)* (0.0001)*
n = 29 R2
= 0.808367 R 2 = 0.766708 Prob(F-statistic) = 0.000000*
*significant at 0.10 significance level
Based on the E-view result, independent variables like gross domestic
product growth (GDPG), official real exchange rate (OREER) trade
openness (TO) inflation rate (INF) and China FDI inflows (CFDI) are
found to be significant as their p-values is less than the 0.10 significant
level. Overall, the model is significant as the p-value in whole which is
0.000000 is less than the 0.10 significance level. The adjusted R2which is
quite high, indicates that 76.6708% of the variation in Malaysia‟s Foreign
Direct Investment inflows, MFDI can be explained by the total variation in
gross domestic product growth (GDP), official real exchange rate
(OREER), trade openness (TO), inflation rate (INF), and China FDI
inflows (CFDI) taking into account the sample size and the number of
independent variables. Table 4.5.1 shows the interpretation of the
significant independent variables estimated coefficient values.
Table 4.5.1: Interpretation of the Significant βs of Model 1.
βs Interpretation
β 16= 19.62773 The value of 19.62773 is the intercept of the line, indicating
the average level of Malaysia FDI inflows is 1962.773%
when the level of gross domestic product growth (GDPG)
official real exchange rate(OREER), trade openness(TO)
inflation rate(INF) and China FDI inflows(CFDI) are zero.
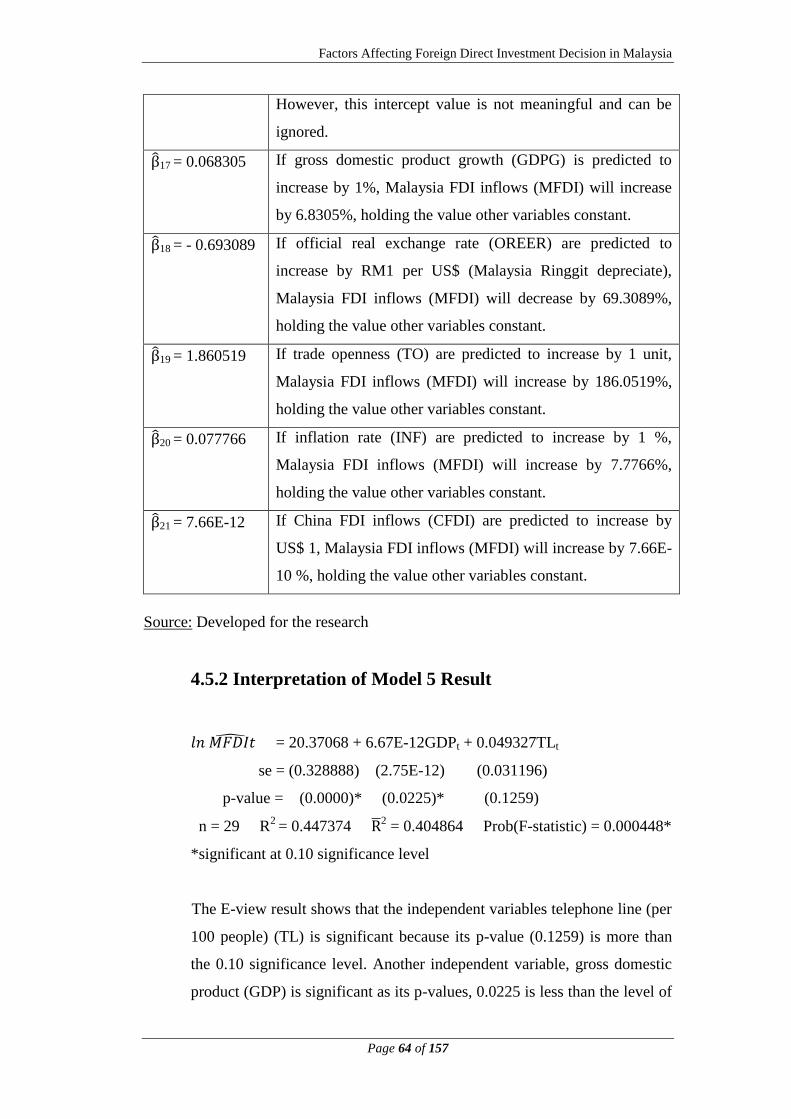
Factors Affecting Foreign Direct Investment Decision in Malaysia
Page 64 of 157
However, this intercept value is not meaningful and can be
ignored.
β 17 = 0.068305 If gross domestic product growth (GDPG) is predicted to
increase by 1%, Malaysia FDI inflows (MFDI) will increase
by 6.8305%, holding the value other variables constant.
β 18 = - 0.693089 If official real exchange rate (OREER) are predicted to
increase by RM1 per US$ (Malaysia Ringgit depreciate),
Malaysia FDI inflows (MFDI) will decrease by 69.3089%,
holding the value other variables constant.
β 19 = 1.860519 If trade openness (TO) are predicted to increase by 1 unit,
Malaysia FDI inflows (MFDI) will increase by 186.0519%,
holding the value other variables constant.
β 20 = 0.077766 If inflation rate (INF) are predicted to increase by 1 %,
Malaysia FDI inflows (MFDI) will increase by 7.7766%,
holding the value other variables constant.
β 21 = 7.66E-12 If China FDI inflows (CFDI) are predicted to increase by
US$ 1, Malaysia FDI inflows (MFDI) will increase by 7.66E-
10 %, holding the value other variables constant.
Source: Developed for the research
4.5.2 Interpretation of Model 5 Result
𝑙𝑛 𝑀𝐹𝐷𝐼𝑡 = 20.37068 + 6.67E-12GDPt + 0.049327TLt
se = (0.328888) (2.75E-12) (0.031196)
p-value = (0.0000)* (0.0225)* (0.1259)
n = 29 R2
= 0.447374 R 2 = 0.404864 Prob(F-statistic) = 0.000448*
*significant at 0.10 significance level
The E-view result shows that the independent variables telephone line (per
100 people) (TL) is significant because its p-value (0.1259) is more than
the 0.10 significance level. Another independent variable, gross domestic
product (GDP) is significant as its p-values, 0.0225 is less than the level of
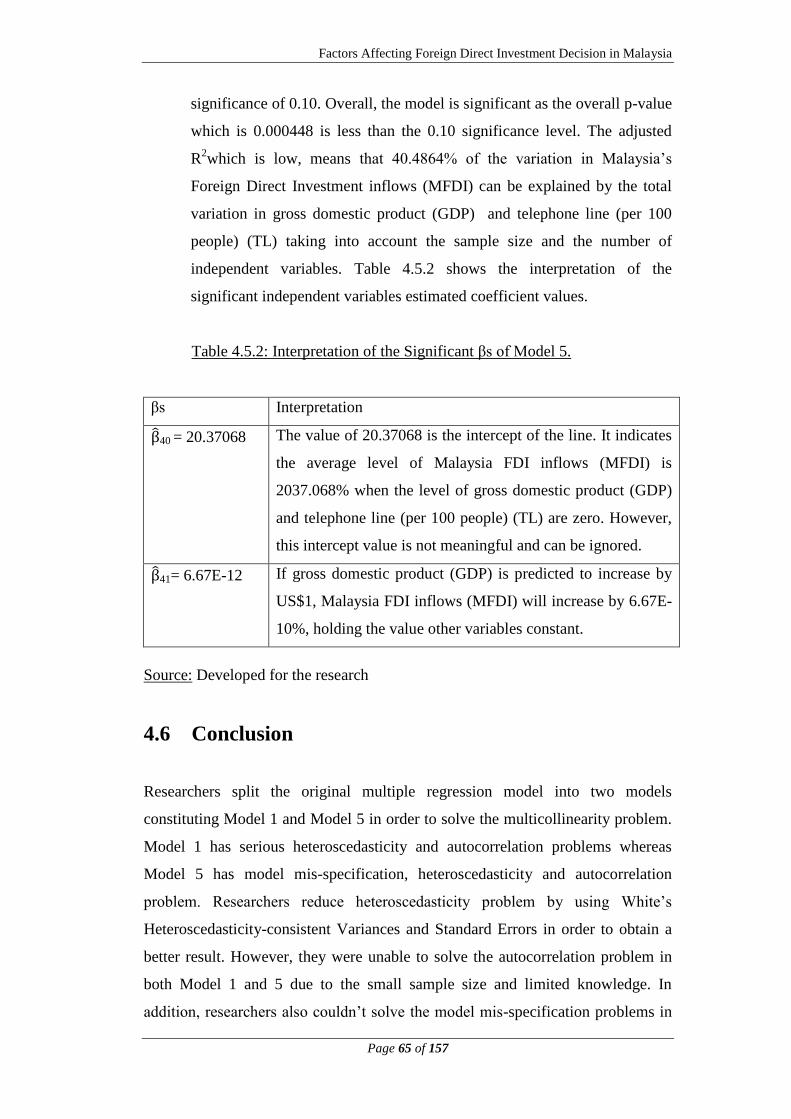
Factors Affecting Foreign Direct Investment Decision in Malaysia
Page 65 of 157
significance of 0.10. Overall, the model is significant as the overall p-value
which is 0.000448 is less than the 0.10 significance level. The adjusted
R2which is low, means that 40.4864% of the variation in Malaysia‟s
Foreign Direct Investment inflows (MFDI) can be explained by the total
variation in gross domestic product (GDP) and telephone line (per 100
people) (TL) taking into account the sample size and the number of
independent variables. Table 4.5.2 shows the interpretation of the
significant independent variables estimated coefficient values.
Table 4.5.2: Interpretation of the Significant βs of Model 5.
βs Interpretation
β 40 = 20.37068 The value of 20.37068 is the intercept of the line. It indicates
the average level of Malaysia FDI inflows (MFDI) is
2037.068% when the level of gross domestic product (GDP)
and telephone line (per 100 people) (TL) are zero. However,
this intercept value is not meaningful and can be ignored.
β 41= 6.67E-12 If gross domestic product (GDP) is predicted to increase by
US$1, Malaysia FDI inflows (MFDI) will increase by 6.67E-
10%, holding the value other variables constant.
Source: Developed for the research
4.6 Conclusion
Researchers split the original multiple regression model into two models
constituting Model 1 and Model 5 in order to solve the multicollinearity problem.
Model 1 has serious heteroscedasticity and autocorrelation problems whereas
Model 5 has model mis-specification, heteroscedasticity and autocorrelation
problem. Researchers reduce heteroscedasticity problem by using White‟s
Heteroscedasticity-consistent Variances and Standard Errors in order to obtain a
better result. However, they were unable to solve the autocorrelation problem in
both Model 1 and 5 due to the small sample size and limited knowledge. In
addition, researchers also couldn‟t solve the model mis-specification problems in
Factors Affecting Foreign Direct Investment Decision in Malaysia
Page 66 of 157
Model 5 as the model omitted some important independent variables. Due to all
these limitations, researchers were unable to get the best result.
Researchers then chose to interpret the result of Model 1 and 5. It is found that
telephone line (per 100 people) (TL) is insignificantly affecting Malaysia FDI
inflows (MFDI) at 0.10 significant level. This means that this variable has no
relationship with Malaysia FDI inflows (MFDI). On the other hands, it has also
come to the researchers‟ realization that gross domestic product growth (GDPG),
official real exchange rate (OREER), trade openness (TO), inflation rate (INF),
China FDI inflow (CFDI) and gross domestic product (GDP) significantly affect
Malaysia FDI inflows (MFDI) and have relationship with Malaysia FDI inflows
(MFDI) at the significance level of 0.10. Official real exchange rate (OREER) has
negative relationship with Malaysia FDI inflows (MFDI) while gross domestic
product growth (GDPG), trade openness (TO), inflation rate (INF), China FDI
inflows (CFDI) and gross domestic products (GDP) have positive relationship
with Malaysia FDI inflows (MFDI).
Factors Affecting Foreign Direct Investment Decision in Malaysia
Page 67 of 157
CHAPTER 5: DISCUSSION, CONCLUSION AND
IMPLICATIONS
5.0 Introduction
In this tough economic time, foreign direct investment definitely plays an
important role in Malaysia economic growth. As investigated, many factors are
found to affect investors‟ decision on the country to invest in and how policy
makers attract more FDI inflow to Malaysia. In the previous chapter, researchers
run diagnostic checking tests, F-test, and T-test to examine the significance of the
independent variables on the dependent variable - FDI of Malaysia. In this chapter,
researchers will be comparing the major findings with the past research papers and
also state the implications of this study to both policy makers and practitioners.
Last but not least, this chapter will also comprise the limitations of study and
recommendations for future researches.
5.1 Summary of Statistical Analyses
In chapter 4, researchers started out with the F-test to see whether the multiple
linear regressions model is significant. After proving the model to be significant,
diagnostic checking was performed, including Jarque-Bera normality test to see
whether the error terms of the model are normally distributed; Ramsey‟s RESET
test to check whether the model is correctly specified; Multicollinearity test to find
out whether there is multicollinearity problem between the variables;
Autoregressive Conditional Heteroscedasticity (ARCH) test to investigate whether
heteroscedasticity problem exist or not; and lastly, Breusch-Godfrey LM test to
find out whether autocorrelation problem do exist in this model.
Factors Affecting Foreign Direct Investment Decision in Malaysia
Page 68 of 157
Based on the statistical results, it is proven that the model specification of this
multiple linear regressions model was incorrect. In order to solve this problem,
researchers changed the form of the dependent variable data by adding on log,
turning it into a semi-logarithmic or so called the Log-Lin model. Also, results
show this model consist of heteroscedasticity, multicollinearity, and
autocorrelation problems. In face with the multicollinearity problem, researchers
split the original multiple linear regressions model into two new models, Model 1
and Model 5. As seen from the results, both of these models are significant but
Model 1 has serious heteroscedasticity and autocorrelation problems, while Model
5 has model specification, heteroscedasticity and autocorrelation problems.
Researchers used White‟s Heteroscedasticity-consistent Variances and Standard
Errors to obtain better result by reducing the heteroscedasticity problem. However,
autocorrelation problem in both Model 1 and Model 5 and model specification
problem in Model 5 was still unable to be solved due to the limited knowledge.
In a nutshell, researchers have chosen Model 1 and Model 5 for interpretation.
Results show that quality of infrastructure (telephone line per 100 people) is
insignificant to Malaysia FDI inflows at 0.10 significance level, while other
independent variables such as economic growth (gross domestic product growth),
exchange rate (official real exchange rate), trade openness (trade openness),
inflation rate (consumer prices), China FDI inflows (China FDI inflows) and
market size (gross domestic product) are significant to Malaysia FDI inflows at
0.10 significance level. The details will be discussed as follows.
Table 5.1: Decision for the Hypotheses of the Study
Hypotheses of the study Decision
i. H0: There is no relationship between all
independent variables and FDI inflow in
Malaysia.
H1: At least one independent variable has
relationship with FDI inflow in Malaysia.
Reject H0
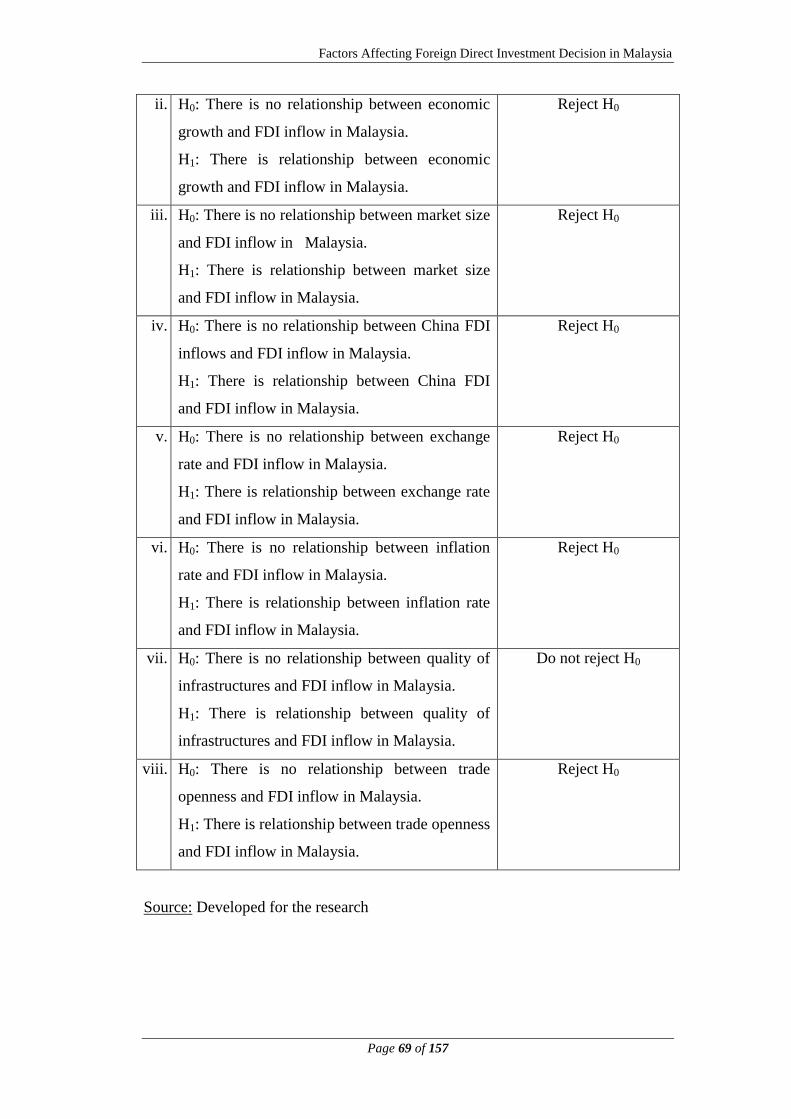
Factors Affecting Foreign Direct Investment Decision in Malaysia
Page 69 of 157
ii. H0: There is no relationship between economic
growth and FDI inflow in Malaysia.
H1: There is relationship between economic
growth and FDI inflow in Malaysia.
Reject H0
iii. H0: There is no relationship between market size
and FDI inflow in Malaysia.
H1: There is relationship between market size
and FDI inflow in Malaysia.
Reject H0
iv. H0: There is no relationship between China FDI
inflows and FDI inflow in Malaysia.
H1: There is relationship between China FDI
and FDI inflow in Malaysia.
Reject H0
v. H0: There is no relationship between exchange
rate and FDI inflow in Malaysia.
H1: There is relationship between exchange rate
and FDI inflow in Malaysia.
Reject H0
vi. H0: There is no relationship between inflation
rate and FDI inflow in Malaysia.
H1: There is relationship between inflation rate
and FDI inflow in Malaysia.
Reject H0
vii. H0: There is no relationship between quality of
infrastructures and FDI inflow in Malaysia.
H1: There is relationship between quality of
infrastructures and FDI inflow in Malaysia.
Do not reject H0
viii. H0: There is no relationship between trade
openness and FDI inflow in Malaysia.
H1: There is relationship between trade openness
and FDI inflow in Malaysia.
Reject H0
Source: Developed for the research
Factors Affecting Foreign Direct Investment Decision in Malaysia
Page 70 of 157
5.2 Discussions of Major Findings
5.2.1 Market Size
Market size measured by gross domestic product plays an important role in
this study because it indicates how well a country‟s population demand for
the output. It is important for foreign investor to determine whether to
invest or not from the view of market opportunity.
The hypothesis testing of market size in this research paper shows that
gross domestic product is significant and positively affects Malaysia
foreign direct investment inflows at the significance level of 0.10. This
result is consistent with previous researchers like Quer and Claver (2007),
Rodriguez and Pallas (2008), Vadlamannati, Tamazian and Irala (2009)
and Trevino and Mixon Jr. (2004) which also uses gross domestic product
as the indicator for market size.
This proves that Malaysia FDI inflows will increase given the level of
gross domestic product increase. This is parallel to the study of Sharma &
Bandara (2010) who stated that larger market size will attract investors
with ease. Charkrabarti (2001) (as cited in Moosa & Cardak, 2006) also
supported the findings as it explains large market size means the resources
of the country will be utilized more efficiently and exploitation of
economies of scale. Hence, it is the key for investors who aim for long
term investment.
In contrast, Dermihan and Masca (2008) argued that gross domestic
product is not suitable to be an indicator for market size. Both the
researchers suggested that GDP per capita or GDP growth will be more
appropriate as the indicator for market size. Since this argument is not
backed by many research, gross domestic product is consider preferable as
the indicator for market size in this study.
Factors Affecting Foreign Direct Investment Decision in Malaysia
Page 71 of 157
5.2.2 Economic Growth
In the research paper of Benacek, Gronicki, Holland, and Sass (2000), it is
mentioned that economic growth itself has been identified frequently as an
important determinant of FDI inflow into the host countries. In the
researchers‟ case, it was similar as the test results in chapter 4 proved that
economic growth was statistically positive significant to foreign direct
investment inflows to Malaysia.
The result is consistent with the past researches done by Dunning (1995),
Zhang (2001), Chakraboty and Basu (2002), Moosa (2002), and Hansen
and Rand (2006). In their research papers, they argues that MNCs with
certain ownership advantages will invest in another country with locational
advantages, and both advantages can be captured effectively by
“internalizing” production through FDI. Thus, high GDP growth rate
which represents soundness and stability of economic policies and the
effectiveness of the government institutions will definitely attract foreign
direct investment as it allows them to locate new profit opportunities.
On the contrary, researchers also found the results to be against the study
done by Kahai (2011). In Kahai‟s (2011) study, data from 1998 and 2000
for fifty-five developing countries were employed to examine both the
traditional and non-traditional determinants of foreign direct investment
flowing to developing countries. A significant relationship between
economic growth (as measured by the annual real GDP growth rate) and
FDI was failed to be established in that particular study.
5.2.3 Exchange Rate
Researchers found that the official real exchange rate significantly affects
Malaysia FDI inflows and has a negative relationship with Malaysia FDI
inflows at the 0.10 significance level. This result is in line with the study

Factors Affecting Foreign Direct Investment Decision in Malaysia
Page 72 of 157
done by Aqeel and Nishat (2005). In that study, it is verified that foreign
direct investment increase as exchange rate appreciates in the host country.
Conversely, when the exchange rate of the country depreciates, the FDI of
that particular country decreases as well. Furthermore, Campa (1993)
backed up by stating it is because the investors believe that an appreciation
of the exchange rate will likely increase the future profitability in terms of
the home currency.
On the other hand, multiple researchers found the opposite results. In the
study by Froot and Stein (1991), Klein and Rosengren (1994), Guo and
Trivedi (2002) and Kiyota and Urata (2004), depreciation of exchange rate
in the host country led to the increase in FDI inflows of the host country.
This is because the high currency value reduces the capital of the
investment.
This is inconsistent with the result of this study which displays that when
exchange rate appreciates in the host country, FDI inflows of the host
country will follow along and increase. The reason is because the investors
have high expectation on the economy and the returns.
5.2.4 Quality of Infrastructure
In this research study, the independent variable - quality of infrastructure -
stood out as it is found to be insignificant at the significance level of 0.10.
This means that there is no significant relationship between quality of
infrastructure and foreign direct investment inflows to Malaysia. Or in
other words, quality of infrastructure is not a determinant of Malaysia FDI
inflows.
Infrastructure covers many dimensions, ranging from physical assets such
as roads, sea ports, railways, and telecommunications, to institutional
development, such as accounting and legal services. As mentioned by
Factors Affecting Foreign Direct Investment Decision in Malaysia
Page 73 of 157
Asiedu (2002), a good measure of infrastructure development should take
into account both the availability and reliability of infrastructure. However,
in this case, the measure employed by researchers falls short since it
captures only the availability aspect of infrastructure. This is because
quantitative data on the reliability of infrastructure (such as the frequency
of telephone or power outage) are not very readily available for most
developing countries.
This view is further supported by Quazi (2007), who could not established
positive and significant relationship between infrastructure (measured as
the number of telephones per 1,000 people) and FDI in his study. The
authors admitted that „it is plausible that their proxy variables - the natural
log of the number of telephones available per 1,000 people and the adult
literacy rates, respectively, perhaps inadequately capture their true effects
on FDI. Moreover, Addison et al. (2006) as cited in Rehman, Ilyas, Alam,
and Akram (2011) acknowledge such promotional impact only for
developed nations but, on the other hand, such situation does not exist for
developing countries.
5.2.5 Trade Openness
Based on the results in Chapter 4, trade openness is found to have a
significant positive relationship with Malaysia FDI inflows at the 0.10
significance level. This result is on par with the study done by Moosa and
Cardak (2006), Demirhan and Masca (2008), and Sawkut, Boopen, Taruna,
and Vinesh (2009) whom verified trade openness is significant and have a
positive effect on the inflows of FDI. A country‟s willingness to accept
foreign direct investment is important to the FDI of that particular country.
Chantasasawat, Fung, Iizaka, and Siu (2010), Awan, Khan, and Zaman
(2011) and Srinivasan (2011) further support the results with the statement
that a country with a higher degree of trade openness will lead to an
increase in the foreign direct investment. This shows that investors are
Factors Affecting Foreign Direct Investment Decision in Malaysia
Page 74 of 157
more likely to make investment in those countries which have opened up
to the outside world.
On the other hand, the result obtained from this paper differs from some
researchers like Busse and Hefeker (2007) and Kolstad and Villanger
(2008). In their studies, trade openness is insignificant and negatively
affects FDI inflows. Study‟s result from Goodspeed, Martinez-Vazquez,
and Zhang (2006) also concludes that the effect of trade openness on FDI
is inconclusive.
5.2.6 Inflation rate
This research concluded that inflation rate is a significant determinant of
Malaysia FDI inflows. Based on the result, there is a positive relationship
between inflation rate and Malaysia FDI inflows as supported by past
researchers like Srinivasan (2011) and Addison and Heshmati (2003). In
the past research paper, Addison and Heshmati (2003) mentioned that
higher inflation rate indicates higher price levels which may lead to the
increased production activities of the host country. This then will attract
more foreign firms to invest in the host country for the increased expected
level of profitability. In addition, as stated by Srinivasan (2011), higher
inflation may lead to an increase in product price, which in turns decrease
the demand for host country‟s money. As currency of host country
depreciates, it attracts larger FDI inflows into Malaysia since its capacity
to invest is increased through the reduced cost of capital.
On the other hand, the results are found to be inconsistent with the some of
the past researches done. Despite researchers like Shamsuddin (1994),
Asiedu (2002), Demirhan and Masca (2008), and Azam (2010) have
proven inflation rate to be statistically significant to the FDI inflows, it is
also found that there is a negative relationship between inflation rate and
foreign direct investment. Asiedu (2002) mentioned that a low inflation
Factors Affecting Foreign Direct Investment Decision in Malaysia
Page 75 of 157
rate is taken as a sign of internal economic stability in the host country,
reflecting a lesser degree of uncertainty which encourage foreign direct
investment.
5.2.7 China FDI inflows
According to the statistical results, it shows that China FDI inflows
significantly affect Malaysia FDI inflows. In fact, there is a positive
relationship between China FDI inflows and Malaysia FDI inflows.
This result is different as compared to some past researches. For instance,
Salike (2010) found that there is a high degree of crowding out effect by
China FDI inflows on some other countries‟ FDI which mean that there is
a negative relationship between level of China FDI inflows and level of
FDI inflows to other countries. Other than that, Wang, Wei and Liu (2007)
found that there are significant positive and negative effects of China FDI
inflows based on different countries.
Despite all those, the results of this study are also strongly supported and is
consistent with some past researchers such as Athukorala and Waglé
(2011), Chantasasawat, Fung, Iizaka and Siu (2004), Eichengreen and
Tong (2007), and Eichengreen and Tong (2006). These researches showed
that an increase in the FDI inflows to China would raise the level of FDI
inflows to the other countries. This is due to the production linkages
between China and other countries such as Malaysia taking place in the
form of further fragmentation and specialization of the production process.
Therefore, when components and parts are traded between China and
Malaysia, an increase in China‟s foreign direct investment will positively
relates to an increase in the other countries‟ foreign direct investment. In
addition, as China‟s economy grows, its market will increase and the need
for minerals and resources will rise too. As a result, multinational
enterprises from other countries choose to invest in Malaysia in order to
Factors Affecting Foreign Direct Investment Decision in Malaysia
Page 76 of 157
extract minerals and resources, and then export it to China which is in need
of the whole spectrum of raw materials.
5.3 Implications of the Study
Practically, this research paper provides an insight on decision making for the
investors, policy makers, and practitioners such as Federal Government, Bank
Negara Malaysia. It plays an important role in determining the ways to attract
more foreign direct investment inflow to Malaysia.
Researchers found that gross domestic product growth, official real exchange rate,
trade openness, inflation rate, China foreign direct investment inflow and gross
domestic product significantly affect Malaysia FDI inflows. From the investors
perspectives, increase or decrease in gross domestic product growth can predict
the future development of the country. It also tells investors whether the country is
worth to invest in for long term given that the country‟s development is trending
well.
Moreover, research indicates the government on setting trade barrier in order to
increase trade openness level in Malaysia to attract more trade into the country.
According to Gao (2005), increase in trade openness level will probably lead to
the shifting of advanced technology for infrastructure and communication from
developed country to developing country. This will help in refining the
infrastructure and communication technology of Malaysia, and hence, making
import or export in the country more efficient. Country‟s economic growth will
also increase due to the ability of outsourcing and expansion of products to other
countries.
Besides that, gross domestic product also plays an important role in determining
the foreign direct investment inflow to Malaysia. Gross domestic product
determines the ability of a country‟s population in the demand of outputs.
Investors such as foreign firms or companies will most likely take into
Factors Affecting Foreign Direct Investment Decision in Malaysia
Page 77 of 157
consideration of this factor since sales is based on the country‟s demand. Thus,
this portrays as an indication for the government to refine the economic policy,
increasing the country‟s population income so as to increase the gross domestic
product of the country.
Inflation rate which turns out to be positively significant to the FDI inflows in
Malaysia did not came as a surprise as well. Srinivasan (2011) stated that higher
inflation rate means higher price level of product. And this would attract investors
who aim for higher profit with the thoughts of higher expected level of profit
return. Therefore, Bank Negara Malaysia and the government need to plan
appropriately for the fiscal or monetary policy so as to control the inflation rate
that might attract investors‟ behavior.
The study also discovered that China foreign direct investment inflows are
positively related to Malaysia FDI inflows. According to Chantasasawat, Fung,
Iizaka, and Siu (2004), China‟s low cost of resources is the reason many
foreigners invest and demand for it. And this drastically increasing demand of
resources has led to China‟s needs for more mineral to fulfill the market need.
Malaysia which is one of the developing countries with mineral resources then
becomes the place for foreign investors to invest and bring mineral to China. This
means governments of Malaysia need to discover more low cost resources so as
improve the quality of infrastructure to attract potential investors. Besides,
Malaysia also needs to keep good diplomatic relation with China as it is beneficial.
Lastly, the study showed official real exchange rate is significant but negatively
related to Malaysia FDI inflows. When the exchange rate of Malaysia per
US$ dollar increases, the amount of money foreigners need to use in exchange for
a certain amount of Ringgit Malaysia is lesser. Therefore, investment in Malaysia
will become more worthy as higher profit can be earn when the exchange rate
becomes higher. It is important for Bank Negara Malaysia to set up an ideal
official real exchange rate to attract more FDI inflow to Malaysia.
Factors Affecting Foreign Direct Investment Decision in Malaysia
Page 78 of 157
5.4 Limitations of the Study
The very first limitation of the study is the sample size of the research which is too
small with only 29 years. Annual data from year 1982 – 2010 was obtained to run
the model, however, the data is considered insufficient as the minimum
requirement is 30 observations. The reason researchers weren‟t able to get 30
years data was because China FDI inflows weren‟t available before the year 1982.
Secondly, hypothesis testing is inappropriate to be used in detecting
heteroscedasticity and autocorrelation problems. This is because the sample size
did not for the very least have 30 observations. For this reason, researchers use the
informal way which is graphical method to detect the heteroscedasticity and
autocorrelation problems. However, graphical method is a hard way to detect both
the problems because sometimes those problems are not obvious and subjective.
In addition, researchers will not be able to know the degree of heteroscedasticity
and autocorrelation problems from the graph. As a result, graphical method is
deemed an inappropriate method to detect the problems since it does not provide
any concrete result on the severity of the heteroscedasticity and autocorrelation
problems of the models.
Thirdly, the original model has multicollinearity problem so researchers weren‟t
able to run the model as a whole and interpret its result. Instead, researchers split
the model into 2 models and interpreted from there. Fourthly, even though
multicollinearity problem was solved, researchers still couldn‟t get the best result
due to heteroscedasticity and autocorrelation problems. Researchers were
incapable of solving both the heteroscedasticity and autocorrelation problem as
graphical method does not provide a concrete result of the heteroscedasticity and
autocorrelation problems in the model. In addition, the problems were way too
serious and not within the researchers‟ knowledge to solve it. The limitations are
acknowledged for it does not detract from the significance of findings but merely
provide platforms for future research.
Factors Affecting Foreign Direct Investment Decision in Malaysia
Page 79 of 157
5.5 Recommendations for Future Research
Since sample size is the main root of the problems, it is highly recommended that
next researchers who are interested in further studying this paper should increase
the sample size to more than 30 observations. Researchers may use monthly,
quarterly or semiannual data instead of using annual data. This is because the
bigger the sample size, the lower the probability of having multicollinearity,
heteroscedasticity and autocorrelation problems. This will prevents the needs to
split the model but run it as a whole instead. Other than that, formal method like
hypothesis testing will be able to be applied on the detection of heteroscedasticity
and autocorrelation problems. Hypothesis testing will provides researchers with
better results in detecting the heteroscedasticity and autocorrelation problems.
And it will be made clear to researchers the severity of the problems, allowing
them to carry out the appropriate steps and solutions in solving the problems for
the best result.
The usage of annual data has always been bound with a higher chance of having
heteroscedasticity problem, so when using low frequency data like such, it is
recommended to increase the sample size. This will reduce the data frequency,
and hence, minimize the chances of getting heteroscedasticity problem. Besides,
future researchers are also advise to use other indicators for the independent
variable – quality of infrastructure - instead of the telephone line (per 100 people).
This is because telephone line (per 100 people) is not a good indicator for quality
of infrastructure. Last but not least, replacement of insignificant variable with
other relevant variables or adding in new variables like statutory corporate tax rate
and financial development will further improve the model. Or researchers may use
other methods such as generalized autoregressive conditional heteroscedasticity
(GRACH) method to run the data instead of multiple linear regression method.
Factors Affecting Foreign Direct Investment Decision in Malaysia
Page 80 of 157
5.6 Conclusion
In conclusion, this paper proved that market size, economic growth, exchange rate,
trade openness, inflation rate and China FDI inflows are significant in determining
FDI inflows of Malaysia. Conversely, quality of infrastructure is determined as an
insignificant variable towards the Malaysia FDI inflows. All the results are
consistent and supported by the past research papers.
The results of this study can be a guideline and provide insight to policymakers
such as government and Bank Negara Malaysia in determining the ways to attract
more foreign direct investment inflow to Malaysia as foreign direct investment
inflows act as an important tool to enhance the economy of one‟s country. Besides,
this paper also assists practitioners such as investors and businessmen more
effectively in guiding and supporting the decision- making process either on
expanding markets or investment path.
Factors Affecting Foreign Direct Investment Decision in Malaysia
Page 81 of 157
REFERENCES
Abdul Rahim, A.S. (2006). The changing role of FDI in the Malaysia economy-
an assessment. Retrieved May 12, 2012, from
http://www.facebook.com/l.php?u=http%3A%2F%2Feconomics.dstcentre.com
%2FThe%2520Changing%2520Role%2520Of%2520FDI%2520In%2520The
%2520Malaysian%2520Economy%2520By%2520Azmi%2520Shahrin.pdf&h
=HAQGYNkFt.
Addison, T. & Heshmati, A. (2003). The new global determinants of FDI flows to
developing countries: The importance of ICT and democratization. UNU World
Institute for Development Economics Research, Helsinki.
Ali, S. & Guo, W. (2005). Determinants of FDI in China. Journal of Global
Business and Technology, 1(2), 21-33.
Ang, J. B. (2008). Determinants of foreign direct investment in Malaysia. Journal
of Policy Modeling, 30, 185-189.
Aqeel, A. & Nishat, M. (2004). The determinants of foreign direct investment in
Pakistan. The Pakistan Development Review, 43(4), 651-664.
Artige, L. & Nicolini, R. (2005). Evidence on the determinants of foreign direct
investment: The case of three European regions. UFAE and IAE Working
papers, No. 655.05.
Asiedu, E. (2002). On the determinants of foreign direct investment to developing
countries: Is Africa different. World Development, 30(1), 107-119.
Athukorala, P. & Waglé, S. (2011). Foreign direct investment in Southeast Asia:
Is Malaysia falling behind. ASEAN Economic Bulletin, 28(2), 115-133.
Awan, M. Z., Khan, B., & Zaman, K. U. (2011). Economic determinants of
foreign direct investment (FDI) in commodity producing sector: A case study
of Pakistan. African Journal of Business Management, 5(2), 537-545.
Factors Affecting Foreign Direct Investment Decision in Malaysia
Page 82 of 157
Azam, M. (2010). Economic determinants of foreign direct investment in Armenia,
Kyrgyz Republic, and Turkmenistan: Theory and evidence. Eurasian Journal
of Business and Economics, 3(6), 27-40.
Barrell, R. & Pain, N. (1996). An econometric analysis of U.S. foreign direct
investment. The Review of Economics and Statistics, 78(2), 200-207.
Benacek, V., Gronicki, M., Holland, D., & Sass, M. (2000). The determinants and
impact of foreign direct investment in Central and Eastern Europe. Journal of
United Nations, 9(3), 163-212.
Bevan, A. & Estrin, S. (2004). The determinants of foreign direct investment into
European transition economies. Journal of Comparative Economics, 32, 775-
787.
Busse, M. & Hefeker, C. (2007). Political risk, institutions and foreign direct
investment. European Journal of Political Economy, 23(2), 397-415.
Campa, J. M. (1993). Entry by foreign firms in the United States under exchange
rate uncertainty. The Review of Economics and Statistics, 75(4), 614-622.
Chakraborty, C. & Basu, P. (2002). Foreign direct investment and growth in India:
A cointegration approach. Applied Economics, 34, 1061-1073.
Chantasasawat, B., Fung, K. C., Iizaka, H., & Siu, A. (2010). FDI flows to Latin
America, East and Southeast Asia, and China: Substitutes or complements.
Review of Development Economics, 14(3), 533-546.
Chantasasawat, B., Fung, K.C., Iizaka, H., & Siu, A. (2004). The giant sucking
sound: Is China diverting foreign direct investment from other Asian
economies. Asian Economic Papers, 3(3), 122-144.
Choe, J. I. (2003). Do foreign direct investment and gross domestic investment
promote economic growth. Review of Development Economics, 7(1), 44-57.
Demirhan, E. & Masca, M. (2008). Determinants of foreign direct investment
flows to developing countries: A cross-sectional analysis. Prague Economic
Papers, 4, 356-369.
Factors Affecting Foreign Direct Investment Decision in Malaysia
Page 83 of 157
Dunning, J.H. (1995). Reappraising the eclectic paradigm in an age of alliance
capitalism. Journal of International Business Studies, 26(3), 461-491.
Eichengreen, B. & Tong, H. (2006). Fear of China. Journal of Asian Economics,
17, 226-240.
Eichengreen, B. & Tong, H. (2007). Is China‟s FDI coming at the expense of
other countries? Journal of the Japanese and International Economies, 21(2),
153-172.
Fan, P.H., Morck, R., Xu, L.C., & Yeung, B. (2007). Does „good government‟
draw foreign capote: Explaining China‟s exceptional foreign direct investment
inflow. World Bank Policy Research Working Paper. Retrieved 12 May, 2012
from http://elibrary.worldbank.org/content/workingpaper/10.1596/1813-9450-4206
Froot, K. A. & Stein, J.C. (1991). Exchange rates and foreign direct investment:
An imperfect capital markets approach. Quarterly Journal of Economics,
106(4), 1191-1217.
Gao, T. (2005). Foreign direct investment and growth under economic integration.
Journal of international economics, 67, 157-174.
Globerman, S. & Shapiro, D. (2003). Governance infrastructure and US foreign
direct investment. Journal of International Business Studies, 34(1), 19-39.
Goodspeed, T., Martinez-Vazquez, J., & Zhang, L. (2006). Are other government
policies more important than taxation in attracting FDI. Andrew Young School
of Policy Studies, Working Paper 06-28.
Gujarati, D.N. & Porter, D.C. (2009). Basic econometrics. (5th ed.). Boston, MA:
McGraw-Hill/Irwin.
Guo, J. Q. & Trivedi, P. K. (2002). Firm-specific assets and the link between
exchange rates and Japanese foreign direct investment in the United States: A
re-examination. The Japanese Economic Review, 53(3), 337-349.
Factors Affecting Foreign Direct Investment Decision in Malaysia
Page 84 of 157
Hansen, H. & Rand, J. (2006). On the causal links between FDI and growth in
developing countries. The World Economy, 29(1), 21-41.
Hara, M. & Razafimahefa, I. F. (2005). The determinants of foreign direct
investments into Japan. Kobe University Economic Review, 51, 21-34.
Kahai, S. K. (2011). Traditional and non-traditional determinants of foreign direct
investment in developing countries. Journal of Applied Business Research,
20(1), 43-50.
Karimi, M.S., Yusop, Z., & Law, S.H. (2010). Location decision for foreign direct
investment in ASEAN countries: A TOPSIS approach. International Research
Journal of Finance and Economics, (36), 2010.
Kiyota, K. & Urata, S. (2004). Exchange rate, exchange rate volatility and foreign
direct investment. The World Economy, 27(10), 1501-1536.
Klein, M.W. & Rosengren, E. (1994). The real exchange rate and foreign direct
investment in the United States: Relative wealth vs. relative wage effects.
Journal of International Economics, 36(3), 373-379.
Kolstad, I. & Villanger, E. (2008). Determinants of foreign direct investment in
services. European Journal of Political Economy, 24(2), 518-533.
Larget, B. (2007, February 20). Model Selection and Multicollinearity. pp. 1-4.
Lim, S.H. (2008). How investment promotion affects attracting foreign direct
investment: Analytical argument and empirical analyses. International
Business Review, 17, 39-53.
Loree, D.W. & Guisinger, S. (1995). Policy and non-policy determinant of US
equity foreign direct investment. Journal of Business Studies, 26(2), 281-299.
Lucey, T. (2002). Quantitative techniques. Cheriton, NW: Cengage Learning
EMEA.
Factors Affecting Foreign Direct Investment Decision in Malaysia
Page 85 of 157
Luiz, J. M. & Charalambous, H. (2009). Factors influencing foreign direct
investment of South African financial services firms in Sub-Saharan Africa.
International Business Review, 18, 305-317.
McDaniel, C. & Gates, R. (2010). Marketing Research. (8th ed.). Hoboken, NJ:
John Wiley & Sons.
Medvedev, D. (2012). Beyond trade: The impact of preferential trade agreements
on FDI inflows. World Development, 40(1), 49-61.
Mengistu, A.A. & Adhikary, B. K. (2011). Does good governance matter for FDI
inflows? Evidence from Asian economies. Asia Pacific Business Review, 17(3),
281-299.
Moffett, M.H., Stonehill, A.I. & Eitheman, D.K. (2009). Fundamentals of
Multinational Finance. (3th ed.). Boston: Addison Wesley.
Moosa, I. A. & Cardak, B. A. (2006). The determinants of foreign direct
investment: An extreme bounds analysis. Journal of Multinational Financial
Management, 16(2), 199-211.
Moosa, I. A. (2002). Foreign direct investment: theory, evidence, and practice.
New York, NY: Palgave Macmillan.
Morisset, J. (2000). Foreign direct investment in Africa policies also matter.
Transnational Corporations, 9(2), 281-289.
Motulsky, H. (2002). Multicollinearity in multiple regression. Retrieved March 1,
2012, from GraphPad.com:
http://www.graphpad.com/articles/Multicollinearity.htm
Nurudeen, A. & Wafure, O.G. (2010). Determinants of foreign direct investment
in Nigeria: An empirical analysis. Global Journal of Human Social Science,
10(1), 26-34.
Nurudeen, A. , Wafure, O. G., & Auta, E. M. (2011). Determinants of foreign
direct investment: The case of Nigeria. The IUP Journal of Monetary
Economics, 9(3), 50-68.
Factors Affecting Foreign Direct Investment Decision in Malaysia
Page 86 of 157
Quazi, R. (2007). Economic freedom and foreign direct investment in East Asia.
Journal of the Asia Pacific Economy, 12(3), 329-344.
Quer, D. & Claver, E. (2007). Determinants of Spanish foreign direct investment
in Morocco. Emerging Markets Finance and Trade, 43(2), 19-32.
Rehman, C. A., Ilyas, M., Alam, H. M., & Akram, M. (2011). The impact of
infrastructure on foreign direct investment: The case of Pakistan. International
Journal of Business and Management, 6(5), 268-276.
Renfro, C. G. (2004). A compendium of existing econometric software packages.
Journal of Economic and Social Measurement , 29, 359-409.
Rodriguez, X.A. & Pallas, J. (2008). Determinants of foreign direct investment in
Spain. Applied Economics, 40, 2443-2450.
Salike, N. (2010). Investigating of the “China effect” on crowding out Japanese
FDI: An industry-level analysis. China Economic Review, 21(4), 582-597.
Sawkut, R., Boopen, S., Taruna, R., & Vinesh, S. (2009). Determinants of FDI:
Lessons from African economies. Journal of Applied Business and Economics,
9(1), 293-308.
Seim, L. T. (2009). FDI and openness: Differences in response across countries.
Chr. Michelsen Institute, Working Paper.
Shamsuddin, A.F.M. (1994). Economic determinants of foreign direct investment
in less developed countries. The Pakistan Development Review, 33(1), 41-51.
Sharma, K. & Bandara, Y. (2010). Trends, patterns and determinants of Australian
foreign direct investment. Journal of Economic Issues, 64(3), 661-676.
Srinivasan, P. (2011). Determinants of foreign direct investment in SAARC
nations: An econometric investigation. IUP Journal of Managerial Economics,
9(3), 26-47.
Factors Affecting Foreign Direct Investment Decision in Malaysia
Page 87 of 157
Startz, R. (2007). Eviews illustrated for version 7. Quantitative Micro Software .
Sukamolson, S. (2005). Fundamentals of quantitative research. Retrieved March
3, 2012, from http://www.culi.chula.ac.th/e-
Journal/bod/Suphat%20Sukamolson.pdf
The economic watch. (2010). Definition of foreign direct investment (fdi).
Retrieved March 3, 2012, from http://www.economywatch.com/foreign-direct-
investment/definition.html
Trevino, L. J. & Mixon Jr, F.G. (2004). Strategic factors affecting foreign direct
investment decisions by multi-national enterprises in Latin America. Journal of
World Business, 39, 233-243.
Vadlamannati, K. C., Tamazian, A., & Irala, L. R. (2009). Determinants of foreign
direct investment and volatility in South East Asian economies. Journal of the
Asia Pacific Economy, 14(3), 246-261.
Vijayakumar, N., Sridharan, P., & Rao, K.C.S. (2010). Determinants of FDI in
BRICS countries: A panel analysis. Int. Journal of Business Science and
Applied Management, 5(3), 1-13.
Wang, C.G., Wei, Y.Q., & Liu, X.M. (2007). Does China rival its neighbouring
economies for inward FDI? Transnational Corporations, 16(3), 35-60.
Wheeler, D. & Mody, A. (1992). International investment location decisions: The
case of U.S. firms. Journal of International Economics, 33, 57-76.
Wong, H.K. & Jomo, K.S. (2005). Before the storm: The impact of foreign capital
inflows on the Malaysian economy, 1966-1996. Journal of the Asia Pacific
Economy, 10(1), 56-69.
Zhang, H.L. (2001). Does foreign direct investment promote economic growth?
Evidence from East Asian and Latin America. Comtemporary Economic Policy,
19(2), 175-185.
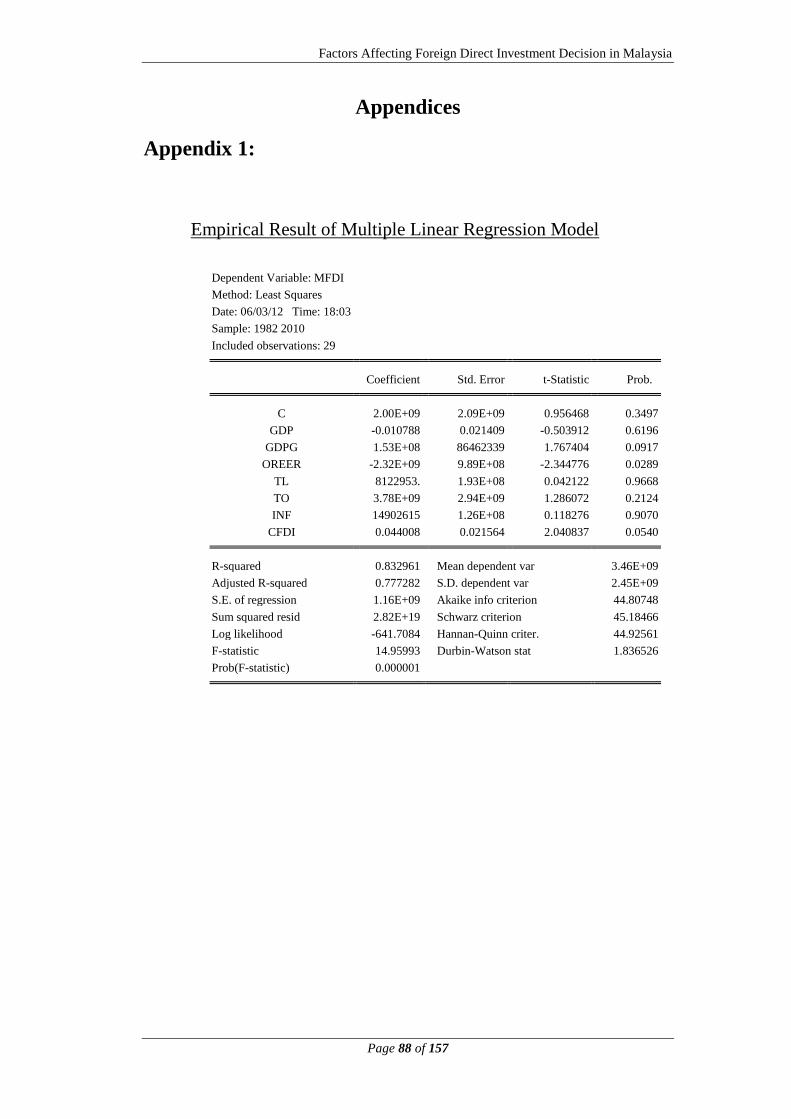
Factors Affecting Foreign Direct Investment Decision in Malaysia
Page 88 of 157
Appendices
Appendix 1:
Empirical Result of Multiple Linear Regression Model
Dependent Variable: MFDI
Method: Least Squares
Date: 06/03/12 Time: 18:03
Sample: 1982 2010
Included observations: 29
Coefficient Std. Error t-Statistic Prob.
C 2.00E+09 2.09E+09 0.956468 0.3497
GDP -0.010788 0.021409 -0.503912 0.6196
GDPG 1.53E+08 86462339 1.767404 0.0917
OREER -2.32E+09 9.89E+08 -2.344776 0.0289
TL 8122953. 1.93E+08 0.042122 0.9668
TO 3.78E+09 2.94E+09 1.286072 0.2124
INF 14902615 1.26E+08 0.118276 0.9070
CFDI 0.044008 0.021564 2.040837 0.0540
R-squared 0.832961 Mean dependent var 3.46E+09
Adjusted R-squared 0.777282 S.D. dependent var 2.45E+09
S.E. of regression 1.16E+09 Akaike info criterion 44.80748
Sum squared resid 2.82E+19 Schwarz criterion 45.18466
Log likelihood -641.7084 Hannan-Quinn criter. 44.92561
F-statistic 14.95993 Durbin-Watson stat 1.836526
Prob(F-statistic) 0.000001
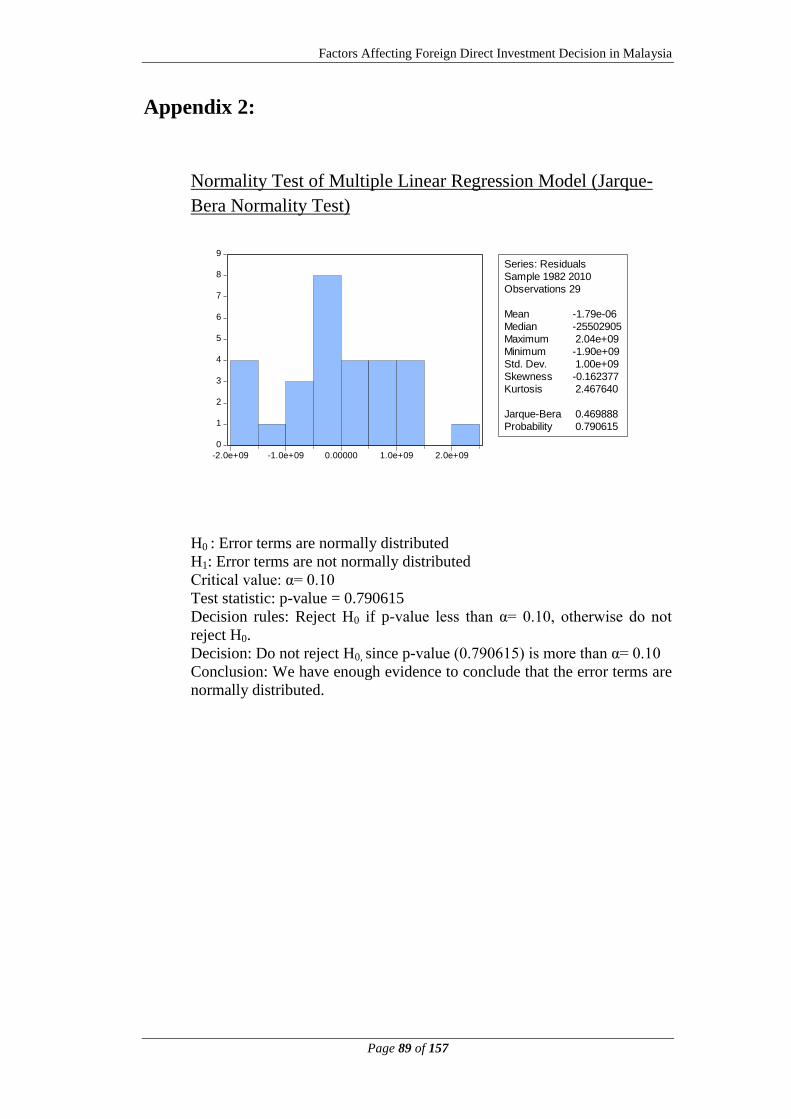
Factors Affecting Foreign Direct Investment Decision in Malaysia
Page 89 of 157
Appendix 2:
Normality Test of Multiple Linear Regression Model (Jarque-
Bera Normality Test)
H0 : Error terms are normally distributed
H1: Error terms are not normally distributed
Critical value: α= 0.10
Test statistic: p-value = 0.790615
Decision rules: Reject H0 if p-value less than α= 0.10, otherwise do not
reject H0.
Decision: Do not reject H0, since p-value (0.790615) is more than α= 0.10
Conclusion: We have enough evidence to conclude that the error terms are
normally distributed.
0
1
2
3
4
5
6
7
8
9
-2.0e+09 -1.0e+09 0.00000 1.0e+09 2.0e+09
Series: Residuals
Sample 1982 2010
Observations 29
Mean -1.79e-06
Median -25502905
Maximum 2.04e+09
Minimum -1.90e+09
Std. Dev. 1.00e+09
Skewness -0.162377
Kurtosis 2.467640
Jarque-Bera 0.469888
Probability 0.790615
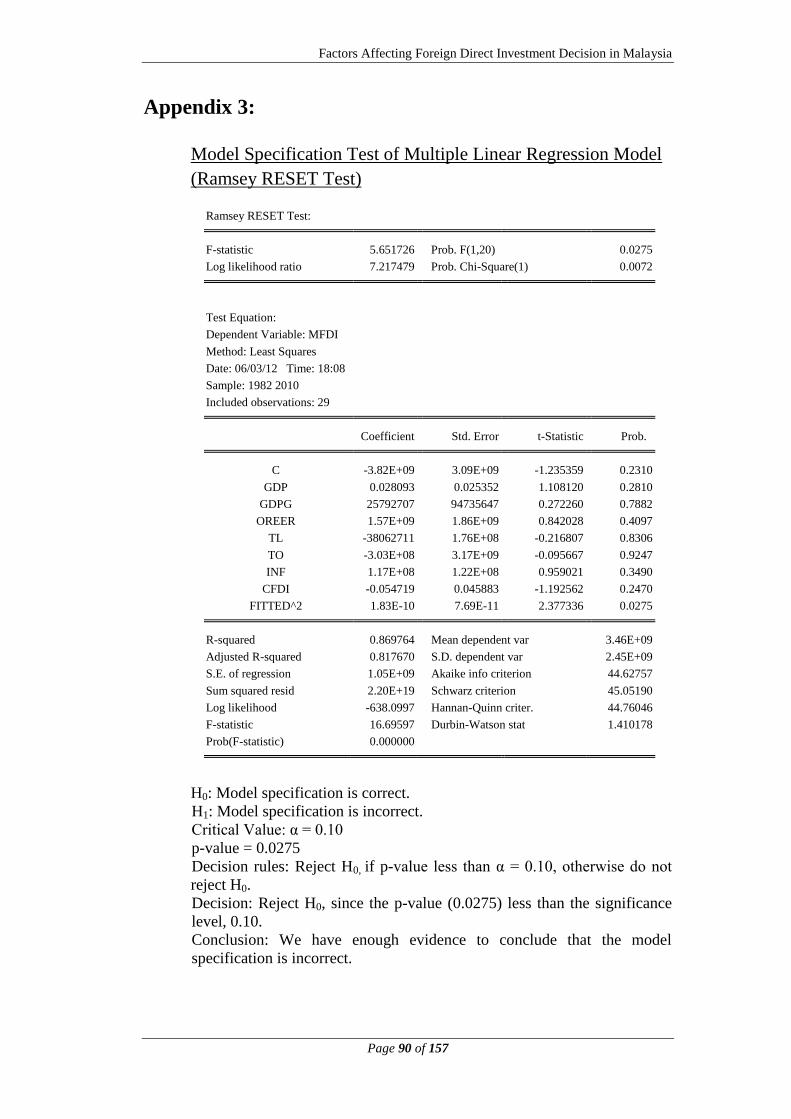
Factors Affecting Foreign Direct Investment Decision in Malaysia
Page 90 of 157
Appendix 3:
Model Specification Test of Multiple Linear Regression Model
(Ramsey RESET Test)
Ramsey RESET Test:
F-statistic 5.651726 Prob. F(1,20) 0.0275
Log likelihood ratio 7.217479 Prob. Chi-Square(1) 0.0072
Test Equation:
Dependent Variable: MFDI
Method: Least Squares
Date: 06/03/12 Time: 18:08
Sample: 1982 2010
Included observations: 29
Coefficient Std. Error t-Statistic Prob.
C -3.82E+09 3.09E+09 -1.235359 0.2310
GDP 0.028093 0.025352 1.108120 0.2810
GDPG 25792707 94735647 0.272260 0.7882
OREER 1.57E+09 1.86E+09 0.842028 0.4097
TL -38062711 1.76E+08 -0.216807 0.8306
TO -3.03E+08 3.17E+09 -0.095667 0.9247
INF 1.17E+08 1.22E+08 0.959021 0.3490
CFDI -0.054719 0.045883 -1.192562 0.2470
FITTED^2 1.83E-10 7.69E-11 2.377336 0.0275
R-squared 0.869764 Mean dependent var 3.46E+09
Adjusted R-squared 0.817670 S.D. dependent var 2.45E+09
S.E. of regression 1.05E+09 Akaike info criterion 44.62757
Sum squared resid 2.20E+19 Schwarz criterion 45.05190
Log likelihood -638.0997 Hannan-Quinn criter. 44.76046
F-statistic 16.69597 Durbin-Watson stat 1.410178
Prob(F-statistic) 0.000000
H0: Model specification is correct.
H1: Model specification is incorrect.
Critical Value: α = 0.10
p-value = 0.0275
Decision rules: Reject H0, if p-value less than α = 0.10, otherwise do not
reject H0.
Decision: Reject H0, since the p-value (0.0275) less than the significance
level, 0.10.
Conclusion: We have enough evidence to conclude that the model
specification is incorrect.
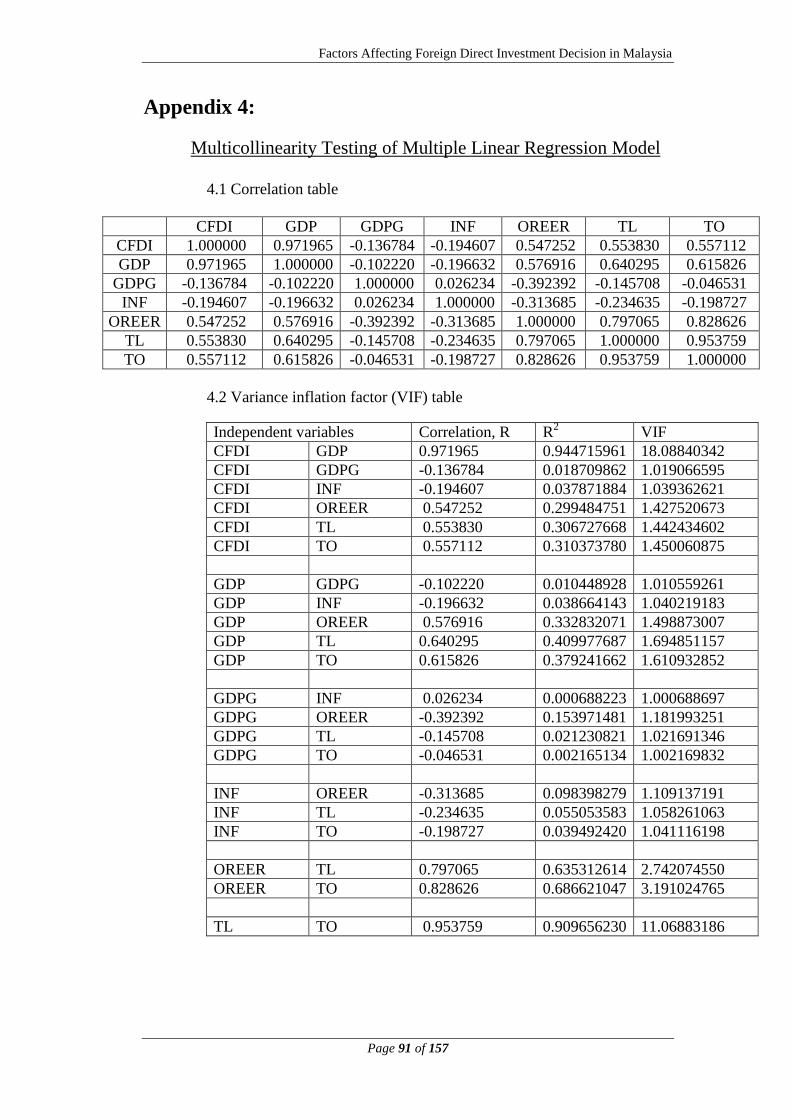
Factors Affecting Foreign Direct Investment Decision in Malaysia
Page 91 of 157
Appendix 4:
Multicollinearity Testing of Multiple Linear Regression Model
4.1 Correlation table
CFDI GDP GDPG INF OREER TL TO
CFDI 1.000000 0.971965 -0.136784 -0.194607 0.547252 0.553830 0.557112
GDP 0.971965 1.000000 -0.102220 -0.196632 0.576916 0.640295 0.615826
GDPG -0.136784 -0.102220 1.000000 0.026234 -0.392392 -0.145708 -0.046531
INF -0.194607 -0.196632 0.026234 1.000000 -0.313685 -0.234635 -0.198727
OREER 0.547252 0.576916 -0.392392 -0.313685 1.000000 0.797065 0.828626
TL 0.553830 0.640295 -0.145708 -0.234635 0.797065 1.000000 0.953759
TO 0.557112 0.615826 -0.046531 -0.198727 0.828626 0.953759 1.000000
4.2 Variance inflation factor (VIF) table
Independent variables Correlation, R R2 VIF
CFDI GDP 0.971965 0.944715961 18.08840342
CFDI GDPG -0.136784 0.018709862 1.019066595
CFDI INF -0.194607 0.037871884 1.039362621
CFDI OREER 0.547252 0.299484751 1.427520673
CFDI TL 0.553830 0.306727668 1.442434602
CFDI TO 0.557112 0.310373780 1.450060875
GDP GDPG -0.102220 0.010448928 1.010559261
GDP INF -0.196632 0.038664143 1.040219183
GDP OREER 0.576916 0.332832071 1.498873007
GDP TL 0.640295 0.409977687 1.694851157
GDP TO 0.615826 0.379241662 1.610932852
GDPG INF 0.026234 0.000688223 1.000688697
GDPG OREER -0.392392 0.153971481 1.181993251
GDPG TL -0.145708 0.021230821 1.021691346
GDPG TO -0.046531 0.002165134 1.002169832
INF OREER -0.313685 0.098398279 1.109137191
INF TL -0.234635 0.055053583 1.058261063
INF TO -0.198727 0.039492420 1.041116198
OREER TL 0.797065 0.635312614 2.742074550
OREER TO 0.828626 0.686621047 3.191024765
TL TO 0.953759 0.909656230 11.06883186
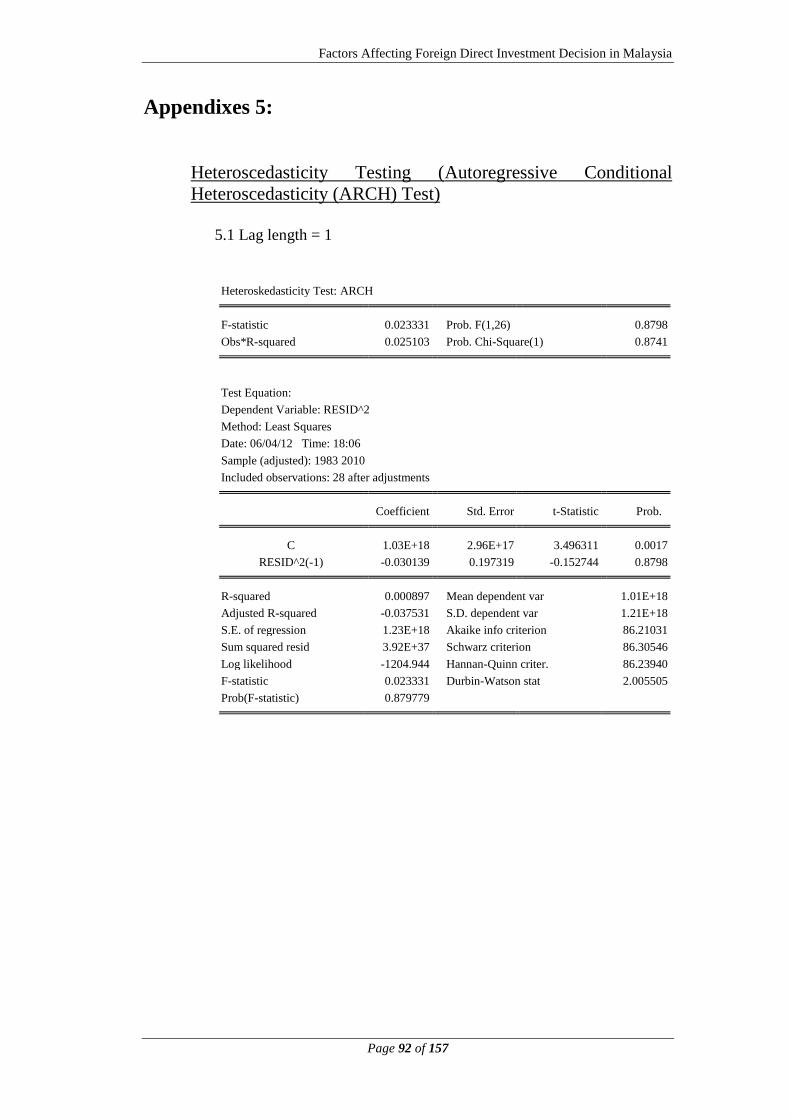
Factors Affecting Foreign Direct Investment Decision in Malaysia
Page 92 of 157
Appendixes 5:
Heteroscedasticity Testing (Autoregressive Conditional
Heteroscedasticity (ARCH) Test)
5.1 Lag length = 1
Heteroskedasticity Test: ARCH
F-statistic 0.023331 Prob. F(1,26) 0.8798
Obs*R-squared 0.025103 Prob. Chi-Square(1) 0.8741
Test Equation:
Dependent Variable: RESID^2
Method: Least Squares
Date: 06/04/12 Time: 18:06
Sample (adjusted): 1983 2010
Included observations: 28 after adjustments
Coefficient Std. Error t-Statistic Prob.
C 1.03E+18 2.96E+17 3.496311 0.0017
RESID^2(-1) -0.030139 0.197319 -0.152744 0.8798
R-squared 0.000897 Mean dependent var 1.01E+18
Adjusted R-squared -0.037531 S.D. dependent var 1.21E+18
S.E. of regression 1.23E+18 Akaike info criterion 86.21031
Sum squared resid 3.92E+37 Schwarz criterion 86.30546
Log likelihood -1204.944 Hannan-Quinn criter. 86.23940
F-statistic 0.023331 Durbin-Watson stat 2.005505
Prob(F-statistic) 0.879779
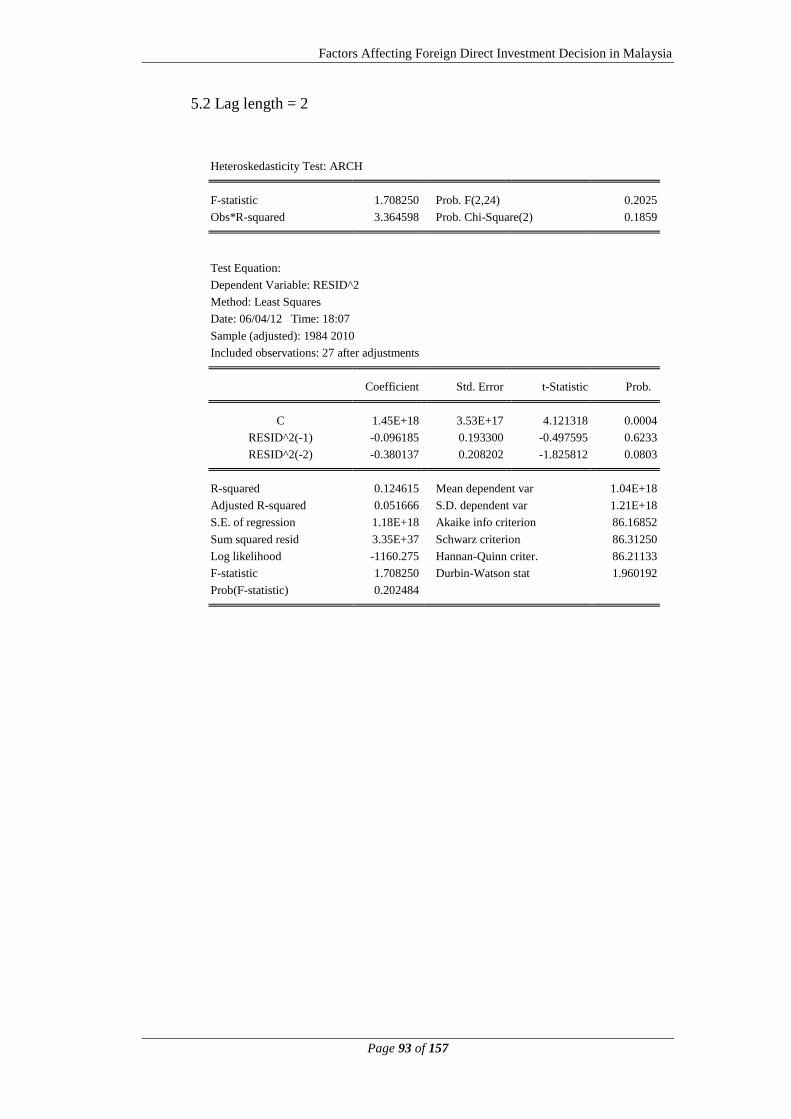
Factors Affecting Foreign Direct Investment Decision in Malaysia
Page 93 of 157
5.2 Lag length = 2
Heteroskedasticity Test: ARCH
F-statistic 1.708250 Prob. F(2,24) 0.2025
Obs*R-squared 3.364598 Prob. Chi-Square(2) 0.1859
Test Equation:
Dependent Variable: RESID^2
Method: Least Squares
Date: 06/04/12 Time: 18:07
Sample (adjusted): 1984 2010
Included observations: 27 after adjustments
Coefficient Std. Error t-Statistic Prob.
C 1.45E+18 3.53E+17 4.121318 0.0004
RESID^2(-1) -0.096185 0.193300 -0.497595 0.6233
RESID^2(-2) -0.380137 0.208202 -1.825812 0.0803
R-squared 0.124615 Mean dependent var 1.04E+18
Adjusted R-squared 0.051666 S.D. dependent var 1.21E+18
S.E. of regression 1.18E+18 Akaike info criterion 86.16852
Sum squared resid 3.35E+37 Schwarz criterion 86.31250
Log likelihood -1160.275 Hannan-Quinn criter. 86.21133
F-statistic 1.708250 Durbin-Watson stat 1.960192
Prob(F-statistic) 0.202484
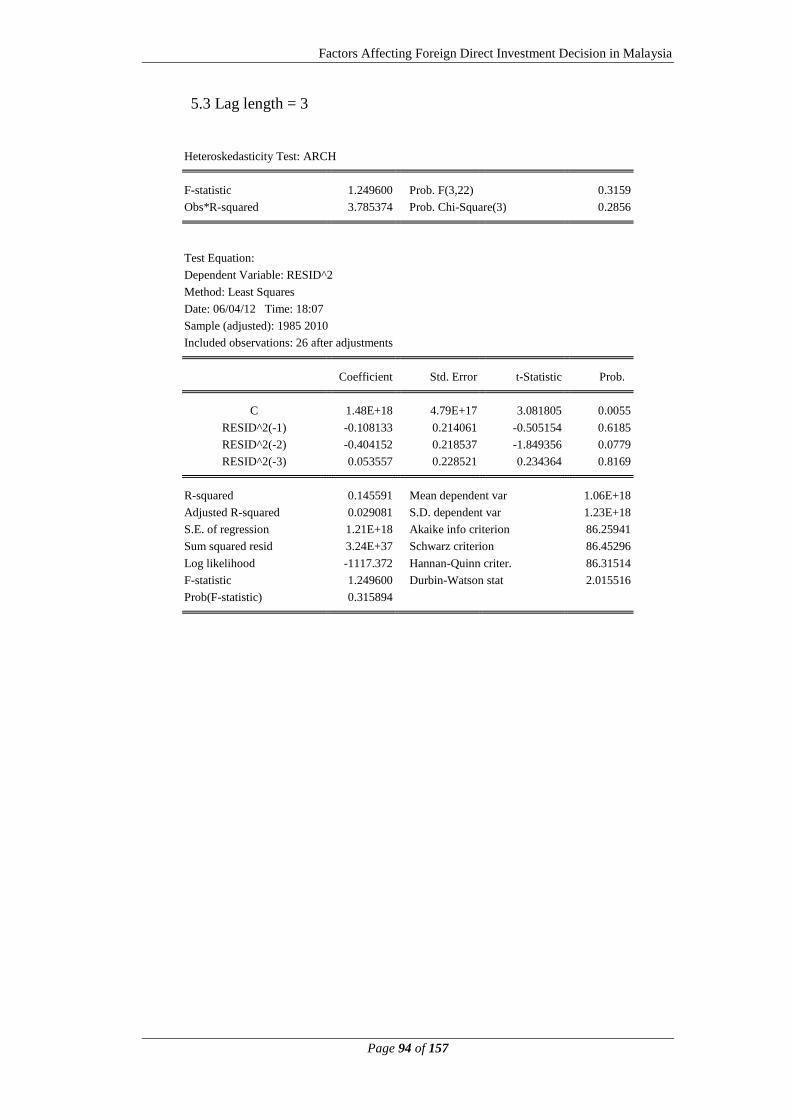
Factors Affecting Foreign Direct Investment Decision in Malaysia
Page 94 of 157
5.3 Lag length = 3
Heteroskedasticity Test: ARCH
F-statistic 1.249600 Prob. F(3,22) 0.3159
Obs*R-squared 3.785374 Prob. Chi-Square(3) 0.2856
Test Equation:
Dependent Variable: RESID^2
Method: Least Squares
Date: 06/04/12 Time: 18:07
Sample (adjusted): 1985 2010
Included observations: 26 after adjustments
Coefficient Std. Error t-Statistic Prob.
C 1.48E+18 4.79E+17 3.081805 0.0055
RESID^2(-1) -0.108133 0.214061 -0.505154 0.6185
RESID^2(-2) -0.404152 0.218537 -1.849356 0.0779
RESID^2(-3) 0.053557 0.228521 0.234364 0.8169
R-squared 0.145591 Mean dependent var 1.06E+18
Adjusted R-squared 0.029081 S.D. dependent var 1.23E+18
S.E. of regression 1.21E+18 Akaike info criterion 86.25941
Sum squared resid 3.24E+37 Schwarz criterion 86.45296
Log likelihood -1117.372 Hannan-Quinn criter. 86.31514
F-statistic 1.249600 Durbin-Watson stat 2.015516
Prob(F-statistic) 0.315894
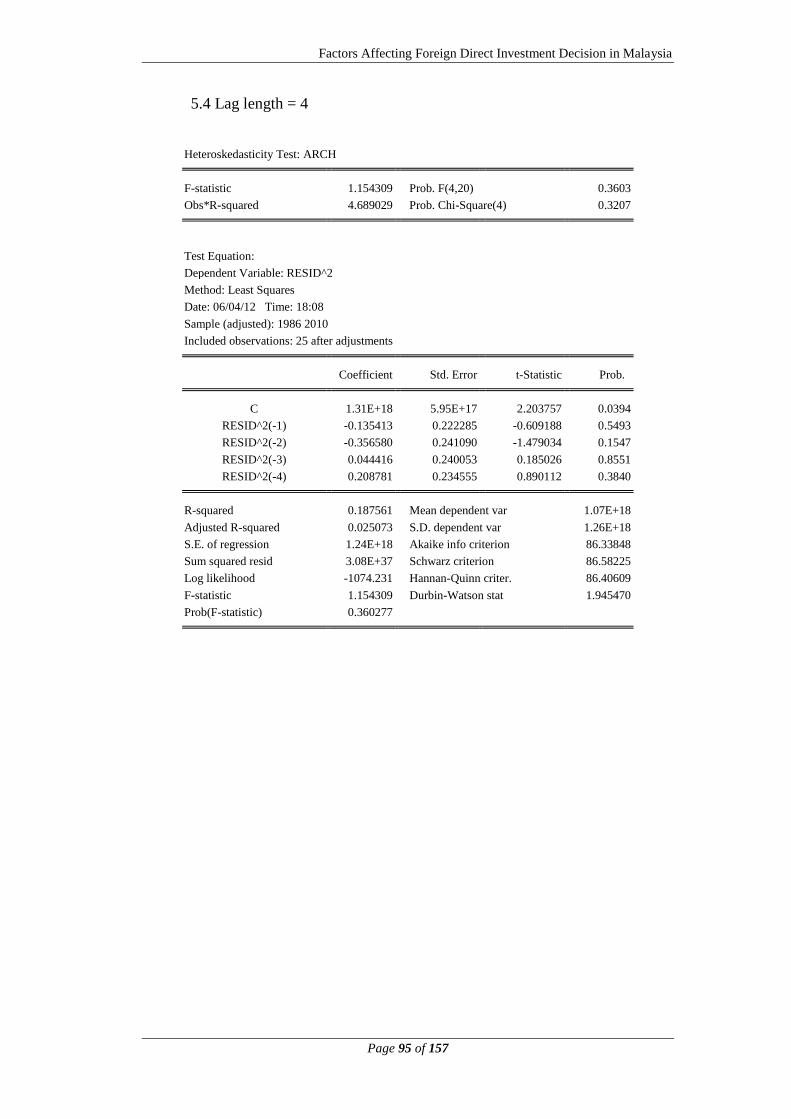
Factors Affecting Foreign Direct Investment Decision in Malaysia
Page 95 of 157
5.4 Lag length = 4
Heteroskedasticity Test: ARCH
F-statistic 1.154309 Prob. F(4,20) 0.3603
Obs*R-squared 4.689029 Prob. Chi-Square(4) 0.3207
Test Equation:
Dependent Variable: RESID^2
Method: Least Squares
Date: 06/04/12 Time: 18:08
Sample (adjusted): 1986 2010
Included observations: 25 after adjustments
Coefficient Std. Error t-Statistic Prob.
C 1.31E+18 5.95E+17 2.203757 0.0394
RESID^2(-1) -0.135413 0.222285 -0.609188 0.5493
RESID^2(-2) -0.356580 0.241090 -1.479034 0.1547
RESID^2(-3) 0.044416 0.240053 0.185026 0.8551
RESID^2(-4) 0.208781 0.234555 0.890112 0.3840
R-squared 0.187561 Mean dependent var 1.07E+18
Adjusted R-squared 0.025073 S.D. dependent var 1.26E+18
S.E. of regression 1.24E+18 Akaike info criterion 86.33848
Sum squared resid 3.08E+37 Schwarz criterion 86.58225
Log likelihood -1074.231 Hannan-Quinn criter. 86.40609
F-statistic 1.154309 Durbin-Watson stat 1.945470
Prob(F-statistic) 0.360277

Factors Affecting Foreign Direct Investment Decision in Malaysia
Page 96 of 157
5.5 Lag length = 5
Heteroskedasticity Test: ARCH
F-statistic 0.858482 Prob. F(5,18) 0.5273
Obs*R-squared 4.621205 Prob. Chi-Square(5) 0.4638
Test Equation:
Dependent Variable: RESID^2
Method: Least Squares
Date: 06/04/12 Time: 18:08
Sample (adjusted): 1987 2010
Included observations: 24 after adjustments
Coefficient Std. Error t-Statistic Prob.
C 1.50E+18 6.91E+17 2.163414 0.0442
RESID^2(-1) -0.140870 0.241419 -0.583511 0.5668
RESID^2(-2) -0.376745 0.259611 -1.451189 0.1639
RESID^2(-3) -0.005722 0.265627 -0.021543 0.9830
RESID^2(-4) 0.170954 0.250522 0.682391 0.5037
RESID^2(-5) -0.050662 0.262107 -0.193287 0.8489
R-squared 0.192550 Mean dependent var 1.11E+18
Adjusted R-squared -0.031741 S.D. dependent var 1.27E+18
S.E. of regression 1.29E+18 Akaike info criterion 86.45429
Sum squared resid 3.00E+37 Schwarz criterion 86.74881
Log likelihood -1031.452 Hannan-Quinn criter. 86.53243
F-statistic 0.858482 Durbin-Watson stat 1.957515
Prob(F-statistic) 0.527290
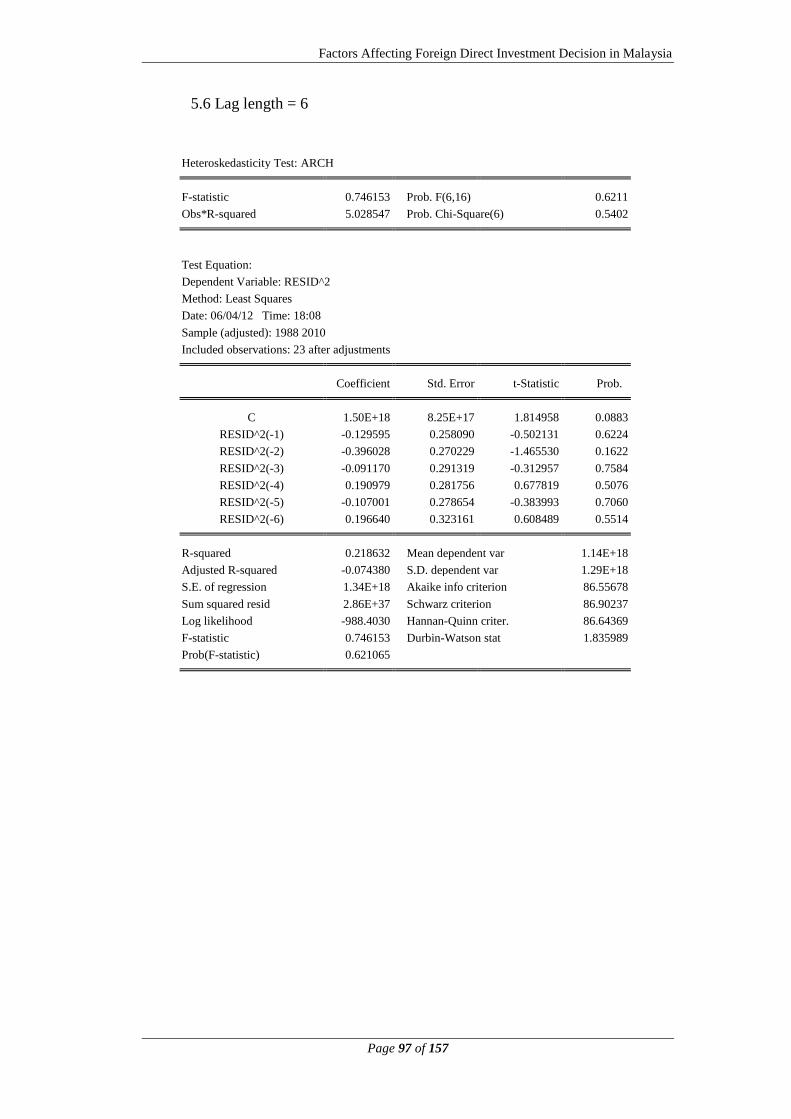
Factors Affecting Foreign Direct Investment Decision in Malaysia
Page 97 of 157
5.6 Lag length = 6
Heteroskedasticity Test: ARCH
F-statistic 0.746153 Prob. F(6,16) 0.6211
Obs*R-squared 5.028547 Prob. Chi-Square(6) 0.5402
Test Equation:
Dependent Variable: RESID^2
Method: Least Squares
Date: 06/04/12 Time: 18:08
Sample (adjusted): 1988 2010
Included observations: 23 after adjustments
Coefficient Std. Error t-Statistic Prob.
C 1.50E+18 8.25E+17 1.814958 0.0883
RESID^2(-1) -0.129595 0.258090 -0.502131 0.6224
RESID^2(-2) -0.396028 0.270229 -1.465530 0.1622
RESID^2(-3) -0.091170 0.291319 -0.312957 0.7584
RESID^2(-4) 0.190979 0.281756 0.677819 0.5076
RESID^2(-5) -0.107001 0.278654 -0.383993 0.7060
RESID^2(-6) 0.196640 0.323161 0.608489 0.5514
R-squared 0.218632 Mean dependent var 1.14E+18
Adjusted R-squared -0.074380 S.D. dependent var 1.29E+18
S.E. of regression 1.34E+18 Akaike info criterion 86.55678
Sum squared resid 2.86E+37 Schwarz criterion 86.90237
Log likelihood -988.4030 Hannan-Quinn criter. 86.64369
F-statistic 0.746153 Durbin-Watson stat 1.835989
Prob(F-statistic) 0.621065
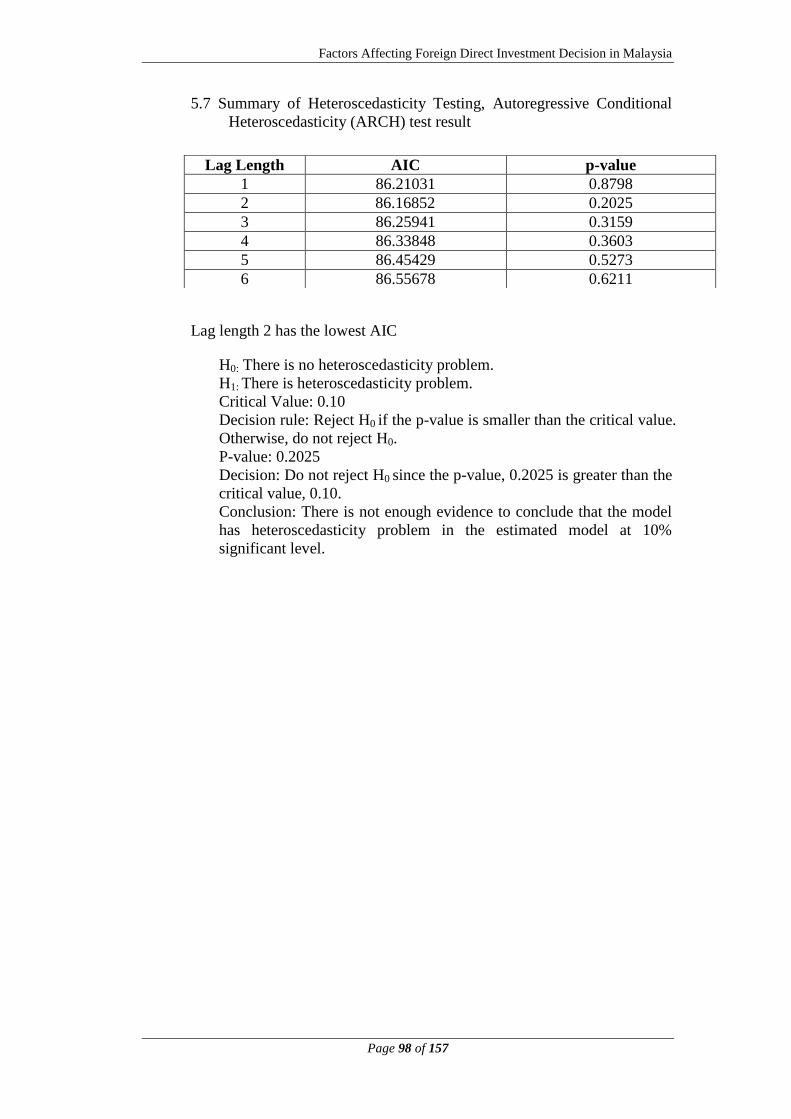
Factors Affecting Foreign Direct Investment Decision in Malaysia
Page 98 of 157
5.7 Summary of Heteroscedasticity Testing, Autoregressive Conditional
Heteroscedasticity (ARCH) test result
Lag length 2 has the lowest AIC
H0: There is no heteroscedasticity problem.
H1: There is heteroscedasticity problem.
Critical Value: 0.10
Decision rule: Reject H0 if the p-value is smaller than the critical value.
Otherwise, do not reject H0.
P-value: 0.2025
Decision: Do not reject H0 since the p-value, 0.2025 is greater than the
critical value, 0.10.
Conclusion: There is not enough evidence to conclude that the model
has heteroscedasticity problem in the estimated model at 10%
significant level.
Lag Length AIC p-value
1 86.21031 0.8798
2 86.16852 0.2025
3 86.25941 0.3159
4 86.33848 0.3603
5 86.45429 0.5273
6 86.55678 0.6211
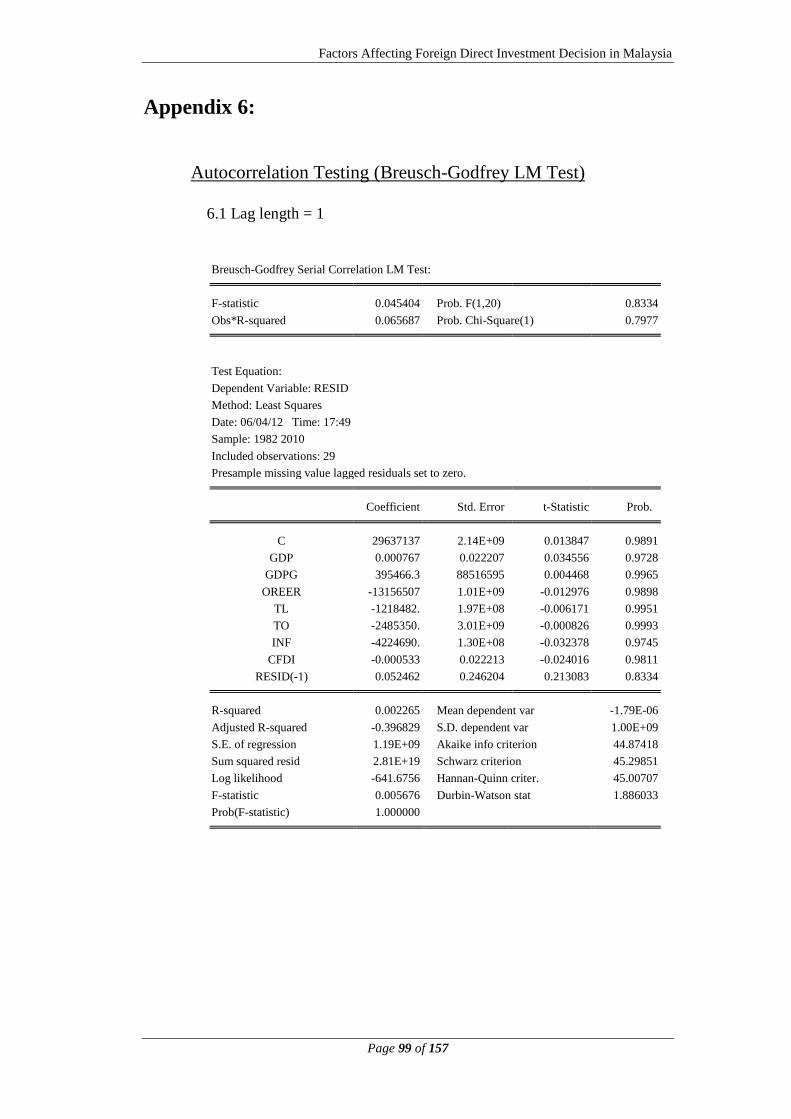
Factors Affecting Foreign Direct Investment Decision in Malaysia
Page 99 of 157
Appendix 6:
Autocorrelation Testing (Breusch-Godfrey LM Test)
6.1 Lag length = 1
Breusch-Godfrey Serial Correlation LM Test:
F-statistic 0.045404 Prob. F(1,20) 0.8334
Obs*R-squared 0.065687 Prob. Chi-Square(1) 0.7977
Test Equation:
Dependent Variable: RESID
Method: Least Squares
Date: 06/04/12 Time: 17:49
Sample: 1982 2010
Included observations: 29
Presample missing value lagged residuals set to zero.
Coefficient Std. Error t-Statistic Prob.
C 29637137 2.14E+09 0.013847 0.9891
GDP 0.000767 0.022207 0.034556 0.9728
GDPG 395466.3 88516595 0.004468 0.9965
OREER -13156507 1.01E+09 -0.012976 0.9898
TL -1218482. 1.97E+08 -0.006171 0.9951
TO -2485350. 3.01E+09 -0.000826 0.9993
INF -4224690. 1.30E+08 -0.032378 0.9745
CFDI -0.000533 0.022213 -0.024016 0.9811
RESID(-1) 0.052462 0.246204 0.213083 0.8334
R-squared 0.002265 Mean dependent var -1.79E-06
Adjusted R-squared -0.396829 S.D. dependent var 1.00E+09
S.E. of regression 1.19E+09 Akaike info criterion 44.87418
Sum squared resid 2.81E+19 Schwarz criterion 45.29851
Log likelihood -641.6756 Hannan-Quinn criter. 45.00707
F-statistic 0.005676 Durbin-Watson stat 1.886033
Prob(F-statistic) 1.000000
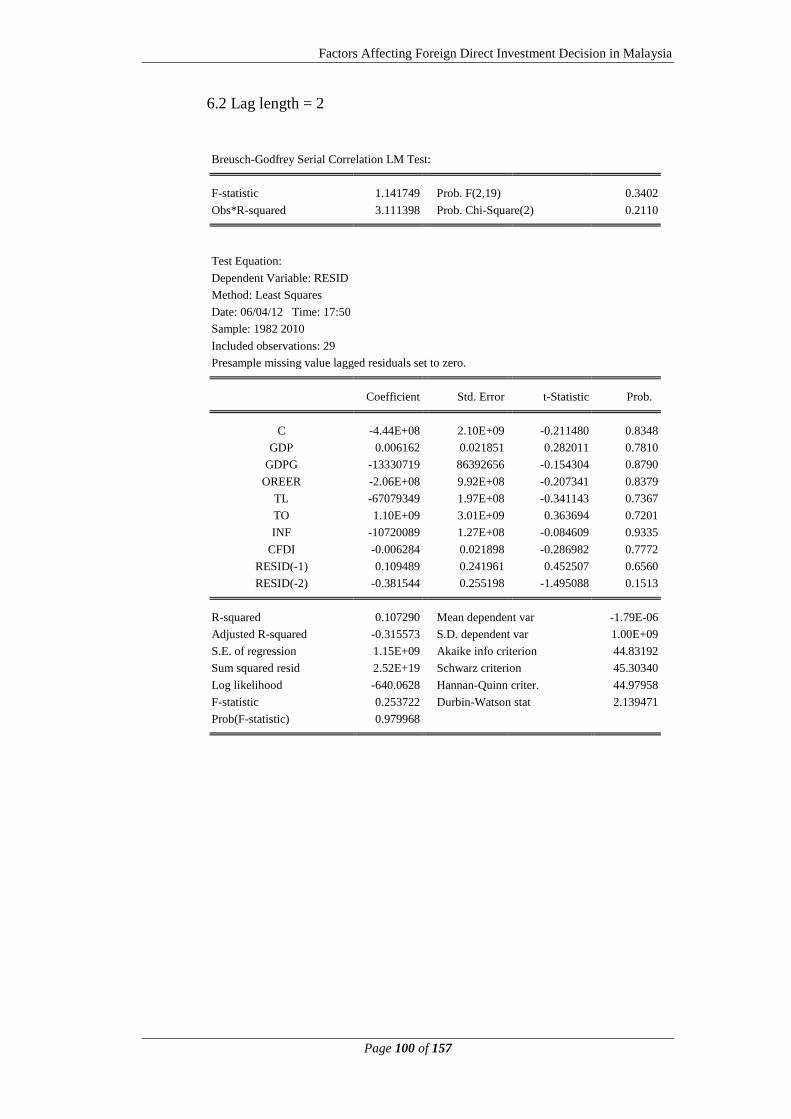
Factors Affecting Foreign Direct Investment Decision in Malaysia
Page 100 of 157
6.2 Lag length = 2
Breusch-Godfrey Serial Correlation LM Test:
F-statistic 1.141749 Prob. F(2,19) 0.3402
Obs*R-squared 3.111398 Prob. Chi-Square(2) 0.2110
Test Equation:
Dependent Variable: RESID
Method: Least Squares
Date: 06/04/12 Time: 17:50
Sample: 1982 2010
Included observations: 29
Presample missing value lagged residuals set to zero.
Coefficient Std. Error t-Statistic Prob.
C -4.44E+08 2.10E+09 -0.211480 0.8348
GDP 0.006162 0.021851 0.282011 0.7810
GDPG -13330719 86392656 -0.154304 0.8790
OREER -2.06E+08 9.92E+08 -0.207341 0.8379
TL -67079349 1.97E+08 -0.341143 0.7367
TO 1.10E+09 3.01E+09 0.363694 0.7201
INF -10720089 1.27E+08 -0.084609 0.9335
CFDI -0.006284 0.021898 -0.286982 0.7772
RESID(-1) 0.109489 0.241961 0.452507 0.6560
RESID(-2) -0.381544 0.255198 -1.495088 0.1513
R-squared 0.107290 Mean dependent var -1.79E-06
Adjusted R-squared -0.315573 S.D. dependent var 1.00E+09
S.E. of regression 1.15E+09 Akaike info criterion 44.83192
Sum squared resid 2.52E+19 Schwarz criterion 45.30340
Log likelihood -640.0628 Hannan-Quinn criter. 44.97958
F-statistic 0.253722 Durbin-Watson stat 2.139471
Prob(F-statistic) 0.979968
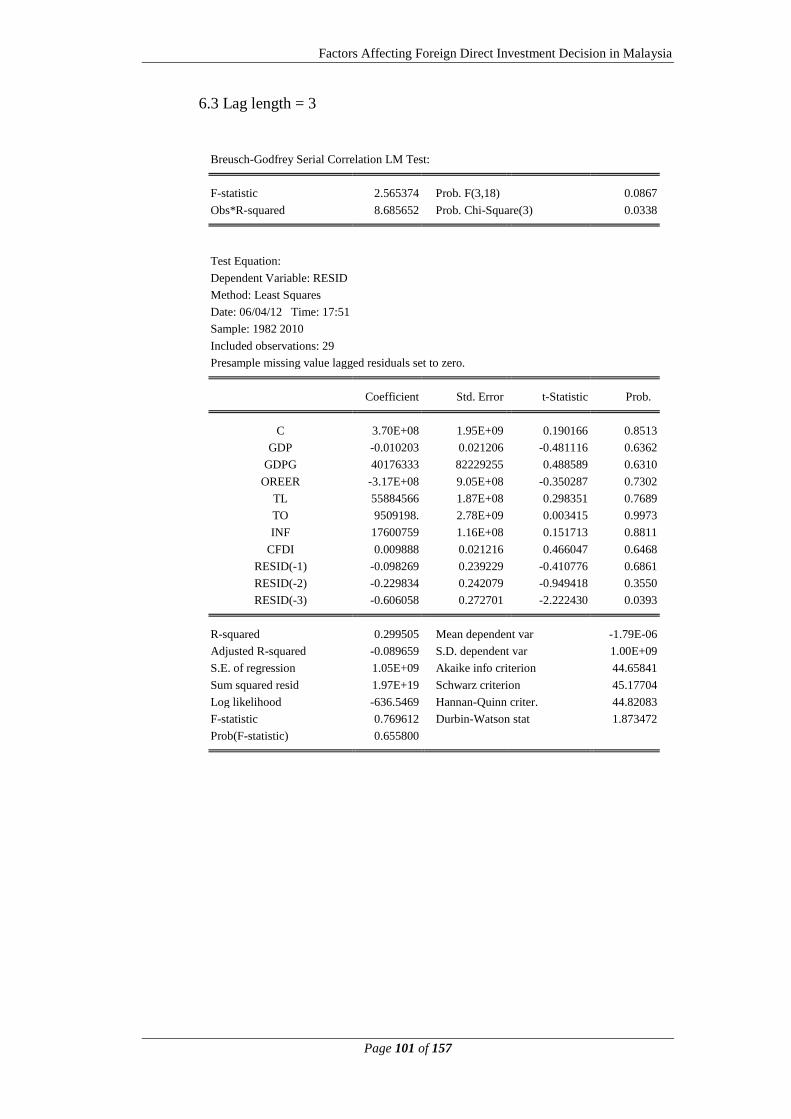
Factors Affecting Foreign Direct Investment Decision in Malaysia
Page 101 of 157
6.3 Lag length = 3
Breusch-Godfrey Serial Correlation LM Test:
F-statistic 2.565374 Prob. F(3,18) 0.0867
Obs*R-squared 8.685652 Prob. Chi-Square(3) 0.0338
Test Equation:
Dependent Variable: RESID
Method: Least Squares
Date: 06/04/12 Time: 17:51
Sample: 1982 2010
Included observations: 29
Presample missing value lagged residuals set to zero.
Coefficient Std. Error t-Statistic Prob.
C 3.70E+08 1.95E+09 0.190166 0.8513
GDP -0.010203 0.021206 -0.481116 0.6362
GDPG 40176333 82229255 0.488589 0.6310
OREER -3.17E+08 9.05E+08 -0.350287 0.7302
TL 55884566 1.87E+08 0.298351 0.7689
TO 9509198. 2.78E+09 0.003415 0.9973
INF 17600759 1.16E+08 0.151713 0.8811
CFDI 0.009888 0.021216 0.466047 0.6468
RESID(-1) -0.098269 0.239229 -0.410776 0.6861
RESID(-2) -0.229834 0.242079 -0.949418 0.3550
RESID(-3) -0.606058 0.272701 -2.222430 0.0393
R-squared 0.299505 Mean dependent var -1.79E-06
Adjusted R-squared -0.089659 S.D. dependent var 1.00E+09
S.E. of regression 1.05E+09 Akaike info criterion 44.65841
Sum squared resid 1.97E+19 Schwarz criterion 45.17704
Log likelihood -636.5469 Hannan-Quinn criter. 44.82083
F-statistic 0.769612 Durbin-Watson stat 1.873472
Prob(F-statistic) 0.655800
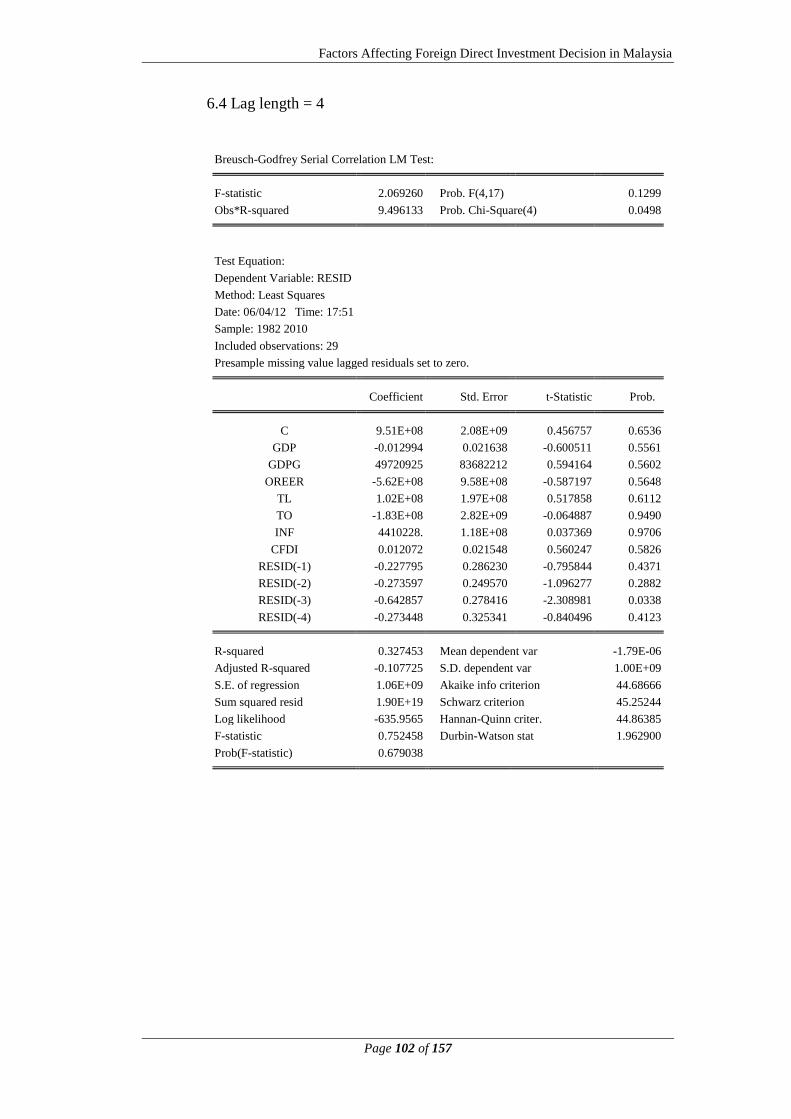
Factors Affecting Foreign Direct Investment Decision in Malaysia
Page 102 of 157
6.4 Lag length = 4
Breusch-Godfrey Serial Correlation LM Test:
F-statistic 2.069260 Prob. F(4,17) 0.1299
Obs*R-squared 9.496133 Prob. Chi-Square(4) 0.0498
Test Equation:
Dependent Variable: RESID
Method: Least Squares
Date: 06/04/12 Time: 17:51
Sample: 1982 2010
Included observations: 29
Presample missing value lagged residuals set to zero.
Coefficient Std. Error t-Statistic Prob.
C 9.51E+08 2.08E+09 0.456757 0.6536
GDP -0.012994 0.021638 -0.600511 0.5561
GDPG 49720925 83682212 0.594164 0.5602
OREER -5.62E+08 9.58E+08 -0.587197 0.5648
TL 1.02E+08 1.97E+08 0.517858 0.6112
TO -1.83E+08 2.82E+09 -0.064887 0.9490
INF 4410228. 1.18E+08 0.037369 0.9706
CFDI 0.012072 0.021548 0.560247 0.5826
RESID(-1) -0.227795 0.286230 -0.795844 0.4371
RESID(-2) -0.273597 0.249570 -1.096277 0.2882
RESID(-3) -0.642857 0.278416 -2.308981 0.0338
RESID(-4) -0.273448 0.325341 -0.840496 0.4123
R-squared 0.327453 Mean dependent var -1.79E-06
Adjusted R-squared -0.107725 S.D. dependent var 1.00E+09
S.E. of regression 1.06E+09 Akaike info criterion 44.68666
Sum squared resid 1.90E+19 Schwarz criterion 45.25244
Log likelihood -635.9565 Hannan-Quinn criter. 44.86385
F-statistic 0.752458 Durbin-Watson stat 1.962900
Prob(F-statistic) 0.679038
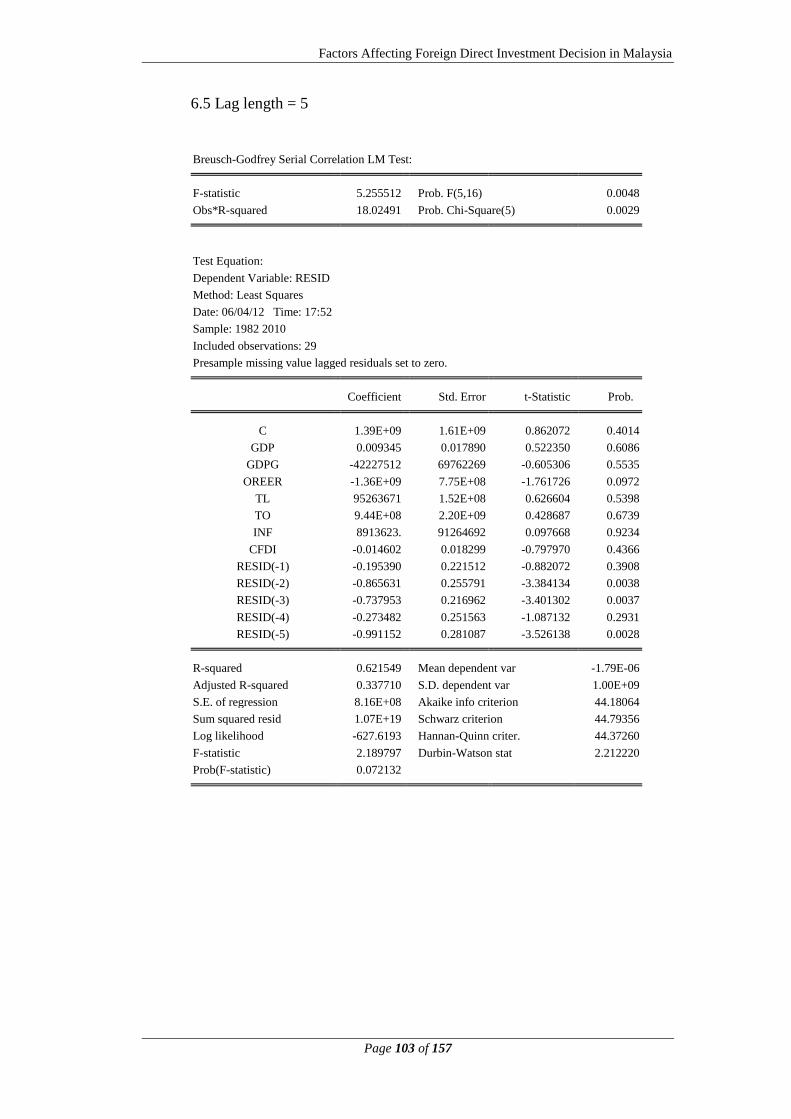
Factors Affecting Foreign Direct Investment Decision in Malaysia
Page 103 of 157
6.5 Lag length = 5
Breusch-Godfrey Serial Correlation LM Test:
F-statistic 5.255512 Prob. F(5,16) 0.0048
Obs*R-squared 18.02491 Prob. Chi-Square(5) 0.0029
Test Equation:
Dependent Variable: RESID
Method: Least Squares
Date: 06/04/12 Time: 17:52
Sample: 1982 2010
Included observations: 29
Presample missing value lagged residuals set to zero.
Coefficient Std. Error t-Statistic Prob.
C 1.39E+09 1.61E+09 0.862072 0.4014
GDP 0.009345 0.017890 0.522350 0.6086
GDPG -42227512 69762269 -0.605306 0.5535
OREER -1.36E+09 7.75E+08 -1.761726 0.0972
TL 95263671 1.52E+08 0.626604 0.5398
TO 9.44E+08 2.20E+09 0.428687 0.6739
INF 8913623. 91264692 0.097668 0.9234
CFDI -0.014602 0.018299 -0.797970 0.4366
RESID(-1) -0.195390 0.221512 -0.882072 0.3908
RESID(-2) -0.865631 0.255791 -3.384134 0.0038
RESID(-3) -0.737953 0.216962 -3.401302 0.0037
RESID(-4) -0.273482 0.251563 -1.087132 0.2931
RESID(-5) -0.991152 0.281087 -3.526138 0.0028
R-squared 0.621549 Mean dependent var -1.79E-06
Adjusted R-squared 0.337710 S.D. dependent var 1.00E+09
S.E. of regression 8.16E+08 Akaike info criterion 44.18064
Sum squared resid 1.07E+19 Schwarz criterion 44.79356
Log likelihood -627.6193 Hannan-Quinn criter. 44.37260
F-statistic 2.189797 Durbin-Watson stat 2.212220
Prob(F-statistic) 0.072132
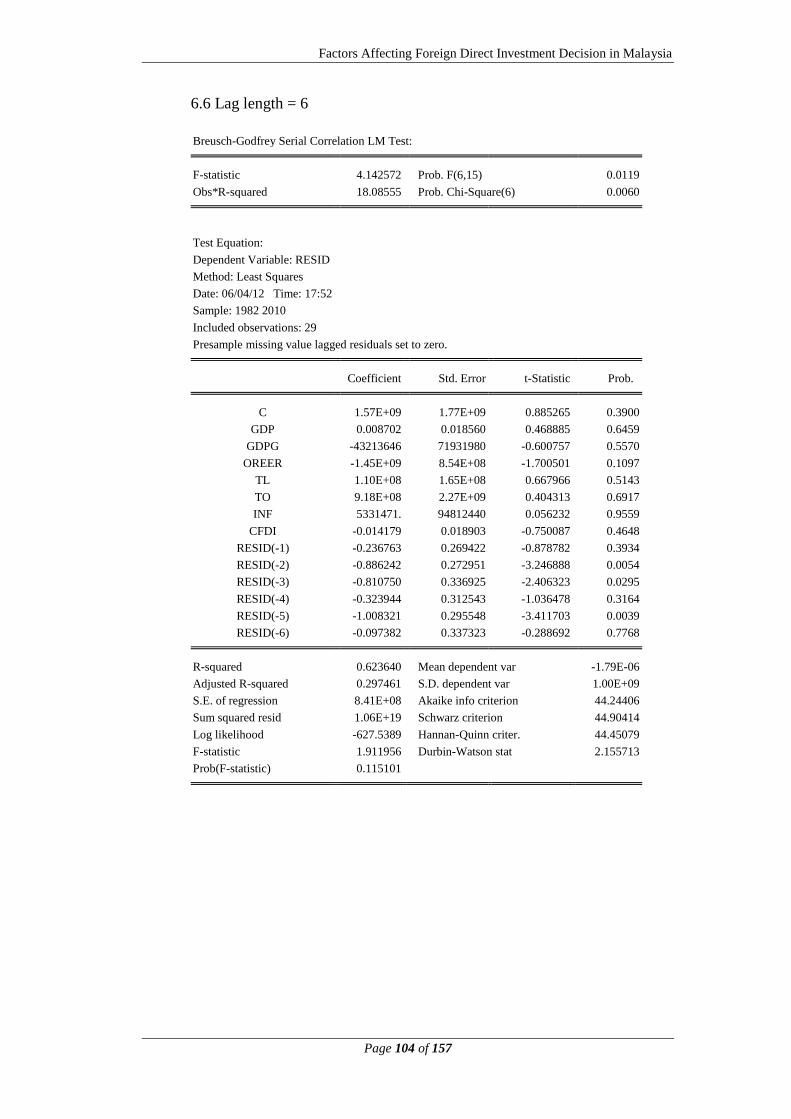
Factors Affecting Foreign Direct Investment Decision in Malaysia
Page 104 of 157
6.6 Lag length = 6
Breusch-Godfrey Serial Correlation LM Test:
F-statistic 4.142572 Prob. F(6,15) 0.0119
Obs*R-squared 18.08555 Prob. Chi-Square(6) 0.0060
Test Equation:
Dependent Variable: RESID
Method: Least Squares
Date: 06/04/12 Time: 17:52
Sample: 1982 2010
Included observations: 29
Presample missing value lagged residuals set to zero.
Coefficient Std. Error t-Statistic Prob.
C 1.57E+09 1.77E+09 0.885265 0.3900
GDP 0.008702 0.018560 0.468885 0.6459
GDPG -43213646 71931980 -0.600757 0.5570
OREER -1.45E+09 8.54E+08 -1.700501 0.1097
TL 1.10E+08 1.65E+08 0.667966 0.5143
TO 9.18E+08 2.27E+09 0.404313 0.6917
INF 5331471. 94812440 0.056232 0.9559
CFDI -0.014179 0.018903 -0.750087 0.4648
RESID(-1) -0.236763 0.269422 -0.878782 0.3934
RESID(-2) -0.886242 0.272951 -3.246888 0.0054
RESID(-3) -0.810750 0.336925 -2.406323 0.0295
RESID(-4) -0.323944 0.312543 -1.036478 0.3164
RESID(-5) -1.008321 0.295548 -3.411703 0.0039
RESID(-6) -0.097382 0.337323 -0.288692 0.7768
R-squared 0.623640 Mean dependent var -1.79E-06
Adjusted R-squared 0.297461 S.D. dependent var 1.00E+09
S.E. of regression 8.41E+08 Akaike info criterion 44.24406
Sum squared resid 1.06E+19 Schwarz criterion 44.90414
Log likelihood -627.5389 Hannan-Quinn criter. 44.45079
F-statistic 1.911956 Durbin-Watson stat 2.155713
Prob(F-statistic) 0.115101
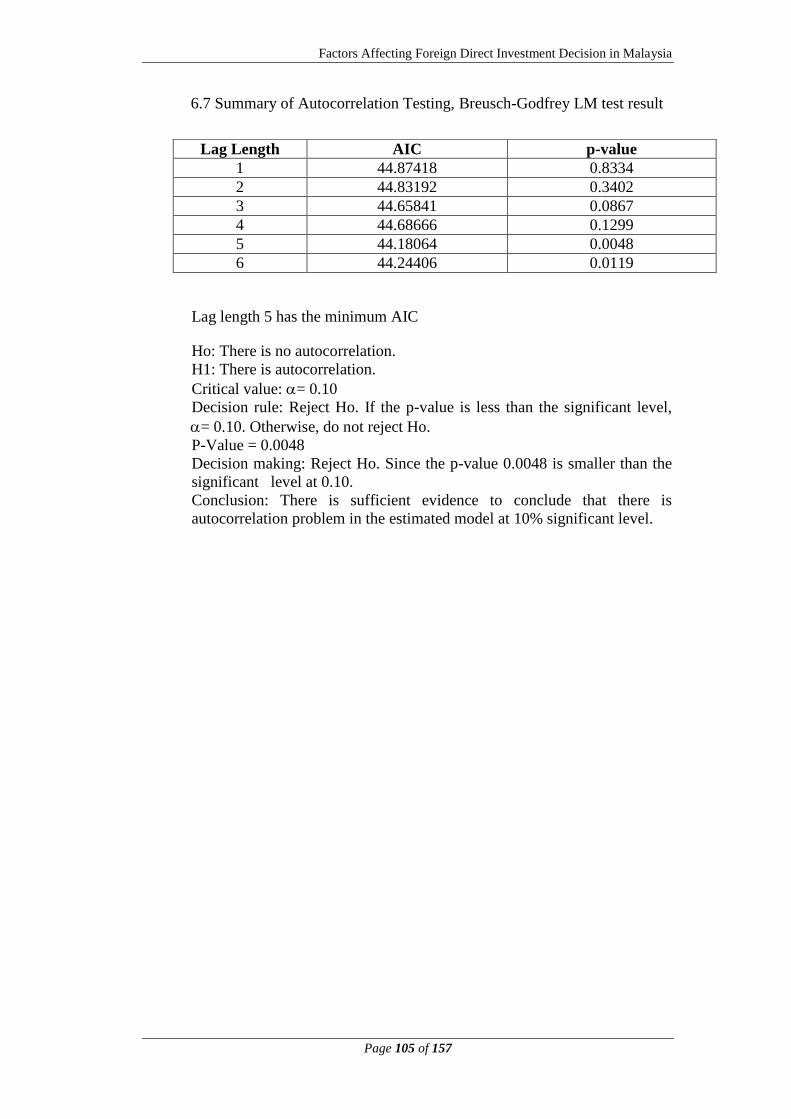
Factors Affecting Foreign Direct Investment Decision in Malaysia
Page 105 of 157
6.7 Summary of Autocorrelation Testing, Breusch-Godfrey LM test result
Lag length 5 has the minimum AIC
Ho: There is no autocorrelation.
H1: There is autocorrelation.
Critical value: = 0.10
Decision rule: Reject Ho. If the p-value is less than the significant level,
= 0.10. Otherwise, do not reject Ho.
P-Value = 0.0048
Decision making: Reject Ho. Since the p-value 0.0048 is smaller than the
significant level at 0.10.
Conclusion: There is sufficient evidence to conclude that there is
autocorrelation problem in the estimated model at 10% significant level.
Lag Length AIC p-value
1 44.87418 0.8334
2 44.83192 0.3402
3 44.65841 0.0867
4 44.68666 0.1299
5 44.18064 0.0048
6 44.24406 0.0119
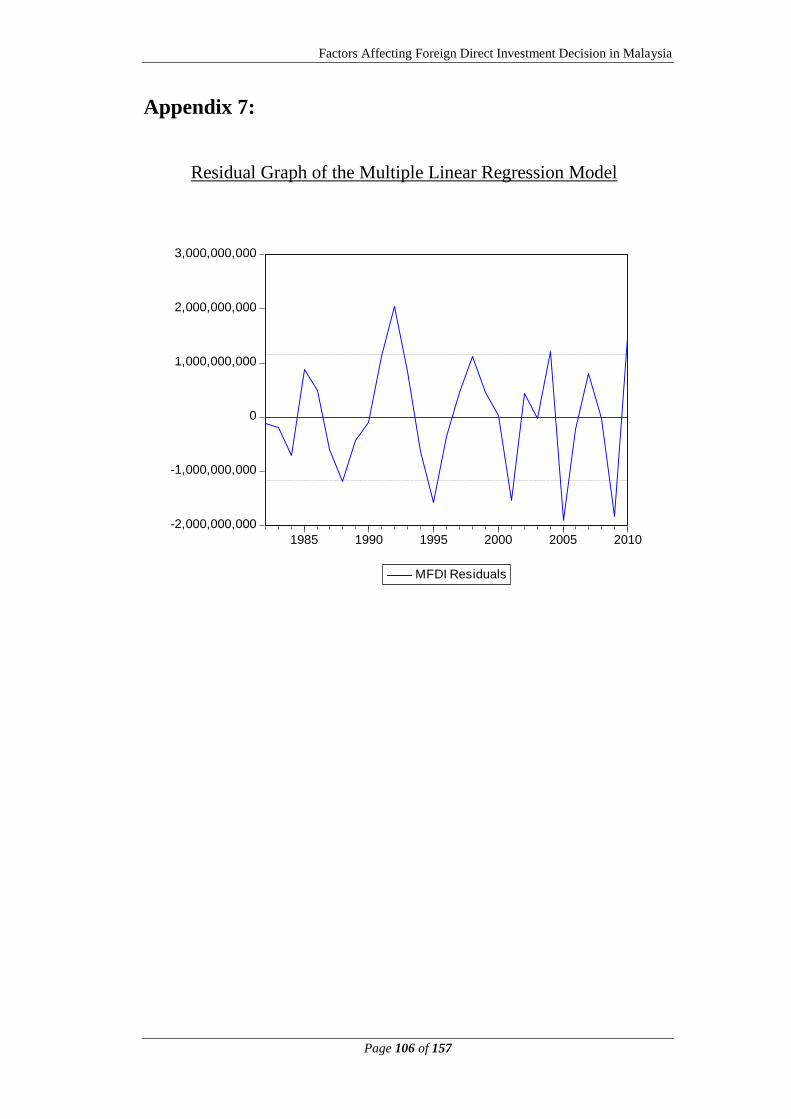
Factors Affecting Foreign Direct Investment Decision in Malaysia
Page 106 of 157
Appendix 7:
Residual Graph of the Multiple Linear Regression Model
-2,000,000,000
-1,000,000,000
0
1,000,000,000
2,000,000,000
3,000,000,000
1985 1990 1995 2000 2005 2010
MFDI Residuals
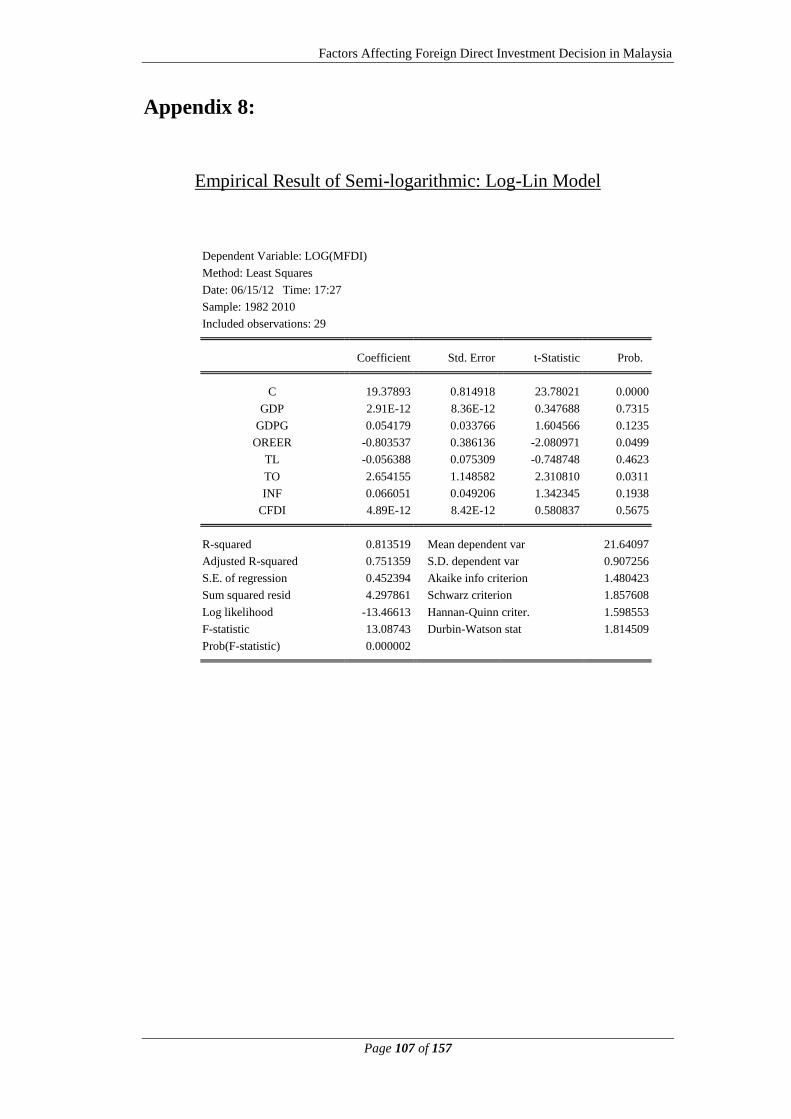
Factors Affecting Foreign Direct Investment Decision in Malaysia
Page 107 of 157
Appendix 8:
Empirical Result of Semi-logarithmic: Log-Lin Model
Dependent Variable: LOG(MFDI)
Method: Least Squares
Date: 06/15/12 Time: 17:27
Sample: 1982 2010
Included observations: 29
Coefficient Std. Error t-Statistic Prob.
C 19.37893 0.814918 23.78021 0.0000
GDP 2.91E-12 8.36E-12 0.347688 0.7315
GDPG 0.054179 0.033766 1.604566 0.1235
OREER -0.803537 0.386136 -2.080971 0.0499
TL -0.056388 0.075309 -0.748748 0.4623
TO 2.654155 1.148582 2.310810 0.0311
INF 0.066051 0.049206 1.342345 0.1938
CFDI 4.89E-12 8.42E-12 0.580837 0.5675
R-squared 0.813519 Mean dependent var 21.64097
Adjusted R-squared 0.751359 S.D. dependent var 0.907256
S.E. of regression 0.452394 Akaike info criterion 1.480423
Sum squared resid 4.297861 Schwarz criterion 1.857608
Log likelihood -13.46613 Hannan-Quinn criter. 1.598553
F-statistic 13.08743 Durbin-Watson stat 1.814509
Prob(F-statistic) 0.000002
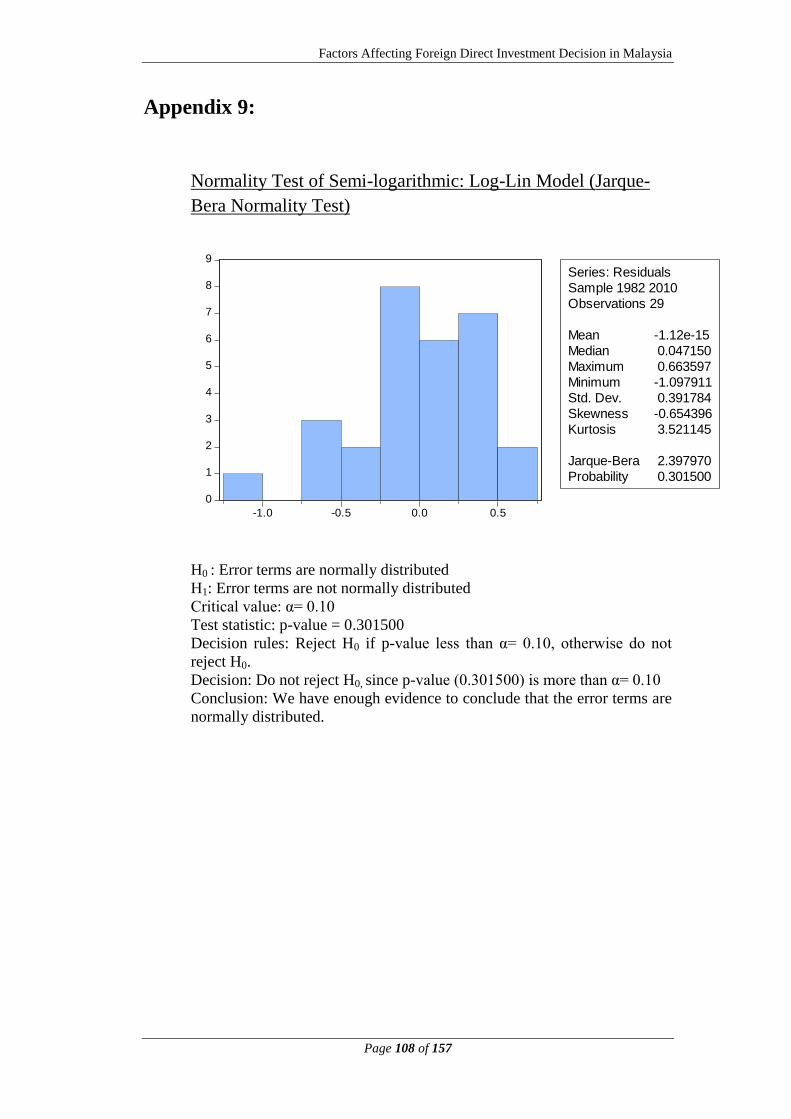
Factors Affecting Foreign Direct Investment Decision in Malaysia
Page 108 of 157
Appendix 9:
Normality Test of Semi-logarithmic: Log-Lin Model (Jarque-
Bera Normality Test)
H0 : Error terms are normally distributed
H1: Error terms are not normally distributed
Critical value: α= 0.10
Test statistic: p-value = 0.301500
Decision rules: Reject H0 if p-value less than α= 0.10, otherwise do not
reject H0.
Decision: Do not reject H0, since p-value (0.301500) is more than α= 0.10
Conclusion: We have enough evidence to conclude that the error terms are
normally distributed.
0
1
2
3
4
5
6
7
8
9
-1.0 -0.5 0.0 0.5
Series: Residuals
Sample 1982 2010
Observations 29
Mean -1.12e-15
Median 0.047150
Maximum 0.663597
Minimum -1.097911
Std. Dev. 0.391784
Skewness -0.654396
Kurtosis 3.521145
Jarque-Bera 2.397970
Probability 0.301500
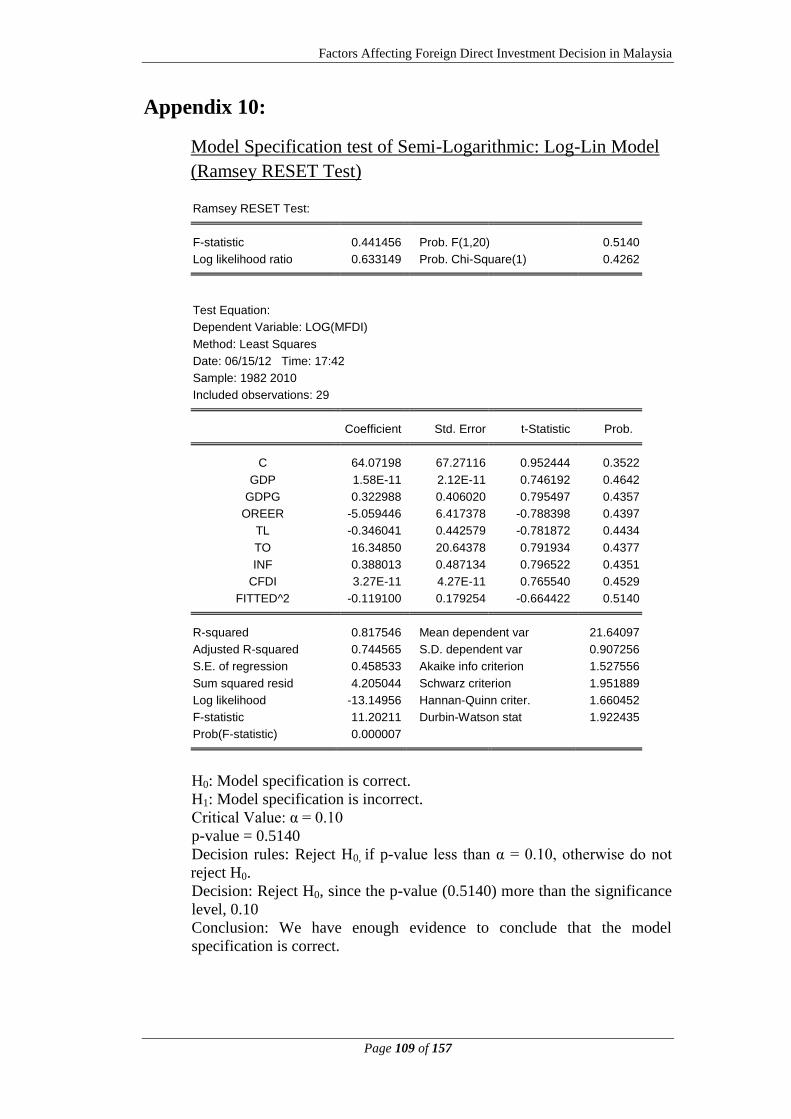
Factors Affecting Foreign Direct Investment Decision in Malaysia
Page 109 of 157
Appendix 10:
Model Specification test of Semi-Logarithmic: Log-Lin Model
(Ramsey RESET Test)
Ramsey RESET Test:
F-statistic 0.441456 Prob. F(1,20) 0.5140
Log likelihood ratio 0.633149 Prob. Chi-Square(1) 0.4262
Test Equation:
Dependent Variable: LOG(MFDI)
Method: Least Squares
Date: 06/15/12 Time: 17:42
Sample: 1982 2010
Included observations: 29 Coefficient Std. Error t-Statistic Prob.
C 64.07198 67.27116 0.952444 0.3522
GDP 1.58E-11 2.12E-11 0.746192 0.4642
GDPG 0.322988 0.406020 0.795497 0.4357
OREER -5.059446 6.417378 -0.788398 0.4397
TL -0.346041 0.442579 -0.781872 0.4434
TO 16.34850 20.64378 0.791934 0.4377
INF 0.388013 0.487134 0.796522 0.4351
CFDI 3.27E-11 4.27E-11 0.765540 0.4529
FITTED^2 -0.119100 0.179254 -0.664422 0.5140
R-squared 0.817546 Mean dependent var 21.64097
Adjusted R-squared 0.744565 S.D. dependent var 0.907256
S.E. of regression 0.458533 Akaike info criterion 1.527556
Sum squared resid 4.205044 Schwarz criterion 1.951889
Log likelihood -13.14956 Hannan-Quinn criter. 1.660452
F-statistic 11.20211 Durbin-Watson stat 1.922435
Prob(F-statistic) 0.000007
H0: Model specification is correct.
H1: Model specification is incorrect.
Critical Value: α = 0.10
p-value = 0.5140
Decision rules: Reject H0, if p-value less than α = 0.10, otherwise do not
reject H0.
Decision: Reject H0, since the p-value (0.5140) more than the significance
level, 0.10
Conclusion: We have enough evidence to conclude that the model
specification is correct.

Factors Affecting Foreign Direct Investment Decision in Malaysia
Page 110 of 157
Appendix 11:
Empirical Result of Model 1
Dependent Variable: LOG(MFDI)
Method: Least Squares
Date: 06/15/12 Time: 18:28
Sample: 1982 2010
Included observations: 29 Coefficient Std. Error t-Statistic Prob.
C 19.62773 0.705766 27.81055 0.0000
GDPG 0.068305 0.026728 2.555526 0.0177
OREER -0.693089 0.346083 -2.002668 0.0571
TO 1.860519 0.461854 4.028367 0.0005
INF 0.077766 0.045178 1.721305 0.0986
CFDI 7.66E-12 1.84E-12 4.169426 0.0004
R-squared 0.808367 Mean dependent var 21.64097
Adjusted R-squared 0.766708 S.D. dependent var 0.907256
S.E. of regression 0.438208 Akaike info criterion 1.369743
Sum squared resid 4.416595 Schwarz criterion 1.652632
Log likelihood -13.86128 Hannan-Quinn criter. 1.458341
F-statistic 19.40425 Durbin-Watson stat 1.773665
Prob(F-statistic) 0.000000

Factors Affecting Foreign Direct Investment Decision in Malaysia
Page 111 of 157
Appendix 12:
Empirical Result of Model 2
Dependent Variable: LOG(MFDI)
Method: Least Squares
Date: 06/15/12 Time: 18:30
Sample: 1982 2010
Included observations: 29 Coefficient Std. Error t-Statistic Prob.
C 19.65046 0.821058 23.93310 0.0000
GDPG 0.106277 0.026020 4.084340 0.0005
OREER -0.172537 0.308930 -0.558499 0.5819
TL 0.087694 0.030484 2.876740 0.0085
INF 0.107534 0.049503 2.172258 0.0404
CFDI 7.92E-12 2.06E-12 3.843187 0.0008
R-squared 0.759643 Mean dependent var 21.64097
Adjusted R-squared 0.707391 S.D. dependent var 0.907256
S.E. of regression 0.490765 Akaike info criterion 1.596288
Sum squared resid 5.539553 Schwarz criterion 1.879177
Log likelihood -17.14618 Hannan-Quinn criter. 1.684885
F-statistic 14.53820 Durbin-Watson stat 1.654779
Prob(F-statistic) 0.000002

Factors Affecting Foreign Direct Investment Decision in Malaysia
Page 112 of 157
Appendix 13:
Empirical Result of Model 3
Dependent Variable: LOG(MFDI)
Method: Least Squares
Date: 06/15/12 Time: 18:36
Sample: 1982 2010
Included observations: 29 Coefficient Std. Error t-Statistic Prob.
C 19.46177 0.723421 26.90242 0.0000
GDP 7.04E-12 1.84E-12 3.830467 0.0009
GDPG 0.065417 0.027658 2.365210 0.0268
OREER -0.673539 0.358007 -1.881360 0.0726
TO 1.773820 0.484693 3.659679 0.0013
INF 0.076571 0.046766 1.637319 0.1152
R-squared 0.794574 Mean dependent var 21.64097
Adjusted R-squared 0.749916 S.D. dependent var 0.907256
S.E. of regression 0.453704 Akaike info criterion 1.439250
Sum squared resid 4.734498 Schwarz criterion 1.722139
Log likelihood -14.86913 Hannan-Quinn criter. 1.527847
F-statistic 17.79246 Durbin-Watson stat 1.819414
Prob(F-statistic) 0.000000
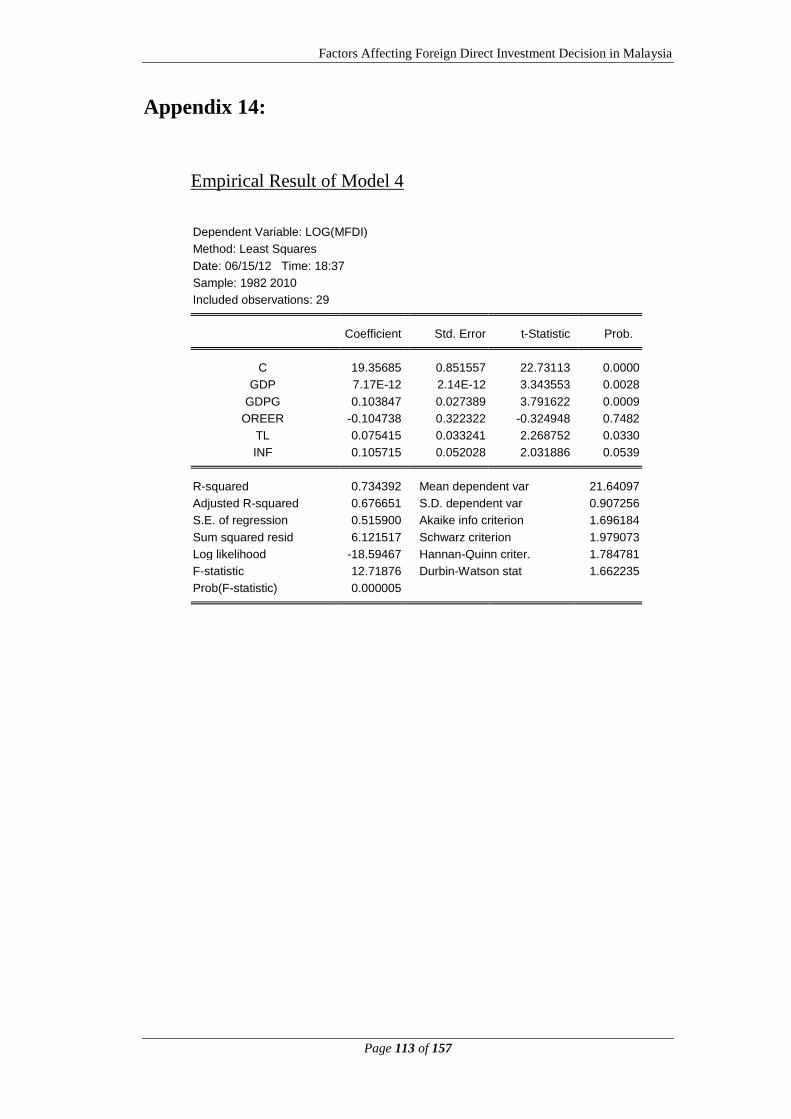
Factors Affecting Foreign Direct Investment Decision in Malaysia
Page 113 of 157
Appendix 14:
Empirical Result of Model 4
Dependent Variable: LOG(MFDI)
Method: Least Squares
Date: 06/15/12 Time: 18:37
Sample: 1982 2010
Included observations: 29 Coefficient Std. Error t-Statistic Prob.
C 19.35685 0.851557 22.73113 0.0000
GDP 7.17E-12 2.14E-12 3.343553 0.0028
GDPG 0.103847 0.027389 3.791622 0.0009
OREER -0.104738 0.322322 -0.324948 0.7482
TL 0.075415 0.033241 2.268752 0.0330
INF 0.105715 0.052028 2.031886 0.0539
R-squared 0.734392 Mean dependent var 21.64097
Adjusted R-squared 0.676651 S.D. dependent var 0.907256
S.E. of regression 0.515900 Akaike info criterion 1.696184
Sum squared resid 6.121517 Schwarz criterion 1.979073
Log likelihood -18.59467 Hannan-Quinn criter. 1.784781
F-statistic 12.71876 Durbin-Watson stat 1.662235
Prob(F-statistic) 0.000005
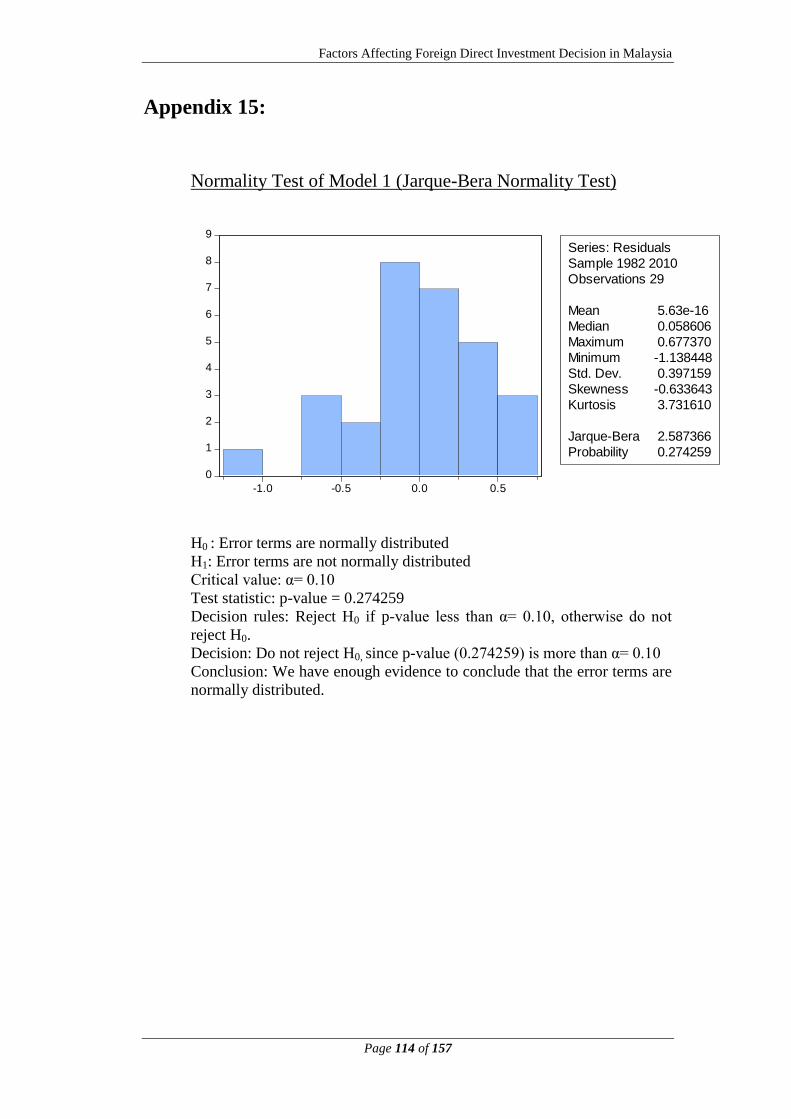
Factors Affecting Foreign Direct Investment Decision in Malaysia
Page 114 of 157
Appendix 15:
Normality Test of Model 1 (Jarque-Bera Normality Test)
H0 : Error terms are normally distributed
H1: Error terms are not normally distributed
Critical value: α= 0.10
Test statistic: p-value = 0.274259
Decision rules: Reject H0 if p-value less than α= 0.10, otherwise do not
reject H0.
Decision: Do not reject H0, since p-value (0.274259) is more than α= 0.10
Conclusion: We have enough evidence to conclude that the error terms are
normally distributed.
0
1
2
3
4
5
6
7
8
9
-1.0 -0.5 0.0 0.5
Series: Residuals
Sample 1982 2010
Observations 29
Mean 5.63e-16
Median 0.058606
Maximum 0.677370
Minimum -1.138448
Std. Dev. 0.397159
Skewness -0.633643
Kurtosis 3.731610
Jarque-Bera 2.587366
Probability 0.274259
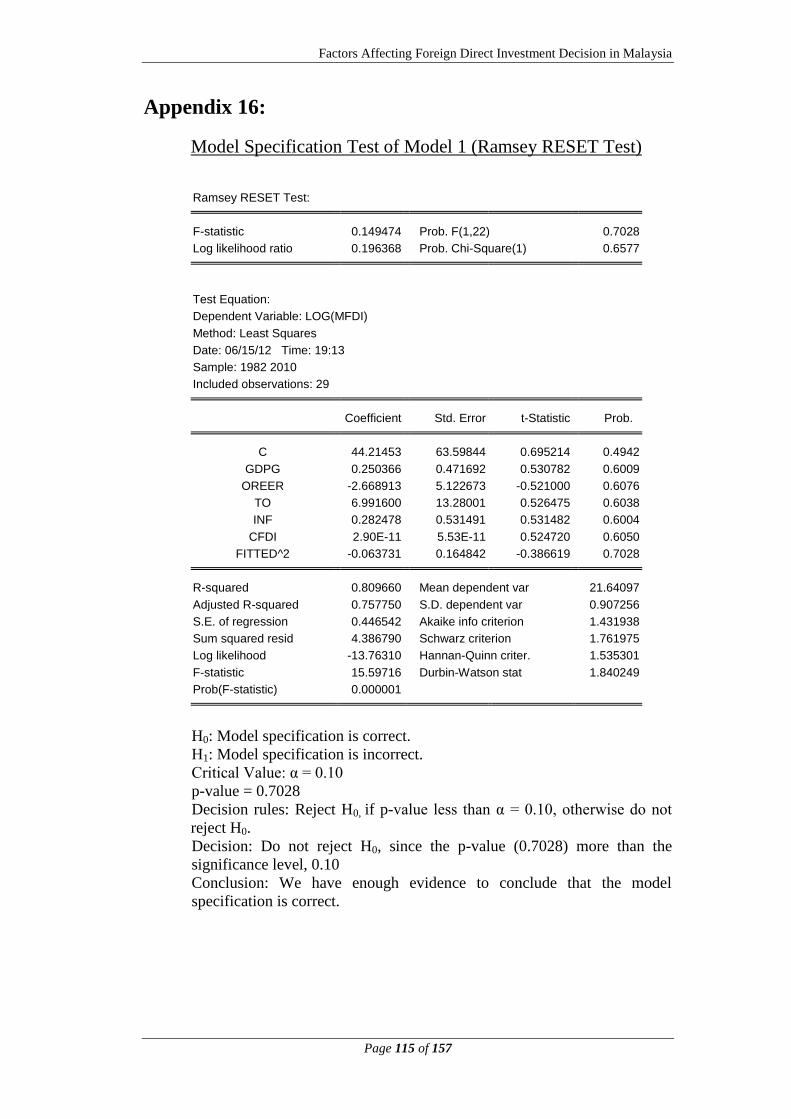
Factors Affecting Foreign Direct Investment Decision in Malaysia
Page 115 of 157
Appendix 16:
Model Specification Test of Model 1 (Ramsey RESET Test)
Ramsey RESET Test:
F-statistic 0.149474 Prob. F(1,22) 0.7028
Log likelihood ratio 0.196368 Prob. Chi-Square(1) 0.6577
Test Equation:
Dependent Variable: LOG(MFDI)
Method: Least Squares
Date: 06/15/12 Time: 19:13
Sample: 1982 2010
Included observations: 29 Coefficient Std. Error t-Statistic Prob.
C 44.21453 63.59844 0.695214 0.4942
GDPG 0.250366 0.471692 0.530782 0.6009
OREER -2.668913 5.122673 -0.521000 0.6076
TO 6.991600 13.28001 0.526475 0.6038
INF 0.282478 0.531491 0.531482 0.6004
CFDI 2.90E-11 5.53E-11 0.524720 0.6050
FITTED^2 -0.063731 0.164842 -0.386619 0.7028
R-squared 0.809660 Mean dependent var 21.64097
Adjusted R-squared 0.757750 S.D. dependent var 0.907256
S.E. of regression 0.446542 Akaike info criterion 1.431938
Sum squared resid 4.386790 Schwarz criterion 1.761975
Log likelihood -13.76310 Hannan-Quinn criter. 1.535301
F-statistic 15.59716 Durbin-Watson stat 1.840249
Prob(F-statistic) 0.000001
H0: Model specification is correct.
H1: Model specification is incorrect.
Critical Value: α = 0.10
p-value = 0.7028
Decision rules: Reject H0, if p-value less than α = 0.10, otherwise do not
reject H0.
Decision: Do not reject H0, since the p-value (0.7028) more than the
significance level, 0.10
Conclusion: We have enough evidence to conclude that the model
specification is correct.
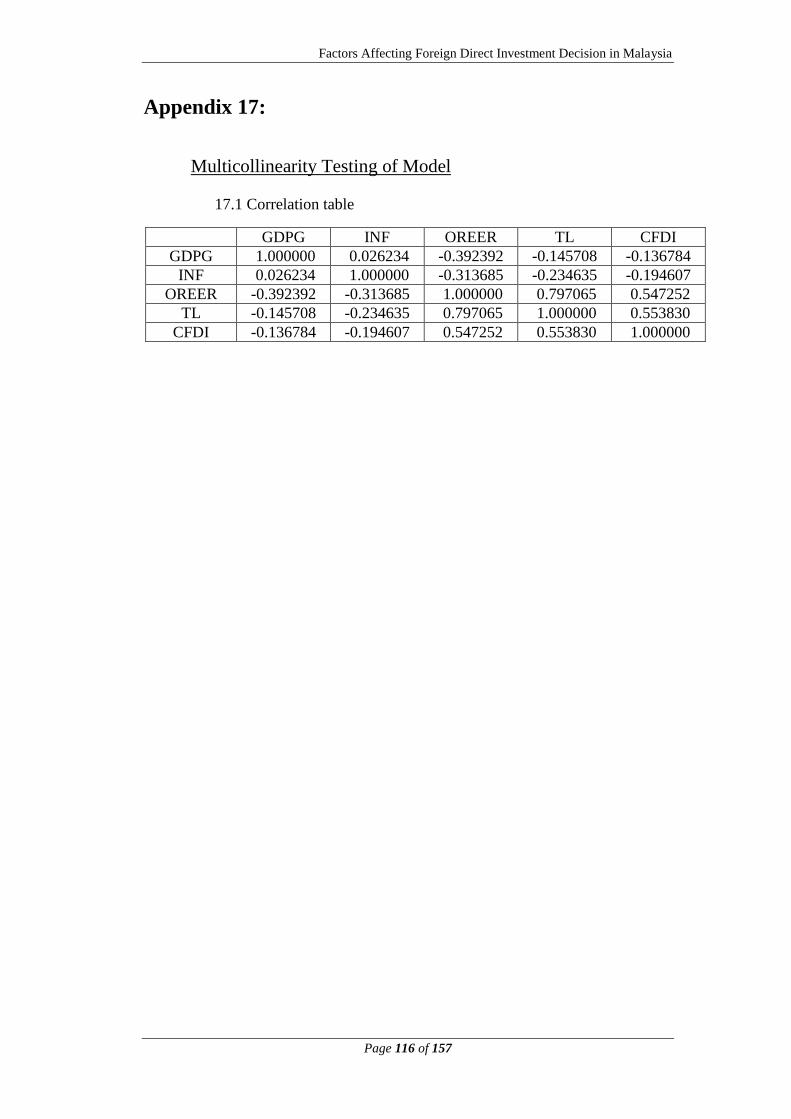
Factors Affecting Foreign Direct Investment Decision in Malaysia
Page 116 of 157
Appendix 17:
Multicollinearity Testing of Model
17.1 Correlation table
GDPG INF OREER TL CFDI
GDPG 1.000000 0.026234 -0.392392 -0.145708 -0.136784
INF 0.026234 1.000000 -0.313685 -0.234635 -0.194607
OREER -0.392392 -0.313685 1.000000 0.797065 0.547252
TL -0.145708 -0.234635 0.797065 1.000000 0.553830
CFDI -0.136784 -0.194607 0.547252 0.553830 1.000000
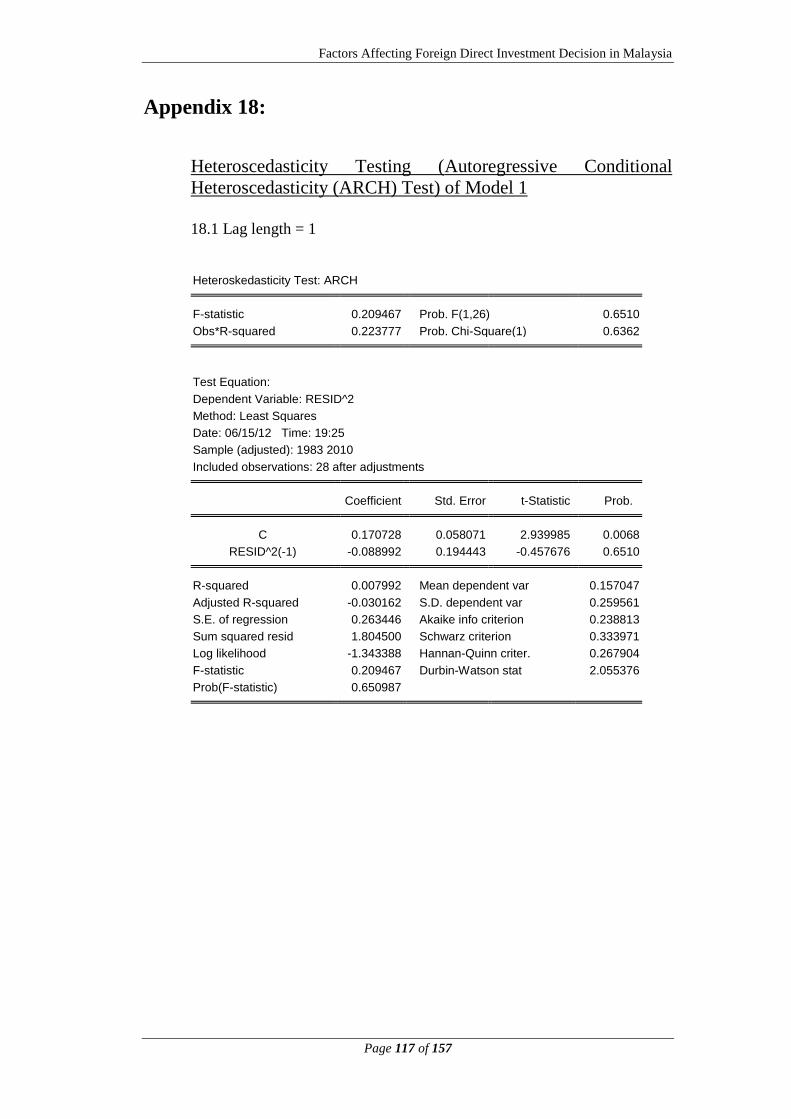
Factors Affecting Foreign Direct Investment Decision in Malaysia
Page 117 of 157
Appendix 18:
Heteroscedasticity Testing (Autoregressive Conditional
Heteroscedasticity (ARCH) Test) of Model 1
18.1 Lag length = 1
Heteroskedasticity Test: ARCH
F-statistic 0.209467 Prob. F(1,26) 0.6510
Obs*R-squared 0.223777 Prob. Chi-Square(1) 0.6362
Test Equation:
Dependent Variable: RESID^2
Method: Least Squares
Date: 06/15/12 Time: 19:25
Sample (adjusted): 1983 2010
Included observations: 28 after adjustments Coefficient Std. Error t-Statistic Prob.
C 0.170728 0.058071 2.939985 0.0068
RESID^2(-1) -0.088992 0.194443 -0.457676 0.6510
R-squared 0.007992 Mean dependent var 0.157047
Adjusted R-squared -0.030162 S.D. dependent var 0.259561
S.E. of regression 0.263446 Akaike info criterion 0.238813
Sum squared resid 1.804500 Schwarz criterion 0.333971
Log likelihood -1.343388 Hannan-Quinn criter. 0.267904
F-statistic 0.209467 Durbin-Watson stat 2.055376
Prob(F-statistic) 0.650987
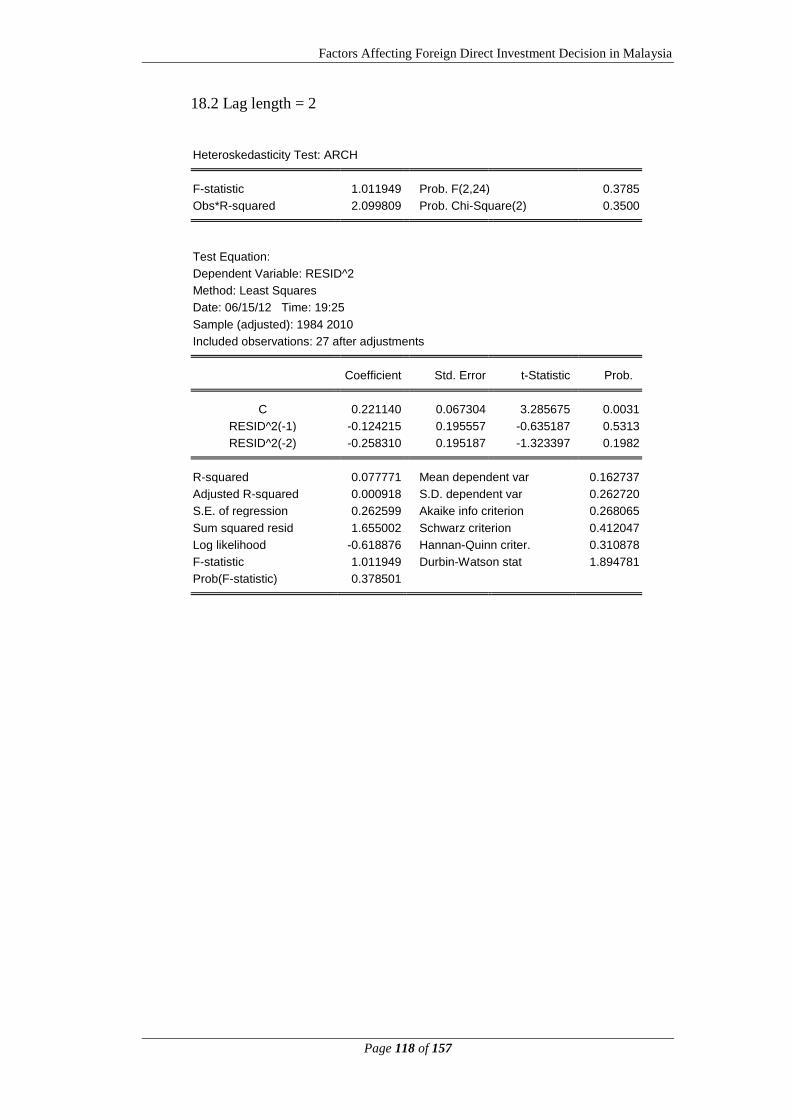
Factors Affecting Foreign Direct Investment Decision in Malaysia
Page 118 of 157
18.2 Lag length = 2
Heteroskedasticity Test: ARCH
F-statistic 1.011949 Prob. F(2,24) 0.3785
Obs*R-squared 2.099809 Prob. Chi-Square(2) 0.3500
Test Equation:
Dependent Variable: RESID^2
Method: Least Squares
Date: 06/15/12 Time: 19:25
Sample (adjusted): 1984 2010
Included observations: 27 after adjustments Coefficient Std. Error t-Statistic Prob.
C 0.221140 0.067304 3.285675 0.0031
RESID^2(-1) -0.124215 0.195557 -0.635187 0.5313
RESID^2(-2) -0.258310 0.195187 -1.323397 0.1982
R-squared 0.077771 Mean dependent var 0.162737
Adjusted R-squared 0.000918 S.D. dependent var 0.262720
S.E. of regression 0.262599 Akaike info criterion 0.268065
Sum squared resid 1.655002 Schwarz criterion 0.412047
Log likelihood -0.618876 Hannan-Quinn criter. 0.310878
F-statistic 1.011949 Durbin-Watson stat 1.894781
Prob(F-statistic) 0.378501

Factors Affecting Foreign Direct Investment Decision in Malaysia
Page 119 of 157
18.3 Lag length = 3
Heteroskedasticity Test: ARCH
F-statistic 1.117446 Prob. F(3,22) 0.3634
Obs*R-squared 3.437980 Prob. Chi-Square(3) 0.3289
Test Equation:
Dependent Variable: RESID^2
Method: Least Squares
Date: 06/15/12 Time: 19:26
Sample (adjusted): 1985 2010
Included observations: 26 after adjustments Coefficient Std. Error t-Statistic Prob.
C 0.181778 0.082977 2.190714 0.0394
RESID^2(-1) -0.077363 0.206746 -0.374195 0.7118
RESID^2(-2) -0.245480 0.199806 -1.228594 0.2322
RESID^2(-3) 0.225106 0.205434 1.095758 0.2850
R-squared 0.132230 Mean dependent var 0.165805
Adjusted R-squared 0.013898 S.D. dependent var 0.267429
S.E. of regression 0.265564 Akaike info criterion 0.326720
Sum squared resid 1.551538 Schwarz criterion 0.520273
Log likelihood -0.247358 Hannan-Quinn criter. 0.382456
F-statistic 1.117446 Durbin-Watson stat 1.932228
Prob(F-statistic) 0.363394
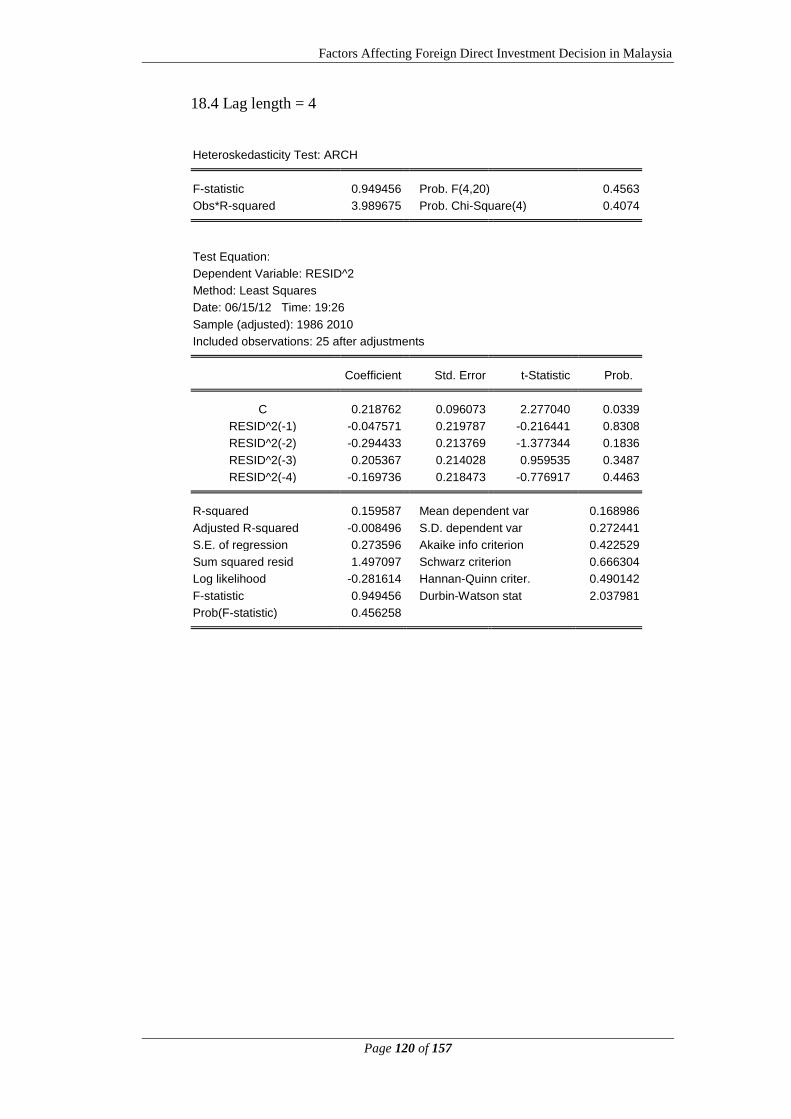
Factors Affecting Foreign Direct Investment Decision in Malaysia
Page 120 of 157
18.4 Lag length = 4
Heteroskedasticity Test: ARCH
F-statistic 0.949456 Prob. F(4,20) 0.4563
Obs*R-squared 3.989675 Prob. Chi-Square(4) 0.4074
Test Equation:
Dependent Variable: RESID^2
Method: Least Squares
Date: 06/15/12 Time: 19:26
Sample (adjusted): 1986 2010
Included observations: 25 after adjustments Coefficient Std. Error t-Statistic Prob.
C 0.218762 0.096073 2.277040 0.0339
RESID^2(-1) -0.047571 0.219787 -0.216441 0.8308
RESID^2(-2) -0.294433 0.213769 -1.377344 0.1836
RESID^2(-3) 0.205367 0.214028 0.959535 0.3487
RESID^2(-4) -0.169736 0.218473 -0.776917 0.4463
R-squared 0.159587 Mean dependent var 0.168986
Adjusted R-squared -0.008496 S.D. dependent var 0.272441
S.E. of regression 0.273596 Akaike info criterion 0.422529
Sum squared resid 1.497097 Schwarz criterion 0.666304
Log likelihood -0.281614 Hannan-Quinn criter. 0.490142
F-statistic 0.949456 Durbin-Watson stat 2.037981
Prob(F-statistic) 0.456258

Factors Affecting Foreign Direct Investment Decision in Malaysia
Page 121 of 157
18.5 Lag length = 5
Heteroskedasticity Test: ARCH
F-statistic 0.788746 Prob. F(5,18) 0.5713
Obs*R-squared 4.313285 Prob. Chi-Square(5) 0.5052
Test Equation:
Dependent Variable: RESID^2
Method: Least Squares
Date: 06/15/12 Time: 19:27
Sample (adjusted): 1987 2010
Included observations: 24 after adjustments Coefficient Std. Error t-Statistic Prob.
C 0.265263 0.115383 2.298984 0.0337
RESID^2(-1) -0.082071 0.231756 -0.354125 0.7274
RESID^2(-2) -0.284342 0.227887 -1.247732 0.2281
RESID^2(-3) 0.145089 0.234405 0.618967 0.5437
RESID^2(-4) -0.193102 0.227749 -0.847871 0.4076
RESID^2(-5) -0.125086 0.233445 -0.535827 0.5986
R-squared 0.179720 Mean dependent var 0.175626
Adjusted R-squared -0.048135 S.D. dependent var 0.276227
S.E. of regression 0.282797 Akaike info criterion 0.524141
Sum squared resid 1.439531 Schwarz criterion 0.818654
Log likelihood -0.289686 Hannan-Quinn criter. 0.602275
F-statistic 0.788746 Durbin-Watson stat 2.014303
Prob(F-statistic) 0.571306
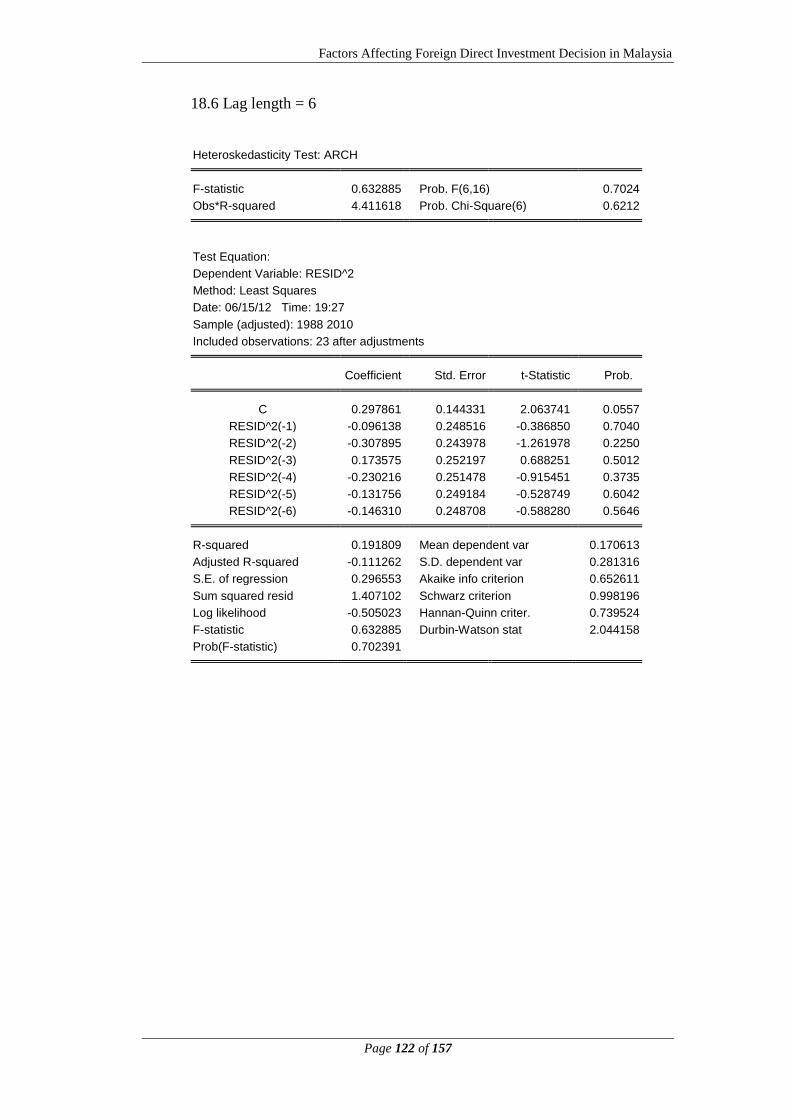
Factors Affecting Foreign Direct Investment Decision in Malaysia
Page 122 of 157
18.6 Lag length = 6
Heteroskedasticity Test: ARCH
F-statistic 0.632885 Prob. F(6,16) 0.7024
Obs*R-squared 4.411618 Prob. Chi-Square(6) 0.6212
Test Equation:
Dependent Variable: RESID^2
Method: Least Squares
Date: 06/15/12 Time: 19:27
Sample (adjusted): 1988 2010
Included observations: 23 after adjustments Coefficient Std. Error t-Statistic Prob.
C 0.297861 0.144331 2.063741 0.0557
RESID^2(-1) -0.096138 0.248516 -0.386850 0.7040
RESID^2(-2) -0.307895 0.243978 -1.261978 0.2250
RESID^2(-3) 0.173575 0.252197 0.688251 0.5012
RESID^2(-4) -0.230216 0.251478 -0.915451 0.3735
RESID^2(-5) -0.131756 0.249184 -0.528749 0.6042
RESID^2(-6) -0.146310 0.248708 -0.588280 0.5646
R-squared 0.191809 Mean dependent var 0.170613
Adjusted R-squared -0.111262 S.D. dependent var 0.281316
S.E. of regression 0.296553 Akaike info criterion 0.652611
Sum squared resid 1.407102 Schwarz criterion 0.998196
Log likelihood -0.505023 Hannan-Quinn criter. 0.739524
F-statistic 0.632885 Durbin-Watson stat 2.044158
Prob(F-statistic) 0.702391
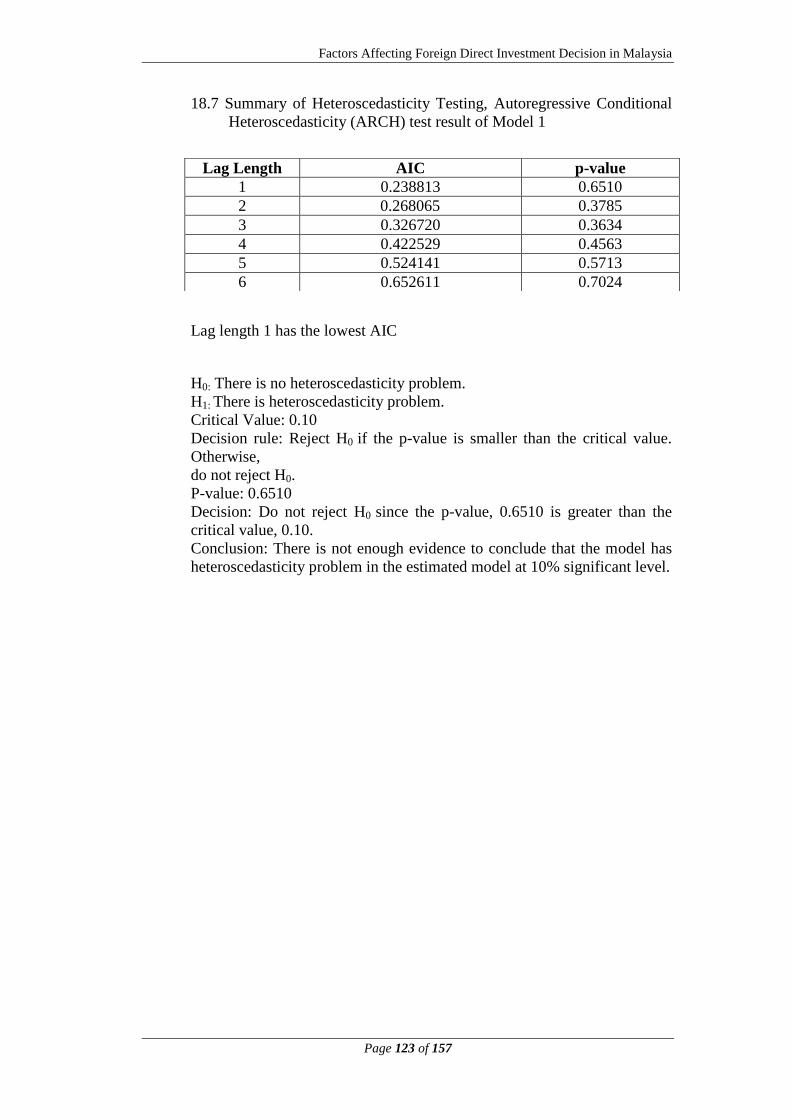
Factors Affecting Foreign Direct Investment Decision in Malaysia
Page 123 of 157
18.7 Summary of Heteroscedasticity Testing, Autoregressive Conditional
Heteroscedasticity (ARCH) test result of Model 1
Lag length 1 has the lowest AIC
H0: There is no heteroscedasticity problem.
H1: There is heteroscedasticity problem.
Critical Value: 0.10
Decision rule: Reject H0 if the p-value is smaller than the critical value.
Otherwise,
do not reject H0.
P-value: 0.6510
Decision: Do not reject H0 since the p-value, 0.6510 is greater than the
critical value, 0.10.
Conclusion: There is not enough evidence to conclude that the model has
heteroscedasticity problem in the estimated model at 10% significant level.
Lag Length AIC p-value
1 0.238813 0.6510
2 0.268065 0.3785
3 0.326720 0.3634
4 0.422529 0.4563
5 0.524141 0.5713
6 0.652611 0.7024
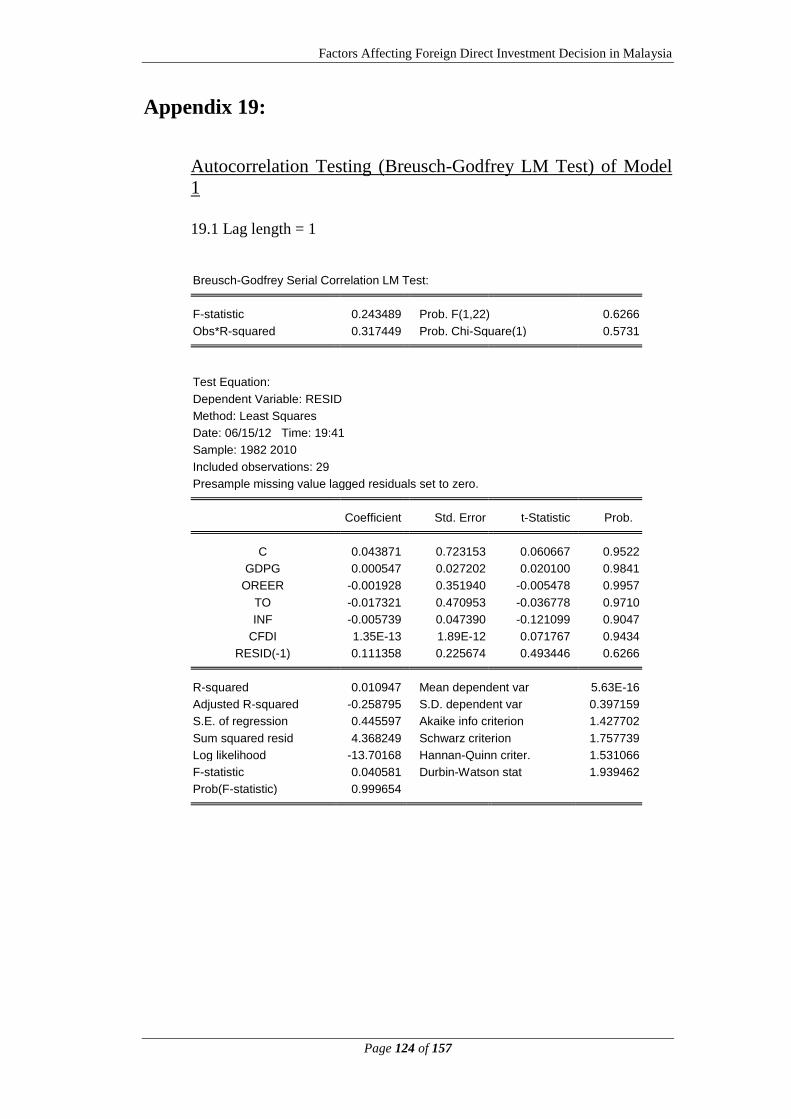
Factors Affecting Foreign Direct Investment Decision in Malaysia
Page 124 of 157
Appendix 19:
Autocorrelation Testing (Breusch-Godfrey LM Test) of Model
1
19.1 Lag length = 1
Breusch-Godfrey Serial Correlation LM Test:
F-statistic 0.243489 Prob. F(1,22) 0.6266
Obs*R-squared 0.317449 Prob. Chi-Square(1) 0.5731
Test Equation:
Dependent Variable: RESID
Method: Least Squares
Date: 06/15/12 Time: 19:41
Sample: 1982 2010
Included observations: 29
Presample missing value lagged residuals set to zero. Coefficient Std. Error t-Statistic Prob.
C 0.043871 0.723153 0.060667 0.9522
GDPG 0.000547 0.027202 0.020100 0.9841
OREER -0.001928 0.351940 -0.005478 0.9957
TO -0.017321 0.470953 -0.036778 0.9710
INF -0.005739 0.047390 -0.121099 0.9047
CFDI 1.35E-13 1.89E-12 0.071767 0.9434
RESID(-1) 0.111358 0.225674 0.493446 0.6266
R-squared 0.010947 Mean dependent var 5.63E-16
Adjusted R-squared -0.258795 S.D. dependent var 0.397159
S.E. of regression 0.445597 Akaike info criterion 1.427702
Sum squared resid 4.368249 Schwarz criterion 1.757739
Log likelihood -13.70168 Hannan-Quinn criter. 1.531066
F-statistic 0.040581 Durbin-Watson stat 1.939462
Prob(F-statistic) 0.999654

Factors Affecting Foreign Direct Investment Decision in Malaysia
Page 125 of 157
19.2 Lag length = 2
Breusch-Godfrey Serial Correlation LM Test:
F-statistic 0.254524 Prob. F(2,21) 0.7776
Obs*R-squared 0.686333 Prob. Chi-Square(2) 0.7095
Test Equation:
Dependent Variable: RESID
Method: Least Squares
Date: 06/15/12 Time: 19:42
Sample: 1982 2010
Included observations: 29
Presample missing value lagged residuals set to zero. Coefficient Std. Error t-Statistic Prob.
C 0.056852 0.735815 0.077264 0.9391
GDPG 0.001334 0.027703 0.048154 0.9620
OREER -0.036946 0.364106 -0.101471 0.9201
TO 0.033483 0.488675 0.068518 0.9460
INF -0.005173 0.048204 -0.107309 0.9156
CFDI 2.07E-13 1.92E-12 0.107688 0.9153
RESID(-1) 0.128084 0.231711 0.552774 0.5863
RESID(-2) -0.125429 0.239796 -0.523066 0.6064
R-squared 0.023667 Mean dependent var 5.63E-16
Adjusted R-squared -0.301778 S.D. dependent var 0.397159
S.E. of regression 0.453141 Akaike info criterion 1.483723
Sum squared resid 4.312069 Schwarz criterion 1.860908
Log likelihood -13.51399 Hannan-Quinn criter. 1.601853
F-statistic 0.072721 Durbin-Watson stat 2.092448
Prob(F-statistic) 0.999192
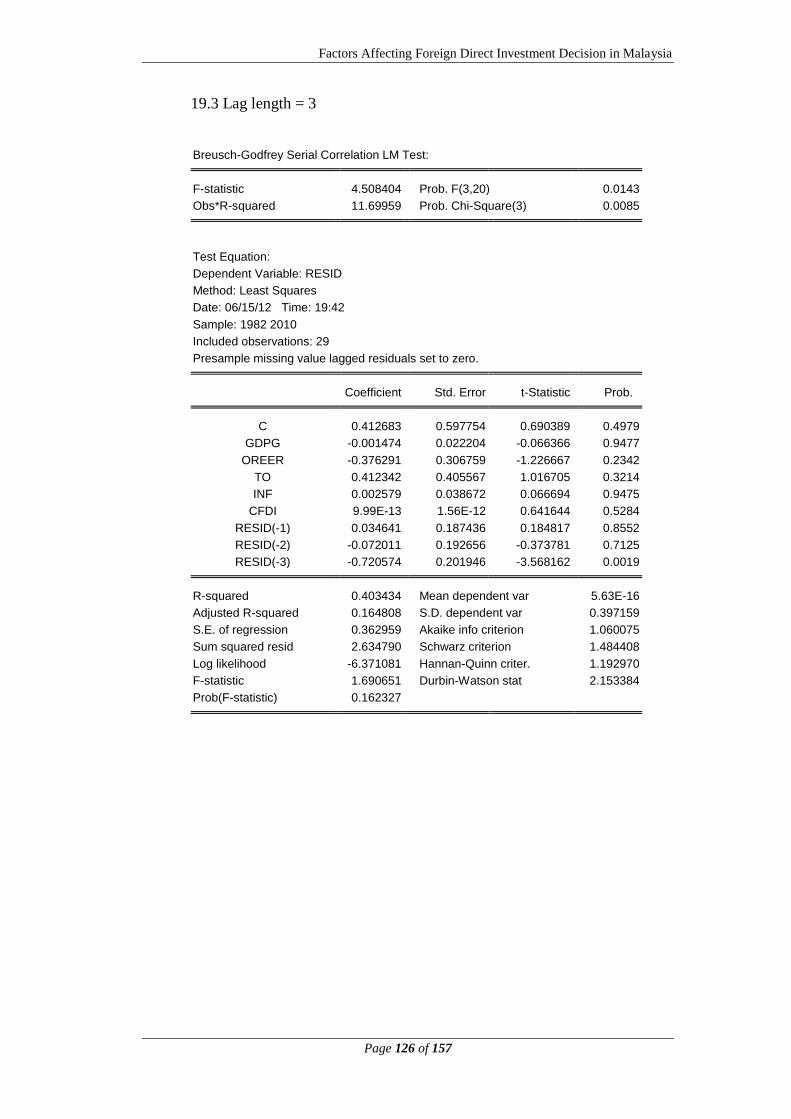
Factors Affecting Foreign Direct Investment Decision in Malaysia
Page 126 of 157
19.3 Lag length = 3
Breusch-Godfrey Serial Correlation LM Test:
F-statistic 4.508404 Prob. F(3,20) 0.0143
Obs*R-squared 11.69959 Prob. Chi-Square(3) 0.0085
Test Equation:
Dependent Variable: RESID
Method: Least Squares
Date: 06/15/12 Time: 19:42
Sample: 1982 2010
Included observations: 29
Presample missing value lagged residuals set to zero. Coefficient Std. Error t-Statistic Prob.
C 0.412683 0.597754 0.690389 0.4979
GDPG -0.001474 0.022204 -0.066366 0.9477
OREER -0.376291 0.306759 -1.226667 0.2342
TO 0.412342 0.405567 1.016705 0.3214
INF 0.002579 0.038672 0.066694 0.9475
CFDI 9.99E-13 1.56E-12 0.641644 0.5284
RESID(-1) 0.034641 0.187436 0.184817 0.8552
RESID(-2) -0.072011 0.192656 -0.373781 0.7125
RESID(-3) -0.720574 0.201946 -3.568162 0.0019
R-squared 0.403434 Mean dependent var 5.63E-16
Adjusted R-squared 0.164808 S.D. dependent var 0.397159
S.E. of regression 0.362959 Akaike info criterion 1.060075
Sum squared resid 2.634790 Schwarz criterion 1.484408
Log likelihood -6.371081 Hannan-Quinn criter. 1.192970
F-statistic 1.690651 Durbin-Watson stat 2.153384
Prob(F-statistic) 0.162327
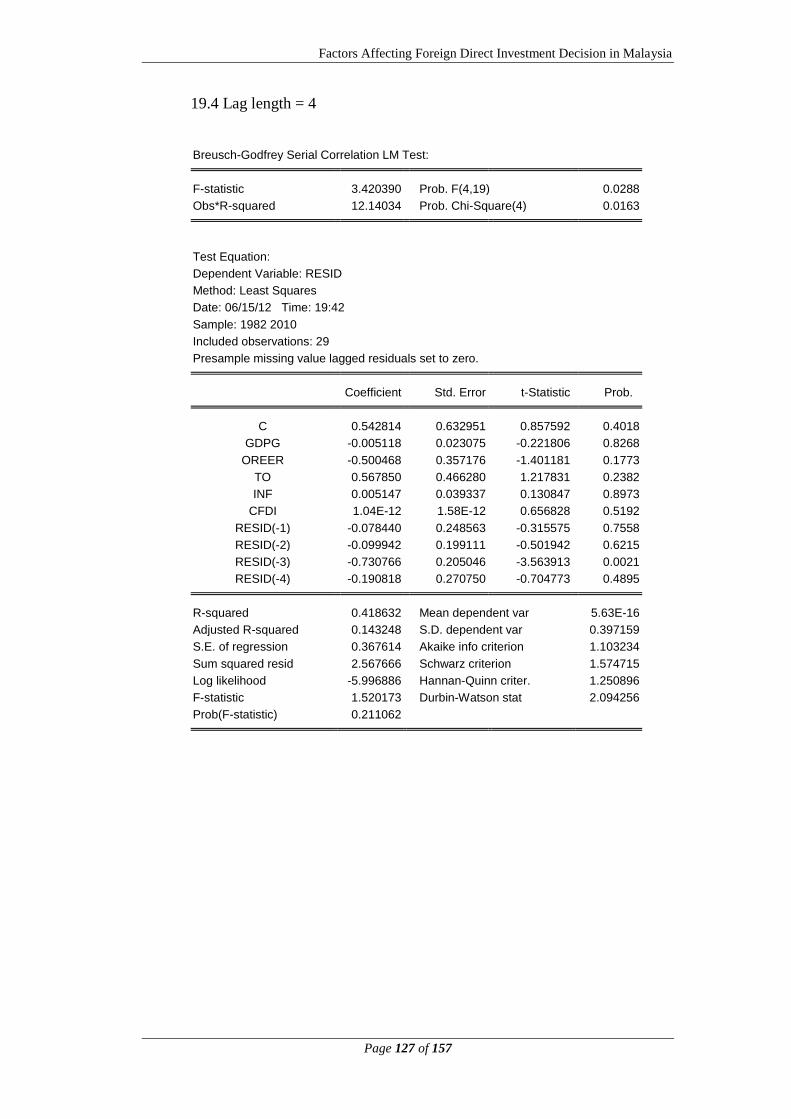
Factors Affecting Foreign Direct Investment Decision in Malaysia
Page 127 of 157
19.4 Lag length = 4
Breusch-Godfrey Serial Correlation LM Test:
F-statistic 3.420390 Prob. F(4,19) 0.0288
Obs*R-squared 12.14034 Prob. Chi-Square(4) 0.0163
Test Equation:
Dependent Variable: RESID
Method: Least Squares
Date: 06/15/12 Time: 19:42
Sample: 1982 2010
Included observations: 29
Presample missing value lagged residuals set to zero. Coefficient Std. Error t-Statistic Prob.
C 0.542814 0.632951 0.857592 0.4018
GDPG -0.005118 0.023075 -0.221806 0.8268
OREER -0.500468 0.357176 -1.401181 0.1773
TO 0.567850 0.466280 1.217831 0.2382
INF 0.005147 0.039337 0.130847 0.8973
CFDI 1.04E-12 1.58E-12 0.656828 0.5192
RESID(-1) -0.078440 0.248563 -0.315575 0.7558
RESID(-2) -0.099942 0.199111 -0.501942 0.6215
RESID(-3) -0.730766 0.205046 -3.563913 0.0021
RESID(-4) -0.190818 0.270750 -0.704773 0.4895
R-squared 0.418632 Mean dependent var 5.63E-16
Adjusted R-squared 0.143248 S.D. dependent var 0.397159
S.E. of regression 0.367614 Akaike info criterion 1.103234
Sum squared resid 2.567666 Schwarz criterion 1.574715
Log likelihood -5.996886 Hannan-Quinn criter. 1.250896
F-statistic 1.520173 Durbin-Watson stat 2.094256
Prob(F-statistic) 0.211062
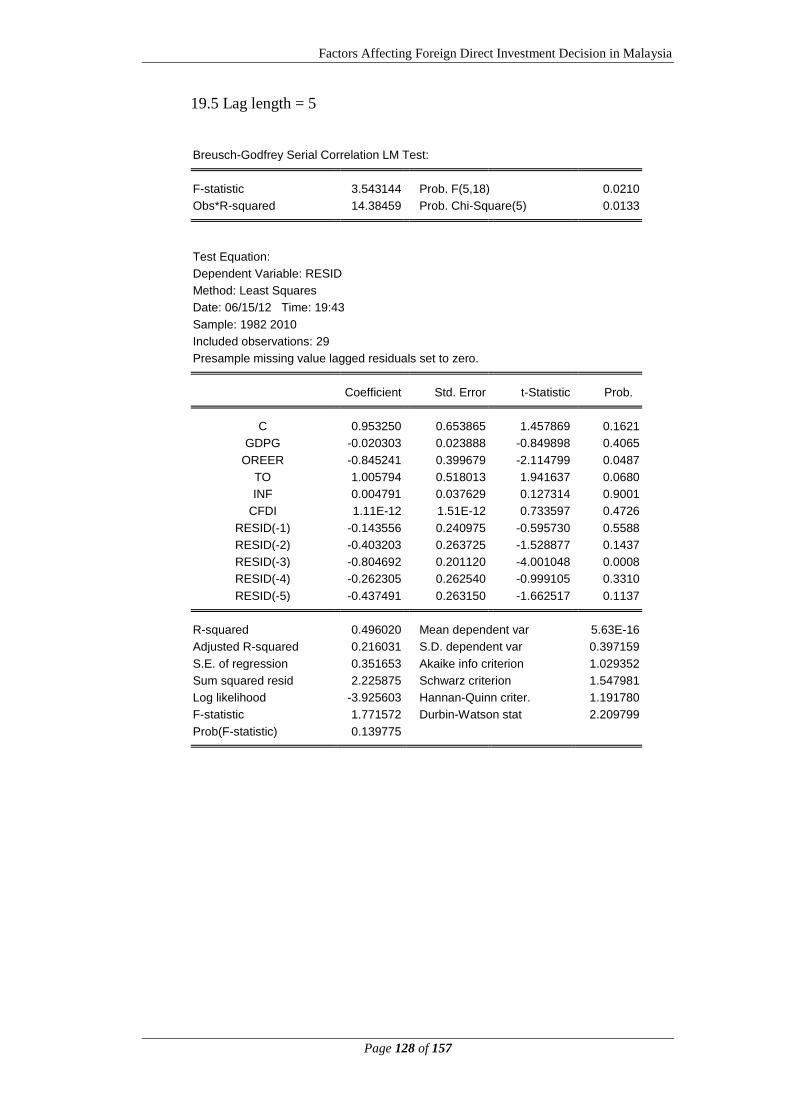
Factors Affecting Foreign Direct Investment Decision in Malaysia
Page 128 of 157
19.5 Lag length = 5
Breusch-Godfrey Serial Correlation LM Test:
F-statistic 3.543144 Prob. F(5,18) 0.0210
Obs*R-squared 14.38459 Prob. Chi-Square(5) 0.0133
Test Equation:
Dependent Variable: RESID
Method: Least Squares
Date: 06/15/12 Time: 19:43
Sample: 1982 2010
Included observations: 29
Presample missing value lagged residuals set to zero. Coefficient Std. Error t-Statistic Prob.
C 0.953250 0.653865 1.457869 0.1621
GDPG -0.020303 0.023888 -0.849898 0.4065
OREER -0.845241 0.399679 -2.114799 0.0487
TO 1.005794 0.518013 1.941637 0.0680
INF 0.004791 0.037629 0.127314 0.9001
CFDI 1.11E-12 1.51E-12 0.733597 0.4726
RESID(-1) -0.143556 0.240975 -0.595730 0.5588
RESID(-2) -0.403203 0.263725 -1.528877 0.1437
RESID(-3) -0.804692 0.201120 -4.001048 0.0008
RESID(-4) -0.262305 0.262540 -0.999105 0.3310
RESID(-5) -0.437491 0.263150 -1.662517 0.1137
R-squared 0.496020 Mean dependent var 5.63E-16
Adjusted R-squared 0.216031 S.D. dependent var 0.397159
S.E. of regression 0.351653 Akaike info criterion 1.029352
Sum squared resid 2.225875 Schwarz criterion 1.547981
Log likelihood -3.925603 Hannan-Quinn criter. 1.191780
F-statistic 1.771572 Durbin-Watson stat 2.209799
Prob(F-statistic) 0.139775
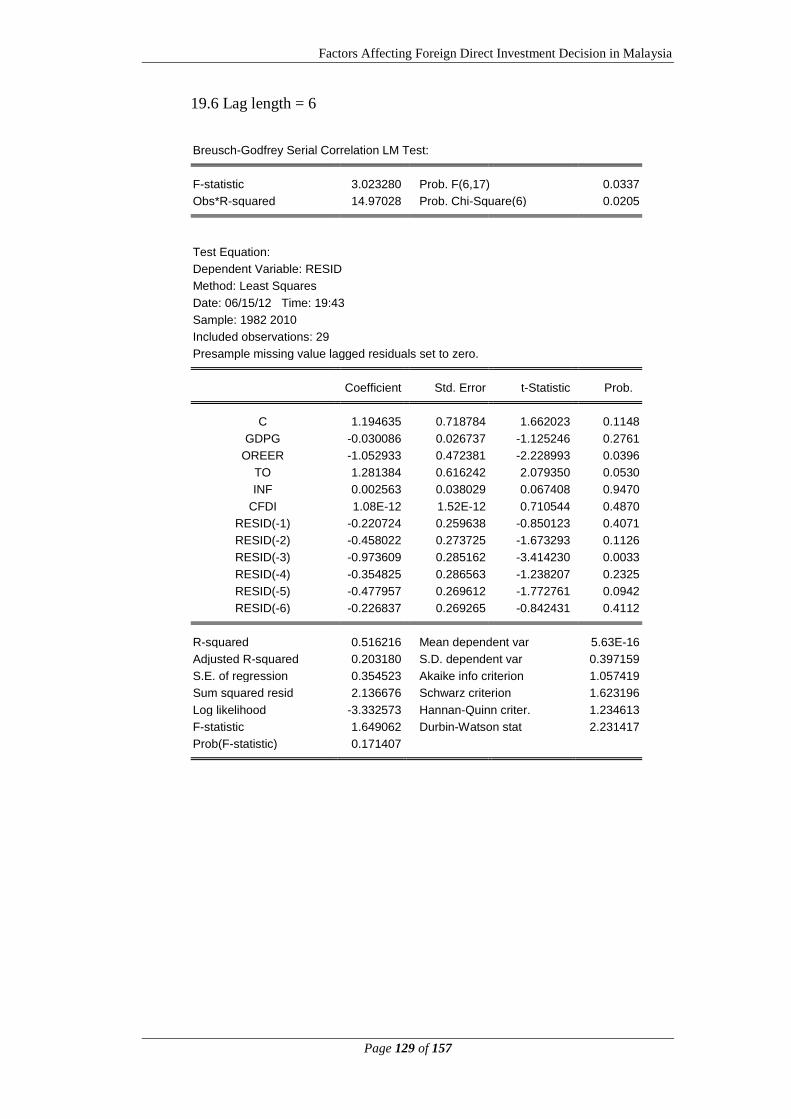
Factors Affecting Foreign Direct Investment Decision in Malaysia
Page 129 of 157
19.6 Lag length = 6
Breusch-Godfrey Serial Correlation LM Test:
F-statistic 3.023280 Prob. F(6,17) 0.0337
Obs*R-squared 14.97028 Prob. Chi-Square(6) 0.0205
Test Equation:
Dependent Variable: RESID
Method: Least Squares
Date: 06/15/12 Time: 19:43
Sample: 1982 2010
Included observations: 29
Presample missing value lagged residuals set to zero. Coefficient Std. Error t-Statistic Prob.
C 1.194635 0.718784 1.662023 0.1148
GDPG -0.030086 0.026737 -1.125246 0.2761
OREER -1.052933 0.472381 -2.228993 0.0396
TO 1.281384 0.616242 2.079350 0.0530
INF 0.002563 0.038029 0.067408 0.9470
CFDI 1.08E-12 1.52E-12 0.710544 0.4870
RESID(-1) -0.220724 0.259638 -0.850123 0.4071
RESID(-2) -0.458022 0.273725 -1.673293 0.1126
RESID(-3) -0.973609 0.285162 -3.414230 0.0033
RESID(-4) -0.354825 0.286563 -1.238207 0.2325
RESID(-5) -0.477957 0.269612 -1.772761 0.0942
RESID(-6) -0.226837 0.269265 -0.842431 0.4112
R-squared 0.516216 Mean dependent var 5.63E-16
Adjusted R-squared 0.203180 S.D. dependent var 0.397159
S.E. of regression 0.354523 Akaike info criterion 1.057419
Sum squared resid 2.136676 Schwarz criterion 1.623196
Log likelihood -3.332573 Hannan-Quinn criter. 1.234613
F-statistic 1.649062 Durbin-Watson stat 2.231417
Prob(F-statistic) 0.171407
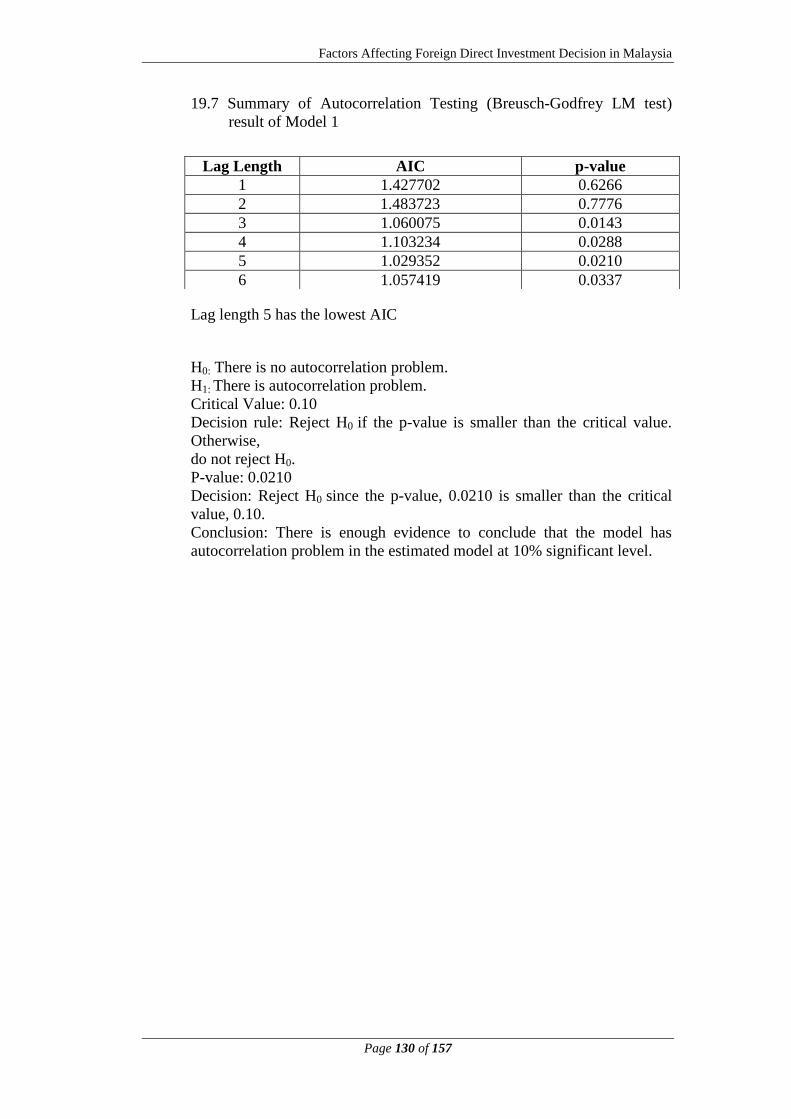
Factors Affecting Foreign Direct Investment Decision in Malaysia
Page 130 of 157
19.7 Summary of Autocorrelation Testing (Breusch-Godfrey LM test)
result of Model 1
Lag length 5 has the lowest AIC
H0: There is no autocorrelation problem.
H1: There is autocorrelation problem.
Critical Value: 0.10
Decision rule: Reject H0 if the p-value is smaller than the critical value.
Otherwise,
do not reject H0.
P-value: 0.0210
Decision: Reject H0 since the p-value, 0.0210 is smaller than the critical
value, 0.10.
Conclusion: There is enough evidence to conclude that the model has
autocorrelation problem in the estimated model at 10% significant level.
Lag Length AIC p-value
1 1.427702 0.6266
2 1.483723 0.7776
3 1.060075 0.0143
4 1.103234 0.0288
5 1.029352 0.0210
6 1.057419 0.0337
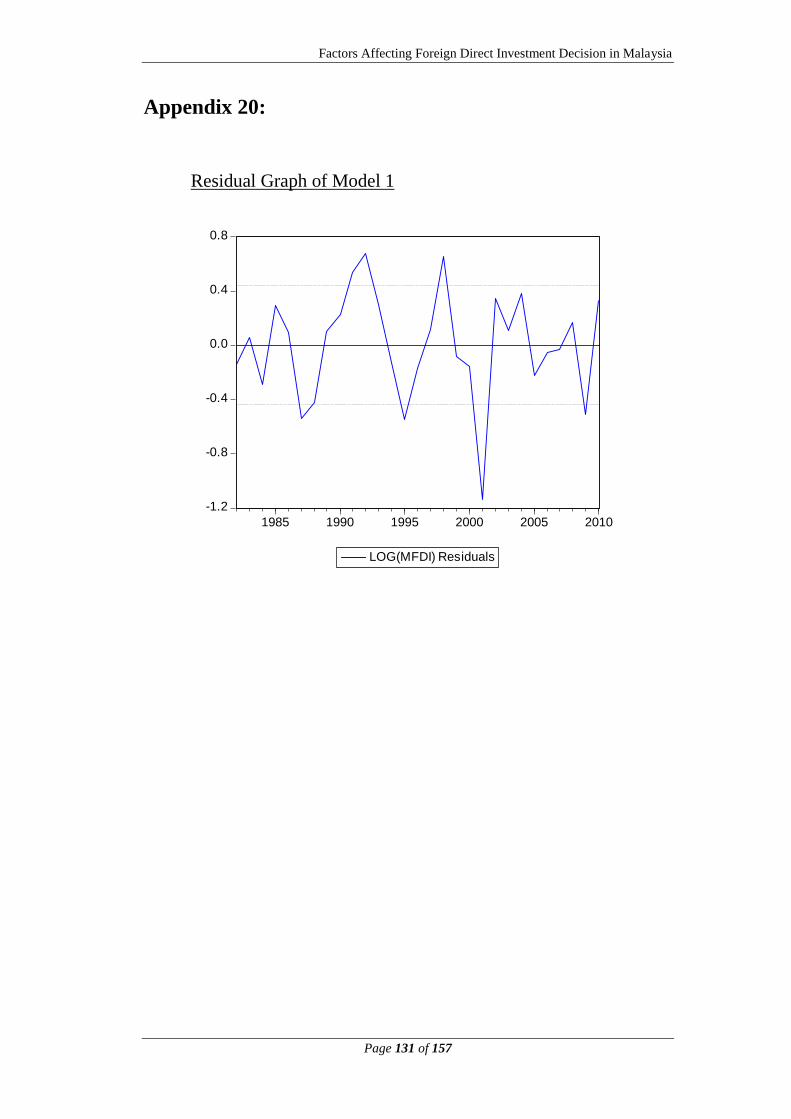
Factors Affecting Foreign Direct Investment Decision in Malaysia
Page 131 of 157
Appendix 20:
Residual Graph of Model 1
-1.2
-0.8
-0.4
0.0
0.4
0.8
1985 1990 1995 2000 2005 2010
LOG(MFDI) Residuals
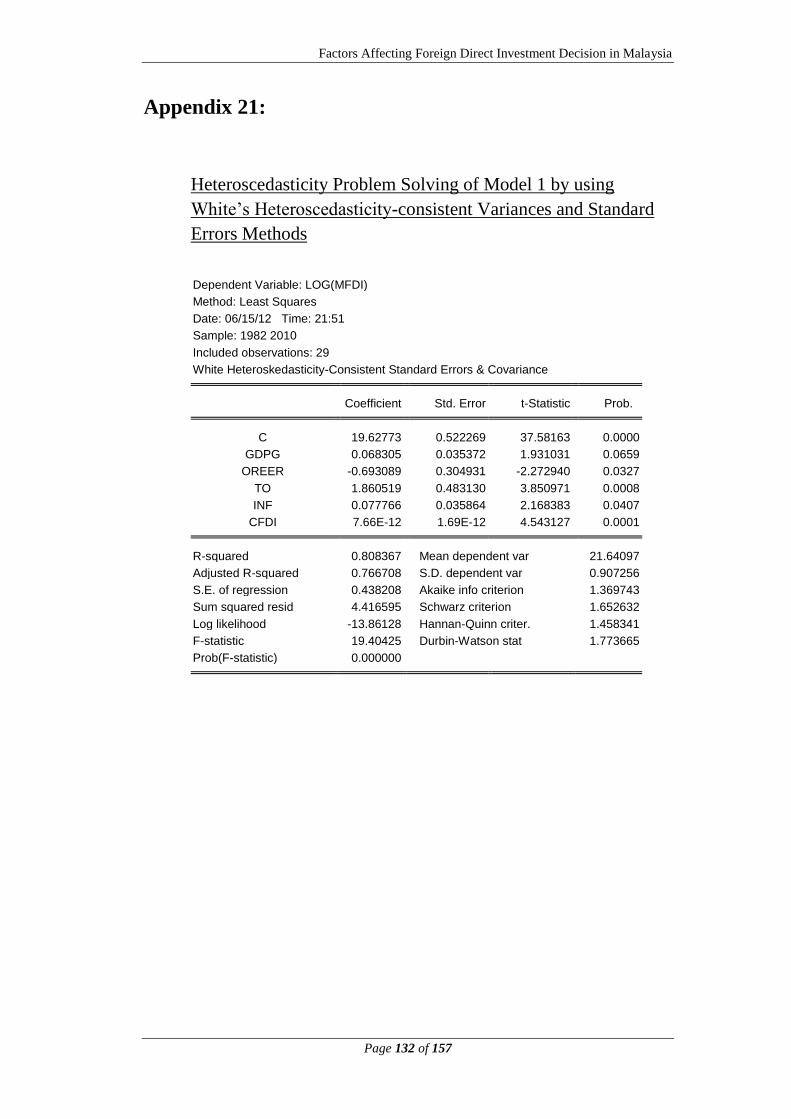
Factors Affecting Foreign Direct Investment Decision in Malaysia
Page 132 of 157
Appendix 21:
Heteroscedasticity Problem Solving of Model 1 by using
White‟s Heteroscedasticity-consistent Variances and Standard
Errors Methods
Dependent Variable: LOG(MFDI)
Method: Least Squares
Date: 06/15/12 Time: 21:51
Sample: 1982 2010
Included observations: 29
White Heteroskedasticity-Consistent Standard Errors & Covariance Coefficient Std. Error t-Statistic Prob.
C 19.62773 0.522269 37.58163 0.0000
GDPG 0.068305 0.035372 1.931031 0.0659
OREER -0.693089 0.304931 -2.272940 0.0327
TO 1.860519 0.483130 3.850971 0.0008
INF 0.077766 0.035864 2.168383 0.0407
CFDI 7.66E-12 1.69E-12 4.543127 0.0001
R-squared 0.808367 Mean dependent var 21.64097
Adjusted R-squared 0.766708 S.D. dependent var 0.907256
S.E. of regression 0.438208 Akaike info criterion 1.369743
Sum squared resid 4.416595 Schwarz criterion 1.652632
Log likelihood -13.86128 Hannan-Quinn criter. 1.458341
F-statistic 19.40425 Durbin-Watson stat 1.773665
Prob(F-statistic) 0.000000
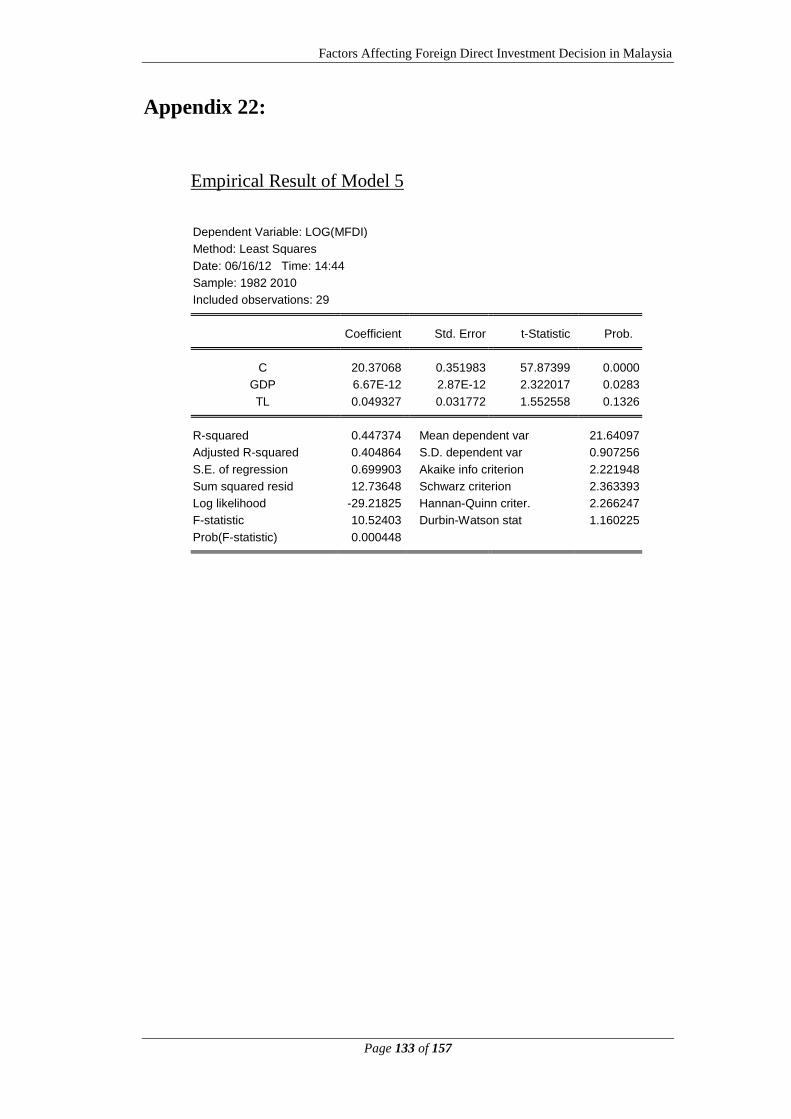
Factors Affecting Foreign Direct Investment Decision in Malaysia
Page 133 of 157
Appendix 22:
Empirical Result of Model 5
Dependent Variable: LOG(MFDI)
Method: Least Squares
Date: 06/16/12 Time: 14:44
Sample: 1982 2010
Included observations: 29 Coefficient Std. Error t-Statistic Prob.
C 20.37068 0.351983 57.87399 0.0000
GDP 6.67E-12 2.87E-12 2.322017 0.0283
TL 0.049327 0.031772 1.552558 0.1326
R-squared 0.447374 Mean dependent var 21.64097
Adjusted R-squared 0.404864 S.D. dependent var 0.907256
S.E. of regression 0.699903 Akaike info criterion 2.221948
Sum squared resid 12.73648 Schwarz criterion 2.363393
Log likelihood -29.21825 Hannan-Quinn criter. 2.266247
F-statistic 10.52403 Durbin-Watson stat 1.160225
Prob(F-statistic) 0.000448
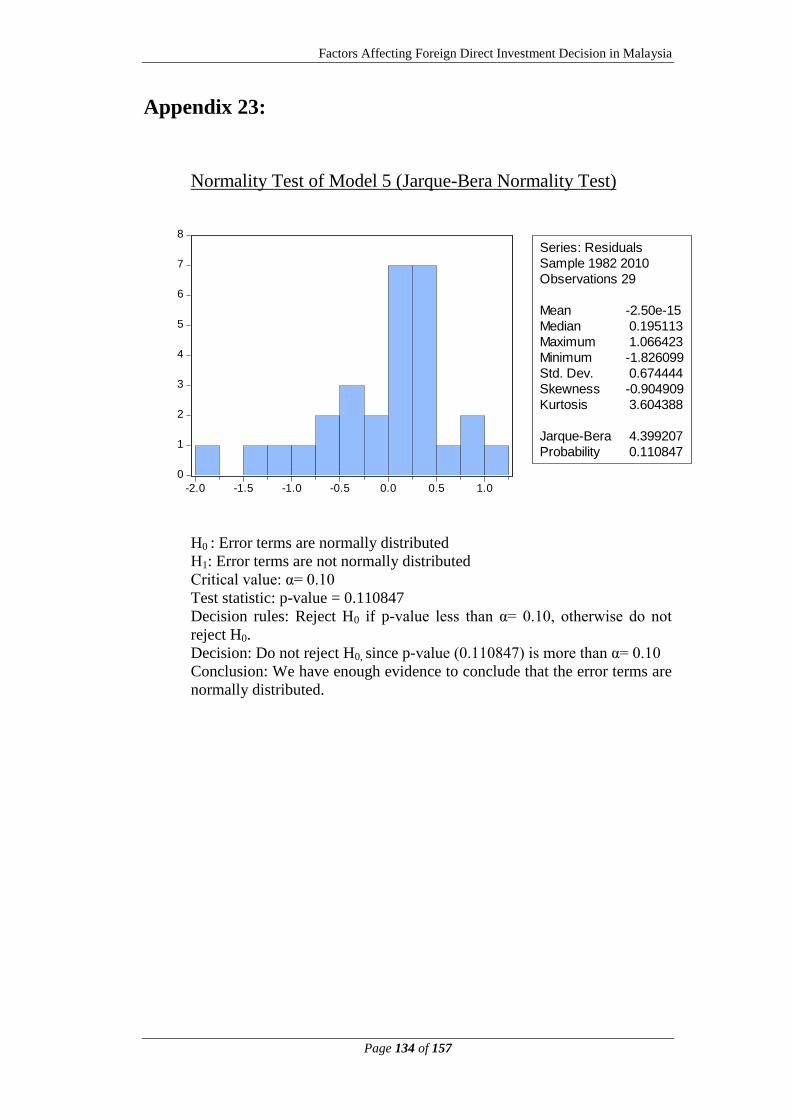
Factors Affecting Foreign Direct Investment Decision in Malaysia
Page 134 of 157
Appendix 23:
Normality Test of Model 5 (Jarque-Bera Normality Test)
H0 : Error terms are normally distributed
H1: Error terms are not normally distributed
Critical value: α= 0.10
Test statistic: p-value = 0.110847
Decision rules: Reject H0 if p-value less than α= 0.10, otherwise do not
reject H0.
Decision: Do not reject H0, since p-value (0.110847) is more than α= 0.10
Conclusion: We have enough evidence to conclude that the error terms are
normally distributed.
0
1
2
3
4
5
6
7
8
-2.0 -1.5 -1.0 -0.5 0.0 0.5 1.0
Series: Residuals
Sample 1982 2010
Observations 29
Mean -2.50e-15
Median 0.195113
Maximum 1.066423
Minimum -1.826099
Std. Dev. 0.674444
Skewness -0.904909
Kurtosis 3.604388
Jarque-Bera 4.399207
Probability 0.110847
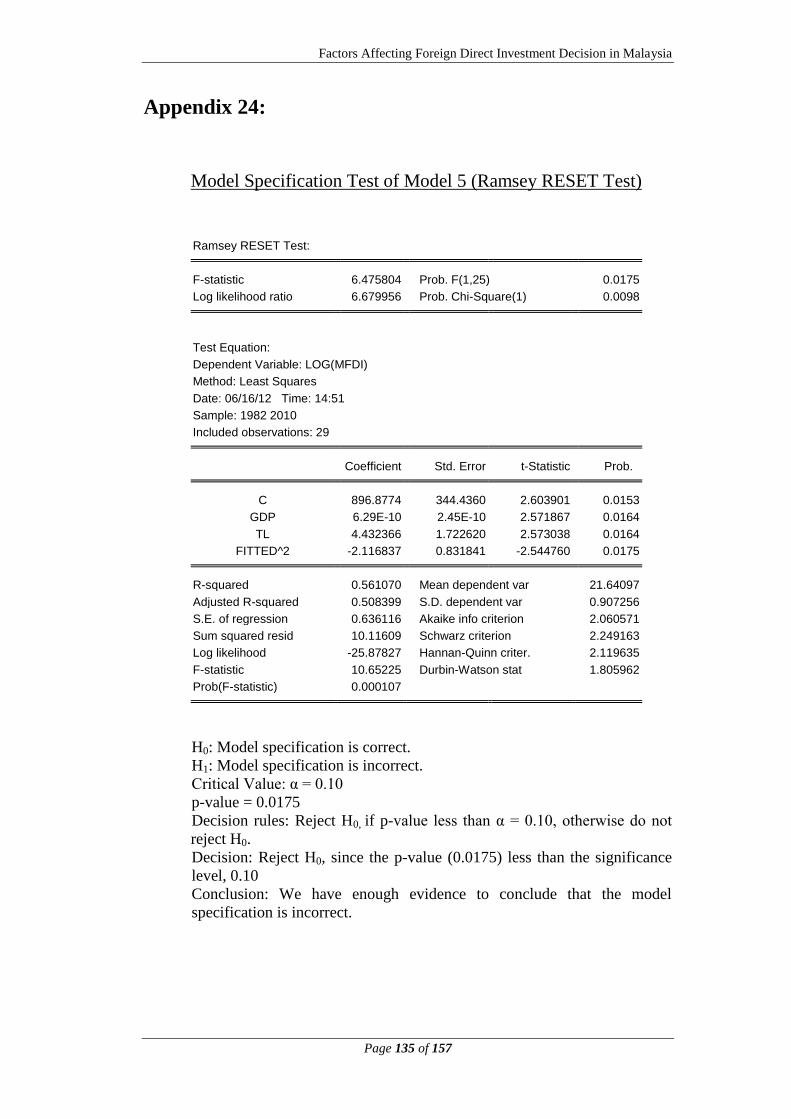
Factors Affecting Foreign Direct Investment Decision in Malaysia
Page 135 of 157
Appendix 24:
Model Specification Test of Model 5 (Ramsey RESET Test)
Ramsey RESET Test:
F-statistic 6.475804 Prob. F(1,25) 0.0175
Log likelihood ratio 6.679956 Prob. Chi-Square(1) 0.0098
Test Equation:
Dependent Variable: LOG(MFDI)
Method: Least Squares
Date: 06/16/12 Time: 14:51
Sample: 1982 2010
Included observations: 29 Coefficient Std. Error t-Statistic Prob.
C 896.8774 344.4360 2.603901 0.0153
GDP 6.29E-10 2.45E-10 2.571867 0.0164
TL 4.432366 1.722620 2.573038 0.0164
FITTED^2 -2.116837 0.831841 -2.544760 0.0175
R-squared 0.561070 Mean dependent var 21.64097
Adjusted R-squared 0.508399 S.D. dependent var 0.907256
S.E. of regression 0.636116 Akaike info criterion 2.060571
Sum squared resid 10.11609 Schwarz criterion 2.249163
Log likelihood -25.87827 Hannan-Quinn criter. 2.119635
F-statistic 10.65225 Durbin-Watson stat 1.805962
Prob(F-statistic) 0.000107
H0: Model specification is correct.
H1: Model specification is incorrect.
Critical Value: α = 0.10
p-value = 0.0175
Decision rules: Reject H0, if p-value less than α = 0.10, otherwise do not
reject H0.
Decision: Reject H0, since the p-value (0.0175) less than the significance
level, 0.10
Conclusion: We have enough evidence to conclude that the model
specification is incorrect.
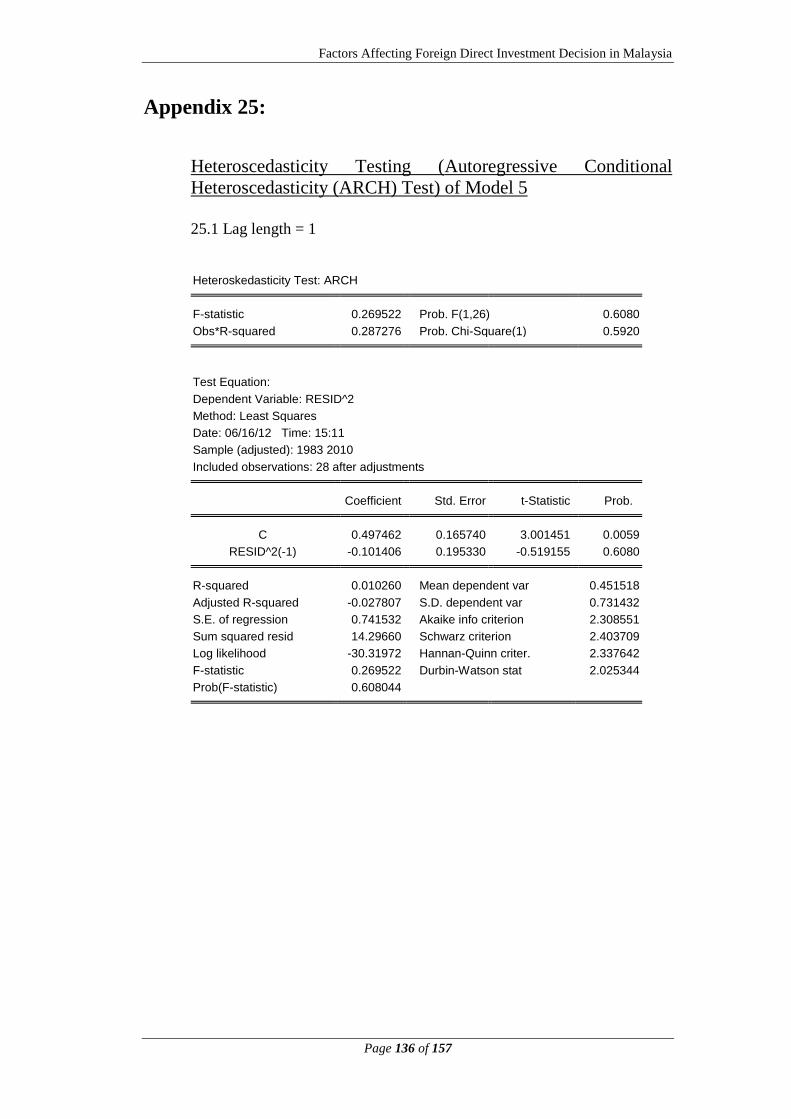
Factors Affecting Foreign Direct Investment Decision in Malaysia
Page 136 of 157
Appendix 25:
Heteroscedasticity Testing (Autoregressive Conditional
Heteroscedasticity (ARCH) Test) of Model 5
25.1 Lag length = 1
Heteroskedasticity Test: ARCH
F-statistic 0.269522 Prob. F(1,26) 0.6080
Obs*R-squared 0.287276 Prob. Chi-Square(1) 0.5920
Test Equation:
Dependent Variable: RESID^2
Method: Least Squares
Date: 06/16/12 Time: 15:11
Sample (adjusted): 1983 2010
Included observations: 28 after adjustments Coefficient Std. Error t-Statistic Prob.
C 0.497462 0.165740 3.001451 0.0059
RESID^2(-1) -0.101406 0.195330 -0.519155 0.6080
R-squared 0.010260 Mean dependent var 0.451518
Adjusted R-squared -0.027807 S.D. dependent var 0.731432
S.E. of regression 0.741532 Akaike info criterion 2.308551
Sum squared resid 14.29660 Schwarz criterion 2.403709
Log likelihood -30.31972 Hannan-Quinn criter. 2.337642
F-statistic 0.269522 Durbin-Watson stat 2.025344
Prob(F-statistic) 0.608044

Factors Affecting Foreign Direct Investment Decision in Malaysia
Page 137 of 157
25.2 Lag length = 2
Heteroskedasticity Test: ARCH
F-statistic 0.321277 Prob. F(2,24) 0.7283
Obs*R-squared 0.704025 Prob. Chi-Square(2) 0.7033
Test Equation:
Dependent Variable: RESID^2
Method: Least Squares
Date: 06/16/12 Time: 15:12
Sample (adjusted): 1984 2010
Included observations: 27 after adjustments Coefficient Std. Error t-Statistic Prob.
C 0.573447 0.197272 2.906880 0.0077
RESID^2(-1) -0.120834 0.201676 -0.599149 0.5547
RESID^2(-2) -0.125176 0.219837 -0.569402 0.5744
R-squared 0.026075 Mean dependent var 0.467428
Adjusted R-squared -0.055085 S.D. dependent var 0.740412
S.E. of regression 0.760531 Akaike info criterion 2.394840
Sum squared resid 13.88178 Schwarz criterion 2.538822
Log likelihood -29.33034 Hannan-Quinn criter. 2.437653
F-statistic 0.321277 Durbin-Watson stat 2.061480
Prob(F-statistic) 0.728293

Factors Affecting Foreign Direct Investment Decision in Malaysia
Page 138 of 157
25.3 Lag length = 3
Heteroskedasticity Test: ARCH
F-statistic 0.636637 Prob. F(3,22) 0.5994
Obs*R-squared 2.076868 Prob. Chi-Square(3) 0.5566
Test Equation:
Dependent Variable: RESID^2
Method: Least Squares
Date: 06/16/12 Time: 15:12
Sample (adjusted): 1985 2010
Included observations: 26 after adjustments Coefficient Std. Error t-Statistic Prob.
C 0.717105 0.232151 3.088962 0.0054
RESID^2(-1) -0.162853 0.207186 -0.786022 0.4402
RESID^2(-2) -0.143923 0.223468 -0.644046 0.5262
RESID^2(-3) -0.241951 0.225136 -1.074688 0.2942
R-squared 0.079880 Mean dependent var 0.479929
Adjusted R-squared -0.045591 S.D. dependent var 0.752163
S.E. of regression 0.769118 Akaike info criterion 2.453494
Sum squared resid 13.01394 Schwarz criterion 2.647048
Log likelihood -27.89542 Hannan-Quinn criter. 2.509231
F-statistic 0.636637 Durbin-Watson stat 2.121372
Prob(F-statistic) 0.599376
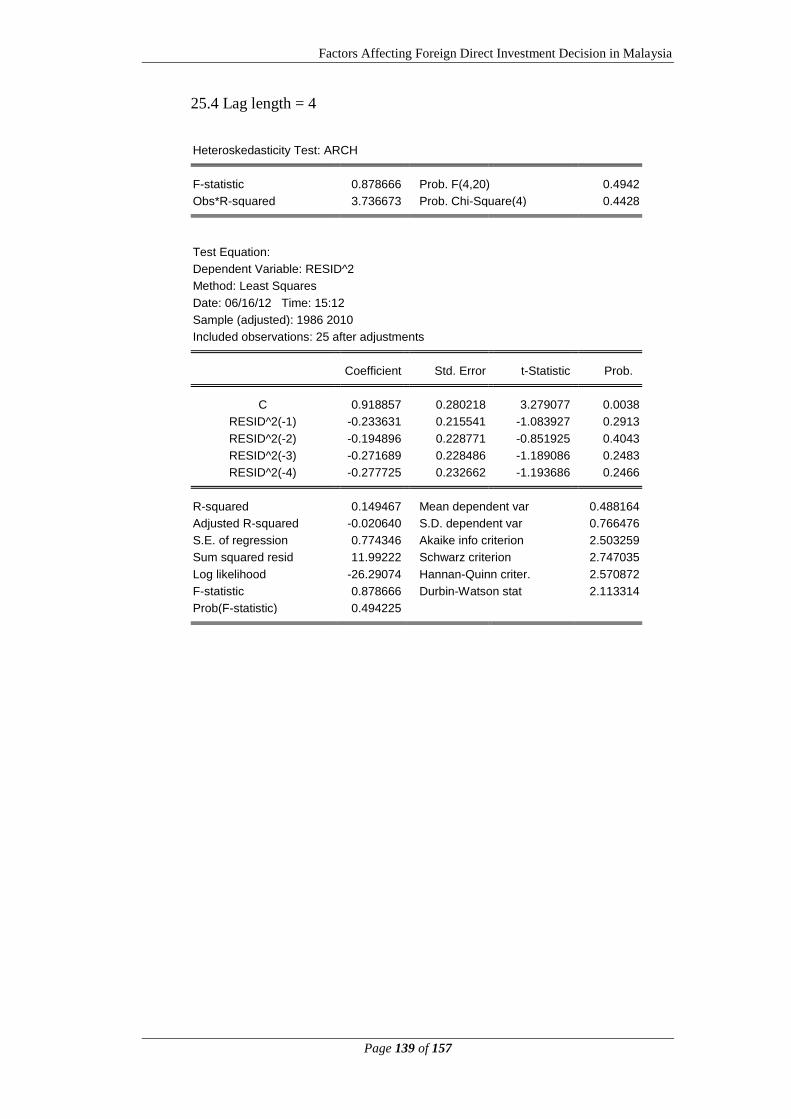
Factors Affecting Foreign Direct Investment Decision in Malaysia
Page 139 of 157
25.4 Lag length = 4
Heteroskedasticity Test: ARCH
F-statistic 0.878666 Prob. F(4,20) 0.4942
Obs*R-squared 3.736673 Prob. Chi-Square(4) 0.4428
Test Equation:
Dependent Variable: RESID^2
Method: Least Squares
Date: 06/16/12 Time: 15:12
Sample (adjusted): 1986 2010
Included observations: 25 after adjustments Coefficient Std. Error t-Statistic Prob.
C 0.918857 0.280218 3.279077 0.0038
RESID^2(-1) -0.233631 0.215541 -1.083927 0.2913
RESID^2(-2) -0.194896 0.228771 -0.851925 0.4043
RESID^2(-3) -0.271689 0.228486 -1.189086 0.2483
RESID^2(-4) -0.277725 0.232662 -1.193686 0.2466
R-squared 0.149467 Mean dependent var 0.488164
Adjusted R-squared -0.020640 S.D. dependent var 0.766476
S.E. of regression 0.774346 Akaike info criterion 2.503259
Sum squared resid 11.99222 Schwarz criterion 2.747035
Log likelihood -26.29074 Hannan-Quinn criter. 2.570872
F-statistic 0.878666 Durbin-Watson stat 2.113314
Prob(F-statistic) 0.494225
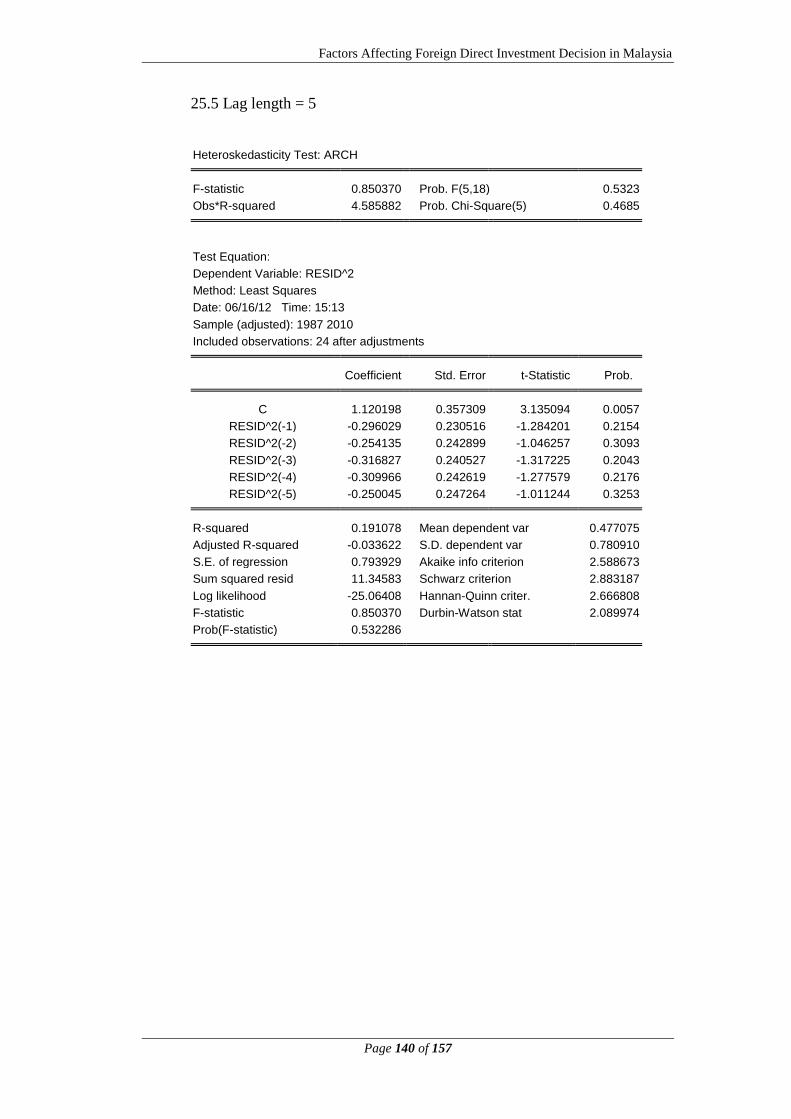
Factors Affecting Foreign Direct Investment Decision in Malaysia
Page 140 of 157
25.5 Lag length = 5
Heteroskedasticity Test: ARCH
F-statistic 0.850370 Prob. F(5,18) 0.5323
Obs*R-squared 4.585882 Prob. Chi-Square(5) 0.4685
Test Equation:
Dependent Variable: RESID^2
Method: Least Squares
Date: 06/16/12 Time: 15:13
Sample (adjusted): 1987 2010
Included observations: 24 after adjustments Coefficient Std. Error t-Statistic Prob.
C 1.120198 0.357309 3.135094 0.0057
RESID^2(-1) -0.296029 0.230516 -1.284201 0.2154
RESID^2(-2) -0.254135 0.242899 -1.046257 0.3093
RESID^2(-3) -0.316827 0.240527 -1.317225 0.2043
RESID^2(-4) -0.309966 0.242619 -1.277579 0.2176
RESID^2(-5) -0.250045 0.247264 -1.011244 0.3253
R-squared 0.191078 Mean dependent var 0.477075
Adjusted R-squared -0.033622 S.D. dependent var 0.780910
S.E. of regression 0.793929 Akaike info criterion 2.588673
Sum squared resid 11.34583 Schwarz criterion 2.883187
Log likelihood -25.06408 Hannan-Quinn criter. 2.666808
F-statistic 0.850370 Durbin-Watson stat 2.089974
Prob(F-statistic) 0.532286
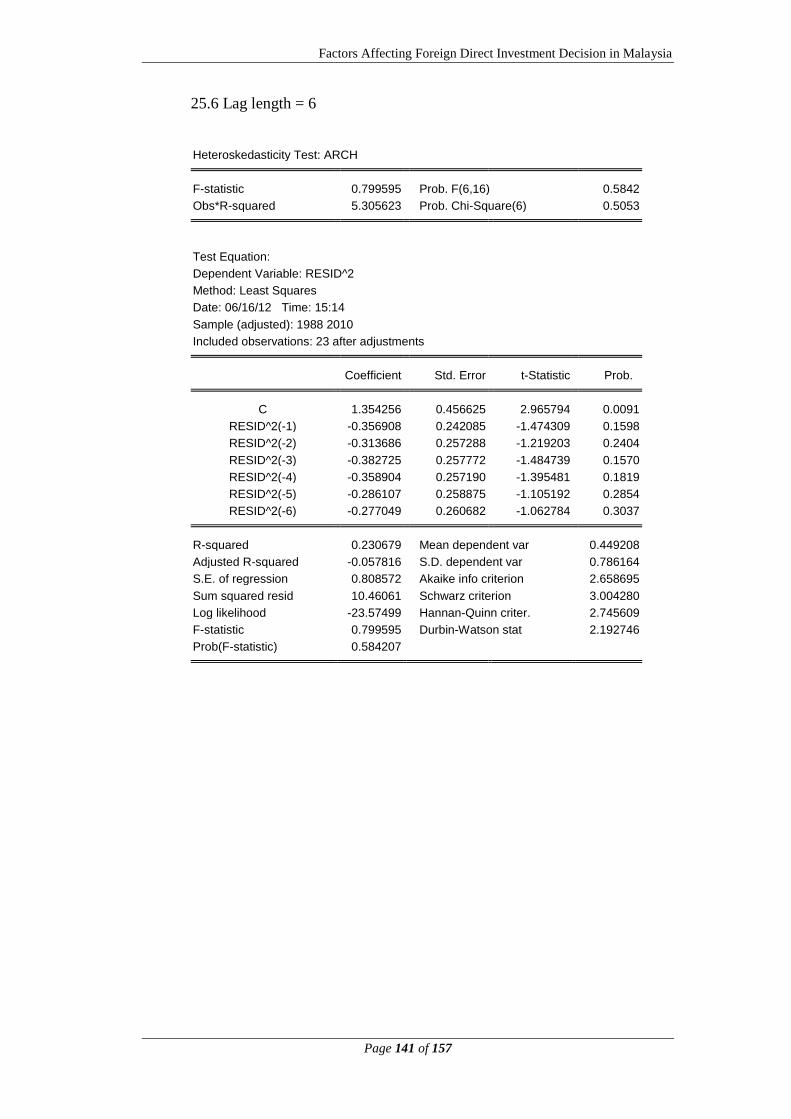
Factors Affecting Foreign Direct Investment Decision in Malaysia
Page 141 of 157
25.6 Lag length = 6
Heteroskedasticity Test: ARCH
F-statistic 0.799595 Prob. F(6,16) 0.5842
Obs*R-squared 5.305623 Prob. Chi-Square(6) 0.5053
Test Equation:
Dependent Variable: RESID^2
Method: Least Squares
Date: 06/16/12 Time: 15:14
Sample (adjusted): 1988 2010
Included observations: 23 after adjustments Coefficient Std. Error t-Statistic Prob.
C 1.354256 0.456625 2.965794 0.0091
RESID^2(-1) -0.356908 0.242085 -1.474309 0.1598
RESID^2(-2) -0.313686 0.257288 -1.219203 0.2404
RESID^2(-3) -0.382725 0.257772 -1.484739 0.1570
RESID^2(-4) -0.358904 0.257190 -1.395481 0.1819
RESID^2(-5) -0.286107 0.258875 -1.105192 0.2854
RESID^2(-6) -0.277049 0.260682 -1.062784 0.3037
R-squared 0.230679 Mean dependent var 0.449208
Adjusted R-squared -0.057816 S.D. dependent var 0.786164
S.E. of regression 0.808572 Akaike info criterion 2.658695
Sum squared resid 10.46061 Schwarz criterion 3.004280
Log likelihood -23.57499 Hannan-Quinn criter. 2.745609
F-statistic 0.799595 Durbin-Watson stat 2.192746
Prob(F-statistic) 0.584207
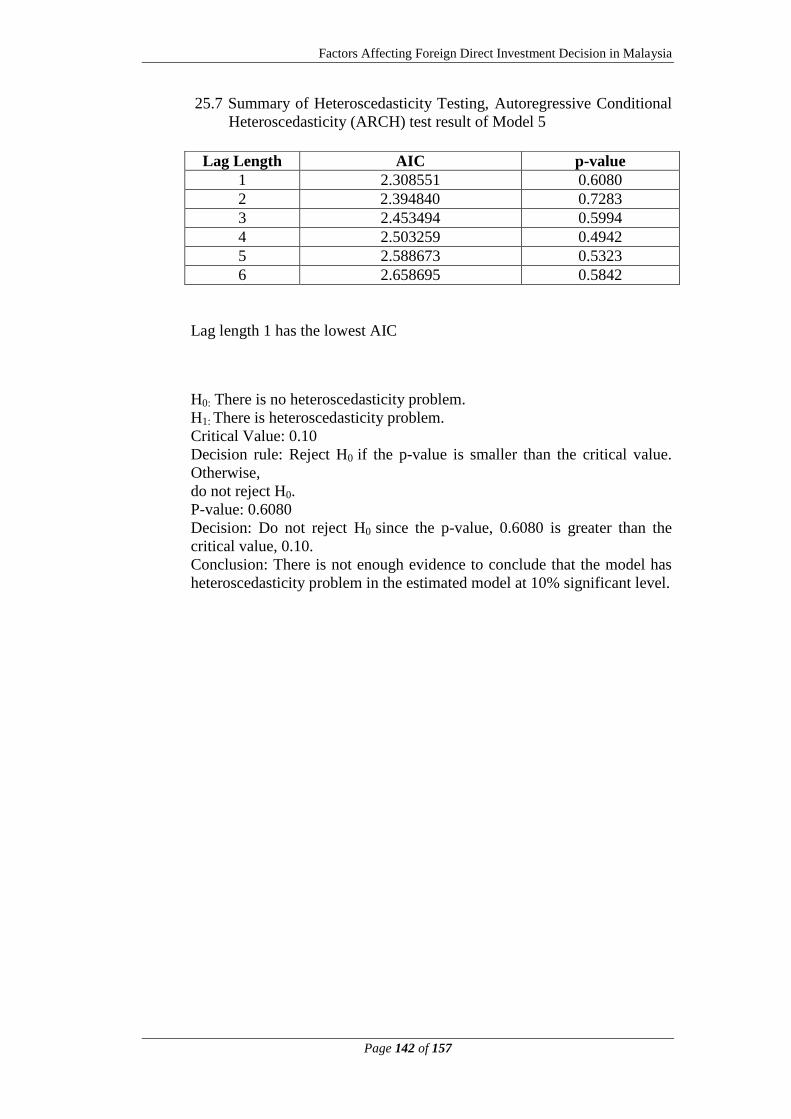
Factors Affecting Foreign Direct Investment Decision in Malaysia
Page 142 of 157
25.7 Summary of Heteroscedasticity Testing, Autoregressive Conditional
Heteroscedasticity (ARCH) test result of Model 5
Lag length 1 has the lowest AIC
H0: There is no heteroscedasticity problem.
H1: There is heteroscedasticity problem.
Critical Value: 0.10
Decision rule: Reject H0 if the p-value is smaller than the critical value.
Otherwise,
do not reject H0.
P-value: 0.6080
Decision: Do not reject H0 since the p-value, 0.6080 is greater than the
critical value, 0.10.
Conclusion: There is not enough evidence to conclude that the model has
heteroscedasticity problem in the estimated model at 10% significant level.
Lag Length AIC p-value
1 2.308551 0.6080
2 2.394840 0.7283
3 2.453494 0.5994
4 2.503259 0.4942
5 2.588673 0.5323
6 2.658695 0.5842
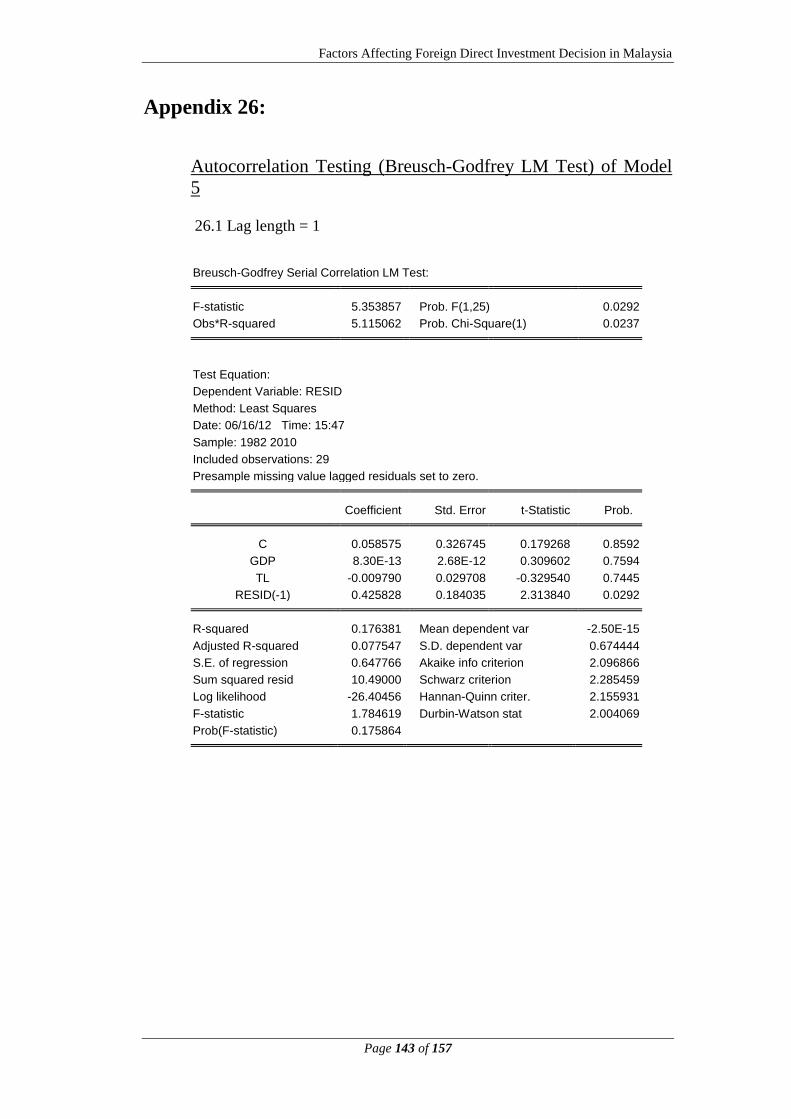
Factors Affecting Foreign Direct Investment Decision in Malaysia
Page 143 of 157
Appendix 26:
Autocorrelation Testing (Breusch-Godfrey LM Test) of Model
5
26.1 Lag length = 1
Breusch-Godfrey Serial Correlation LM Test:
F-statistic 5.353857 Prob. F(1,25) 0.0292
Obs*R-squared 5.115062 Prob. Chi-Square(1) 0.0237
Test Equation:
Dependent Variable: RESID
Method: Least Squares
Date: 06/16/12 Time: 15:47
Sample: 1982 2010
Included observations: 29
Presample missing value lagged residuals set to zero. Coefficient Std. Error t-Statistic Prob.
C 0.058575 0.326745 0.179268 0.8592
GDP 8.30E-13 2.68E-12 0.309602 0.7594
TL -0.009790 0.029708 -0.329540 0.7445
RESID(-1) 0.425828 0.184035 2.313840 0.0292
R-squared 0.176381 Mean dependent var -2.50E-15
Adjusted R-squared 0.077547 S.D. dependent var 0.674444
S.E. of regression 0.647766 Akaike info criterion 2.096866
Sum squared resid 10.49000 Schwarz criterion 2.285459
Log likelihood -26.40456 Hannan-Quinn criter. 2.155931
F-statistic 1.784619 Durbin-Watson stat 2.004069
Prob(F-statistic) 0.175864
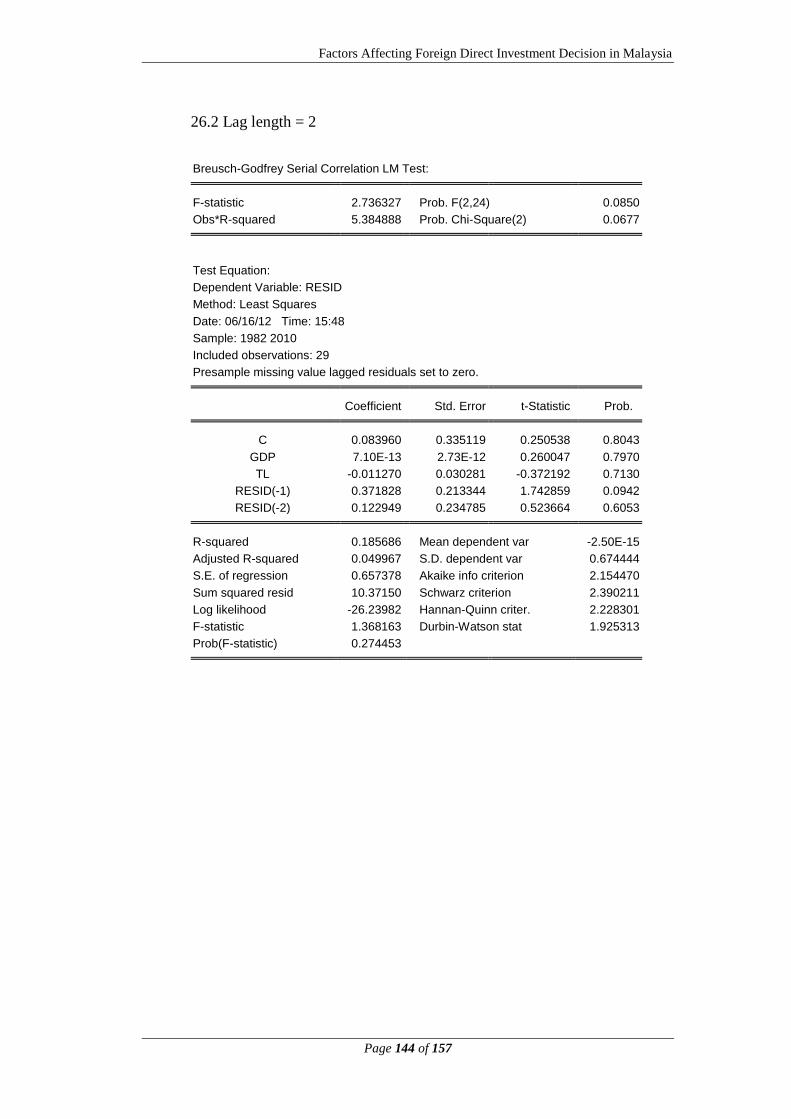
Factors Affecting Foreign Direct Investment Decision in Malaysia
Page 144 of 157
26.2 Lag length = 2
Breusch-Godfrey Serial Correlation LM Test:
F-statistic 2.736327 Prob. F(2,24) 0.0850
Obs*R-squared 5.384888 Prob. Chi-Square(2) 0.0677
Test Equation:
Dependent Variable: RESID
Method: Least Squares
Date: 06/16/12 Time: 15:48
Sample: 1982 2010
Included observations: 29
Presample missing value lagged residuals set to zero. Coefficient Std. Error t-Statistic Prob.
C 0.083960 0.335119 0.250538 0.8043
GDP 7.10E-13 2.73E-12 0.260047 0.7970
TL -0.011270 0.030281 -0.372192 0.7130
RESID(-1) 0.371828 0.213344 1.742859 0.0942
RESID(-2) 0.122949 0.234785 0.523664 0.6053
R-squared 0.185686 Mean dependent var -2.50E-15
Adjusted R-squared 0.049967 S.D. dependent var 0.674444
S.E. of regression 0.657378 Akaike info criterion 2.154470
Sum squared resid 10.37150 Schwarz criterion 2.390211
Log likelihood -26.23982 Hannan-Quinn criter. 2.228301
F-statistic 1.368163 Durbin-Watson stat 1.925313
Prob(F-statistic) 0.274453
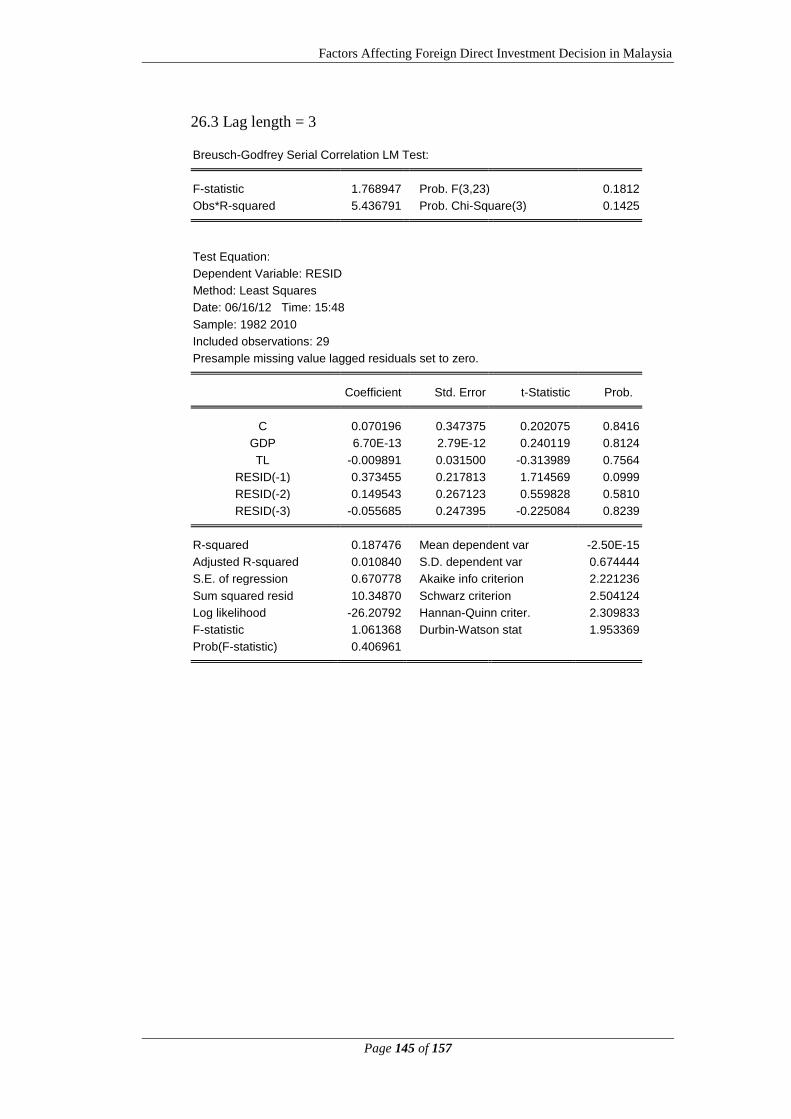
Factors Affecting Foreign Direct Investment Decision in Malaysia
Page 145 of 157
26.3 Lag length = 3
Breusch-Godfrey Serial Correlation LM Test:
F-statistic 1.768947 Prob. F(3,23) 0.1812
Obs*R-squared 5.436791 Prob. Chi-Square(3) 0.1425
Test Equation:
Dependent Variable: RESID
Method: Least Squares
Date: 06/16/12 Time: 15:48
Sample: 1982 2010
Included observations: 29
Presample missing value lagged residuals set to zero. Coefficient Std. Error t-Statistic Prob.
C 0.070196 0.347375 0.202075 0.8416
GDP 6.70E-13 2.79E-12 0.240119 0.8124
TL -0.009891 0.031500 -0.313989 0.7564
RESID(-1) 0.373455 0.217813 1.714569 0.0999
RESID(-2) 0.149543 0.267123 0.559828 0.5810
RESID(-3) -0.055685 0.247395 -0.225084 0.8239
R-squared 0.187476 Mean dependent var -2.50E-15
Adjusted R-squared 0.010840 S.D. dependent var 0.674444
S.E. of regression 0.670778 Akaike info criterion 2.221236
Sum squared resid 10.34870 Schwarz criterion 2.504124
Log likelihood -26.20792 Hannan-Quinn criter. 2.309833
F-statistic 1.061368 Durbin-Watson stat 1.953369
Prob(F-statistic) 0.406961

Factors Affecting Foreign Direct Investment Decision in Malaysia
Page 146 of 157
26.4 Lag length = 4
Breusch-Godfrey Serial Correlation LM Test:
F-statistic 1.686436 Prob. F(4,22) 0.1890
Obs*R-squared 6.805411 Prob. Chi-Square(4) 0.1465
Test Equation:
Dependent Variable: RESID
Method: Least Squares
Date: 06/16/12 Time: 15:48
Sample: 1982 2010
Included observations: 29
Presample missing value lagged residuals set to zero. Coefficient Std. Error t-Statistic Prob.
C -0.011906 0.351846 -0.033838 0.9733
GDP -7.22E-14 2.84E-12 -0.025405 0.9800
TL 0.001270 0.032694 0.038832 0.9694
RESID(-1) 0.335986 0.218524 1.537524 0.1384
RESID(-2) 0.203354 0.269072 0.755760 0.4578
RESID(-3) 0.068606 0.267689 0.256292 0.8001
RESID(-4) -0.300284 0.257812 -1.164740 0.2566
R-squared 0.234669 Mean dependent var -2.50E-15
Adjusted R-squared 0.025943 S.D. dependent var 0.674444
S.E. of regression 0.665638 Akaike info criterion 2.230363
Sum squared resid 9.747621 Schwarz criterion 2.560400
Log likelihood -25.34027 Hannan-Quinn criter. 2.333727
F-statistic 1.124291 Durbin-Watson stat 2.069574
Prob(F-statistic) 0.380745
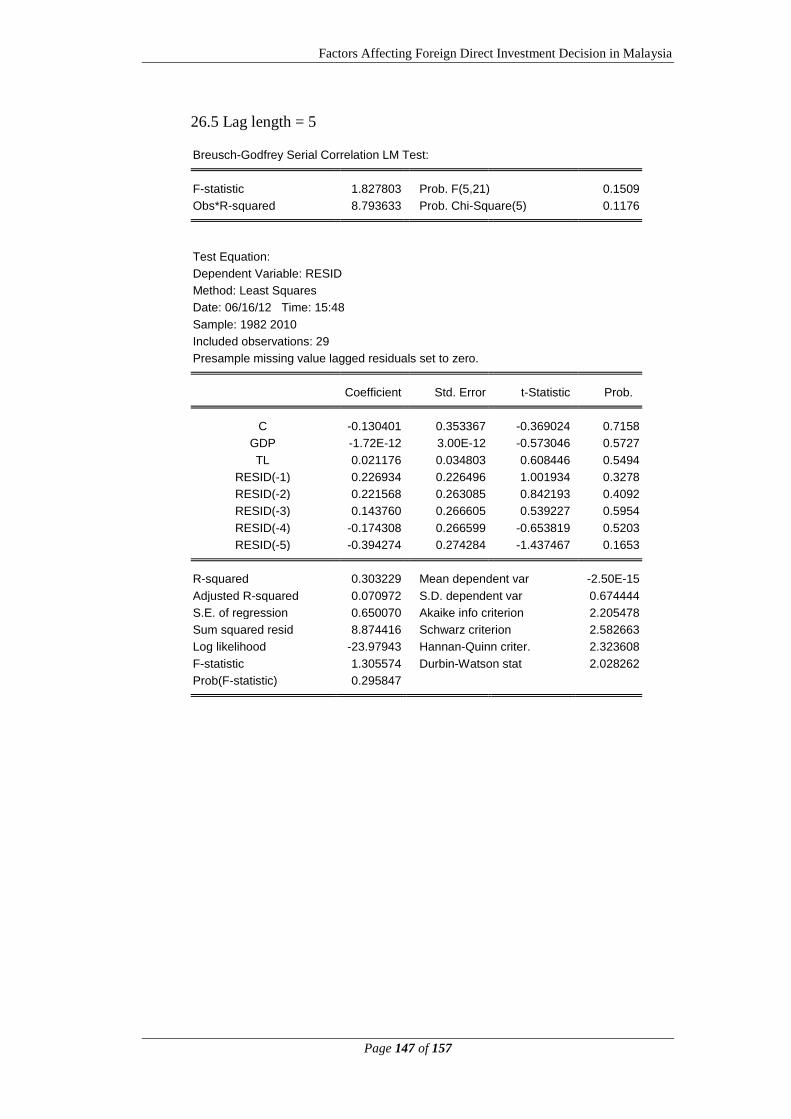
Factors Affecting Foreign Direct Investment Decision in Malaysia
Page 147 of 157
26.5 Lag length = 5
Breusch-Godfrey Serial Correlation LM Test:
F-statistic 1.827803 Prob. F(5,21) 0.1509
Obs*R-squared 8.793633 Prob. Chi-Square(5) 0.1176
Test Equation:
Dependent Variable: RESID
Method: Least Squares
Date: 06/16/12 Time: 15:48
Sample: 1982 2010
Included observations: 29
Presample missing value lagged residuals set to zero. Coefficient Std. Error t-Statistic Prob.
C -0.130401 0.353367 -0.369024 0.7158
GDP -1.72E-12 3.00E-12 -0.573046 0.5727
TL 0.021176 0.034803 0.608446 0.5494
RESID(-1) 0.226934 0.226496 1.001934 0.3278
RESID(-2) 0.221568 0.263085 0.842193 0.4092
RESID(-3) 0.143760 0.266605 0.539227 0.5954
RESID(-4) -0.174308 0.266599 -0.653819 0.5203
RESID(-5) -0.394274 0.274284 -1.437467 0.1653
R-squared 0.303229 Mean dependent var -2.50E-15
Adjusted R-squared 0.070972 S.D. dependent var 0.674444
S.E. of regression 0.650070 Akaike info criterion 2.205478
Sum squared resid 8.874416 Schwarz criterion 2.582663
Log likelihood -23.97943 Hannan-Quinn criter. 2.323608
F-statistic 1.305574 Durbin-Watson stat 2.028262
Prob(F-statistic) 0.295847
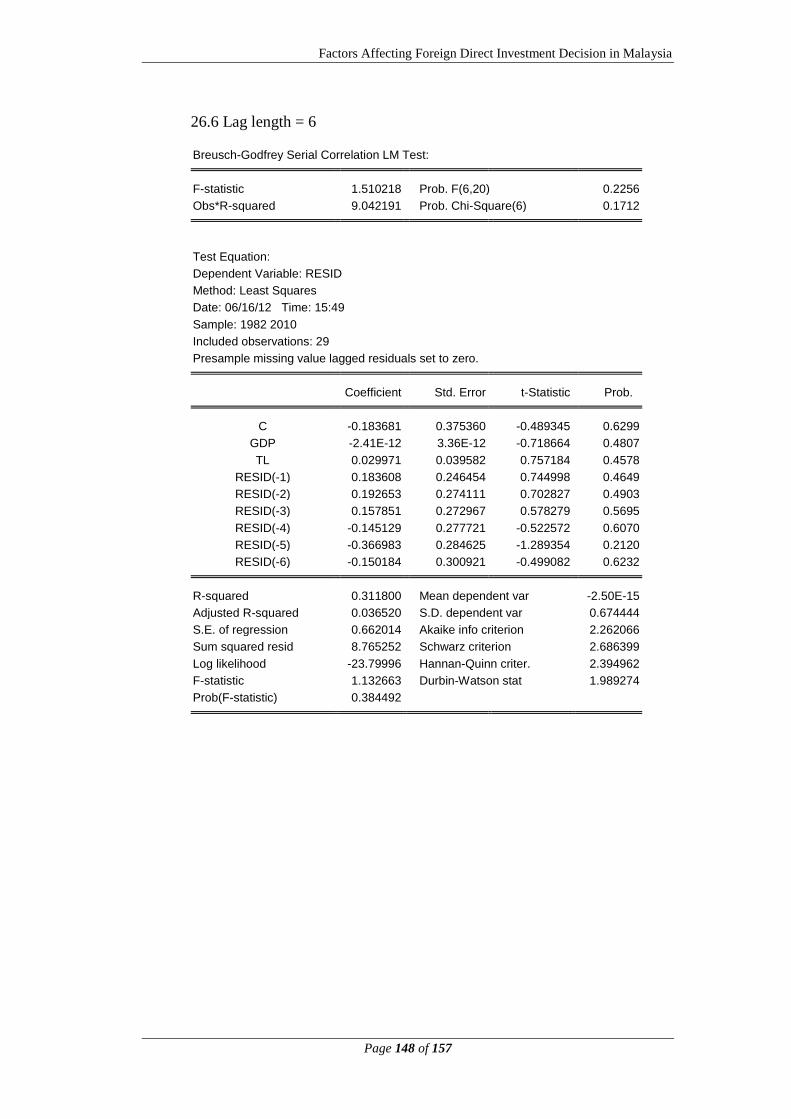
Factors Affecting Foreign Direct Investment Decision in Malaysia
Page 148 of 157
26.6 Lag length = 6
Breusch-Godfrey Serial Correlation LM Test:
F-statistic 1.510218 Prob. F(6,20) 0.2256
Obs*R-squared 9.042191 Prob. Chi-Square(6) 0.1712
Test Equation:
Dependent Variable: RESID
Method: Least Squares
Date: 06/16/12 Time: 15:49
Sample: 1982 2010
Included observations: 29
Presample missing value lagged residuals set to zero. Coefficient Std. Error t-Statistic Prob.
C -0.183681 0.375360 -0.489345 0.6299
GDP -2.41E-12 3.36E-12 -0.718664 0.4807
TL 0.029971 0.039582 0.757184 0.4578
RESID(-1) 0.183608 0.246454 0.744998 0.4649
RESID(-2) 0.192653 0.274111 0.702827 0.4903
RESID(-3) 0.157851 0.272967 0.578279 0.5695
RESID(-4) -0.145129 0.277721 -0.522572 0.6070
RESID(-5) -0.366983 0.284625 -1.289354 0.2120
RESID(-6) -0.150184 0.300921 -0.499082 0.6232
R-squared 0.311800 Mean dependent var -2.50E-15
Adjusted R-squared 0.036520 S.D. dependent var 0.674444
S.E. of regression 0.662014 Akaike info criterion 2.262066
Sum squared resid 8.765252 Schwarz criterion 2.686399
Log likelihood -23.79996 Hannan-Quinn criter. 2.394962
F-statistic 1.132663 Durbin-Watson stat 1.989274
Prob(F-statistic) 0.384492
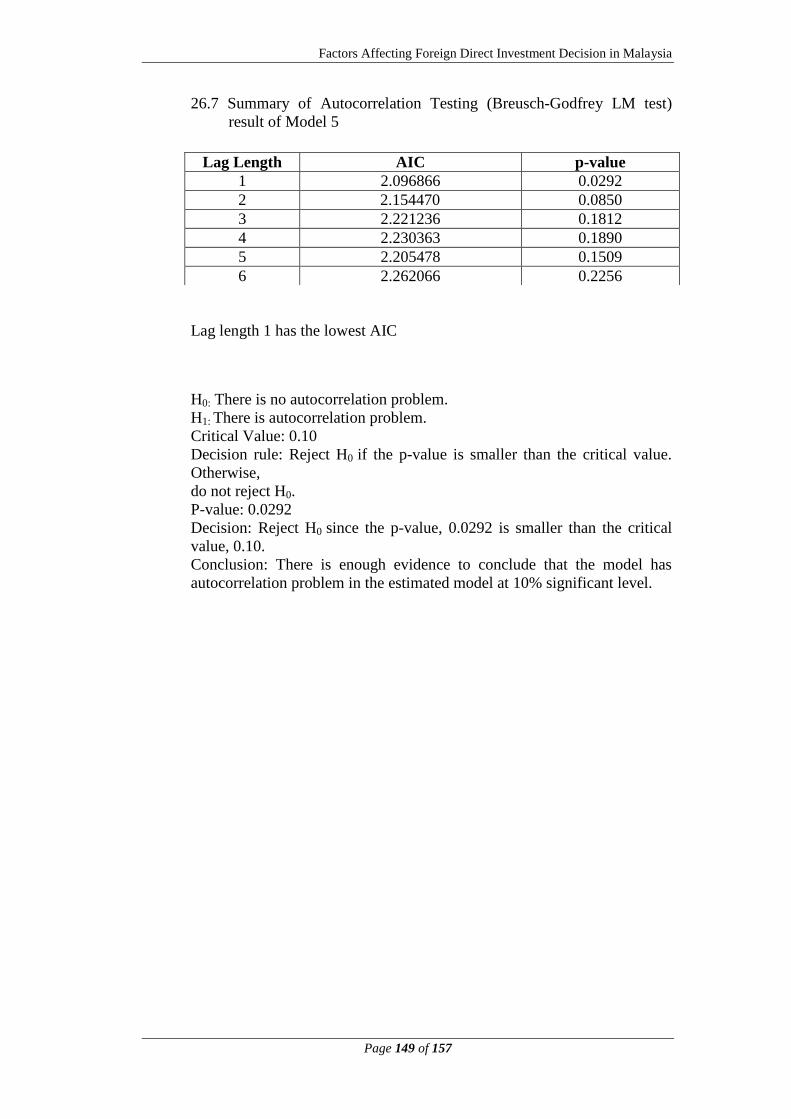
Factors Affecting Foreign Direct Investment Decision in Malaysia
Page 149 of 157
26.7 Summary of Autocorrelation Testing (Breusch-Godfrey LM test)
result of Model 5
Lag length 1 has the lowest AIC
H0: There is no autocorrelation problem.
H1: There is autocorrelation problem.
Critical Value: 0.10
Decision rule: Reject H0 if the p-value is smaller than the critical value.
Otherwise,
do not reject H0.
P-value: 0.0292
Decision: Reject H0 since the p-value, 0.0292 is smaller than the critical
value, 0.10.
Conclusion: There is enough evidence to conclude that the model has
autocorrelation problem in the estimated model at 10% significant level.
Lag Length AIC p-value
1 2.096866 0.0292
2 2.154470 0.0850
3 2.221236 0.1812
4 2.230363 0.1890
5 2.205478 0.1509
6 2.262066 0.2256
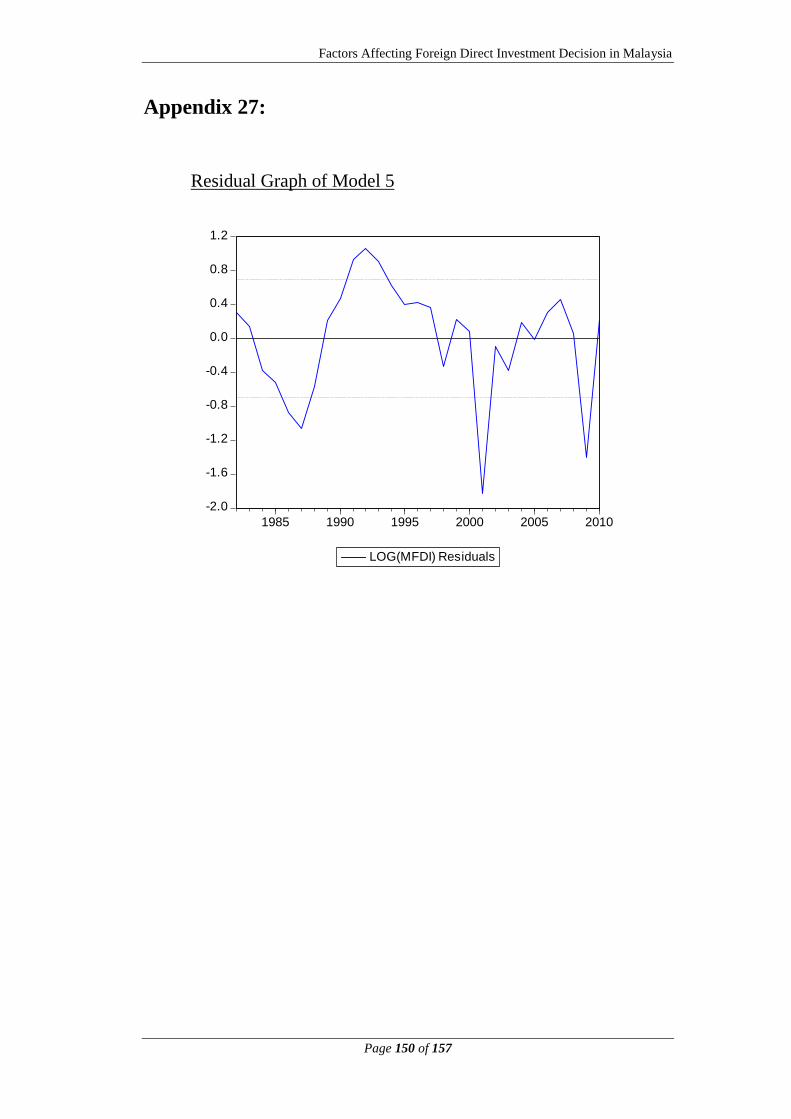
Factors Affecting Foreign Direct Investment Decision in Malaysia
Page 150 of 157
Appendix 27:
Residual Graph of Model 5
-2.0
-1.6
-1.2
-0.8
-0.4
0.0
0.4
0.8
1.2
1985 1990 1995 2000 2005 2010
LOG(MFDI) Residuals
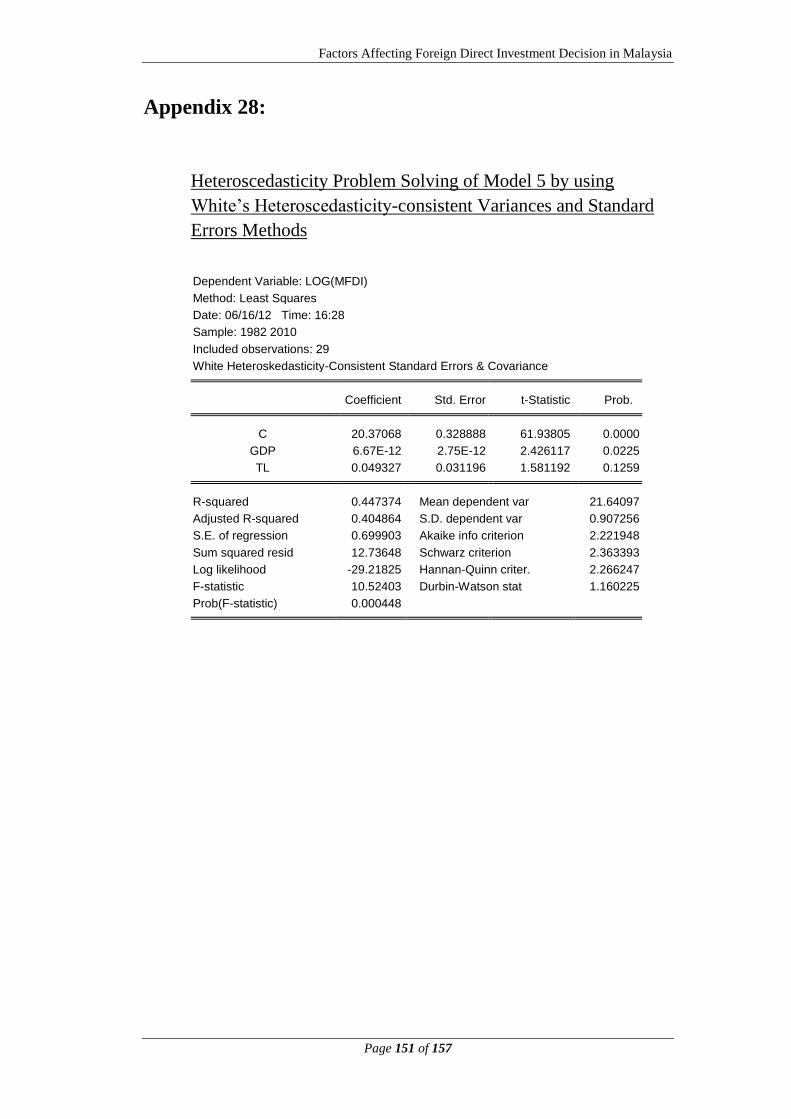
Factors Affecting Foreign Direct Investment Decision in Malaysia
Page 151 of 157
Appendix 28:
Heteroscedasticity Problem Solving of Model 5 by using
White‟s Heteroscedasticity-consistent Variances and Standard
Errors Methods
Dependent Variable: LOG(MFDI)
Method: Least Squares
Date: 06/16/12 Time: 16:28
Sample: 1982 2010
Included observations: 29
White Heteroskedasticity-Consistent Standard Errors & Covariance Coefficient Std. Error t-Statistic Prob.
C 20.37068 0.328888 61.93805 0.0000
GDP 6.67E-12 2.75E-12 2.426117 0.0225
TL 0.049327 0.031196 1.581192 0.1259
R-squared 0.447374 Mean dependent var 21.64097
Adjusted R-squared 0.404864 S.D. dependent var 0.907256
S.E. of regression 0.699903 Akaike info criterion 2.221948
Sum squared resid 12.73648 Schwarz criterion 2.363393
Log likelihood -29.21825 Hannan-Quinn criter. 2.266247
F-statistic 10.52403 Durbin-Watson stat 1.160225
Prob(F-statistic) 0.000448
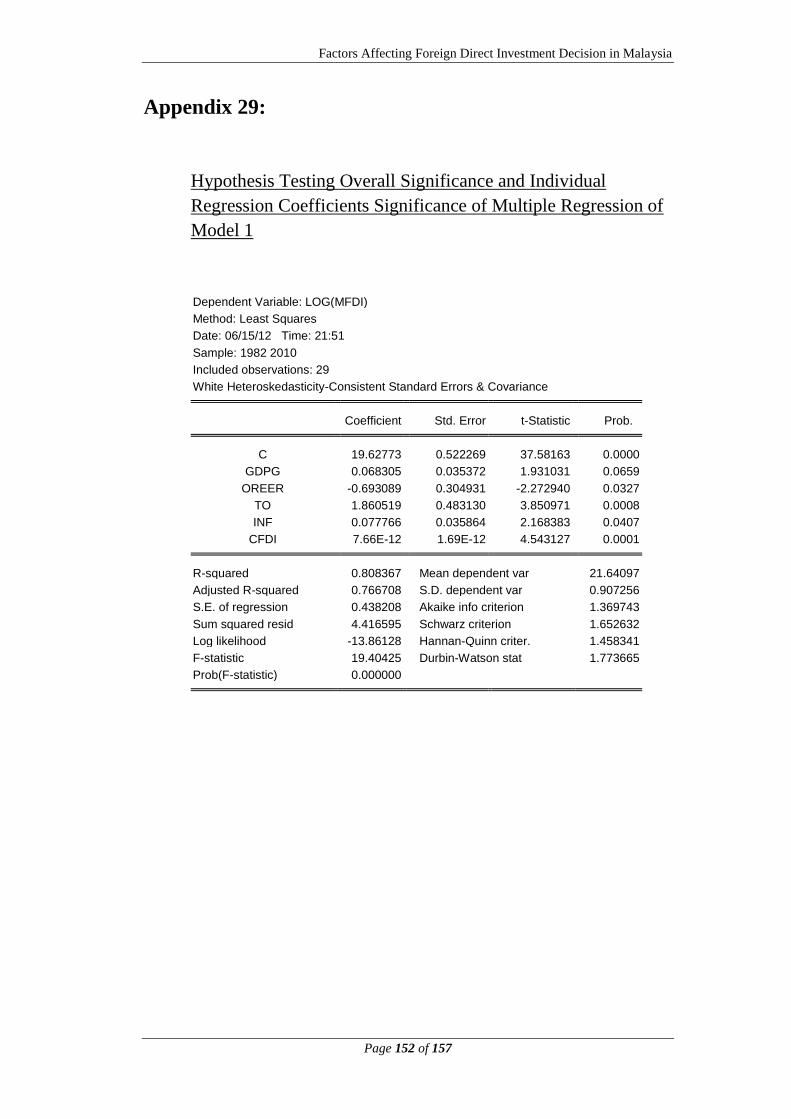
Factors Affecting Foreign Direct Investment Decision in Malaysia
Page 152 of 157
Appendix 29:
Hypothesis Testing Overall Significance and Individual
Regression Coefficients Significance of Multiple Regression of
Model 1
Dependent Variable: LOG(MFDI)
Method: Least Squares
Date: 06/15/12 Time: 21:51
Sample: 1982 2010
Included observations: 29
White Heteroskedasticity-Consistent Standard Errors & Covariance Coefficient Std. Error t-Statistic Prob.
C 19.62773 0.522269 37.58163 0.0000
GDPG 0.068305 0.035372 1.931031 0.0659
OREER -0.693089 0.304931 -2.272940 0.0327
TO 1.860519 0.483130 3.850971 0.0008
INF 0.077766 0.035864 2.168383 0.0407
CFDI 7.66E-12 1.69E-12 4.543127 0.0001
R-squared 0.808367 Mean dependent var 21.64097
Adjusted R-squared 0.766708 S.D. dependent var 0.907256
S.E. of regression 0.438208 Akaike info criterion 1.369743
Sum squared resid 4.416595 Schwarz criterion 1.652632
Log likelihood -13.86128 Hannan-Quinn criter. 1.458341
F-statistic 19.40425 Durbin-Watson stat 1.773665
Prob(F-statistic) 0.000000
Factors Affecting Foreign Direct Investment Decision in Malaysia
Page 153 of 157
29.1 Hypothesis Testing Overall significance and of multiple regression of
model 1
H0: β17 = β18 = β19 = β20 = β21 = 0
H1: At least one coefficient is different from zero.
Critical Value: 0.10
Decision rule: Reject H0 if the p-value is smaller than the critical
value. Otherwise,
do not reject H0.
P-value: 0.000000
Decision: Reject H0 since the p-value, 0.000000 is less than the
critical value, 0.10.
Conclusion: There is enough evidence to conclude that the model is
significant to explain Malaysia FDI inflows.
29.2 Hypothesis Testing of Individual Regression Coefficients
Significance of Model 1
29.2.1 Hypothesis Testing of Significance of β17: Gross Domestic
Product Growth, GDPG, of Model 1
H0: β17 = 0
H1: β17 ≠ 0
Critical Value: 0.10
Decision rule: Reject H0 if the p-value is smaller than the critical
value. Otherwise,
do not reject H0.
P-value: 0.0659
Decision: Reject H0 since the p-value, 0.0659 is smaller than the
critical value, 0.10.
Conclusion: There is enough evidence to conclude that the β17 ≠
0. This shows that β17: Gross Domestic Product Growth, GDPG,
significantly affect Malaysia FDI inflows at 0.10 significance
level.
Factors Affecting Foreign Direct Investment Decision in Malaysia
Page 154 of 157
29.2.2 Hypothesis Testing of Significance of β18: Official Real Exchange
Rate, OREER of Model 1
H0: β18 = 0
H1: β18 ≠ 0
Critical Value: 0.10
Decision rule: Reject H0 if the p-value is smaller than the critical
value. Otherwise,
do not reject H0.
P-value: 0.0327
Decision: Reject H0 since the p-value, 0.0327 is less than the
critical value, 0.10.
Conclusion: There is enough evidence to conclude that the β18 ≠ 0.
This shows that β18: Official Real Exchange Rate, OREER,
significantly affects Malaysia FDI inflows at 0.10 significance level.
29.2.3 Hypothesis Testing of Significance of β19: Trade Openness, TO of
Model 1
H0: β19 = 0
H1: β19 ≠ 0
Critical Value: 0.10
Decision rule: Reject H0 if the p-value is smaller than the critical
value. Otherwise,
do not reject H0.
P-value: 0.0008
Decision: Reject H0 since the p-value, 0.0008 is less than the
critical value, 0.10.
Conclusion: There is enough evidence to conclude that the β19 ≠ 0.
This shows that β19: Trade Openness, TO, significantly affects
Malaysia FDI inflows at 0.10 significance level.
29.2.4 Hypothesis Testing of Significance of β20: Inflation Rate, Consumer
Prices, INF of Model 1
H0: β20 = 0
H1: β20 ≠ 0
Critical Value: 0.10
Decision rule: Reject H0 if the p-value is smaller than the critical
value. Otherwise,
do not reject H0.
P-value: 0.0008
Decision: Reject H0 since the p-value, 0.0008 is less than the
critical value, 0.10.
Conclusion: There is enough evidence to conclude that the β20 ≠ 0.
This shows that β20: Inflation Rate, Consumer Prices, INF,
significantly affects Malaysia FDI inflows at 0.10 significance level.
Factors Affecting Foreign Direct Investment Decision in Malaysia
Page 155 of 157
29.2.5 Hypothesis Testing of Significance of β21: China FDI inflows, CFDI
of Model 1
H0: β21 = 0
H1: β21 ≠ 0
Critical Value: 0.10
Decision rule: Reject H0 if the p-value is smaller than the critical
value. Otherwise,
do not reject H0.
P-value: 0.0001
Decision: Reject H0 since the p-value, 0.0001 is less than the
critical value, 0.10.
Conclusion: There is enough evidence to conclude that the β21 ≠ 0.
This shows that China FDI inflows, CFDI, significantly affects
Malaysia FDI inflows at 0.10 significance level
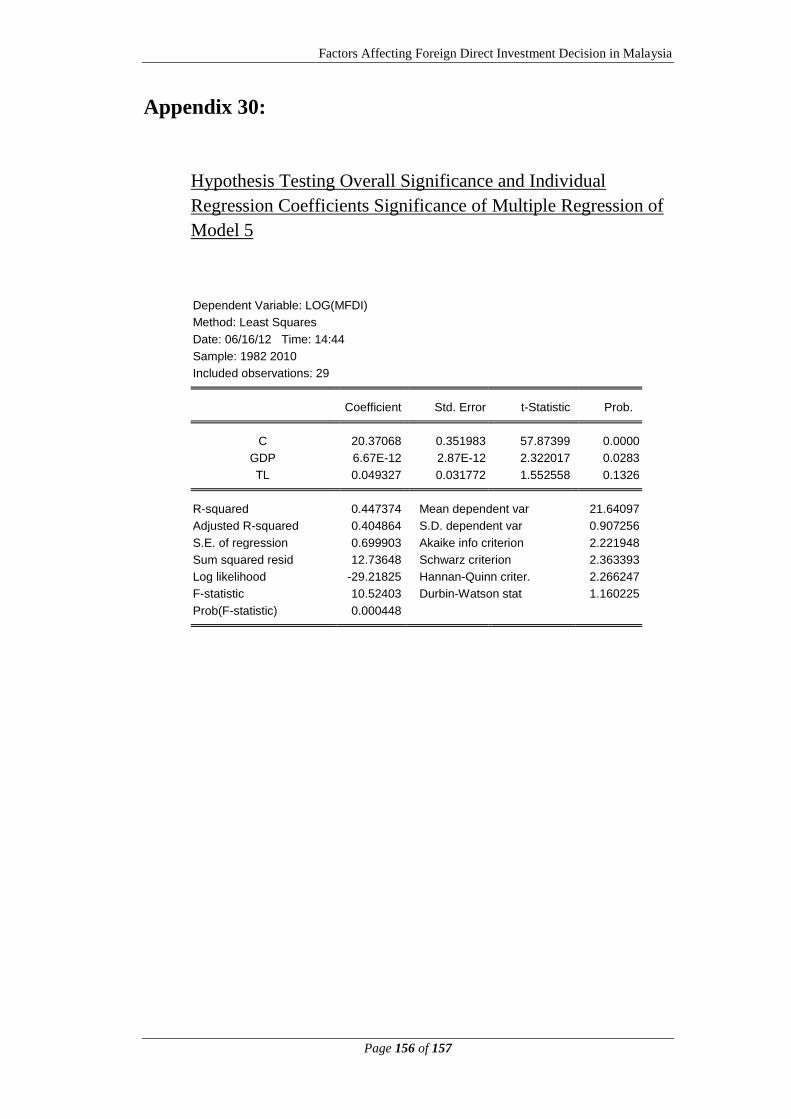
Factors Affecting Foreign Direct Investment Decision in Malaysia
Page 156 of 157
Appendix 30:
Hypothesis Testing Overall Significance and Individual
Regression Coefficients Significance of Multiple Regression of
Model 5
Dependent Variable: LOG(MFDI)
Method: Least Squares
Date: 06/16/12 Time: 14:44
Sample: 1982 2010
Included observations: 29 Coefficient Std. Error t-Statistic Prob.
C 20.37068 0.351983 57.87399 0.0000
GDP 6.67E-12 2.87E-12 2.322017 0.0283
TL 0.049327 0.031772 1.552558 0.1326
R-squared 0.447374 Mean dependent var 21.64097
Adjusted R-squared 0.404864 S.D. dependent var 0.907256
S.E. of regression 0.699903 Akaike info criterion 2.221948
Sum squared resid 12.73648 Schwarz criterion 2.363393
Log likelihood -29.21825 Hannan-Quinn criter. 2.266247
F-statistic 10.52403 Durbin-Watson stat 1.160225
Prob(F-statistic) 0.000448
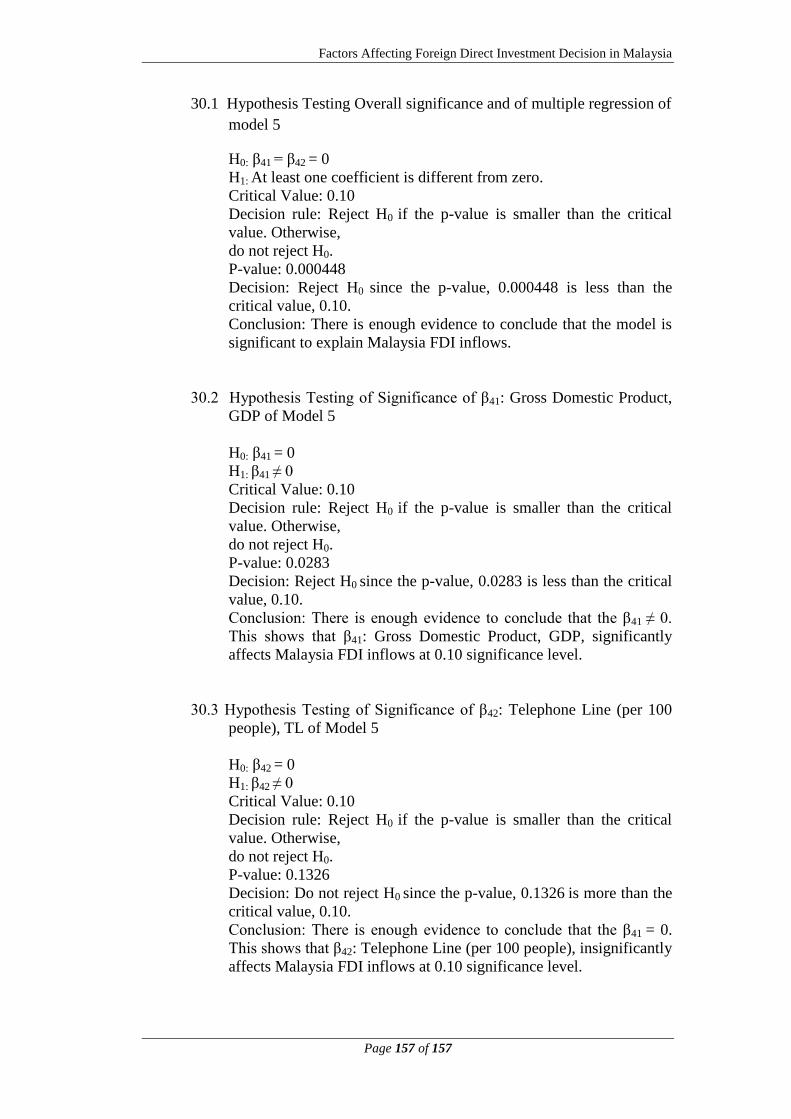
Factors Affecting Foreign Direct Investment Decision in Malaysia
Page 157 of 157
30.1 Hypothesis Testing Overall significance and of multiple regression of
model 5
H0: β41 = β42 = 0
H1: At least one coefficient is different from zero.
Critical Value: 0.10
Decision rule: Reject H0 if the p-value is smaller than the critical
value. Otherwise,
do not reject H0.
P-value: 0.000448
Decision: Reject H0 since the p-value, 0.000448 is less than the
critical value, 0.10.
Conclusion: There is enough evidence to conclude that the model is
significant to explain Malaysia FDI inflows.
30.2 Hypothesis Testing of Significance of β41: Gross Domestic Product,
GDP of Model 5
H0: β41 = 0
H1: β41 ≠ 0
Critical Value: 0.10
Decision rule: Reject H0 if the p-value is smaller than the critical
value. Otherwise,
do not reject H0.
P-value: 0.0283
Decision: Reject H0 since the p-value, 0.0283 is less than the critical
value, 0.10.
Conclusion: There is enough evidence to conclude that the β41 ≠ 0.
This shows that β41: Gross Domestic Product, GDP, significantly
affects Malaysia FDI inflows at 0.10 significance level.
30.3 Hypothesis Testing of Significance of β42: Telephone Line (per 100
people), TL of Model 5
H0: β42 = 0
H1: β42 ≠ 0
Critical Value: 0.10
Decision rule: Reject H0 if the p-value is smaller than the critical
value. Otherwise,
do not reject H0.
P-value: 0.1326
Decision: Do not reject H0 since the p-value, 0.1326 is more than the
critical value, 0.10.
Conclusion: There is enough evidence to conclude that the β41 = 0.
This shows that β42: Telephone Line (per 100 people), insignificantly
affects Malaysia FDI inflows at 0.10 significance level.