Embed Size (px)
Citation preview
FACTORS AFFECTING INNOVATION REVISITED: SECTORAL PATTERNS AND FIRMS OWNERSHIP
TYPE.
José Molero* (Universidad Complutense de Madrid) 1 and Antonio García (Universidad de Sevilla) 2
ABSTRATC: The aim of this paper is to contribute to a better understanding of factors explaining
innovation by analysing the Spanish manufacturing sector using microdata of the 2003
Spanish Innovation Survey. To enrich the analysis a self-developed sectoral taxonomy is
used coming from the combination of both sectoral Revealed Technological Advantages
(RTA) and worldwide technological dynamism of the sectors; moreover, firms are
classified according to the type of capital ownership: independent companies, companies
belonging to a group, and subsidiaries of multinational enterprises. The abundance and
heterogeneity of variables compelled us to use Factor Analysis to reduce and organise the
number of original variables in a number of consistent and theoretically significant factors.
We found differences between product and process innovation, both in number of
explicative variables (significant independent variables) and in relative effect of
independent variables (even, in some cases, a sign change from product to process
innovation). Taxonomy matters because some differences in explicative (independent)
variables for each sector and model explicative power differences between sectors, and on
the other hand, because of the “non-significance” of some significant variables once we
control by sectoral taxonomy.
KEYWORDS:
Innovation, Factors affecting innovation, Multinational enterprises, Sectoral taxonomies,
Spain,
1. Introduction.
Innovation has experienced a remarkable change in recent years as a consequence of a
number of factors including the advance of science and technology and the increasing
globalisation of a number of markets and activities. The growing heterogeneity of sources
affecting the process of firms’ innovation has led to the knowledge created out of the
companies themselves achieving greater importance, and therefore to the central role to be
played by the capacity of integrating inner and outer sources of technological capabilities
* Corresponding Author 1 Instituto Complutense de Estudios Internacionales, Universidad Complutense de Madrid. Campus de
Somosaguas, Finca Mas Ferre. 28223, Pozuelo de Alarcón, Madrid, Spain. 2 Facultad de Ciencias Económicas y Empresariales. Univerasidad de Sevilla. Avda Ramon y Cajal, 1. 41018,
Sevilla, Spain.
with other competitive forces. Similarly, the acceleration of internationalisation at most
economic and social levels has increased the necessity for exploiting firms’ advantages at
international (sometimes world) level and seeking new competitive (technological) assets in
a multinational framework. Moreover, the specialised research has arrived to a common
conclusion that sectoral features influence, remarkably, the possibilities and organisational
modes of innovatory activity.
From Pavit´s seminal sectoral taxonomy on innovation, there is a long tradition in using
several taxonomies or “classificatory list” of productive sectors according to their
innovative characteristic or intensity. Both, academic and institutional taxonomies can be
described as “closed aprioristic lists” of sectors, built on rigorous studies but without
flexibility to allow country differences on sector characteristics. A main contribution of this
paper consists of grouping companies in different categories of sectors in a non-aprioristic
way; each sector is “self-classified” in a concrete type and not in any other according to
particular characteristics and “innovative behaviour” in a given country (in our case,
Spain). To this end we have developed a taxonomy from the combination of (RTA) of each
sector of activity and the evolution of its world weight between 1993-1998 and 1999-2003.
Original sectoral data come from patents granted by the USPTO by priority year at the
national level by sector of economic activity (NACE class derived through concordance
with International Patent Classification).
Using microdata from the Spanish Innovation Survey, we had the advantage of their quality
and statistical significance. These data are of a great statistic validity insofar as an expert
group coordinated by the Spanish National Statistics Institute has, on the one hand, drawn
up a permanent sample of firms with the intention of creating a stable panel of data and, on
the other, it has controlled the statistic significance of the anonymous data vis-a-vis the
original micro data. In addition, this information allows us to separate firms according to
their independent feature or belonging to a group, including the country of origin of the
mother house of MNCs.
Our topic to explain is the innovative activity (product and process innovation) of Spanish
manufacturing firms (both national and multinational ownership), using as explanatory
variables those included in the Innovation Survey. The abundance and heterogeneity of
variables advised us to use Factor analysis to reduce and organise the number of original
variables in a number of consistent and theoretically significant factors. We have made a
series of sectoral analyses in an iterative way using both PITEC original variables and its
transformations. Non-included variables have been rejected on the basis of KMO and MSA
values. Once relevant factors are retained, we have made two series of logistics regressions
for both process and product innovation implementation, with factors and firms ownership
as independent variables. In each series, firstly we regress once for the whole sample, and
secondly we regress four times more controlling by sectoral taxonomy.
In the next section, we present main theoretical background, in the third section we discuss
our data and methodological guidelines and in the fourth section we present the empirical
results.
2. Theoretical background.
It is not our intention to develop a fully theory of factors affecting innovation. First of all
because such a theory is not available as demonstrated by both the attempts to gather the
most relevant empirical investigations (Tidd, Bessant and Pavitt, 1997), and the list of
issues included in seminal books as “issues affecting innovation” (Rothwell and Dodgson,
1995; Fagerber et al, 2006). On the contrary, our aim is to briefly review the most
significant contributions to find some theoretical guidelines for our empirical research. In
this regard, to briefly summarise the panorama of theoretical visions of the conditions
which promote successful innovative activities of firms, we can cluster them together in
two fundamental groups. On one hand, those belonging to the long tradition of industrial
organisation theory which basically search a few determining factors of the capacity of
innovation and, on the other, those more representative of the relatively recent approach of
the evolutionary theory which is based on the analysis of variety and diversity of innovative
modes and frequently uses the classification of cases as a basic theoretical tool.
Starting from the tradition of industrial organisation studies, one must remember their
central methodological characteristics consisting of the combination of the three classical
steps of structure-conduct-performance (Scherer and Ross, 1990). As formerly for other
economic issues, the analytical work is oriented to find out one or a few factors (never a
long number) which can explain the innovatory activity of the firms in a satisfactory way.
Without a doubt these two are the most frequently investigated elements: the size of the
firm and the concentration level of the markets in which firms carry out their innovative
activities.
In spite of the huge number of studies done about both of theses issues, the current situation
is that there are not conclusive results allowing us to assert the sign and intensity of the
impact those factors have to induce innovation. In fact, as far as the size of the firm is
concerned, we can share the argument of Freeman and Soete (1997) that the size “certainly
influences what kind of projects can be attempted in terms of technology, complexity and
costs but does not in itself determine the outcome” (page 193).
This inconclusive conclusion is the result of a large amount of empirical research relating
the size of the firms and innovative activities of the firms. Perhaps the most classic one is
the association of size with R&D expenditure. In this case, the available research shows
there is a concentration of R&D expenditure in large companies, basically determined by
the size of R&D programmes instead of the size of the firm (Freeman and Soete, 1997).
Nevertheless, it is more difficult to find a clear association between the increase of the size
and the intensity of R&D expenditure. In fact, mainly after controlling by sector, the
association seems to follow a growing tendency (the larger the size the more intense is
R&D effort) but just to a limit; from it onward the dominant relation is a proportional one
(Cohem, 1995). With regard to small firms, the evidence points out to a twofold situation:
whereas a vast majority of small firms do not perform any specialised R&D programme, in
several countries those small firm that do perform R&D have above average R&D
intensities (Freeman and Soete, 1997, 232).
The situation is even less clear if innovation replaces R&D activities; more qualifications
have to be incorporated as, for example, the possible advantage of small companies in early
stages of innovative work and the less expensive but more radical innovation, whereas large
firms have advantages in the later stages and improvement and scaling up of early
breakthroughs (Freeman and Soete, 1997, 234). More generally, Rothwell and Dodgson
(1995, 323) arrive at the following conclusions:
I. Innovatory advantage is unequivocally associated neither with large nor small
companies. Small firm advantages are mainly behavioural while those of large firms
are mainly material.
II. Available data suggests that the firm size/innovation share relationship is U-shaped.
III. Small firms´ innovatory contribution varies significantly from sector to sector.
IV. Small and large firms do not operate in isolation from each other and they enjoy a
variety of complementary relationships in their technological activities”.
V. Any study of the roles of small and large firms in innovation should be dynamic:
their relative roles vary considerably over the industry cycle (Shepherd, 1991;
Utterback, 1994).
The situation is more confusing if the aim is to associate levels of concentration (or
monopolistic power) with a superior innovative performance. The reason is that there are
two different angles to approach that relation: one is the passive and direct association of
higher levels of concentration with more intensive behaviour and the second more dynamic
and complex one that postulates the need of a monopolistic reward to encourage innovative
activities (Orsenigo, 1989; Cohen, 1995). In the first case no strong conclusive result can be
shown and the second is very difficult to test; therefore, some idea of a simultaneous
determination of concentration and innovation can be proposed (Cohen, 1995).
To complete that uneven perspective we can conclude that to generalise about size of the
firms, scale of R&D, inventive output and innovation needs to be heavily qualified.
Industry, technology and history matter (Freeman, 1982; Freeman and Soete, 1997). There
are not many other features so deeply investigated. In general, the progress has been poor in
topics such as the influence of cash flows or diversification (Cohen, 1995). Nevertheless, it
is important to highlight the importance given to some organisational characteristics in the
seminal SAPPHO project (Rothwell et al, 1974) and the renaissance of those elements in
the literature and policy practices (Nelson 2001; Nelson, 2008; OECD, 2005).
Following a methodology of comparing successful and failure of innovation, the SAPPHO
project enlightened a number of organisational variables, mainly “marketing related”,
“external communication” and “firm management”. Freeman cleverly summarised it by
saying: “the fact that the measures which discriminated between success and failure include
some which reflected mainly on the competence on R&D, others which reflected mainly on
efficient marketing and some which measured characteristics of the business innovator with
good communications, confirms that view of industrial innovation as essentially a coupling
process” (Freeman, 1982, 125).
The former notwithstanding, the innovation theory reoriented the approach to investigate
the role of the firms. Precisely the cited book of Freeman, together with seminal works such
as Rosenberg 1976, Nelson and Winter, 1982, Dosi, 1984 and Pavitt, 1984 claimed for a
better understanding of technology and innovation that enables to create a more accurate
theoretical approach. Apart from many other general considerations (Orsenigo, 1979; Dosi,
1984) as far as this paper is concerned, the central change has to do with the introduction of
variety and diversity as opposed to the main stream perspective of general determinants of
firms’ innovation; furthermore, the notion of “learning” occupied a central position as a
consequence of considering technology and innovation as specific kinds of knowledge
(Pavitt, 2006).
As a consequence of this new orientation the approach to firm innovatory behaviour
incorporates a number of remarkable modifications. Four of them outstand for the
objectives of this investigation: the role of systems of innovation, the importance of non
technological innovation, the relevance of the sector of activity and the introduction of
taxonomies to map the heterogeneity of conducts.
The concept of systems of innovation (Freeman, 1987; Lundvall, 1992) basically reinforced
the idea of systemic interaction among firms and a large amount of institutions. Thus, in the
context of this paper, the relevant issue is the necessity of incorporating internal and
external to the firm sources of knowledge, either on a collaborative mode or through market
mechanisms. In other words, the isolated consideration of firms´ characteristics is not
enough to fully understand the innovative practice of enterprises (Rothwell, 1995; Tidd,
Bessant and Pavitt, 1997); hence variables measuring such an interaction must be
incorporated.
Regarding non technological innovation, the first consideration is what aroused in the
SAPPHO project: organisational factors –considered form a broad perspective- play a
crucial role for the overall innovative strategy of the firms. More recently, Nelson and
others (Nelson, , Nelson, 2008) have insisted on the necessity of fully integrating “social”
and “physical” technologies at micro and macro level. Furthermore, Teece´s contribution to
firms’ innovatory attitudes put a great demand on the necessity of including the
“complementary assets” into the theoretical and empirical explanation of innovation
(Teece, 1986). As for the case of systems of innovations, the incorporation of variables
referred to those non technological factors is absolutely needed.
The issue of sector of activity is not new in industrial economics. To a great extent it is the
need to consider competitive conditions in the analysis; perhaps the most developed version
in the industrial organization tradition is the model of “competitive forces” by Porter in
which he combines five elements driving industry competition. 1.- Relations with clients;
2.- Relations with buyers; 3.- New entrants; 4.- Substitute products and 5.- Rivalry among
established firms (Porter, 1980).
The former notwithstanding, recent developments within the general approach of the
evolutionary theory spread the concept in the direction of incorporating other sectoral
conditions (Malerba, 2002, 2006) and/or the conditions for a sectoral model of
accumulative technological change based on different Technological Regimes or
Innovation Patterns (Nelson and Winter, 1992, Malerba and Orsenigo, 1996, 1997; Pavitt,
1984). In other words, as sectoral conditions for innovation are different, any efforts to
understand that process ought to incorporate sectoral differences as a central analytical
element; in Pavitt’s words: “increasing specialisation in the production of artifacts, and
their underlying knowledge bases, has made innovative processes increasingly path-
dependent. As a consequence, several aspects of innovation are contingent on sector, firms
and technology field” (Pavitt, 2006).
The latter drives us to the fourth point: the taxonomic exercise. As a general expression of
most theoretical revisions, the concepts of variety and diversity came to substitute the
former seeking of uniformity and universal determinisms. On the contrary, the evolutionary
theory postulates the existence of a heterogeneous cluster of sources of knowledge,
competing technologies, organisation models, ways of profiting from innovation and so on
(Orsenigo, 1989; Pavitt, 1984; Dosi, 1984; Dosi et al, 1988, etc). However, the scientific
approach to the diversity requires further theoretical efforts and it is here where the creation
of taxonomies emerges. In fact, there have been many of them insofar as any taxonomy is
deduced from some particular aspect the researcher wants to illuminate; albeit in this work
we wish to underline two which have influenced our empirical investigation: Pavitt
taxonomy and Technological Regimens.
Pavitt taxonomy starts from the notion of technological trajectories as expression of the
sectoral patterns of technological change. The aim is to supply an empirical method to
organise the manifested variety of innovative activities into a group of trajectories on the
basis of 1) the sectoral sources of technology used , differentiating between those internally
generated from others coming form different sectors. 2) Institutional sources and the nature
of the technology 3) Characteristics of the innovative firms.
The result is the establishment of several categories of technological trajectories to build in
which Pavitt combines some elements of the firms themselves with others concerning the
sources of knowledge and its diffusion through products or process innovations; depending
on whether the innovation is used in a different sector than the one in which they have been
produced or if they are used in the same sector in which they have been created (Pavitt,
1984). The lesson for us is the need to consider those kinds of factors in any explanation of
a firms´ innovation and that the distribution between product and process innovation can
shed light on substantial aspects of the innovation process. As a complementary
consideration we wish to quote Fagerberg (Metcalfe) when he prefers to include
organisational innovation as part of the process innovation. We shall see how in our
research the possibility of comparing product and process innovations upgrades the
understanding of the role of institutional aspects.
With regards to Technological Regimes, its most worthy contribution in this analysis is to
enrich the approach to firms´ activity by allowing us to classify different strategies. Classic
and recent works (Malerba and Orsenigo, 1996; Corocher, Malerba and Montobbio, 2007)
insist on the necessity of elaborating measures which enable the analysis to make out the
subjacent characteristics of the different patterns of innovating, according to the level of
opportunity, cumulativeness and apropriability of the different technological regimens. The
dichotomy of two main Regimes, following Schumpeter analysis (Schumpeter I and II)
allows us to distinguish how in each of them we have a number of intra-firm characteristics
as well as other related to the interaction with the surrounding system: high technological
opportunities, low appropriability and a low degree of cumulativeness (at the firm level) for
Schumpeter I, and high appropriabiliy and cumulativeness (at the firm level) for
Schumpeter II.
According to the previous argumentation our empirical research on the patterns of
innovation of Spanish companies will be organised under the following guidelines:
1. Factors influencing innovation are varied and partly belong to the
development of innovative projects, part to the firm as a whole and part to the

environment (Rothwell, 1995)
2. It is absolutely necessary to base the study on a statistical source which can
provide information about economic features of the firms, their internal
innovative strategy and the interaction with the system in order to capture the
importance of inner and outer sources (Cantwell, 2006).
3. The fundamental role of organizational aspects both for the general
implementation of innovation and as part of the general innovative activities
of firms and institutions (Lazonik, 2006)
4. It is also crucial to take into consideration the role of the sector of activity. In
spite of the existence of quite frequently used categories (e.g. the OECD
classification according to the technological content of the sectors) we have
chosen another option consisting of the elaboration of a sectoral typology
according to their own international technological position. In other words,
we prefer a self contended classification.
5. The distinction between product and process innovation to asses to which
extent the factors are common for both types; particularly when in both cases
the sectoral typology is applied.
6. Finally, the consideration of different types of firms´ ownership, especially as
far as the internationalisation process is concerned. The issue of the reciprocal
“invasion” of innovation systems demand a necessity of understanding of the
innovatory modes employed by domestic and international companies and to
which extent the increasing internationalisation is homogenising (or not) the
innovation activity.
In section 3 we shall develop the way in which we have made operative those guidelines.
3. Methodological and data guidelines.
To carry out the investigation, we count on two important mainstays. On the one hand, we
have developed a “self-classificatory” taxonomy of manufacturing sectors in terms of
innovative dynamics and performance; on the other, the recent availability of anonymous
micro-data of the Spanish Innovation Survey with a great statistic validity endorsed by the
Spanish National Statistics Institute, the Spanish Foundation for Science and Technology
(FECYT), and COTEC Foundation.
To build our taxonomy we have compared systematically both patents granted percentage
evolution rate between two periods (1993-1998 and 1999-2003) for each sector of activity
and its Revealed Technological Advantages (RTA) using data from patents granted by the
USPTO by priority year at the national level by the sector of economic activity (NACE
class derived through concordance with International Patent Classification).
With two classification axes, we are able to classify each NACE sector in one of four
categories. Presented vertically is revealed technological advantage (upper) or disadvantage
(lower) while horizontally we see worldwide evolution (positive to the right hand side and
negative to the left one); for technical details, see Annexe A). As a result, we define the
following four categories: “Dynamic specialisation” if there are RTA advantages in
dynamic sectors; it is the best of the cases insofar as the specialisation of the Spanish
economy fits perfectly with the international technological dynamic. “Retreat”, with RTA
disadvantages in sectors in retreat; it is a residual case also with positive aspects. “Lost
opportunity”, with RTA disadvantages in dynamic sectors; it is the worst possibility
because the Spanish economy has not been able to adapt to the international dynamism.
Finally “Stationary specialisation”, includes RTA advantages in sectors in retreat; this also
reflects a less favourable position insofar as it shows the Spanish specialisation is produced
in internationally less dynamic sectors. Classification of PITEC sectoral definition is shown
in Table 3 of Annexe B.
This taxonomy has the main advantage derived from its “self-classificatory” to put each
NACE sector into one of our four categories. Thus, we can avoid “a-prioristic” and rigid
classifications (following OECD technological content classification, Pavit’s taxonomy or
others) that could not be appropriated to analyze the characteristics of intermediate
countries, as is the Spanish case. In opposition, our taxonomy is flexible because
classification results from sectoral characteristics on each country; so it can be adapted
from one country to another and each sector moved from one category to another, if
necessary, but the criteria to construct categories rest unchanged.
Furthermore, this taxonomy allow us to evaluate overall sectoral specialisation of a country
as a whole in terms of innovative and technological performance. If most of the sectors (in
number and in GDP percentage) are placed in “main diagonal” (Dynamic and Retreat) this
country is well adapted to international innovative and technological dynamics; in the
contrary case, if most of the sectors are placed on the “inverse diagonal” (Stationary and
Lost Opportunities), country specialisation is contrary to international one.
The great statistic validity of anonymous micro-data derives insofar as an expert group
coordinated by the Spanish National Statistics Institute has, on the one hand, drawn up a
permanent sample of firms with the intention of creating a stable panel of data and, on the
other, has controlled the statistical significance of the anonymous data vis-à-vis the original
micro data. This information allows us to separate firms according to their independent
feature (Independent companies, ICs) or belonging to a group, including the country of
origin of the mother house of the cluster. If the headquarters is located in Spain, we can
assume most of them can be expected to behave as Spanish multinationals, following some
international literature (Evangelista, 2005). Nevertheless, as it is not possible to confirm
this multinational character of the group we shall call them “National groups (NGs)” versus
“Multinational Groups (MNGs)”. Using the original variables of the panel we have
calculated some additional ones that are listed in Table 1 of Annexe A. After these calculi,
we work with variables listed in Table 2 of Annexe B.
The method proposed has two steps. In the first step, we use factor analysis to see how
different variables behave relative to others and to reduce the information to be used in the
explanatory phase. Once factors have been obtained, the next step is to include them as
explanatory variables in different Logit models in order to estimate which of them (and to
what extent) affect any observed firms implement process or product innovation.
Using extracted factors as explanatory variables, it is possible to show the most significant
variables or factors explaining the differences between innovative and non-innovative
firms. Including dummies to control the fact of belonging to a multinational group or to be
an individual firm, we can detect the differentiated impact MNGs have upon the Spanish
Innovation System. In the last stage, the analysis will be made introducing the sectoral
typology of the sectors as a factor to be controlled.
To tackle this task we have carried out a series of alternative Logits. Firstly, we have
studied the model in which the dependent variable is INNPROD (1 for companies which
have successfully introduced a product innovation; 0 for the opposite), without
distinguishing independent or national group firms, or splitting the survey by type of sector;
typology of firms’ ownership is introduced as a potentially explanatory variable.
Afterwards, we have repeated the analysis by splitting the survey by sectors. The same
analysis is made for a model in which dependent variable is INPROCC (1 for firms having
successfully introduced a process innovation; 0 for the opposite), initially without sectoral
cuts in the sample and after controlling by sectoral taxonomy; in both cases with firms’
ownership types as potentially explanatory variables.
4. RESULTS.
4.1. Factor analysis.
As a first step in the explanatory phase we have made a series of trials in an iterative way
with variables listed in table 2 of the annexe, and using the principal components method.
Non-included variables have been rejected on the basis of KMO and MSA values. After
several tests we have eliminated FUNIV, FIPSFL and FEXT (for those only 7 observations
present values different from zero) and also FEMPEXT and FEMP (with 24 and 73
observations that present values different from zero). The KMO ratio rises at acceptable
values (0.54) and explained variance goes as far as 63%. To continue eliminating variables
gives us very low KMO improvements, does not improve explained variance, and distorts
Factor results; we stopped the process at this point.
In those tests, Factor structure remains very stable with few changes: 9 factors (8 when we
eliminate the last variables). Individual Factor explained variance has four levels (level I, 1
or 2 factors between 9.5% and 10.5%; level II, 3 or 2 factors between 7% and 8.5%; level
III, 3 factors between 5.5% and 6,5%; level IV, 2 factors around 4,5%).
The more solid Factor structures are:
1 NESTR, NGEST, NORG, NMARK, NESTE, always in the first level and usually
the first factor.
2 GMAQUI, GTECNO, GPREP, usually in the second level, we find a tendency to
incorporate GFORM also.
3 PATNUM, FPRO, usually in the second level. GINTID has a tendency to link this
factor.
4 INNOVEM, INNPROD, sometimes in the second level, others in the third.
5 PIDTEJpw, FAP, sometimes in the second level, others in the third.
6 TAMMED, GEXTID, GMARKET, usually in the third level.
7 INNNOVET, INNPROC, always in the last level.
8 INNOVEC, INFUN, always in the last level too.
Our selected Factor structure is shown in Table 1 and its quite reasonable possibility of
being interpreted in economic and innovative terms must be underlined; each factor is
accompanied by the variables that cluster together and the name we have assigned to make
explicit its economic or innovative significance.
(table 1 around here)
4.1. Regression analysis.
This phase of the analysis has been done through the estimation of regression models using
the former factors as independent variables to explain the innovative activity of the firms.
Following the research path proposed, we have estimated a number of logistic regressions
with several characteristics:
1 We have separated product and process innovation in the understanding that there
can be significant differences between them. In both cases models try to explain the
probability of any firm to belong to the innovative group or not.
2 Apart from the factors we have included as independent variables two dummies
trying to control the fix effect of firms belonging to any of the three groups in which
we have divided the sample: independent Spanish companies (EIN), firms
belonging to a national group (GN), and firms belonging to foreign multinational
groups (GMN). The idea is to consider the importance of the growing
internationalisation of the innovation in the Spain.
3 In addition to the general regressions for products and processes we have estimated
in each case four other regressions corresponding to the types of sectors formerly
explained.
The results are shown in tables 2 and 3 from which we can deduce as the main findings the
following.
(Tables 2 and 3 around here)
GENERAL FINDINGS.
1. Generally speaking we obtain a better explanation for process than for product
innovation. It is reflected in the higher pseudo R2 values and in the higher
homogeneity founded across types of sectors. Nevertheless, significant factors are
rather similar, although size&integration is more important in product innovation.
From a more speculative point of view we ask if those differences are a reflection
of the Spanish innovation characterised, among other elements, by a lesser
presence of radical and strategic innovations and a heavier weight of adoptions and
by a lesser dependence on foreign inputs in process technologies (Buesa& Molero,
Molero, 2006).
2. The association between human capital (personnel) and the access to public funds
changes its signs: positive for product innovation and negative for process. All the
rest factors maintain the same sign in both cases.
3. The kind of sector emerges as much more important than the type of firms´
ownership, confirming what was expected. Once we control for the first, we only
find a case in which the type of firm is relevant: ICs in process innovation of
Stationary Specialisation sectors. Importantly enough it is to say this group gathers
a non negligible number of so called traditional industries in which independent
companies still are the bulk of the activity.
4. Organizational innovation arises as the most important factor explaining the
behaviour of innovative firms. Its universal presence in both types of innovation
and in all kinds of sectors, always with a positive sign, allows us to assert that this
new evidence confirms and reinforces what theory and previous studies predicted.
5. After controlling for type of sector, a number of differences can be found. It is so
both for the explanatory capacity of the models and for concrete factors which are
significant in some cases but not in others (sometimes changing the sign). In our
opinion this confirms and justifies the relevance of the taxonomy used. Moreover
the level of adjustment varies significantly between the sectors better adapted to
the international dynamism (Dynamic Specialisation and Retreat) and the other
two more imbalanced sectors (Lost Opportunities and Stationary Specialisation).
PRODUCT INNOVATION
1. The type of firm is not significant in any of the cases. However the factor
size&integration has favourable effect in all cases.
2. Expenditures in non R&D innovative activities have a positive impact in Lost
Opportunities, negative in Dynamic Specialisation and Retreat and is non-
significant in Stationary Specialisation. This points out to a greater necessity of
proper R&D activities in more dynamic sectors to follow the world evolution
whereas in dynamic sectors in which Spain has technological disadvantages, non
R&D activities can be considered as an alternative to build some capacities to be
completed afterward through R&D.
3. The already mentioned role of organisational innovation shows a higher effect in
the two sectors with weaker adaptation to the world dynamic: stationary
Specialisation and Lost Opportunities. In other words, it is for those sectors that
this non technological innovation seems to play its most important role.
4. The joint effect of R&D expenditure and Patents is a factor which positively
influences product innovation in internationally dynamic sectors, irrespectively of
having technological advantages or disadvantages. That is to say, in mature
sectors the technological effort measured through R&D and patents is not a
discriminating factor between innovative and non innovative firms; whereas it
positively discriminates in dynamic sectors. In these cases R&D and patents
appear as a requirement to get technological advantages. A similar comment can
be made with regard to UE funds; this factor can be understood as an index of
innovative dynamism.
5. Basic research and Cooperation is only significant in the two sectors which reveal
a bad international adaptation: Stationary Specialisation and Lost Opportunities.
Therefore we can send a message for policy considerations: to strengthen those
activities is essential to improve the situation of the firms in Lost Opportunities
sectors.
PROCESS INNOVATION
1. Independent companies are more active in Stationary Specialisation sectors,
together with Size & Integration factor. The weight of traditional sectors with
independent companies –some of them of noticeable size- allows us to interpret
this result as a situation in which foreign companies comes to “follow” or “adapt”
the behaviour of national companies with remarkable technological advantages.
2. Basic Research & Cooperation is favourable in the four cases, albeit its effect is
relatively higher in sectors with bad international adjustment: Lost Opportunities
and Stationary Specialisation. This result supports what was said in the analysis of
product innovation: financing basic research and cooperative activities positively
influences innovation in product and process.
3. Non R&D innovative expenditures have a negative impact in all sectors except in
Lost Opportunities. Moreover, the size of the effect is much greater in sectors
positively adapted to international evolution. Again, most dynamic sectors are
much more dependent on R&D while in other cases non R&D activities can be a
preliminary step to create R&D capabilities.
4. Organisational innovation, as always, favours innovation and its effect is greater
in internationally dynamic sectors, particularly if it is a sector with technological
disadvantages.
5. The positive effect of R&D and Patents in Lost Opportunities and negative in
Sectors with technological disadvantages point……
6. The positive sign of Human Capital and Funds suggests in processes with more
systematic and incremental innovation, the stability of human resources is
important and they seem to be strongly connected with the availability of public
funds.
A complementary way of exploiting the findings can be made through the point of view of
the kinds of sectors to highlight some relevant regularities. The starting point is the
existence of more similarities between sectors with good fitness concerning international
dynamism, on the one hand, and between those badly adapted, on the other.
As far as the first two are concerned we can point out that in the Dynamic Specialisation
category two factors are common to product and process innovation: Organisational
Innovation, with a positive impact, and non R&D expenditures, with a negative one.
Another two show different signs in product and process: Human capital and Funds and
R&D and Patents- both have a positive effect in product innovation and a negative effect in
process.
Regarding Retreat Sectors, only two factors arise as common to product and process: It
stands out the fact that Organisational Innovation and Non R&D expenditures are common
to both Dynamic and Retreat and both types of innovation, product and process. The first
has a regular positive influence and the second a negative one.
In Dynamic sectors the role of human capital and funds and R&D and patents is also
remarkable. The two are significant for both types of innovation, although with different
signs; positive for product and negative for process.
Coming to sectors with negative international adjustment, it is noticeable that there are less
regularities than in the former cases. The most outstanding are the following.
Apart from the systematic presence of organisational innovation, there also arises the
regular presence of Basic Research and Cooperation. This, on the one hand, explains the
insufficient role played insofar as it has not been enough to guarantee a better international
adjustment. This is why we insisted on the idea that policy has to foster those activities in
order to upgrade the situation.
A second regularity has to do with Human Capital and Funds. This factor is common to the
two sectors and types on innovation, although for the last one, the sign change from
positive in product to negative in process.
REFERENCES Arrow, K, (1962): “Economic welfare and allocation of resources for invention”. En Nelson, R.
(editor): The rate and direction of inventive activity. NBER, Princeton University Press.
Atkinson, A. and Stiglitz, J. (1969). “ A new view of technological change”. Economic Journal, 78.
Cantwell, J. (2006): “Innovation and competitiveness”. In J. Fagerberg et al (eds).
Cohen, W. (1995): “Empirical studies of innovative activity”. In P. Stoneman (1995).
Cohen, W.N. and Levinthal, D.A., (1989): “Innovation and learning: the two faces of R&D.
Implications for the analysis of R&D investment”, Economic Journal 99, 569-596. Corocher, N., Malerba, F. and Montobbio, F. (2007): “Schumpeterian patterns of innovative activity
in the ICT field”. Research Policy, 36.
Dogdson, M. and Rothwell, R. (Eds) (1994): The handbook of industrial innovation.
Edward Elgar, Cheltenham. Dosi G. et al. (1988): Technical Change and Economic Theory. Printer Publisher, London.
Dosi, G. (1984): Technical Change and Industrial Transformation. McMillan. London.
Dosi, G. (1991): "Perspectives on evolutionary theory". Science and Public Policy, vol. 18, nº 6.
Fagerberg, J. (1988): “International competitiveness”. Economic Journal, nº 98, pp. 355-374.
Fagerberg, J. (1988):”Why rates of growth differ”. In Dosi, G. et al: Technical change and

economic theory. Pinter Publishers, London.
Fagerberg, J., Mowery, D. and Nelson, R. (eds) (2006). The Oxford handbook of innovation. Oxford
University Press, Oxford. (paperback).
Freeman, C. (1987): Technology policy and economic performance. Lessons from Japan. Pinter,
London.
Freeman, Ch (1982): The economics of industrial innovation. (2ª edition). Pinter. London.
Freeman, Ch (1995): “The National System of Innovation in historical perspective”.
Cambridge Journal of Economics, nº 19.
Freeman, Ch. and Soete, L. (1997): The economics of industrial innovation (3ª edition).
Pinter, London. Lazonik, W. (2006): “The innovative firm”. In J. Fagerber et al (eds).
Lundvall, B. (1992) (ed): National Systems of Innovation: towards a theory of innovation
and interacting learning. Pinter, London. Malerba, F. (2002): “Sectoral systems of production and innovation”. Research Policy, 31.
Malerba, F. (2006): “Sectoral Systems. How and why innovation differ across sectors”. In J.
Fagerber et al (eds).
Malerba, F. and Orsenigo, L. (1990): “Technological regimes and patterns of innovation: a
theoretical and empirical investigation of the Italian case”. In A. Heertje and M. Perlman
(eds): Evolving technology and market structure. Michigan University Press, Michigan. Malerba, F. and Orsenigo, L. (1995): “Schumpeterian Patterns of Innovation”. Cambridge Journal
of Economics, nº 19, pp. 47-65.
Metcalfe, S. (1995): “The economic foundations of technological policy: equilibrium and
evolutionary perspectives”. In Stoneman, P. (ed): Handbook of the economics of innovation and
technological change. Blackwell, Oxford.
Nelson, R. (1998): “The co-evolution of technology industrial structure and supporting institutions”.
In Dosi, G., Teece, D.J. and Chytry,J. (eds): Technology, Organization and Competitiveness.
Oxford University Press, Oxford.
Nelson, R. and (2001)
Nelson, R. and Winter, S. (1982): An evolutionary theory of economic change. Harvard University
Press, Cambridge.
Nelson, R.R. (2008): “What enables rapid economic progress: what are the needed institutions?
Research Policy, 37.
OECD (2005): The measurement of scientific and technological activities. Oslo Manual. OECD,
Paris.
Orsenigo, L. (1989): The Emergence of Biotechnology. Printer Publishers, London.
Pavitt, K. (1984): "Sectoral patterns of technical change: towards a taxonomy and a theory".
Research Policy, vol. 13. nº 6.
Pavitt, K. (2006): “Innovation processes”. In J. Fagerber et al (eds).
Porter. M. (1980): Competitive strategy. Free Press, New York.
Rosenberg, N. (1982): Inside the black box: technology in economics. Cambridge University Press.
Rothwell, R. (1994): “Industrial innovation: success, strategy, trends”. In Dodgson & Rothwell
(1994).
Scherer, F.M. and Ross, D. (1990): Industrial market structure and economic performance.
Houghton Miffflin Company, Boston.
Shepherd , W.G. (1991): “Some aspects of dynamic analysis of industrial change”. In P. de Wolf
(ed): Competition in Europe. Essays in honour of H.W. De Jong. Kluwer, Dordrecht.
Stoneman, P. (Ed), (1995): Handbook of Economics of Innovation and Technological
Change. Ed. Blackwell. Cambridge.
Teece D. J. (1986), Profiting from Technological Innovation, Research Policy
Teece D.J., Pisano G.P. (1994): The Dynamic Capabilities of Firms: an Introduction,

Industrial and Corporate Change.
Tidd, J., Bessant, J. and Pavitt, K. (1997): Managing Innovation. Integrating technological
market and organizational change. Wiley, Chichester. Utterback, J.M. (1994): Mastering the dynamics of innovation. Harvard Business Scholl Press,
Boston.
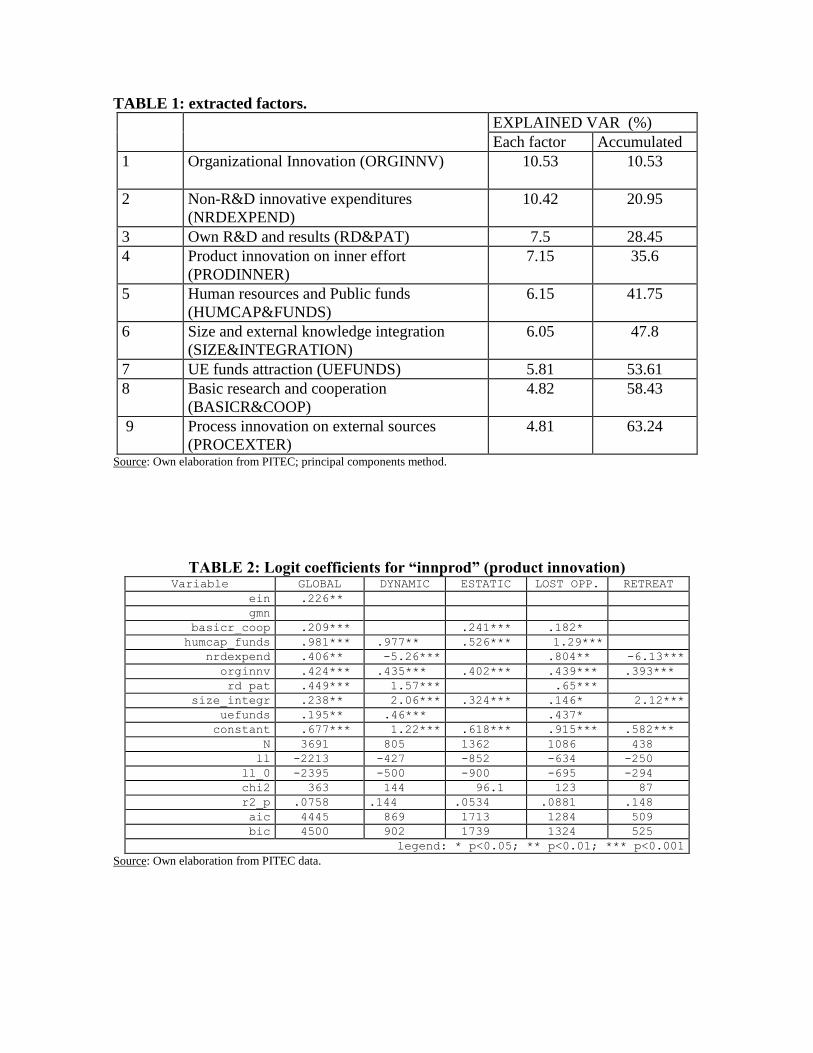
TABLE 1: extracted factors.
EXPLAINED VAR (%)
Each factor Accumulated
1 Organizational Innovation (ORGINNV) 10.53
10.53
2 Non-R&D innovative expenditures
(NRDEXPEND)
10.42 20.95
3 Own R&D and results (RD&PAT) 7.5 28.45
4 Product innovation on inner effort
(PRODINNER)
7.15 35.6
5 Human resources and Public funds
(HUMCAP&FUNDS)
6.15 41.75
6 Size and external knowledge integration
(SIZE&INTEGRATION)
6.05 47.8
7 UE funds attraction (UEFUNDS) 5.81 53.61
8 Basic research and cooperation
(BASICR&COOP)
4.82 58.43
9 Process innovation on external sources
(PROCEXTER)
4.81 63.24
Source: Own elaboration from PITEC; principal components method.
TABLE 2: Logit coefficients for “innprod” (product innovation) Variable GLOBAL DYNAMIC ESTATIC LOST OPP. RETREAT
ein .226**
gmn
basicr_coop .209*** .241*** .182*
humcap_funds .981*** .977** .526*** 1.29***
nrdexpend .406** -5.26*** .804** -6.13***
orginnv .424*** .435*** .402*** .439*** .393***
rd_pat .449*** 1.57*** .65***
size_integr .238** 2.06*** .324*** .146* 2.12***
uefunds .195** .46*** .437*
constant .677*** 1.22*** .618*** .915*** .582***
N 3691 805 1362 1086 438
ll -2213 -427 -852 -634 -250
ll_0 -2395 -500 -900 -695 -294
chi2 363 144 96.1 123 87
r2_p .0758 .144 .0534 .0881 .148
aic 4445 869 1713 1284 509
bic 4500 902 1739 1324 525
legend: * p<0.05; ** p<0.01; *** p<0.001
Source: Own elaboration from PITEC data.
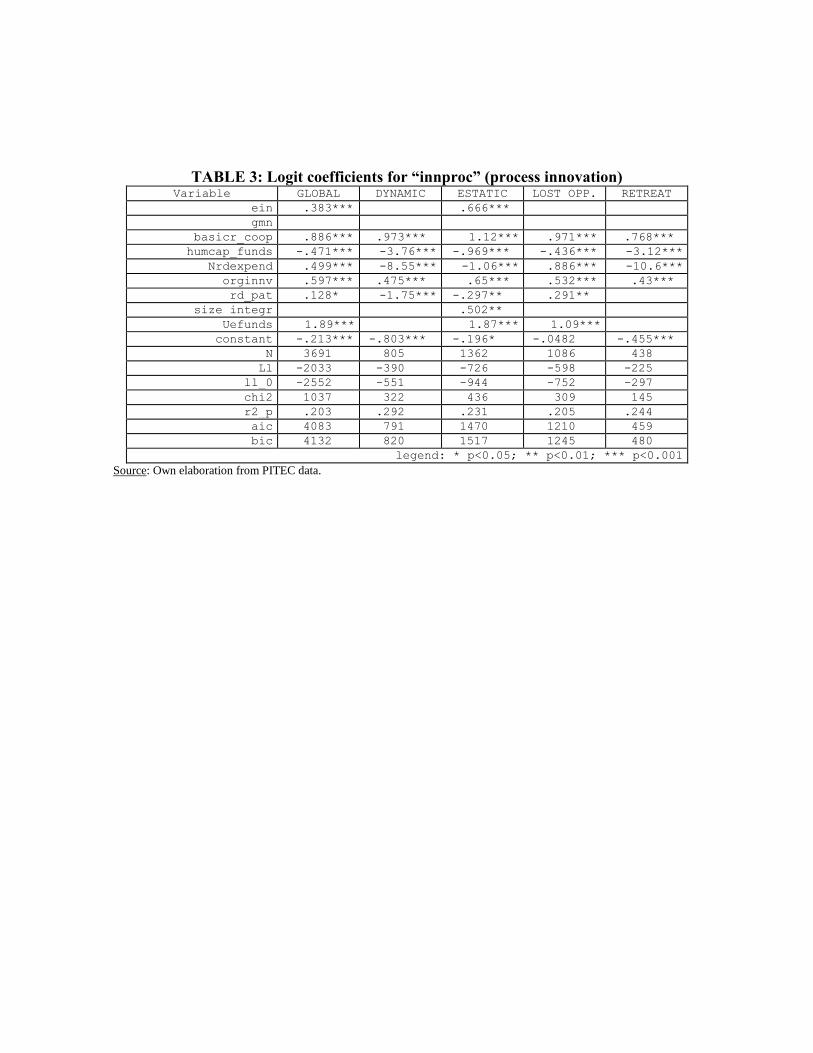
TABLE 3: Logit coefficients for “innproc” (process innovation) Variable GLOBAL DYNAMIC ESTATIC LOST OPP. RETREAT
ein .383*** .666***
gmn
basicr_coop .886*** .973*** 1.12*** .971*** .768***
humcap_funds -.471*** -3.76*** -.969*** -.436*** -3.12***
Nrdexpend .499*** -8.55*** -1.06*** .886*** -10.6***
orginnv .597*** .475*** .65*** .532*** .43***
rd_pat .128* -1.75*** -.297** .291**
size_integr .502**
Uefunds 1.89*** 1.87*** 1.09***
constant -.213*** -.803*** -.196* -.0482 -.455***
N 3691 805 1362 1086 438
Ll -2033 -390 -726 -598 -225
ll_0 -2552 -551 -944 -752 -297
chi2 1037 322 436 309 145
r2_p .203 .292 .231 .205 .244
aic 4083 791 1470 1210 459
bic 4132 820 1517 1245 480
legend: * p<0.05; ** p<0.01; *** p<0.001
Source: Own elaboration from PITEC data.
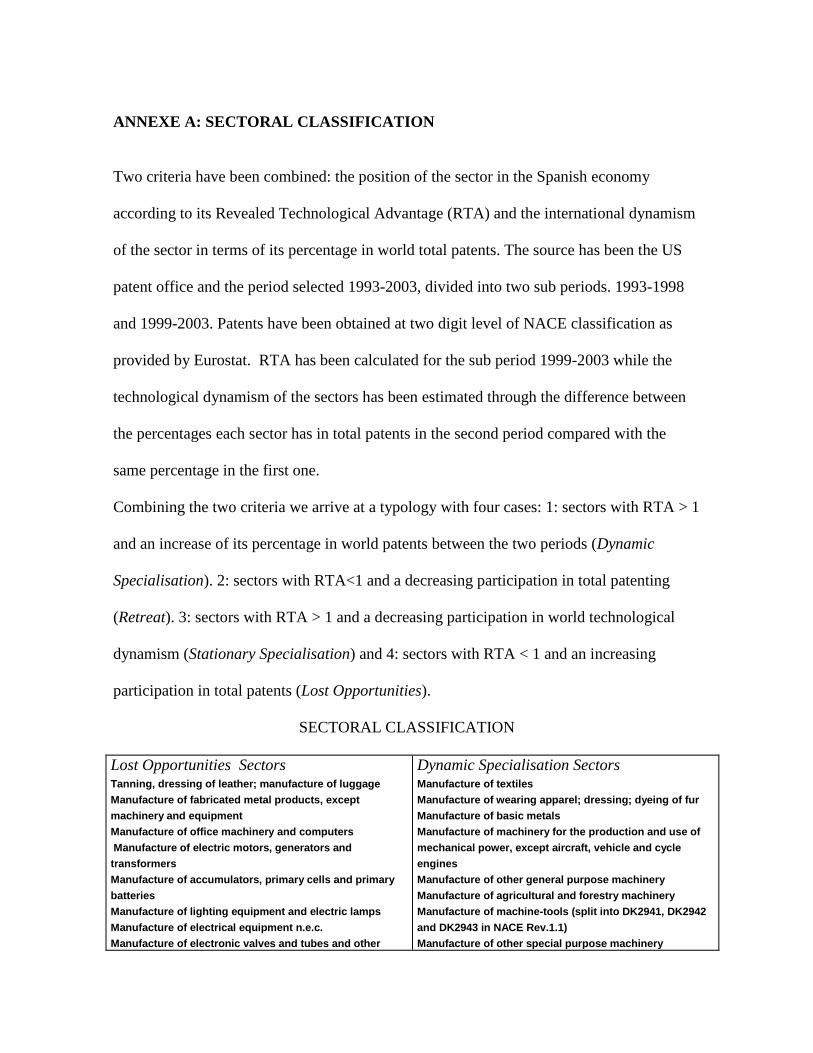
ANNEXE A: SECTORAL CLASSIFICATION
Two criteria have been combined: the position of the sector in the Spanish economy
according to its Revealed Technological Advantage (RTA) and the international dynamism
of the sector in terms of its percentage in world total patents. The source has been the US
patent office and the period selected 1993-2003, divided into two sub periods. 1993-1998
and 1999-2003. Patents have been obtained at two digit level of NACE classification as
provided by Eurostat. RTA has been calculated for the sub period 1999-2003 while the
technological dynamism of the sectors has been estimated through the difference between
the percentages each sector has in total patents in the second period compared with the
same percentage in the first one.
Combining the two criteria we arrive at a typology with four cases: 1: sectors with RTA > 1
and an increase of its percentage in world patents between the two periods (Dynamic
Specialisation). 2: sectors with RTA<1 and a decreasing participation in total patenting
(Retreat). 3: sectors with RTA > 1 and a decreasing participation in world technological
dynamism (Stationary Specialisation) and 4: sectors with RTA < 1 and an increasing
participation in total patents (Lost Opportunities).
SECTORAL CLASSIFICATION
Lost Opportunities Sectors
Tanning, dressing of leather; manufacture of luggage
Manufacture of fabricated metal products, except
machinery and equipment
Manufacture of office machinery and computers
Manufacture of electric motors, generators and
transformers
Manufacture of accumulators, primary cells and primary
batteries
Manufacture of lighting equipment and electric lamps
Manufacture of electrical equipment n.e.c.
Manufacture of electronic valves and tubes and other
Dynamic Specialisation Sectors
Manufacture of textiles
Manufacture of wearing apparel; dressing; dyeing of fur
Manufacture of basic metals
Manufacture of machinery for the production and use of
mechanical power, except aircraft, vehicle and cycle
engines
Manufacture of other general purpose machinery
Manufacture of agricultural and forestry machinery
Manufacture of machine-tools (split into DK2941, DK2942
and DK2943 in NACE Rev.1.1)
Manufacture of other special purpose machinery

electronic components
Manufacture of television and radio transmitters and
apparatus for line telephony and line telegraphy
Manufacture of television and radio receivers, sound or
video recording or reproducing apparatus and associated
goods
Manufacture of industrial process control equipment
Manufacture of optical instruments, photographic
equipment
Manufacture of watches and clocks
Manufacture of motor vehicles, trailers and semi-trailers
Manufacture of other transport equipment
Manufacture of furniture; manufacturing n.e.c.
Manufacture of domestic appliances n.e.c.
Manufacture of electricity distribution and control
apparatus, manufacture of insulated wire and cable
Retreat Sectors
Manufacture of tobacco products
Manufacture of wood and of products of wood and cork,
except furniture; manufacture of articles of straw and
plaiting materials
Manufacture of other non-metallic mineral products
Manufacture of medical and surgical equipment and
orthopaedic appliances
Manufacture of instruments and appliances for measuring,
checking, testing, navigating and other purposes, except
industrial process control equipment
Stationary Specialisation Sectors
Manufacture of food products and beverages
Manufacture of pulp, paper and paper products
Publishing, printing, reproduction of recorded media
Manufacture of coke, refined petroleum products and
nuclear fuel
Manufacture of basic chemicals
Manufacture of pesticides and other agro-chemical
products
Manufacture of paints, varnishes and similar coatings,
printing ink and mastics
Manufacture of pharmaceuticals, medicinal chemicals and
botanical products
Manufacture of soap, detergents, cleaning, polishing
Manufacture of other chemical products
Manufacture of man-made fibres
Manufacture of rubber and plastic products
Manufacture of weapons and ammunition
Source: Own elaboration
ANNEXE B
TABLE B1: Calculated Variables. VARIABLE CALCULUS FROM PITEC VARIABLES AND DESCRIPTIÓN
EGTINN (GTINN/CIFMED*100) Innovation effort
GTINNpw (GTINN/TAMMED) Expenditure in innovation per worker
PIDTEJCpw (PIDTEJ/TAMMED*100) R&D staff per 100 workers.
PGINTID (GINTID/GTINN*100) % Internal R&D expenditure
PGEXTID (GEXTID/GTINN*100) % External R&D expenditure
PGID (PGINTID+PGEXTID) % R&D expenditure
PGMAQUI (GMAQUI/GTINN*100) % Expenditure in acquisition of machines, equipment and software
PGTECNO (GTECNO/GTINN*100) % Expenditure in acquisition of external know-how
PGPREP (GPREP/GTINN*100) % Expenditure in preparation for production/distribution.
PGFORM (GFORM/GTINN*100) % Expenditure in training
PGMARKET (GMARKET/GTINN*100) % Expenditure in introduction of innovations
FPRO (F1) Own funds
FEMP (F2+F3+F4) Funds from other firms

FEMPEXT (F11+F12) Funds from other foreign firms
FAP (F5+F6+F7+F8) Funds from AAPPs
FUNI (F9+F15) University funds
FIPSFL (F10+F16) Funds from IPSFLs
Source: Own elaboration from PITEC.
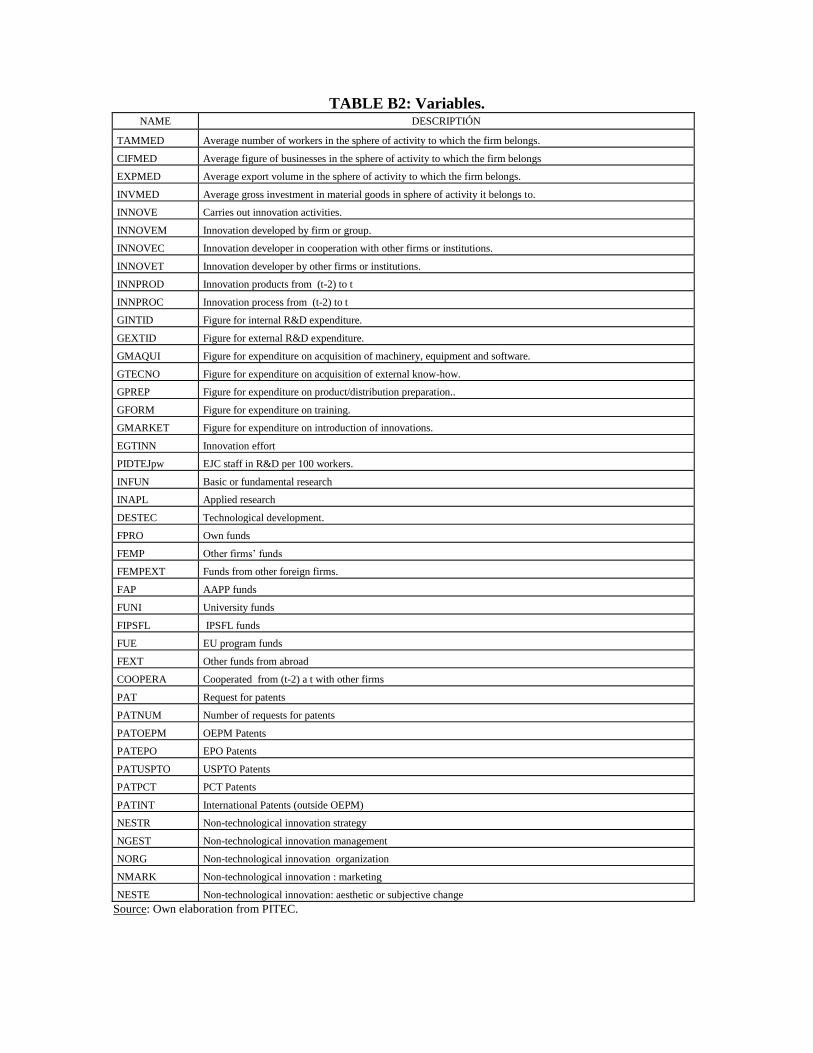
TABLE B2: Variables. NAME DESCRIPTIÓN
TAMMED Average number of workers in the sphere of activity to which the firm belongs.
CIFMED Average figure of businesses in the sphere of activity to which the firm belongs
EXPMED Average export volume in the sphere of activity to which the firm belongs.
INVMED Average gross investment in material goods in sphere of activity it belongs to.
INNOVE Carries out innovation activities.
INNOVEM Innovation developed by firm or group.
INNOVEC Innovation developer in cooperation with other firms or institutions.
INNOVET Innovation developer by other firms or institutions.
INNPROD Innovation products from (t-2) to t
INNPROC Innovation process from (t-2) to t
GINTID Figure for internal R&D expenditure.
GEXTID Figure for external R&D expenditure.
GMAQUI Figure for expenditure on acquisition of machinery, equipment and software.
GTECNO Figure for expenditure on acquisition of external know-how.
GPREP Figure for expenditure on product/distribution preparation..
GFORM Figure for expenditure on training.
GMARKET Figure for expenditure on introduction of innovations.
EGTINN Innovation effort
PIDTEJpw EJC staff in R&D per 100 workers.
INFUN Basic or fundamental research
INAPL Applied research
DESTEC Technological development.
FPRO Own funds
FEMP Other firms’ funds
FEMPEXT Funds from other foreign firms.
FAP AAPP funds
FUNI University funds
FIPSFL IPSFL funds
FUE EU program funds
FEXT Other funds from abroad
COOPERA Cooperated from (t-2) a t with other firms
PAT Request for patents
PATNUM Number of requests for patents
PATOEPM OEPM Patents
PATEPO EPO Patents
PATUSPTO USPTO Patents
PATPCT PCT Patents
PATINT International Patents (outside OEPM)
NESTR Non-technological innovation strategy
NGEST Non-technological innovation management
NORG Non-technological innovation organization
NMARK Non-technological innovation : marketing
NESTE Non-technological innovation: aesthetic or subjective change
Source: Own elaboration from PITEC.
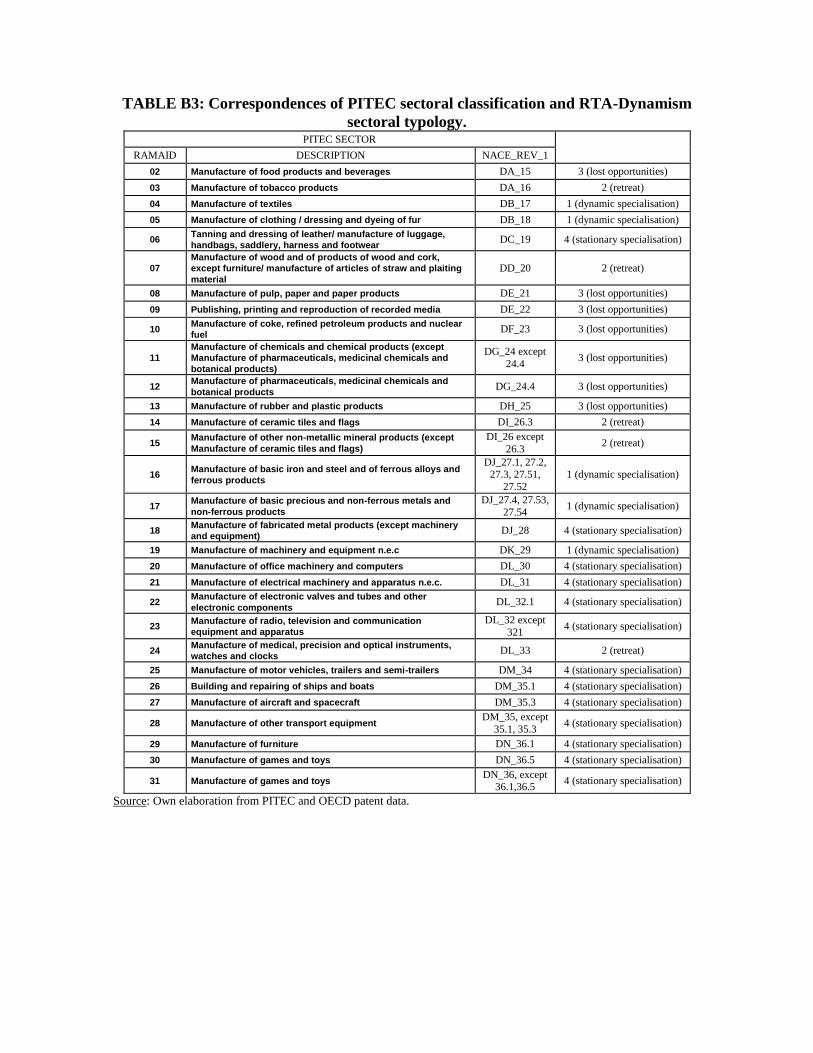
TABLE B3: Correspondences of PITEC sectoral classification and RTA-Dynamism
sectoral typology. PITEC SECTOR
RAMAID DESCRIPTION NACE_REV_1
02 Manufacture of food products and beverages DA_15 3 (lost opportunities)
03 Manufacture of tobacco products DA_16 2 (retreat)
04 Manufacture of textiles DB_17 1 (dynamic specialisation)
05 Manufacture of clothing / dressing and dyeing of fur DB_18 1 (dynamic specialisation)
06 Tanning and dressing of leather/ manufacture of luggage,
handbags, saddlery, harness and footwear DC_19 4 (stationary specialisation)
07
Manufacture of wood and of products of wood and cork,
except furniture/ manufacture of articles of straw and plaiting
material
DD_20 2 (retreat)
08 Manufacture of pulp, paper and paper products DE_21 3 (lost opportunities)
09 Publishing, printing and reproduction of recorded media DE_22 3 (lost opportunities)
10 Manufacture of coke, refined petroleum products and nuclear
fuel DF_23 3 (lost opportunities)
11
Manufacture of chemicals and chemical products (except
Manufacture of pharmaceuticals, medicinal chemicals and
botanical products)
DG_24 except
24.4 3 (lost opportunities)
12 Manufacture of pharmaceuticals, medicinal chemicals and
botanical products DG_24.4 3 (lost opportunities)
13 Manufacture of rubber and plastic products DH_25 3 (lost opportunities)
14 Manufacture of ceramic tiles and flags DI_26.3 2 (retreat)
15 Manufacture of other non-metallic mineral products (except
Manufacture of ceramic tiles and flags)
DI_26 except
26.3 2 (retreat)
16 Manufacture of basic iron and steel and of ferrous alloys and
ferrous products
DJ_27.1, 27.2, 27.3, 27.51,
27.52
1 (dynamic specialisation)
17 Manufacture of basic precious and non-ferrous metals and
non-ferrous products
DJ_27.4, 27.53,
27.54 1 (dynamic specialisation)
18 Manufacture of fabricated metal products (except machinery
and equipment) DJ_28 4 (stationary specialisation)
19 Manufacture of machinery and equipment n.e.c DK_29 1 (dynamic specialisation)
20 Manufacture of office machinery and computers DL_30 4 (stationary specialisation)
21 Manufacture of electrical machinery and apparatus n.e.c. DL_31 4 (stationary specialisation)
22 Manufacture of electronic valves and tubes and other
electronic components DL_32.1 4 (stationary specialisation)
23 Manufacture of radio, television and communication
equipment and apparatus
DL_32 except
321 4 (stationary specialisation)
24 Manufacture of medical, precision and optical instruments,
watches and clocks DL_33 2 (retreat)
25 Manufacture of motor vehicles, trailers and semi-trailers DM_34 4 (stationary specialisation)
26 Building and repairing of ships and boats DM_35.1 4 (stationary specialisation)
27 Manufacture of aircraft and spacecraft DM_35.3 4 (stationary specialisation)
28 Manufacture of other transport equipment DM_35, except
35.1, 35.3 4 (stationary specialisation)
29 Manufacture of furniture DN_36.1 4 (stationary specialisation)
30 Manufacture of games and toys DN_36.5 4 (stationary specialisation)
31 Manufacture of games and toys DN_36, except
36.1,36.5 4 (stationary specialisation)
Source: Own elaboration from PITEC and OECD patent data.