Embed Size (px)
Citation preview

FACTORS AFFECTING PLANT LOCATION DECISIONS OF U. S. BROILER EXECUTIVES
A Thesis
Submitted to the Graduate Faculty of the Louisiana State University and
Agricultural and Mechanical College In partial fulfillment of the
Requirements for the degree of Master of Science
in
The Department of Agricultural Economics and Agribusiness
by Pramod R. Sambidi
B. Sc., Acharya N. G. Ranga Agricultural University, 1999 May 2003

ii
Acknowledgements
I would like to take this opportunity to thank everyone who contributed to the successful
completion of this thesis. First of all, I would like to thank my major professor, Dr. Wes
Harrison, for his invaluable advice, support, guidance and patience throughout my program. I
also would like to thank my committee members Dr. Jeff Gillespie, Dr. Deborah Tootle of the
Department of Agricultural Economics, and Dr. James Farr of the Department of Food Science
for their hours of review and recommendations for this study. My special thanks to Dr. James
Farr for his technical help during the development of survey questionnaire. Also to Dr. Gail
Cramer, Head, Department of Agricultural Economics, the faculty, staff, and fellow graduate
students for their help and friendship throughout my course of study.
Furthermore, I would like to thank my friends for being there with their support during the
times I needed the most. Lastly, I am very grateful to my parents Anitha and Indrasena Reddy,
and to all my other family members, whose patience, love, support, and encouragement I could
not have done without.

iii
Table of Contents
ACKNOWLEDGEMENTS…………………………………….....………………………………ii
LIST OF TABLES…………...………………………………………………………….…..….... v
LIST OF FIGURES……………........................................................................................…........vi
ABSTRACT……………………………………………………………………………..….…...vii
CHAPTER 1 INTRODUCTION The U. S. Broiler Industry……………………………………………………………….…..….1 Vertical Integration……………………….…………………………………………..……...…1 The U. S. Broiler Situation……………………………… …………………………….............3 Problem Statement.........................................................................................................…..........9 Justification………………………………………………………………………………..……9 Research Question and Objectives………………………...…………………….…….…...….10 Over View of the Study………………………...………………………………….………......10
CHAPTER 2 REVIEW OF LOCATION THEORY AND RELATED LITERATURE Industry Location Theory…………………...…………………………………………..….….11 Literature Review of Broiler Industry Location Factors……..………..…………..………......21 Potential Impact on Rural Communities…………………………………………………....…29
CHAPTER 3 REVIEW OF CONJOINT ANALYSIS THEORY AND MODELS Conjoint Analysis…………………………………………………………….……………….33 Utility and Location Preferences……………………………………………………………...34 Composition Rule……………………………………………………………………………..36 Conjoint Data Collection……………………………………………………………………...38 Methods………………….………………………………………………………...……….…39 Attribute and Level Selection………………………………………………………………....40 Broiler Growing Enterprise…………………………………………………………………...41 Feed Mill Enterprise…………………………………………………………………………..44 Broiler Processing Enterprise…………………………………………………………………44 The Experimental Design……………………………………………………………………..46 Conjoint Data Analysis………………………………………………………………………..49 The Experimental Bridging Design……………………………………………………...…....52 Specific Research Hypothesis …………………………………………………………....…...57
CHAPTER 4 RESULTS Summary of Sample Characteristics…………………………………………………………..60 Conjoint Analysis of Individual Enterprise……………………………………….…………..62

iv
Bridging Estimates…………………………………………………………………………….71 Analysis Additional Factors ………..………………………………………………………….74
CHAPTER 5 SUMMARY AND CONCLUSIONS Summary………………………………………………………………………………………76 Statistical Results……………………………………………………………………………...77 Conclusions……………………………………………………………………………………79 Limitations and Future Research…………………………………………………………....…81 REFERENCES…………………………………………….…………………………………......83 APPENDEX: COPY OF MAIL QUESTIONNAIRE....……………………….……….……..…89 VITA…………………………..………………………………………………………....……...101

v
List of Tables
Table 1.1 The U.S. Broiler Industry in 2000……………………………………………………...5
Table 1.2 Number of Poultry Slaughter and Processing Establishments in the Southeastern United States (1965 –2000)……………………………………………………………………….7 Table 1.3 Total Broiler Production by Selected State and Average Percentage Change in Broiler Production (1991-2000)…………………………………………………………………………...8 Table 2.1: Transportation and Labor Factors in Von Thünen’s Theory of location…………......13
Table 2.2 Top Ten Corn Producing States in 2001…………………………………….………...23
Table 2.3 Top Ten Soybean Producing States in 2001……………………………….………….23
Table 3.1 Factors Related to Broiler Growing Enterprise……………..………………………...43
Table 3.2 Factors Related to Feed Mill Enterprise………………..……………………………..45
Table 3.3 Factors Related to Broiler Processing Enterprise………………..……………………45
Table 3.4 Additional Factors Related to Broiler Industry…………………………..…………...47
Table 4.1 Results of Questions Related to Respondents Broiler Operations……………..……..61
Table 4.2 Two-Limit Tobit Part Worth Estimates for Broiler Growing Enterprise……...……...64
Table 4.3 Relative Importance of Broiler Growing Attributes…………………………………..64
Table 4.4 Two-Limit Tobit Part Worth Estimates for Feed Mill Enterprise………………....….66
Table 4.5 Relative Importance of Feed Mill Attributes……………………………………….…66
Table 4.6 Two-Limit Tobit Part Worth Estimates for Broiler Processing Enterprise……...……68
Table 4.7 Relative Importance of Broiler Processing Attributes………………………………...70
Table 4.8 Pooled Analysis: Bridging Estimates for Broiler growing and processing……...……72
Table 4.9 Bridging Estimates for the Broiler Industry…………………………………………..73
Table 4.10: Percentage Importance of Additional Attributes Related to Infrastructure in the Broiler Industry Location Decision……………………………………………………………...75

vi
List of Figures
Figure 2.1: Weber’s Theory of location with a series of isodapanes.……………...…….………17
Figure 2.2 Least-Cost Locations…………………………………………………………………18
Figure 3.1 Representation of a Profile…………………………………………………………...35
Figure 3.2 Graphical Forms of the Additive and Multiplicative Decision Models……………...37

vii
Abstract
The broiler operations in the United States, which are concentrated in the southeast and
south central regions are unevenly distributed within those states. The major concern for
Louisiana’s broiler industry is that even though its production is increasing every year it is
relatively low compared to many other southeastern states. This study analyzes the relative
importance of factors that affect location decision of a broiler complex.
A national survey of broiler industry executives is conducted to analyze site-specific factors
related to the broiler-complex location problem. Conjoint analysis is used to measure the relative
importance of each attribute in the location decision. Three different conjoint models are
constructed based on factors related to broiler growing, feed mill, and broiler processing
enterprise. A bridged experimental design is used to link the three models. Distance between
feed mill and growers, cost of feed ingredients, and community attitude toward the broiler
industry are found to be the most important factors influencing the location decision of broiler
growing, feed mill, and broiler processing respectively. Results from bridging design indicate
that cost of feed ingredients is the most important attribute affecting the location of a broiler
complex.
As cost of feed ingredients was found to be the most critical factor in the location decision of
their broiler complex, this study concludes that Louisiana should analyze the factors that can
lower the costs of importing feed and / or analyze other important factors affecting the broiler
complex location decision such as growers concentration, community attitude toward the broiler
industry, and labor costs. A future research can be directed toward analyzing the cost
differentials in the southern region and also identifying the factors that affect community’s
attitude toward the broiler industry.

1
Chapter 1 Introduction
The U. S. Broiler Industry
The U. S. poultry industry is the world’s largest producer and exporter of poultry meat,
producing approximately 43 billion pounds of broilers in 2001 (USDA, Poultry-Production and
Value, 2002). Broiler production in the U.S. continues to increase. According to the USDA, the
value of broilers produced during 2001 was $16.7 billion, up 19 percent from 2000 (Agricultural
Statistics Board NASS, USDA April 2002). In 2001, the wholesale price of broilers also
increased to 59.1 cents per pound, up 2.9 cents per pound from 2000 (Lavergne, 2002). In the
U.S., consumption of poultry meat is higher than that for beef or pork. In 1960, the average
American consumed 63.3 pounds of beef, 59.1 pounds of pork, and 34.3 pounds of poultry. By
2001, the per capita consumption was 66.2 pounds of beef, 53 pounds of pork, and 97.7 pounds
of poultry (ERS/USDA). This shows an increase of 185 % in poultry consumption since 1960.
The per capita consumption of broilers is expected to have increased to 80.5 pounds in 2002
(Wegenhoft 2002).
Vertical Integration
The broiler industry is often cited as an example of a vertically integrated production
system. There are approximately 200 vertically integrated poultry processing plants in the United
States, employing around 250,000 workers (United Food and Commercial Workers Union).
Many manufacturing industries tend to vertically integrate their channels of production,
marketing, and distribution in order to reduce risk and gain control of product flows across stages
of production. For example, the source of risk at the producer-first handler level includes price,
quantity, quality, and timing of delivery. The degree of risk varies from one commodity

2
transaction to the other, and across the vertical linkages of a commodity marketing-food
distribution channel (Sporleder, 1992). Sporleder classified three types of vertical integration:
complete, taper, and quasi integration. Complete integration involves transferring all of one
input or all of one output to a solely owned downstream firm (Harrigan 1983; Sporleder 1992).
In the case of taper integration, a firm utilizes some fraction of the input from its vertically linked
operation and the rest is purchased from the market (Sporleder 1992). Quasi integration involves
vertically linked firms without fully owning them, where the processor controls the decision of
inventory, delivery schedules, quality of input, and buffer stocks in terms of contractual
agreements with the producer. Here, the processor contracting for input indirectly seeks to
influence coordination without assuming the risks associated with the production of the input
(Sporleder 1992). The broiler industry can be considered as a typical example of quasi
coordination, where the processor indirectly controls the production of broilers. Here the
processor decides when the grower has to produce broilers and how many he should produce.
The processor also supervises the quality of broilers.
Vertical integration of the broiler industry evolved during the 1950s.This type of vertical
coordination is highly efficient and is believed to be the main reason for the success of the
broiler industry. All commercial broilers produced in the U.S. are grown by either complete or
quasi vertically integrated companies, where the company supervises and controls all the aspects
such as production, marketing, and distribution. A vertically integrated broiler complex includes
broiler growing enterprise, hatcheries, feed mills, processing plants, and secondary processing
plants. Some companies may also have rendering plants and water treatment plants. Of these,
broiler growing, the feed mill, and broiler processing are the three key enterprises. Most vertical
integration in the broiler industry involves a contract system between the broiler companies and

3
growers. “It is a system that has provided farmers an opportunity to participate in broiler
production, while allowing integrators opportunities to invest their capital in the processing and
marketing segments of business” (Cunningham 1999). The grower contract is a written
agreement between the integrator (company) and the grower that includes terms of payment,
settlement sheets, grouping or ranking sheets, and condemnations and grading certificates
(Cunningham 1999). “Most of the contracts are for one flock and may be renewed automatically
until cancellation of either party” (Cunningham 1999).
In the U.S., approximately 99 percent of all broilers are produced under contracts
(Cunningham 1999). In a typical contract, the grower builds chicken houses and is responsible
for land, labor, litter, equipment, taxes, utilities, and insurance for producing broilers. The
integrator provides technical assistance, baby chicks, feed and medication, labor and equipment
for catching and transporting the birds to the processing plants, secondary processing plants, and
the final market (Vest and Lacy 1996). The company pays the grower about 3.0-4.5 cents per
pound of broiler marketed for labor and facilities (Vest and Lacy 1996). Based on the contract
agreement, the integrator pays higher rates to growers that do an outstanding job. That is,
growers having lower mortality rates, producing more pounds of broiler for a given amount of
feed, or by having fewer birds condemned during the process than the average grower (Vest and
Lacy 1996).
The U. S. Broiler Situation
There are approximately 43 integrated broiler companies in the U. S., of which the top
four broiler companies produce nearly 50% of the broiler meat. Eighty-two percent of all
broilers come from 10 states (The Humane Society of United States and Sustainable Agriculture
Section). At present, broiler production is concentrated in the southeastern United States. Nine of
4
the top ten poultry-producing states are in the southeast, which include Georgia, Arkansas,
Alabama, Mississippi, North Carolina, Texas, and Virginia. The broiler industry has a large
impact on the economy of these states. For example, Georgia’s poultry segment is the state’s
largest agricultural industry, generating about $3 billion in annual farm income, and more than
44 percent of the state’s agriculture and agribusiness economy (Georgia Agricultural Resources,
2001). The poultry sector is also the largest agricultural sector in Mississippi, exceeding $1.5
billion in sales at the farm gate (Morgan and Murray, 2000).
Table 1.1 presents the U. S. broiler industry situation in 2000. Georgia is the top broiler
producing state with 6.15 billion pounds of broilers, followed by Arkansas with 5.30 billion
pounds. In contrast, Louisiana produced approximately 1 billion pounds of broilers in 2000,
which is relatively low compared to the broiler production in bordering southeastern states (table
1.1). Moreover, broiler operations in the U. S are unevenly distributed, with Arkansas having the
highest number of establishments (48) followed by Georgia with 40 establishments. Alabama,
North Carolina, Mississippi, Texas, and Virginia also have a relatively large number of broiler
processing establishments compared to the other southeastern states, such as South Carolina,
Louisiana, and Florida. Louisiana has only 7 processing establishments producing around 992
million pounds of broilers in 2001 with a gross farm value of $395 million (2001 Ag. Summary
for Louisiana). The total number of employees involved in broiler processing in Louisiana was
4,113 in 2000 (U.S. Census Bureau 2000).
The seven processing plants are located in Bienville, Bossier, Natchitoches, St. Landry,
St. Martin, Tangipahoa, and Union parishes (2000 County Business Patterns). The largest
processing establishment is located in Union parish, employing between 1,000-2,499 employees.
Louisiana has approximately 575 broiler growers, producing commercial broilers in 12 parishes

5
Table 1.1: U.S. Broiler Industry in 2000
State No. of Est.1
Number of Employees1
Broiler Prod.2 (1000 pounds)
Price per Pound ($)2,3
Value of Prod.2 ($1000)
Georgia 40 31,439 6,148,500 0.330 2,029,005 Arkansas 48 34,741 5, 297,400 0.330 1,926,969 Alabama 32 21,111 5,297,400 0.330 1,748,142 North Carolina 26 18,506 4,050,700 0.350 1,417,745 Mississippi 21 16,498 3,699,500 0.330 1,220,835 Texas 18 12,361 2,589,700 0.340 880,498 Delaware 7 5,000-9,999 1,461,400 0.340 496,876 Maryland 7 3,011 1,359,800 0.340 462,332 Virginia 16 10,811 1,298,000 0.340 441,320 Kentucky 4 3,878 1,150,000 0.330 379,500 Oklahoma 5 2,500-4,999 1,093,200 0.330 360,756 South Carolina 11 6,561 1,003,700 0.330 331,221 Pennsylvania 22 3,966 693,200 0.350 242,620 Tennessee 11 6,781 696,000 0.330 229,680 Florida 9 3,064 647,500 0.350 226,625 West Virginia 3 2,634 365,200 0.340 124,168 Ohio 10 1,631 223,900 0.330 73,887 Minnesota 20 6,221 221,000 0.330 72,930 Wisconsin 8 2,679 147,600 0.340 50,184 Nebraska 5 434 19,000 0.330 6,270 New York 9 250-499 11,800 0.360 4,248 Hawaii 2 0-19 3,700 0.545 2,017 Other States4 96 27,760-29,907 3,603,000 0.350 1,260,606
Source: 1 2000 County Business Patterns (NAICS 311615), 2 USDA-NASS (April 2002), 3 Live weight equivalent prices, 4 Include CA, IN, IA, LA, MO, OR & WA

6
including Bienville, Claiborne, Jackson, Lincoln, Livingston, Natchitoches, Ouachita, Sabine,
Union, Vernon, Webster, and Winn parishes. Union is the largest broiler producing parish in
Louisiana (2001 Ag. Summary for Louisiana). Parishes producing commercial broilers also have
a processing plant located in their region or in a surrounding parish.
Tables 1.2 and 1.3 show the changing pattern of broiler-processing establishments and
broiler production in selected southeastern states. Table 1.2 indicates that there are some
significant changes in the pattern of distribution of processing establishments in those states. In
1965, Texas was the leading state in terms of number of establishments (53). But, the number
dropped quite dramatically over a period of 1970-1975 from 50 to 32 establishments. As of
2000, Texas has 18 processing establishments, a drop of 66% since 1965. The overall pattern
was irregular for most of the states; there was an unexpected increase and decrease in number of
establishment for some states. For example, the number of establishments in Georgia, North
Carolina, and Mississippi decreased significantly over the period, 1970-1975. Conversely, during
1990-1995, the number of establishments in Arkansas, Georgia, North Carolina, and Texas
increased significantly. In case of Louisiana, there were some significant changes in the pattern.
The number of establishments in Louisiana increased from 1965 to 1970 and decreased from
1970-1975. There has been no increase in the number of broiler establishments for Louisiana
from 1995-2000.
Broiler production in Louisiana has shown significant growth over the 1991-2000 time
period. The average percentage change of broiler production in Louisiana from 1991-2000 was
6.51 %, which was third behind South Carolina (10.63 %) and Mississippi (7.09 %) as indicated
in table 1.3. There was a considerable increase in broiler production from 1999-2000, even
though the number of establishments remained the same. This suggests that, in spite of having

7
Table 1.2: Number of Poultry Slaughter and Processing Establishments in the
Southeastern United States (1965 –2000).
State Total Establishments 1965 1970 1975 1980 1985 1990 1995 2000 Arkansas 45 37 36 41 42 38 46 48 Georgia 44 47 35 42 41 40 47 40 Alabama 33 29 25 27 25 33 38 32 North Carolina 37 39 28 27 19 24 34 26 Mississippi 27 28 19 24 21 23 27 21 Texas 53 50 32 27 14 15 25 18 Virginia 16 17 15 13 16 17 17 16 South Carolina 10 11 9 8 7 7 11 11 Louisiana 9 14 8 4 4 3 7 7
Source: U.S Census Bureau (County Business Patterns)

8
Table 1.3: Total Broiler Production by Selected State and Average Percentage Change in Broiler Production
(1991-2000).
State Broiler production (in million pounds) and Avg. Percentage change in Broiler production (Apc)
1991 1992 1993 1994 1995 1996 1997 1998 1999 2000 Apc (91-00)
Georgia 3816.1 4025.7 4416.0 4723.5 5136.0 5654.6 5914.0 5892.3 6198.5 6148.5 5.38
Arkansas 4214.9 4499.0 4614.7 4853.7 4982.9 5659.5 5590.1 5618.9 5861.4 5839.3 3.72
Alabama 3763.8 3854.5 3969.9 4184.2 4230.0 4191.8 4349.8 4516.8 4953.1 5297.4 3.89
North Carolina 2679.3 2852.4 3137.5 3217.5 3417.5 3541.7 3657.5 3591.5 3865.5 4050.7 4.60
Mississippi 1962.9 2144.5 2429.7 2711.7 2962.4 3109.1 3313.4 3467.5 3675.5 3699.5 7.09
Texas 1496.9 1582.2 1623.2 1669.5 1746.8 1886.4 2093.5 2160.0 2387.1 2589.7 6.28
Virginia 984.1 1048.0 1124.2 1187.7 1196.5 1243.7 1219.2 1263.8 1316.6 1298.0 3.07
Louisiana 626.0 643.0 764.0 780.0 785.0 788.0 827.0 811.0 856.4 1100.0 6.51
South Carolina 394.8 446.9 514.4 588.8 680.4 786.3 829.9 848.4 924.0 1003.7 10.63
Source: 1.National Agricultural Statistics Service, Agricultural Statistics Board, U.S. Department of Agriculture
2.Louisiana Ag. Center, Louisiana Agricultural summary.

9
great potential for broiler production in Louisiana, there is no significant growth in the number of
establishments.
Problem Statement
In spite of relatively low production compared to other southeastern states, the broiler
industry continues to be the largest livestock industry in Louisiana, and is second only to forestry
in total income production for all agricultural commodities (Louisiana Summary, 2001). This
shows that there is a great potential for broiler production in Louisiana relative to other
agricultural commodities. Therefore, it is important to determine the factors associated with the
uneven distribution of broiler operations in the southeastern states. For example, Arkansas,
Georgia, Alabama, Mississippi, North Carolina, Texas, and Virginia are the leading broiler
producing states, whereas poultry operations remain low in other southeastern states (e.g.,
Florida, Louisiana, South Carolina, and Tennessee). Thus, determining these factors will aid
Louisiana in developing strategies to better retain and attract the broiler companies, which in turn
will boost its economy.
Generally speaking, processors who are considering expansion of an existing plant, or
building a new plant evaluate alternative locations by assessing trade-offs among different
location attributes. The reasons some states are better able to attract poultry processing compared
to other states in spite of high growth and demand for broilers are not well understood. The
purpose of this study is to determine the reasons behind this uneven distribution of broiler
complexes within the southeastern states by analyzing the relative importance of factors affecting
the location of the broiler industry.
Justification
The establishment of a new firm in a community increases the population of that area and
stimulates the local economy by attracting new workers from other regions (Leistritz, 1997).

10
Several studies show that growth of the food processing industry influences rural development.
Hughes and Harrison (1997) studied the economic impact of agribusiness industries on total
employment in all parishes of Louisiana. They found that food-processing industries increased
the rural employment rate. Hughes (1995) studied the impact of the agricultural production and
processing industries on the Louisiana economy. He found that production and processing of
wood products, sugarcane, and poultry had large impacts on Louisiana’s economic activity.
Development of broiler processing in rural areas of Louisiana can increase the employment
opportunities for rural people, thus improving Louisiana’s rural economy. Hence, studying the
factors responsible for new broiler complex establishments in Louisiana compared to those of
other southeastern states will benefit rural development efforts in the state.
Research Question and Objectives
The primary question this study seeks to address is: how do factors such as feed cost, utility
cost, labor cost, grower availability, proximity to input and output markets, access to growers,
and community attitude affect the location decisions of broiler industry executives in the U.S.?
The objectives of the study are; 1. identify factors affecting location decisions of broiler
complexes in the United States; and 2. quantify the effect and measure the relative importance of
each of the above-determined factors on the broiler complex location decision.
Overview of the Study
Following the introduction, location theory and related literature are reviewed in chapter 2.
Chapter 3 presents the theoretical background of conjoint analysis, and empirical models
associated with this study (i.e., experimental design, attributes and levels, questionnaire design,
and survey procedures). Chapter 4 presents the results of the analysis, and Chapter 5 presents the
summary, conclusion and implications, and needs for future research.

11
Chapter 2 Review of Location Theory and Related Literature
Industry Location theory
In establishing a new plant, the first question that comes to mind is where to locate the
facility? Economists generally consider selection of suitable sites as an important criterion for
reducing the cost of production and maximizing profits. There are different types of costs such as
transportation cost, labor cost, raw material cost, land cost, and utility cost, etc., associated with
production of a particular product. Decision makers consider these costs, and try to minimize
them all, but the nature of the decision often requires that trade-offs be considered before
deciding to locate at a particular site.
The purpose of location theory is to determine the reasons for and explain why a
particular factor is important to one industry and not to another (Greenhut, 1982). It also involves
the principle of substitution, where an industry selects a site from alternative locations, which in
terms of the economic theory, is similar to the problem of substituting labor for capital or land
and vice versa (Greenhut, 1982). To better understand location theory, this study presents the
location theories of leading writers as explained by Greenhut (1982). All these theories generally
relate the importance of cost advantage to the selection of a site. Some of them also emphasize
demand forces influencing the plant location decision. Examination of these writings will build a
framework to better understand the rationale behind broiler industry location decisions. The
leading theories of plant location begins with Von Thünen’s Theory of Location (Greenhut,
1982).
Von Thünen developed his theory in the context of agricultural farm produce. This theory
emphasizes the non institutional factors of location. He assumes that a land surface is

12
homogenous in all respects, except for the distance from a farm to the consuming center, or the
city. The city is considered to be the center of a region where the manufacturing industries are
located and around which agricultural farms are located. People in the city trade with the
outlying districts by supplying them with manufacturing goods in exchange for agricultural
produce, food, and raw material. Farm produce is sold in the outlying districts at a city price, less
the difference in the cost associated with transporting the goods to the city. Von Thünen
assumes that land rents are high in the city, and decrease with movement away from the city. The
same is true with respect to the intensity of land cultivation and density of population. This
implies that agricultural product that is grown on plots of land closer to the city is charged more
land rent than the product that is grown further away from the city. Conversely, agricultural
product grown closer to the city is associated with less transportation cost (from the plot to the
market) than the product that is produced on a plot further away from the city. As it can be seen,
this theory explains the location of agricultural produce in terms of the trade off between
transportation cost and land rent. The other general factors such as capital and labor are
considered to be less important in his theory, as it assumes a homogenous land surface and
complete mobility of capital. The labor skill and cost are considered to be same everywhere, or
an inequality in the wage (labor cost) is assumed to be known (Greenhut 1982). Greenhut
applied Von Thünen’s location theory the analysis of site-selection of manufacturing plants. He
assumes that land rents reflect inequalities in the wage levels and labor costs. He illustrates the
role of transportation cost and labor cost in Von Thünen’s theory of location as follows:
Assume two commodities, A and B, and two possible locations, X and Y; X being situated
M miles from the city and Y being the urban site. Labor (L), receives equal real wages
everywhere; however, the nominal wages vary in accordance with the cost of living. The cost of

13
living, which is represented as the cost of food, is assumed to be $1 higher at Y than the rural site
X. As indicated in table 2.1, the nominal wage of L is $7 at X and $8 at Y; therefore, the cost of
production is $7 and $8 at X and Y, respectively. A unit of L at either A or B yields 1A and 1B,
assuming land is equally fertile and labor is equally productive everywhere. Assuming an
inelastic demand for goods in the city, so that good A or B sells for $10. In addition, T, the
transportation cost is $3 for the finished product B, and $2 for the finished product A (assuming
finished product B is a heavier, bulkier commodity, or a more perishable product, and A is less
bulky and a commodity that can be handled with less difficulty). Based on these assumptions,
where will A and B be produced?
At location X, the cost of producing good A is $7, and the transportation cost is $2. Thus, its
cost at the city, exclusive of rent at X, is $9. If good B is produced at location X, the cost of
production is $7, the transportation cost is $3 and its cost at the city exclusive of rent at X, is thus
$10. Thus, at site X, good A can pay a maximum rental of $1 and at X, B cannot pay rent. On the
other hand, if good A is produced at Y, the cost of production is $8, with zero transportation cost
and a rent of $2 can be paid. If B is produced at Y, the cost of production is $8, with zero
transportation cost; again the producer can pay rent of $2. Therefore, the opportunity rental cost
Table 2.1: Transportation and Labor Factors in Von Thünen’s theory of location.
Product Cost of Transportation Location
Cost of production (Wages of labor)
A $2 X (rural) $7 B $3 Y (urban)
$8

14
at Y is $2. At X, A’s opportunity rental cost is $1 and B’s opportunity rental cost is zero. This
indicates that B must locate (be produced) at Y. Production of good A initially moves to X and at
first pays a zero rent plus a small increment. In the long run, profits associated with producing A
at X induce new competition and eventually the rent at this site rises to $1.
The nominal wage differential in Von Thünen’s theory is therefore treated as an element of
land rent in this illustration. Thus, B’s land cost at Y is the $2 rent and $1 additional wage which
is paid to workers at Y in equalization of real wages; A’s land cost at X is the $1 rent ( the food
transfer advantage); B’s land cost, if produced at X, would be the same $1. In summary, B is
produced at Y in order to reduce the transportation cost (at Y transportation cost is zero) and A is
first produced at X in order to economize on land cost, but in equilibrium it can locate at X or Y.
Thus, Von Thünen’s theory of location illustrates the principle of substitution involving
transportation cost and land cost in order to obtain a least-cost location (Greenhut, 1982).
Weber’s theory of location uses a different approach compared to that of Von Thünen’s. In
the earlier theory, resource allocation is given and the type of production is determined.
However, in Weber’s theory, the type of industry is given and the suitable site of location is
sought. Weber defined the primary locational factor as an advantage in cost saving, which is
gained when an economic activity takes places at a particular point or several such points rather
than elsewhere. This means at that particular location, an industry can produce and distribute a
certain quantity of a product at lower cost relative to some alternative location (Greenhut, 1982).
Von Thünen’s theory assumed homogenous land and one consuming center. Weber
assumed that the geographical basis of materials is known, the geographic nature of the sphere of
consumption is known, and there is an unlimited supply of labor at fixed locations at a given
wage rate.
15
Weber considered three general factors of location: transportation cost, labor cost, and
agglomeration forces. Transportation and labor costs are considered to be general factors and the
agglomeration forces are regarded as general local factors. To simplify the analysis, Weber
included the data for costs of fuel and raw materials under the transportation cost. According to
him, differences in the price of material deposits may be expressed as differences of cost of
transportation. Thus, a site where the cost of raw material is high, compared to other locations,
is considered to be more remote than alternative sites.
When transportation costs are the only factor affecting the location of an industry, the site
with lowest transportation cost will be selected. This site may be close to the output market, to
the input market, or in between input and output market depending upon the product. When it is
more costly to transport the raw material (input) than the finished product, the industry will tend
to locate closer to the source of raw material. Accordingly, when it is harder to transport the
finished product than the raw material, the industry will tend to locate closer to the final market
(output market).
The second factor Weber considered important is the cost of labor. The labor factor
exerts a locational pull, where in some cases it attracts an industry from a point of low
transportation cost to a point where transportation cost if high. This change occurs as long as the
savings in the labor cost are greater than the additional transportation costs incurred due to the
shift from the point of minimum transportation. The other factor Weber talks about is the
agglomeration factor, which can draw an industry closer together or away from each other. The
agglomeration economies such as, proximity to auxiliary industries, proximity to markets, and
economies of size attract an industry together, whereas the deglomerating factor such as high

16
land cost tends to offset industry concentration. Institutional factors such as, the interest rate,
insurance, taxes and other similar forces are excluded by Weber in his theory of plant location.
Weber explained the orientation of industries on the basis of substitution between
transportation costs and non-transportation cost factors. In his theory a series of isodapane1
curves are placed around the minimum transportation cost point, with the curve farthest away
from the minimum transportation point representing the sites with highest deviation costs. The
deviation costs are the additional transportation costs associated with the migration of industries
from the point of minimum transportation cost. These isodapane curves, curves of equally high
additional cost of transportation, form the theoretical connecting link between the
transportational minimum points and the deviation points which represent labor locations. In
simple terms, a particular isodapane indicates the cost of deviating from the point of minimum
transportation to a site located on that particular isodapane. If one of these isodapanes exceeds
the least-cost transportation point by an amount equal to the economies obtained with labor cost
at an alternative point, this curve is known as critical isodapane. Hence, it is understood that if
the labor location lies on a lower isodapane than the critical isodapane, its economies exceed the
deviation cost; if the labor location lies on a higher isodapane, the deviation costs will exceed the
economies. That means a labor location will attract the industry if it lies below the critical
isodapane. That is, if its economies of labor are greater than the additional transportation costs.
Conversely, a labor location cannot attract an industry if it lies outside the critical isodapane
because the economies associated with the migration would be less than the deviation in
transportation costs and the industry.
1 Isodapanes represents points of equal cost

17
For example, in figure 2.1, M represents the point of minimum transportation cost. The
concentric circles around M represent a series of isodapanes. The isodapane illustrated in bold is
the critical isodapane where the economies associated with labor costs are equal to the deviation
in transformational costs. Therefore, an industry will be better off if it locates with in the critical
isodapane (shaded region in the figure), as the economies associated with labor cost is greater
than the additional transportation costs. The industry will be worse off if it locates outside the
critical isodapane (unshaded region in the figure), as the economies associated with the labor
cost are smaller than the additional transportation cost. In the figure, the industry will be better
off by locating at A or B and worse off by locating at C or D. However, this explanation does not
indicate a particular site that is associated with least cost of production.
Figure 2.1: Weber’s theory of location with a series of isodapanes.
D D aaaaaaaaaaaaaaaaaaaaaa A b
B n C B C BBbbbbbbbb
A
M
C
B

18
Greenhut graphically illustrated the Weber theory of plant location in terms of transport
and non-transport costs as indicated in the figure 2.2. The transport costs are illustrated on the
vertical axis. They include the cost of transporting raw materials from input producing regions,
and the cost of distributing to the final markets. Agglomeration factors, such as proximity to
auxiliary industries and better marketing outlets are also included in these costs. Non-transport
costs are illustrated on the horizontal axis. They include the cost of land and labor and other
fixed costs associated with economies of size. The respective costs increase as the site locations
move away from the origin. The curve labeled SS is an isosale curve indicating a series of
locations where equal units may be sold. This isosale curve assumes the long-run position where
each firm is of same size and sells the same number of finished products.
Y O X
Figure 2.2 least-cost locations (Source: Greenhut 1982)
A
B
C
D
E
F G
S
S
Non-Transport costs
Tra
nspo
rt c
osts
Q

19
This curve does not show the implicit cost advantages for the best located industries in
the long run. These implicit costs are represented pictorially as the difference between the
explicit costs of the highest cost location and the lowest cost location (for example cost
difference between Q and A or B or C, etc.). A movement from O to X or Y indicates an increase
in cost of production. The point D on the isosale curve indicates the location where plant
relocation results in a one-to-one trade offs between transport costs and non-transport costs. The
curve is less elastic from point D to A, and more elastic from point D to G. When an industry
moves from point B to A, it experiences economies in terms of a decrease in non-transport cost,
but at the same time it experiences an increase in transport cost which is more than the savings
gained by the movement. It is the same case when the industry moves from point C to B. A
movement from E to F and F to G indicates a small savings in transport costs but at an expense
of large increase in the non-transport costs. Point D on the isosale curve is the least-cost location
indicating unitary elasticity. A movement to the right and left from D leads to a greater non-
transport costs and transport costs, respectively with out experiencing enough savings to offset
the increase in costs. Therefore, the industry prefers to locate at point D, which is the optimal
cost location (Greenhut 1982).
Even though Weber’s location factors such as transportation costs, labor costs, and
agglomeration forces indicate the general theory of location for all industries, his assumption of
constant demand and his omission of institutional factors leaves gaps in the theory which must
be studied to better understand the theory behind the plant location. Hoover’s theory of plant
location deals with the demand determinants as well as cost factors. Hoover separates the cost
factors into transportation factors and production factors. The transportation factors include the
cost of procuring the raw material and cost of distributing the finished products. The production

20
factors include the land and labor costs, agglomeration forces, differences in fuel cost and raw
material cost, and the institutional factors (Greenhut, 1982).
Hoover takes a different approach from Weber in estimating the importance of
transportation cost. Hoover is more concerned with the characteristics of freight costs than is
Weber. According to Hoover, the transportation cost does not increase proportionally with the
distance; rather the addition of transit cost is less than proportional as the distance increases. The
freight cost is represented as a heavy fixed terminal cost which is independent of the length of
the haul. This indicates that it is profitable to have long haul shipments when the terminal costs
of a transport agency are higher. Thus, the availability of water transport attracts firms which sell
to distant markets. Railroads and trucks attract shipments designed for short and very short hauls,
respectively (Greenhut, 1982).
Hoover also explains the importance of different costs associated with carload-lot and less-
than-carload-lot shipments. Of two firms selling a homogenous product, the firm which
transports larger quantities enjoys carload rates. This firm can place greater emphasis on location
factors other than transportation costs in determining a suitable site. The other firm, which can
only transport smaller quantities at a time, should primarily consider transportation cost than the
other factors in its location decision and locate closer to the market in order to economize on
transportation cost. Hoover also mentions the importance of freight costs in transporting a
perishable product. A firm, which produces products that are perishable, has to pay an extra cost
for safe handling when transporting to the market. Thus, in order to economize on transportation
costs, this firm has to locate itself close to the output market (Greenhut, 1982).
Hoover’s analysis of agglomeration economies is more incisive than that of Weber. The
agglomeration forces in Hoover’s theory include advantages such as better transfer services, a

21
broader, more flexible land market, more advanced banking facilities, better police and fire
protection, and lower insurance costs and utility rates. Thus, a plant can obtain economies by
locating at a site with these agglomeration forces than the alternative sites without these features
(Greenhut, 1982).
Hoover’s inclusion of institutional factors confirms that his theory is more concerned with
the study of all possible location factors than Weber who considered only the general factors of
location. Hoover regards the property tax burden as an element of land cost which effects the
location similarly to the interest burden. He concluded that tax reflects the return to investment,
thereby influencing the location decision. Hoover also indicated the importance of climate in the
location decision. According to him, where the climate is hot, labor may be more sluggish and
labor cost will be high; if refrigeration is used to counteract this tendency, then land cost will be
higher. Conversely, where the climate is cold, heating cost will be high, which in turn indicates
the high land cost (Greenhut, 1982).
The distinguishing aspect of Hoover’s theory is the introduction of production costs which
is different from Von Thünen’s land cost and Weber’s non-transport cost. The production costs
in Hoover’s theory involve land and labor costs, differences in fuel cost and in raw material cost,
agglomeration forces, and the costs generated by factors such as taxes and climate. However, the
location choice is again the problem of substitution: now the production costs and transportation
cost. Thus, all these theories of plant location emphasize the principle of substitution among the
location factors for selecting a least-cost location.
Literature Review of Broiler Industry Location Factors
The location problem of the broiler industry is a good example of the above discussion of
the location theories. The present concentration of the U. S. broiler industry in the South shows

22
the trade off between transportation costs (also includes cost of the raw material and fuel) and the
production costs, which include labor and land cost, utility costs, business climate and the
agglomeration forces. Before discussing this further, it is important to note the role of broiler
feed in the broiler production. The critical components of broiler feed are corn (62.5 %) and
soybeans (27.5%), and the average feed conversion ratio of broilers is approximately 2, which
means for every pound of broiler produced two pounds of feed is consumed. For example, if a
processor who is currently producing 1 million pounds of broilers wants to double his production
(2 million pounds); the first thing the processor has to consider is the cost of acquiring 4 million
pounds of feed. Thus, the production of broilers is directly proportional to the amount of feed
consumed. The feed cost for broilers represents 60 percent of the cost to produce one pound of
live broiler (Bastien and Goan, 1998). Considering this, we can say that the processors tend to
locate close to feed sources in order reduce the cost of feed ingredients and the cost of
transporting the feed. The top corn and soybean producing states in the U. S. are illustrated in the
tables 2.2 and 2.3, respectively. By looking at these tables, we can say that the broiler industry in
the U. S. will be concentrated in the Midwest, especially in Iowa, Illinois, Nebraska, Indiana, and
Minnesota, which are the top five corn and soybean producing states of the U. S. But, this is not
the case with the current spatial distribution of the broiler industry. The total number of poultry
establishments in the top five corn and soybean producing states is 54, which is relatively low
compared to the states in the southeastern region, where Arkansas and Georgia together account
for 88 poultry establishments. In the U. S., broiler operations are currently concentrated in
southeastern and south central states, which account for more than 85 percent of the United
States broiler meat supply (Cunningham, 1999).

23
Table 2.2: Top ten corn producing states in 2001.
Source: USDA
Table 2.3: Top ten soybean producing states in 2001.
State Production (1,000 bushels)
Iowa 1,664,400
Illinois 1,649,200
Nebraska 1,139,250
Indiana 884,520
Minnesota 806,000
Ohio 437,460
Kansas 387,350
South Dakota 370,600
Missouri 345,800
Wisconsin 330,200
Total U. S. 9,506,840
State Production (1,000 bushels)
Iowa 480,480
Illinois 477,900
Indiana 273,910
Minnesota 266,900
Nebraska 222,950
Ohio 187,780
Missouri 186,200
South Dakota 138,570
Arkansas 91,200
Kansas 87,360
Total U. S. 2,891,000
Source: USDA

24
The reasons for the concentration of broiler industries in the South can be attributed to other
costs of production such as: labor cost and land cost (Easterling, Braschler and Kuehn (1986),
Aho 1998). Although the Midwest has the advantage of low cost feed ingredients and low
product transportation cost to large Midwestern cities, it has higher costs of land and labor. “The
difference in labor costs alone per pound of processed broiler meat between the South and The
Midwest is approximately two cents per pound” (Aho 1998). In these cases, labor costs are
considered more critical than transportation costs associated with importing feed. This is
consistent with Weber’s theory that the labor factor can pull an industry from a point of
minimum transportation cost to a point of relatively higher transportation costs. This is also in
accordance with Von Thünen’s theory of location, which involves the principle of substitution
between transportation costs and land rent (which also accounts for labor costs). Apart from
labor costs, other factors such as low land cost, favorable business climate, low rail rates (Aho
1998) and low utility costs (Easterling, Braschler and Kuehn, 1986) are considered to be the
location features that attract the broiler industry towards the South. Apart from the rail rates all
these factors account for production costs as mentioned by Hoover in his theory of plant location,
this production costs are involved in the trade off with the transportation costs to locate a site
with least-cost.
Aho (1998) analyzed the advantages and disadvantages of broiler production in different
regions of the U. S. as follows:
Northeast: This region has all the disadvantages for broiler production; high feed cost,
costly transportation services, high land and labor cost, hostile business climate, and high taxes
(Aho 1998).

25
Midwest: The advantages for broiler production in this region are; low feed ingredient cost
and low product transportation cost. However, there are certain disadvantages, such as, high land
cost, high labor cost, and in certain areas, there are prohibitions for corporate farming. Moreover,
a study conducted in the 1980’s indicated that 98% of farmers interviewed in a county in
Michigan were unwilling to become a contract grower (Aho 1998).
West: Even though this region has some successful broiler firms, it is associated with high
costs of production (mainly transportation cost), high labor cost, and high tax rates (Aho 1998).
South: 90% of broiler production is located in the South. The advantages for this region are;
inexpensive land and labor, a favorable business climate, and inexpensive transportation cost
(cheap rail rates). Kentucky is the fastest growing area in broiler production in U.S. with close to
5% of total U.S. broiler production. Kentucky has the advantages of proximity to the Midwest
feeds, and proximity to Midwestern markets without the labor, and regulatory disincentives of
the industrialized Midwestern states (Aho 1998).
Even though the South has the advantages of low labor cost, low rail rates, low land cost
and favorable business climate, there is an uneven distribution of broiler operations with in the
South. Apart from feed cost, labor and land cost, which are considered to the key variables in the
spatial distribution of the broiler industry, the other factors which are of less importance may
play a key role in the broiler industry location with in the South. The key variable considered for
the location of broiler industry in the South is the need to import feed in addition to that
produced locally (Easterling, Braschler, and Kuehn 1986). Most of the states in the South have to
import the feed from the Midwest or buy at the local market, where both involve the costs of
transportation of feed from the Midwest. A region which can import the feed from the Midwest
or buy from the local market at a relatively low price compared to the alternative locations can

26
attract the broiler industry. Apart from feed there are other factors considered to be important in
broiler complex location. These factors are discussed as follows:
Labor in the broiler industry includes growers, hourly wage workers, catchers, general
mechanics, and refrigerated mechanics. The last three categories of labor are employed mainly
involved in the broiler processing. The catchers transport the broilers from the broiler house to
the processing plant. General mechanics and refrigerated mechanics are the skilled workers
employed by the broiler company in the processing plant. The growers are responsible for
raising the broilers. Most broiler growers work under contract with the company. The
characteristics of contract production are mentioned in the chapter one. Availability of contract
growers and potential growers can be an important factor in the location decision of a broiler
complex. Moreover, the concentration of growers in a particular region can also be an important
factor as it may reduce the cost of transporting feed from the feed mills to the broiler houses and
also the cost of transporting broilers from broiler houses to the processing plants. Most of the
companies specify a maximum allowable distance between a broiler farm and the feed mill or
processing plant in order to lower the cost of transportation (Vest and Lacy, 1996). Availability
of labor may also be an important factor as the broiler industry employees a large number of
unskilled workers. As discussed earlier in chapter one, approximately 250,000 workers are
employed in 200 vertically integrated broiler processing plants in the United States, (United
Food and Commercial Workers Union).
The energy costs are the other important costs associated with the production of broilers.
Natural gas, electricity, and fuel oil are the major forms of energy used in the broiler processing
industry. Berry (1999) found that the availability of utilities (availability and quality of water,
electricity, and natural gas) is the most important factor considered during the site selection.

27
Electricity and fossil fuel accounts for 30 percent and 70 percent of the total energy used by a
broiler processor. According to Carter, Curtis, and Zering (1994) energy costs play an important
role in determining the location of a broiler processing industry as the cost of transporting the
raw material and finished products account for a significant portion of total production cost.
Jones and Lee (1977) analyzed energy use and costs in broiler processing plants in the South.
Fuel use varies from 25,000 to 60,000 therms per month with monthly costs of about $5000,
which account for 65 percent of total energy consumed and 22 percent of energy cost. According
to them, electricity accounts for 35 percent of energy consumption and 78 percent of energy cost.
Conversely, Easterling, Braschler and Kuehn (1986) found energy cost to be of relatively low
importance in determining the location of the broiler industry.
The other important factors related to broiler industry location are factors related to
environmental regulations and costs associated with those factors. Lopez and Henderson (1989)
examined the determinants of location choices of new food processing plants in the Mid-Atlantic
region using the results of a telephone survey. The sample was limited to those firms processing
vegetables, fruits, eggs, poultry and seafood. They conducted 56 telephone interviews, of which
4 were related to poultry processing. Out of the 41 factors surveyed, the attributes considered
most critical for the poultry complex location were; water waste disposal cost, availability of
waste treatment/disposal facility, water pollution regulations, solid waste disposal regulations,
availability of an existing plant facility, stringency of enforcement of environmental regulation,
and capital expenditure for pollution abatement. Surprisingly, the results also showed that labor
factors, and state and local policies are relatively less important in the location decision of a
poultry industry (Lopez and Henderson 1989).

28
The wastewater generated by broiler processing contains environmentally hazardous
chemicals. For instance, in terms of biochemical oxygen demand (BOD5) the waste load of many
broiler plants is 65 pounds or more per thousand broilers. In some places water costs and sewer
charges have increased by a factor of five or ten over the last 25 years (Carawan, Curtis, Keener,
and Taylor). The average water cost for the poultry industry is $1.50 per thousand gallons and it
ranges from $0.96 to $4.30. The cost for sewer services ranges from $1.20 to $5.22 per thousand
gallons, the average being $2.20. The total cost of water and sewer charges for poultry
processing ranges from 1.9 to 8.6 cents per chicken with the average being 3.5 cents per chicken
(Jackson, Carawan, Curtis, Keener, and Taylor).
Broiler litter is a combination of bedding material and manure. Disposal of broiler waste
is a significant problem on large poultry farms. For example, one broiler house containing
20,000 birds per flock, six flocks per year produces approximately 180 tons of manure per year.
If this manure is applied as pasture fertilizer at the rate of three to six tons per acre, one broiler
house will need 30 to 60 acres of pasture land to dispose the manure (Lacy 2002). Broiler litter
is an under-utilized feed for cattle which can reduce beef production cost. It is an excellent
source of protein, energy and minerals (Jacob and Mather, 1997)
Dead bird disposal is a major concern for broiler growers. In general, mortality on poultry
farms can be handled in five different ways. These methods are: disposal pits, composting,
incineration, rendering, and acid fermentation. The traditional method of disposing of dead birds
was placing them in disposal pits, which fill up quickly when there is high mortality during the
growing cycle. In recent years, composting has become the most common method of disposing
of dead birds (Cunningham 1999). There are certain regulations imposed by the State
government on disposing the poultry waste. For example, a study conducted in Georgia mentions

29
that, to obtain a permit for composting poultry mortalities, Georgia growers must submit a
written request to the State Veterinarian describing the disposal procedure and facility type to be
used (Lacy, Savage, Vest, and Hammond 2002). The composted birds must be utilized on the
growers land only. As there are certain environmental concerns associated with broiler industry,
community acceptance may be one of the important factors for broiler complex location
decision.
Potential Impact on Rural Communities
Communities recruit manufacturing plants with the objective that they will provide income
and employment opportunities for the local residents (Barkley, Henry, and Warner, 2002).
Employment growth is considered to be the primary economic development goal of most small
communities (Barkley 2001). The source of employees is an important determinant of this
economic development goal. For example, if employees come from the local pool of
unemployed residents, this will add little to the cost of local public services but local tax
revenues increase. Conversely, if all the new employees are from other communities (in-
migrants), local costs may increase significantly to provide addition public goods and services
(Barkley, Henry, and Warner, 2002).
Barkley et al. (2002) analyzed the affect of various sources of workers on community
income associated with new plant establishment. According to their study, workers to fill the
jobs in the new plant may come from seven sources, or components of the local labor force.
They include, 1) local residents not in the labor force; 2) residents in the labor force but not
working; 3) local residents currently working at local or non-local jobs (out-commuters) that
may take a second job; 4) local residents currently working at local job that may quit their old
job to take new ones; 5) local residents currently working at non-local jobs that may quit their

30
old jobs to take new ones; 6) non-local residents that may in-commute to the community to take
one of the new jobs; and 7) non-local residents that may move (in-migrate) to the community to
take one of the new local jobs. The authors determined the principal income effect of interest to
residents of the community is the change in income of the individual who resided in the
community before the arrival of the new firm. The local income effect of a new employer (new
plant) is greatest if the jobs are taken by the residents who previously were unemployed, or not in
the labor force. Conversely, no change in the local residents’ income will be recognized if the
new jobs are filled by in-commuters and/or in-migrants. The authors also analyzed the negative
effects associated with in-commuters and in-migrants. A small increase in local public
expenditure may be associated with in-commuters in order to provide them with road, water, and
sewer services and police protection, etc. A significant increase in public expenditures may be
associated with in-migrants as new residents result in additional homes on local water and sewer
system, additional students in local schools, additional participants in local recreational
programs, and additional traffics on area roads (Barkley, Henry, and Warner, 2002).
However, the negative effects associated with in-commuters and in-migrants may be short-
run. In the long run, irrespective of the source of workers, the establishment of a new plant in a
community means employment growth, which in turn means more residents, more spending at
local business, and more tax revenues for local governments (Barkley, 2001). According to
Barkley, job growth in a community will permit the expansion and improvement of public goods
and services, leading to an improved local quality of life and enhanced prospects for future
employment growth. In addition, job growth will provide incentives for local students to
continue their education and encourage local workers to upgrade their skills in order to qualify

31
for higher wage jobs, thus making the community a more attractive location for business in the
future (Barkley, 2001).
Where there are economic benefits associated with a new plant location, there may be
certain disadvantages in terms of environmental hazards. This is one of the reasons why certain
communities oppose a plant location, which may result in local environmental hazards.
Halbrendt et al. (1999) conducted a case study of two Vermont communities in identifying target
industries for community economic development. Their results indicated that the community
situated near a metropolitan area regards protection of the environment as the most important
priority in attracting an industry. Whereas, a more rural community, may set highest priority on
employment opportunities. Their results were attributed to the fact that unemployment rate was
high in the rural community and the first community is close to the metropolitan area with low
unemployment rate and seeks suitable businesses to sustain its preservation efforts for two
historically significant Monitor Barns. Thus, communities preference for plant location changes
based on their requirements or necessities.
Spies et al. (1998) analyzed the differences between community leaders and residents to
support waste facility siting. They found that leaders in the communities were more supportive
of local waste facility siting than were other community residents. The leaders’ acceptance was
associated with their perception of the economic benefits of a facility to the community.
Although economic benefits were important to the residents, their perception of health, safety,
and environmental contamination risks had larger effects on their acceptance of such facilities
(Spies, Murdock, White, Krannich, Wulfhorst, Wrigley, Leistritz, Sell, and Thompson, 1998).
The location of a broiler complex in a community leads to economic development in terms of job
growth and other beneficial factors, but at the same time has the disadvantages related to

32
environmental contamination. Thus, community attitude toward the broiler industry may be one
of the important factors in the broiler complex location decision.
This chapter discussed location theory in general and the factors related to broiler complex
location decision. Chapter three will discuss the methods and models used to estimate these
factors.

33
Chapter 3 Review of Conjoint Analysis Theory and Models
Site selection is an important decision made by industry management. Broiler companies
considering expansion of an existing plant, or building a new plant must evaluate alternative
locations by making trade-offs among different location attributes. Conjoint analysis is applied to
analyze the relative importance of each attribute in the location decision of the broiler industry.
This chapter presents the theoretical and empirical methods used in the application of conjoint
analysis to the plant location problem.
Conjoint Analysis (CA)
Conjoint analysis is a decompositional technique used to measure a respondent’s preference
given his/her evaluations of various combinations of attributes and levels that define a particular
product or a service (Green and Srinivasan, 1978). The conjoint approach makes use of
consumer choice theory, where a respondent’s preference can be measured in terms of utilities
for individual attributes of the products or services (Ozayan, 1997).
An advantage of CA relative to other multivariate analysis is the way it decomposes the
overall preference of a respondent to determine the value of each attribute (Hair, Anderson,
Tatham, and Black, 2000). During the early 1980s, an estimated 400 conjoint analysis
applications were carried out per year. The majority of these studies pertain to consumer (59%)
and industrial goods (18%), with financial (9%) and other services (9%) accounting for most of
the rest. The principal applications of these studies were new product/concept evaluation,
repositioning, competitive analysis, pricing and market segmentation (Wittink and Cattin 1989).
However, the use of CA to study location decisions is not new. One study in particular, Hopman
et al. (1996) used conjoint analysis to elicit growers’ preferences for horticultural location in the
Netherlands. To obtain insight into the relative importance of the location attributes, this study

34
employed adaptive conjoint analysis to 72 growers. Eight location attributes were analyzed in
their study to obtain insight into the growers’ preferences for horticultural locations. Their results
indicated light-intensity and length/width ratio of the parcel as the most important of the
attributes investigated. The results also indicated that Sexbierum was the most attractive location
for horticultural production, especially for vegetable growers. Where as, the Cut flower/pot plant
growers had a higher preference for locations in the neighborhood of the Westland when
compared to vegetable growers (Hopman et al. 1996).
Similarly, this project uses conjoint analysis to examine broiler companies’ preferences for
broiler complex location in the United States. Applications of CA to the location problem is
attributed to the fact that selecting a site is a multidimensional decision making process, and it is
important to identify the relative importance of each attribute to select the most suitable site.
Utility and Location Preferences
Economists refer to utility as the overall well being of a person, and as a numeric measure
of a person’s satisfaction (Varian 1996). Since a business executive’s compensation package
(i.e., salary, bonuses, and stock options) is linked to the profitability of the business, and a
executive’s utility increases with income, this study assumes that maximizing utility regarding a
specific location decision and maximizing the profits of the business are closely correlated. This
implies that a company executive, while making location decisions, would naturally choose the
location with the highest amount of utility. The theoretical model proposed by Harrison (2000)
is used for this study to represent the broiler company executive’s preference as follows:
)]},,([{ jwpESPSPi π=
where, SPi is executive i’s stated preference for a site location given the output and the input
price sets (p and w) and site-specific attribute set j. The indirect profit function π(p,w,j) envelops

35
all attributes that affect the long-run profitability of the business. Therefore, π(p,w,j) contains the
profit maximizing input and output levels, given prices and the site-specific attribute vector j. In
this location study, j contains information concerning the cost of feed ingredients, distance
between feed mill and broiler grower, quality of roads between feed mill and grower, community
attitude toward the broiler industry, proximity to major markets, availability of growers,
availability of labor, labor cost, and other costs such as the electricity cost, heating cost, water
cost, and the sewer cost. The term E[π(p,w,j)] is the executive’s assessment of expected profits
given a particular j attribute combination, and output and input prices p and w (Harrison, 2000).
CA is employed in this study to decompose the broiler company executive’s total state
preference (i.e., expected profitability) for a particular location (i.e., a particular bundle of
location attributes) into part worth evaluations for each attribute level in the site location
decision. In CA, a location is considered to be a bundle of attributes. A bundle is defined as a
particular site with different combinations of attributes and levels. Figure 3.1 illustrates the
development of a conjoint profile (bundle). For example, suppose a study involves three
attributes A, B, and C with four levels (A1, A2, A3, and A4), two levels (B1 and B2), and three
levels (C1, C2, and C3), respectively. One of the possible combinations of the attributes can be
represented as a profile (bundle) with attribute levels A2, B1, and C3 (fig. 3.1).
Figure 3.1 Representation of a Profile.
Profile A2
B1 C3
Attribute A Attribute B Attribute C
Level A1, A2, A3, A4 Level B1, B2 Level C1, C2, C3

36
When using CA, it is important to identify attributes which are relevant to the study. A
preliminary set of attributes can be selected by questioning the representative respondents
regarding the attributes important to them (Braun and Srinivasan 1975). Differences between
attributes should be large enough for the consumer to make decisions between attributes, but
small enough to be believable (Green and Srinivasan 1978). After preliminary data collection,
the most difficult task is reducing the number of attributes to a manageable size so that
estimation procedures are reliable, and at the same time are sufficient to account for respondents
preferences (Green and Srinivasan 1978). Too many attributes can greatly increase the risk of
information overload on the part of respondents. Too few attributes can reduce the predictive
capabilities of the model (Stringer 1999). Next, a composition model representing different
bundles (location profiles) must be estimated.
The Composition Rule
The composition rule explains how the respondents combine the part-worth values of
factors to get total utility. There are numerous decision models used to relate the part worth
utilities to overall utility. The most common forms are the simple polynomials, which include
additive, multiplicative, and distributive models (Ozayan 1997). Of these, the additive and the
multiplicative model are the most commonly used models to demonstrate the composition rule.
In the additive model, the respondent adds up the part worth utilities for each attribute to attain a
total utility value for a location. In contrast, the multiplicative model utilizes interaction effects,
which allow for certain combinations of levels to be more or less than just their sum (Ozayan
1997).
Figure 3.2a illustrates two different ways of utilizing attribute part worths to estimate the
overall utility. Assume a site is represented by two attributes (j=2), with three levels for each

37
attribute (i=a, b, c); bad, fair, and good. Graphically, the additive model is shown by a series of
parallel lines indicating that differences in responses given are equal for a site with two good
level attributes (good-good), and fair-good combination compared to a response given to a
combination of good-bad and fair-bad difference. This indicates that the effects of different
levels of different attributes on the preference rating are independent from each other.
Conversely, figure 3.2b illustrates the multiplicative model. This figure indicates that the
response difference corresponding to the levels of the attribute can move closer together or
farther apart based on the levels of the other attribute. In this case, the differences in response for
a. Additive b. Multiplicative
Response Response
Bad Fair Good
Attribute 1 Attribute 1
Good Fair Bad Attribute 2
Bad Fair Good
Good Fair bad Attribute 2
Figure 3.2: Graphical Forms of the Additive and Multiplicative Decision Models.

38
a site with combination of good-good and fair-good attribute levels are not equal to good-bad
and fair-bad combination of attribute levels. The curves in figure 2.2b indicate that the
respondent assigns greater preference to the site consisting of both attributes with attractive
levels.
The additive model is the most common because of the fact that it accounts for most of the
variation in respondent preferences. The major setback of the multiplicative model is that it
decreases the statistical efficiency of the model due to the increased number of part worth
estimates. Moreover, the results of the interaction effects are generally not greater than zero.
However, the multiplicative model may be a more accurate representation of how respondents
value a product or service (Ozayan 1997).
Conjoint Data Collection
Data collection procedures in conjoint analysis involve two basic methods: the two-factor-
at-a-time approach and the full-profile approach. The two-factor-at-a-time procedure is also
referred to as “trade-off procedure” (Johnson 1974). In this approach, respondents are asked to
rank each pair of factor levels from the most preferred to the least preferred. This procedure is
simple and reduces the risk of information overload on part of respondents. However, this
approach lacks realism, since only two attributes are being considered at one time (Green and
Srinivasan 1978).
The full-profile approach utilizes the complete set of attributes. The major setback for the
full-profile approach is the risk of information overload for the respondent, and the resulting
temptation to simplify the task by ignoring variations in less important attributes. The full profile
approach is likely to be better in terms of a realistic description of stimuli and predictive validity.

39
However, in the case of small environmental correlations and large numbers of factors, the two-
factor-at-a-time approach is likely to be better (Green and Srinivasan 1978).
The problem of too many attributes in a full-profile approach can be overcome by the use of
a fractional factorial design (Green, 1974). A fractional factorial design consists of a sample of
attribute levels selected from a full-factorial design without losing information, to effectively test
the effects of factors on respondent preferences (Halbrendt et al 1991). However, the researcher
trades off the measurement of interaction effects when utilizing fractional factorial design. The
researcher assumes that all high-order interactions (three factor and beyond) are negligible. Latin
Square Design is a common category of fractional factorial design used to achieve high
parsimony in a number of combinations by neglecting all the interaction effects (Gan 1992).
Two (orthogonal) Latin Squares can be pooled to obtain a Graeco-Latin Square. Based on this
concept, several orthogonal arrays can develop high fractionated design which accounts for all
the main effects, assuming no interactions among the factors (Gan 1992). Conjoint Designer, a
computer package designed by Bretton-Clark (1987), can be used to reduce the stimuli.
Methods
Despite the numerous applications of conjoint analysis in consumer and marketing research,
relatively very few studies have applied conjoint analysis to the location problem of an industry.
Researchers dealing with plant location decisions generally employ multinomial logit models,
conditional logit models, generalized distribution models and other econometric models for their
study. However, these models do not deal with the trade-offs associated with factors effecting the
location decision.
Given the multi-attribute nature of the industry location decision, conjoint analysis is a
relevant technique to estimate the relative importance of each attribute in the location decision.

40
For example, in the case of broiler industry location decisions, previous studies reveal that labor
costs and utility costs are the important factors affecting broiler industry location, but the models
used in the studies do not state how important is the labor cost compared to the utility cost, vice
versa. The application of conjoint analysis gives the relative importance of the attributes which
can be used by state agencies to develop new strategies to attract companies. Three important
steps involved in conjoint analysis are; 1) selection of relevant attributes and levels, 2) selection
of suitable experimental design and survey procedures, and 3) selection of a suitable model to
estimate the design.
The first and perhaps the most important criteria in a conjoint study is attribute selection.
Attributes are selected based on literature review, focused group discussion, and personal
interviews. This study utilized all these methods in determining the most relevant attributes
affecting the location of a broiler complex.
Attribute and Level Selection
The selection of attributes for the location problem of a broiler complex is based upon prior
studies related to broiler industry location that are discussed in Chapter 2 of this study, group
discussions, and personal interviews with broiler industry experts. Over a period of time, several
meetings were held with Extension Specialists of the Louisiana State University Agricultural
Center (LSU Ag Center). The meetings involved group discussions, phone calls to poultry
managers, and literature study. The main purpose of those meetings was selecting the most
appropriate attributes affecting the location decision of the broiler industry and structuring the
survey questionnaire. On April 24, 2002, a meeting was held with an Ex-CEO of a poultry
company, which also involved extension specialists from LSU Ag Center. The Ex-CEO had
complete insight of the broiler industry. Attributes previously selected based on the earlier

41
meetings were discussed with him. Other important aspects such as structure of a broiler
complex, broiler contracts, vertical integration, environmental concerns and problems in the
broiler industry were also discussed in the meeting. As there were large numbers of attributes
concerned with broiler complex location, attributes were discussed separately in detail for the
key enterprises of a broiler complex; they are the broiler growing, feed mill, and broiler
processing enterprises. Along with the attributes their levels were also discussed. By the end of
the meeting, a set of relevant attributes were selected separately for the three key enterprises of
the broiler complex.
As each enterprise is associated with numerous factors affecting the location decision, three
different conjoint models related to broiler growing, broiler processing and the feed mill were
developed for this study. A questionnaire was developed and sent to a poultry economist of the
National Chicken Council for his review. After one week, a telephone conference was set up
with the economist along with the extension specialists. The questionnaire was discussed in
detail. Few changes were made to the questionnaire based on the recommendations made in the
conference. The attributes and levels for each enterprise are as follows:
Broiler Growing Enterprise
Factors included in broiler growing are water cost, heating cost, electricity cost, number of
growers and potential growers available, distance between feed mill and grower, and community
attitude toward the broiler industry. Table 3.1 shows the list of factors along with their respective
levels. Each factor in this conjoint has two levels.
Water costs at different broiler plant locations in the southeastern region were reviewed in the
study. The water cost in these regions varied from $0.87 per thousand gallons to $2.62 per

42
thousand gallons. Based on these, two levels were selected for this study, 1. High cost, $2.50 per
thousand gallons, and 2. Low cost, $1.00 per thousand gallons.
The cost of LP gas accounts for 35% of the total cost of broiler production (Fluck, 1992).
Therefore, cost of LP gas is taken as a measure to study the relative importance of heating cost in
broiler production. The LP gas prices in the southeastern region varied from $1.02 per gallon to $
0.927 per gallon during the period of April 2002 (Agricultural Statistics Board, NASS, USDA
2002). In this study, two levels are selected to measure the relative importance of heating cost in
broiler production. They are 1. LP gas $0.90 per gallon (representing a low cost), and 2. LP gas
$1.00 per gallon (representing a high cost).
Electricity cost in the Southeastern region varied from 4.17 cents per kWh to 6.85 cents
per kWh (Energy Information Administration 2000). For this study, two levels that represent the
electricity costs in the southeastern region are chosen. The two levels selected to measure the
relative importance of electricity cost of broiler production and processing are, 1. 4.00 cents per
kWh (low cost), and 2. 6.50 cents per kWh (high cost).
Availability of potential growers is an important factor considered for broiler production. In
this study, two levels represent the number of potential growers available for broiler production.
They are 1. 75-100 potential growers and 2. 250-300 potential growers. These two levels,
representing a low and a good number of potential growers were used to measure the relative
importance of grower availability in broiler production.
Distance between broiler growers and feed mill is considered an important factor for broiler
production. In general, a company wants its growers to be located near the feed mill to reduce
the transportation cost incurred by supplying feed to broiler growing houses. In this study, two

43
Table 3.1: Attributes and Levels Related to the Broiler Growing Enterprise.
Attributes Levels Water Cost Heating Cost Electricity cost Number of growers and potential growers available Distance between feed mill and grower Community attitude towards broiler industry
1) High cost, $2.50 per thousand gallons 2) Low cost, $1.00 per thousand gallons 1) High cost, LP gas $1.00 per gallon 2) Low cost, LP gas $0.90 per gallon 1) High cost, 6.50 cents per kWh 2) Low cost, 4.00 cents per kWh 1) 75-100 2) 250-300 1) 30 miles 2) 100 miles 1) Favorable 2) Not favorable
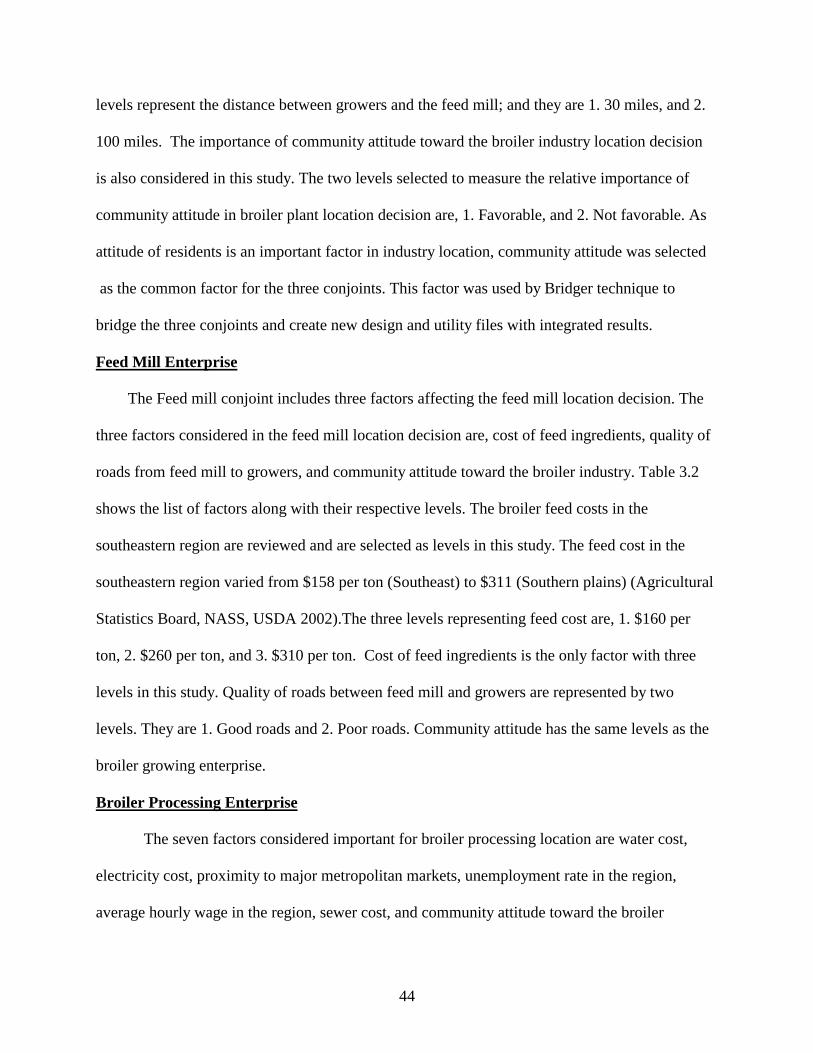
44
levels represent the distance between growers and the feed mill; and they are 1. 30 miles, and 2.
100 miles. The importance of community attitude toward the broiler industry location decision
is also considered in this study. The two levels selected to measure the relative importance of
community attitude in broiler plant location decision are, 1. Favorable, and 2. Not favorable. As
attitude of residents is an important factor in industry location, community attitude was selected
as the common factor for the three conjoints. This factor was used by Bridger technique to
bridge the three conjoints and create new design and utility files with integrated results.
Feed Mill Enterprise
The Feed mill conjoint includes three factors affecting the feed mill location decision. The
three factors considered in the feed mill location decision are, cost of feed ingredients, quality of
roads from feed mill to growers, and community attitude toward the broiler industry. Table 3.2
shows the list of factors along with their respective levels. The broiler feed costs in the
southeastern region are reviewed and are selected as levels in this study. The feed cost in the
southeastern region varied from $158 per ton (Southeast) to $311 (Southern plains) (Agricultural
Statistics Board, NASS, USDA 2002).The three levels representing feed cost are, 1. $160 per
ton, 2. $260 per ton, and 3. $310 per ton. Cost of feed ingredients is the only factor with three
levels in this study. Quality of roads between feed mill and growers are represented by two
levels. They are 1. Good roads and 2. Poor roads. Community attitude has the same levels as the
broiler growing enterprise.
Broiler Processing Enterprise
The seven factors considered important for broiler processing location are water cost,
electricity cost, proximity to major metropolitan markets, unemployment rate in the region,
average hourly wage in the region, sewer cost, and community attitude toward the broiler

45
Table 3.2: Attributes and Levels Related to the Feed Mill Enterprise.
Attributes Levels Cost of feed ingredients
Quality of roads from feed mill to growers Community attitude towards broiler industry
1) $160.00 per ton 2) $260.00 per ton 3) $310.00 per ton 1) Poor 2) Good 1) Favorable 2) Not favorable
Table 3.3:Attributes and Levels Related to the Broiler Processing Enterprise.
Attributes Levels
Water Cost
Electricity cost
Proximity to major metropolitan markets
Unemployment rate in the region
Average hourly wage in the region
Sewer cost
Community attitude toward the broiler industry
1) High cost, $2.50 per thousand gallons 2) Low cost, $1.00 per thousand gallons 1) High cost, 6.50 cents per kWh 2) Low cost, 4.00 cents per kWh 1) 400 miles 2) 800 miles 1) High 2) Low 1) Low wage, $7.50 per hour 2) High wage, $8.50 per hour 1) Low cost, $1.00 per thousand gallons 2) High cost, $3.00 per thousand gallons 1) Not favorable 2) Favorable

46
industry. The levels for water cost, electricity cost and community attitude are same as in broiler
growing enterprise. Table 3.3 shows the list of factors along with their respective levels.
Proximity to major metropolitan markets is represented by two levels, 1. 400 miles (to cover ‘x’
amount of population) 2. 800 miles (to cover the same ‘x’ amount of population). Two levels,
low unemployment rate and high unemployment rate represent the unemployment rate in the
region. Two levels are selected to represent average hourly wage in the region based on wage
rates in the southeastern states. The two levels are, $7.50 per hour (representing a low wage), and
$8.50 per hour (representing a high wage) (Gregory, Rhodes 2001). Sewer cost at different
broiler plant locations in the southeastern region were reviewed in the study. The sewer cost in
these regions varied from $0.91 per thousand gallons to $3.84 per thousand gallons. Based on
these, two levels were selected for this study, 1. $1.00 per thousand gallons (representing low
sewer cost), 2. $3.00 per thousand gallons (representing high sewer cost).
A set of additional factors related to infrastructure, environmental regulations, labor, and
state and local policies are also included in this study. Table 3.4 shows the list of additional
factors. Rating scale was used to determine the importance of these attributes.
The Experimental Design
Once the attributes and their respective levels are determined, different combinations of
these two form hypothetical locations. Since there are six attributes with two levels each in the
broiler growing conjoint, there are 2x2x2x2x2x2= 64 possible broiler growing locations.
Similarly, for the feed mill there are 3x2x2=12 possible feed mill locations. In the case of broiler
processing, since there are seven attributes with two levels each, there are 2x2x2x2x2x2x2= 128
possible broiler processing locations. These combinations can be termed as location features for
which the respondent gives a rating or ranking.

47
Table 3.4: Additional Factors related to the Broiler Industry
Additional Factors Infrastructure:
1) Availability of local grain supply 2) Proximity of railroads to feed mill 3) Cost of land in the region
4) Broiler industry already established in the region 5) Availability of a municipal facility for wastewater treatment and solid waste
disposal 6) Proximity to farmland or other sources for litter disposal 7) Availability of local lenders for broiler growers, (e.g. mortgage, operating loans) 8) Availability of local contacts to assist in analysis of community attitude 9) Quality of life in the region for the employees
Regulations: 1) Stringency of water pollution regulations 2) Stringency of dead bird and litter disposal regulations
Labor: 1) Growers attitude towards contract production 2) Availability of catchers 3) Availability of skilled labor (e.g. electricians, general mechanics, and
refrigeration mechanics)
State and Local Policies: 1) State development incentives (Income tax credit, Job training, Direct loans etc,) 2) State property tax 3) Local property tax 4) State fuel tax

48
The questionnaire, in general, consisted of three parts. The first part deals with the conjoint
analysis of the broiler growing, feed mill, and broiler processing enterprises. The second part
includes questions regarding business infrastructure, state regulations, labor, and state and local
policies. The last section of the questionnaire pertained to the company’s current broiler
operations. A copy of the questionnaire is included in appendix.
The conjoint portion of the questionnaire consisted of three sections. The first section deals
with the broiler growing conjoint. This section contains nine cards representing nine different
bundles of location features. Eight of the nine location profiles consisted of an orthogonal array
of location profiles. The ninth card is added as a holdout card. Typically, the holdout card is not
used in the analysis, but used to test internal validity of the study through the correlation of the
predicted estimated card ratings to the actual ratings given by the respondent. The respondent
was asked to rate each card using a scale from “0” to “10” where: 0= least preferred combination
of location features, and 10= most preferred combination of location feature. Similarly, the
second and third sections represent the feed mill and broiler processing conjoints respectively.
Each of them has nine location profiles, where ninth card represents the holdout card.
The second part in the questionnaire deals with questions related to additional location
factors (not included in the conjoint portion) believed to affect the location decision of the broiler
company. Eighteen factors are included in this section. The respondent was asked to rate each
factor on a scale of 1 to 7, where 1 represents Not Important and 7 represents Very Important.
The third part of the questionnaire deals with questions related to a company’s broiler
operations such as the number of broiler complexes, age of newest and oldest broiler complex,
future expansions, sales, employees, etc.

49
The questionnaire was pretested with the previously mentioned Ex-CEO and the poultry
economist. Based on their recommendations, some changes were made to the questionnaire to
make it more appealing toward the objective of this study. The survey was administered to the
Chief Executive Officers (CEOs) of 43 broiler companies in the U.S. Dillman’s Total Design
Method was followed for both the survey design and implementation (Dillman, 1978). The
survey was conducted from September to December, 2002. Responses were received from 12
CEOs of the broiler companies of which complete responses were received from 9, for a
response rate of 20.9 percent. Because the response rate is low, only the aggregate model is
estimated in the study. The holdout card is not tested because of too few degrees of freedom.
Conjoint Data Analysis
This study used an interval rating (IR) scale for coding respondent preferences for the
broiler complex location decision. The IR scale is limited by an upper bound and lower bound
(in this study “0”= lower bound and “10”= upper bound). The IR scale is preferred over the rank
order as the former allows the respondent to express order, indifference, and intensity across
location choices, allowing for both metric and non metric properties of utility to be elicited
(Harrison, Stringer, Prinyawiwatkul 2002). Moreover, IR scales tend to be simple for use by
respondent. Harrison et al (2002) analyzed the application of different models in combination
with IR method to estimate the part worth estimates of location attributes. Some of the
highlights of their study with regard to the models used in combination with IR sales are:
• The linear regression models assume utility is cardinal (continuous), and as a result
yield truncated residual and asymptotically biased parameters;
• The two-limit tobit model (TLT) corrects the censored nature of the scale and retain
cardinal information between the upper and lower bounds;

50
• Ordered probit (OP) and ordered logit (OL) models assume preferences are ordinal,
and thus fail to account for cardinal information. These models require more degrees
of freedom as they estimate the unknown thresholds (to determine the ordinal
intervals) in addition to part worth parameters;
• TLT and OP models have little difference with respect to estimation of part worth
estimates and predictive validity;
As this study has a relatively few number of observations, the TLT model is used to fully
utilize the degrees of freedom in estimating the part worth utilities of the attributes. The two-
limit Tobit model is specified as follows:
,*ijij XU εβ +=
Prefij =
where Uij * represents ith respondents unobservable utility for a particular combination of
location attribute levels for enterprise j, , β is a row vector of part-worth and marginal utility
effects, X is a column vector of location attributes, and εij is the error term.
The attribute vector X for the broiler growing enterprise contains a series of dummy
variables defined as follows: X1 = 1 or -1 represents water cost of $2.50 per thousand gallons and
$1.00 per thousand gallons, respectively; X2 = 1 or -1 represents heating cost of $1.00 per gallon
and $0.90 per gallon, respectively;X3 = 1 or -1 represents electricity cost of 6.50 cents per kWh
and 4.00 cents per kWh, respectively; X4 = 1 or -1 represents 250-300 and 75-100 number of
0 if Uij * ≤ 0,
Uij
* if 0 ‹ Uij * ‹ 10,
10 if 10 ≤ Uij
*

51
growers and potential growers available, respectively; X5= 1 or -1 represents 30 miles and 100
miles distance between feed mill and grower, respectively; X6= 1 or -1 represents favorable and
not favorable community attitude toward broiler industry, respectively.
The attribute vector X for the feed mill enterprise contains a series of dummy variables
defined as follows: X7 = 1 and X8 =0 represents $ 160.00 per ton feed ingredient cost; X7 = 0 and
X8 =1 represents $ 260.00 per ton feed ingredient cost; X7 = -1 and X8 =-1 represents $ 310.00
per ton feed ingredient cost; X9 = 1 or -1 represents good and poor quality of roads from feed
mill to growers, respectively; X10 = 1 or -1 represent favorable and not favorable community
attitude toward broiler industry, respectively.
The attribute vector X for broiler processing enterprise contains a series of dummy variables
defined as follows: X11 = 1 or -1 represents water cost of $2.50 per thousand gallons and $1.00
per thousand gallons, respectively; X12 = 1 or -1 represents electricity cost of 6.50 cents per kWh
and 4.00 cents per kWh, respectively; X13 = 1 or -1 represents 400 miles and 800 miles proximity
to major metropolitan markets, respectively; X14= 1 or -1 represents high and low unemployment
rate in the region, respectively; X15 = 1 or -1 represents $8.50 per hour and $7.50 per hour
average hourly wage in the regions , respectively; X16 = 1 or -1 represents sewer cost $3.00 per
thousand gallons and $1.00 per thousand gallons, respectively; X17 = 1 or -1 represents favorable
and not favorable community attitude toward broiler industry, respectively.
Prefij is the observed rating scale of respondent i for a particular combination of location
attribute levels for enterprise j. The TLT model assumes that the true preferences of the
respondent are censored by the upper and lower bound values of the scale. This means when a
respondent gives a preference of 0 or 10 to a location profile he would be assigning a value lower

52
than 0 or greater than 10 if allowed to do so. TLT also assumes that the observed value is
continuous between the lower and upper bound (Harrison, Stringer, and Prinyawiwatkul 2002).
The part worth utilities that are estimated by the TLT model are utilized to determine the
respondents overall utility for a particular combination of location attributes. An attribute
associated with the largest range of part worth values for its levels is considered to be the most
important factor in the location decision. This importance is determined by estimating the
relative importance of each attribute. Relative importance (RI) weights for each attribute are
calculated using the method described in Harrison, Stringer, and Prinyawiwatkul (2002). The
first step is to determine the highest and the lowest part worth values for each attribute. The
difference between the highest and the lowest part worth values represent the utility range for
that attribute. Once the utility range for each attribute is determined, the relative importance for
the ith attribute is calculated as follows:
RIi =
Where RIi is defined as the relative measure for the ith attribute.
As this study involves three different conjoints (broiler growing, feed mill, and broiler
processing), relative importance of attributes can only be calculated separately for each conjoint.
In order to calculate the overall relative importance of attributes for a broiler complex location
decision, there must be some technique to bridge the three conjoints and estimate the overall part
worth utilities for the attributes. The following sections discusses about this technique.
The Experimental Bridging Design
The full-profile approach can be extended to a larger number of attributes using a
“bridging” design- that is by dividing the features into two sets and developing two separate
Utility Rangei
∑ Utility Ranges ∀ Attributes X 100

53
designs with at least one common attribute (Green and Srinivasan 1990). Each respondent is
administered both designs, which are later analyzed separately. The next step is to use the
bridging (common) attribute to scale the part worths from the two sub designs into one overall
set of part worths. The bridging attribute should be analyzed with the same type of model for the
two sub designs and it should be represented in similar fashion (number of levels, names of the
levels) in the two sub designs (Albaum 1989). Only two designs can be bridged at a time.
This study applied the bridging design similar to that employed by Francois and
MacLachlan (1997). Since bridging can be done for two designs at a time, broiler growing and
broiler processing enterprises are bridged initially and the resulting design is bridged with the
feed mill conjoint design to get the final overall part worths. Logically, the solution algorithm for
bridging to sub designs should depend on the ratio of part worth values for the bridging attributes
across sub designs. However, this will result in a problem of nonsymmetry, since the solution
will differ depending on which ratio (1st over 2nd or 2nd over 1st) is used to rescale the sub
design’s part worth and how the importances for the two bridging attributes are combined.
The bridging factor used to bridge the broiler growing and processing conjoint is calculated
as follows,
)(
)(
232221
131211
RRR
RRRB
++++=
where, B= bridging scalar; Rij = the range of part worth of bridging attribute j in sub design i.
R11= range of part worth for the water cost in the broiler growing conjoint; R12 = range of
part worth for the electricity cost in the broiler growing conjoint; R13= range of part worth for the
community attitude toward the broiler industry in broiler growing conjoint; R21= range of part
worth for the water cost in the broiler processing conjoint; R22= range of part worth for the

54
electricity cost in the broiler processing conjoint; R23= range of part worth for the community
attitude toward the broiler industry in the broiler processing conjoint.
As there are three factors in common between broiler growing and broiler processing
conjoints, the part worth ranges of these attributes (water cost, electricity cost, and community
attitude toward broiler industry) are utilized to calculate the bridging factor. To solve the
nonsymmetry problem, B is applied to rescale the broiler processing conjoint design part worth,
and B-1 is applied to rescale the broiler growing conjoint design part worth. The algorithm
applied for this study was as follows:
BP
BP
BP
BP
BP
BP
BP
P
P
P
*
*
*
*
*
*
*
27
26
25
24
23
22
21
16
15
14
27
26
25
24
113
112
111
116
115
114
*
*
*
*
*
*
P
P
P
P
BP
BP
BP
BP
BP
BP
−
−
−
−
−
−
102727
92626
82525
72424
61
1323
51
1222
41
1121
31
1616
21
1515
11
1414
)*(
)*(
)*(
)*(
)*()*(
)*()*(
)*()*(
)*(
)*(
)*(
WPBP
WPBP
WPBP
WPBP
WBPBP
WBPBP
WBPBP
WBPP
WBPP
WBPP
=+=+=+=+
=+
=+
=+
=+
=+
=+
−
−
−
−
−
−
where Pji represent part worth estimates of the ith attribute in the jth conjoint. P11, P12, P13,
P14, P15, and P16, are the part worth estimates for the broiler growing attributes water cost,
electricity cost, community attitude toward the broiler industry, heating cost, number of growers
and potential growers available, and the distance between feed mill and growers, respectively.
P21, P22, P23, P24, P25, P26, and P27 represent the part worth estimates of broiler processing
attributes water cost, electricity cost, community attitude toward the broiler industry, proximity
to major metropolitan markets, unemployment rate in the region, average hourly wage in the
Stage 1 Stage 2 Final Part- Worths

55
region, and sewer cost, respectively. The final part worths (obtained by bridging broiler growing
and processing conjoint designs) are represented as W1, W2, W3, W4, W5, W6, W7, W8, W9, and
W10, for heating cost, number of growers and potential growers available, distance between feed
mill and grower, water cost, electricity cost, community attitude toward the broiler industry,
proximity to major metropolitan market, unemployment rate in the region, average hourly wage
in the region, and sewer cost, respectively.
After bridging broiler growing and broiler processing conjoint, the next step is to bridge the
new design (broiler growing + broiler processing) with the feed mill conjoint. In this step, there
is only one common attribute (community attitude toward the broiler industry) between the two
designs. The part-worth range of this attribute from the two designs is used to calculate the
bridging factor. The bridging scalar is calculated as follows:
21
11
R
RBF =
Where, BF represents the bridging scalar; Rij represent the range of part worth for bridging
attribute j in sub design i. R11 represents the range of part worth value for the attribute
community attitude toward the broiler industry estimated in the primary bridging; R21 represents
the range of part worth of community attitude toward the broiler industry related to the feed mill
conjoint.
To solve the nonsymmetry problem, the factor BF was applied to rescale the new design
(broiler growing + broiler processing) part worth and BF-1 to rescale the feed mill conjoint
design part worth. The algorithm applied for this study was as follows,

56
Where, Pji represent part worth estimate of ith attribute in the jth conjoint. P31, P32, P33, and
P34, are the part worth estimates for the feed mill attributes: community attitude toward the
broiler industry, $160.00 per ton cost of feed ingredients, $260.00 per ton cost of feed
ingredients, and quality of roads between growers and the feed mill. W1 to W10 are as mentioned
earlier. The final overall part worth are represented as X1, X2, X3, X4, X5, X6, X7, X8, X9, X10, X11,
X12 and X13, for heating cost, number of growers and potential growers available, distance
between feed mill and grower, water cost, electricity cost, proximity to major metropolitan
market, unemployment rate in the region, average hourly wage in the region, and sewer cost,
community attitude toward the broiler industry, $160.00 per ton cost of feed ingredients, $260.00
per ton cost of feed ingredients, and quality of roads between growers and the feed mill,
respectively.
34
33
32
16
110
19
18
17
15
14
13
12
11
*
*
*
*
*
*
*
*
*
*
2
P
P
P
BFW
BFW
BFW
BFW
BFW
BFW
BFW
BFW
BFW
BFW
Stage
−
−
−
−
−
−
−
−
−
−
133434
123333
113232
101
631
91
1010
81
99
71
88
61
77
51
55
41
44
31
33
21
12
11
11
)*(
)*(
)*(
)*()*(
)*(
)*(
)*(
)*(
)*(
)*(
)*(
)*(
)*(
XPBP
XPBP
XPBP
XBFWBP
XBFWW
XBFWW
XBFWW
XBFWW
XBFWW
XBFWW
XBFWW
XBFWW
XBFWW
PartworthsFinal
=+=+=+
=+
=+
=+
=+
=+
=+
=+
=+
=+
=+−
−
−
−
−
−
−
−
−
−
−
BFP
BFP
BFP
BFP
W
W
W
W
W
W
W
W
W
Stage
*
*
*
*
1
34
33
32
31
10
9
8
7
5
4
3
2
1

57
Specific Research Hypotheses
Availability of Potential Growers: In general, broiler companies try to locate in a region
where the number of potential broiler growers is high. Therefore, this study hypothesizes that
broiler companies give important consideration for availability of potential growers. Availability
of potential growers is expected to have a positive sign on broiler complex location decision.
Average Hourly Wage in the Region: Low average hourly wage is considered one of the
main reasons for concentration of broiler industries in the southeast region. This study
hypothesizes that a higher average hourly wage in the region will have a negative impact on
broiler complex location.
Access to the Growers: Broiler companies prefer to locate in a region where there is easy
access to the growers. They prefer to have good quality of roads between feed mills and the
growers. This study hypothesizes that broiler companies give important consideration to quality
of roads between the feed mill and growers. This is considered to have a positive effect on the
broiler complex location decision.
Community Attitude: There are many environmental concerns associated with broiler
industry. Therefore, broiler processors consider it important to have a positive community
attitude. Hence, this study hypothesizes that community attitude will have a positive impact on
the broiler complex location.
Cost of Feed Ingredients: Feed is an important component of broiler production. Feed cost
is one of the major costs for broiler production. Therefore, this study sets a hypothesis that cost
of feed ingredients will have a negative impact on the location decision of a broiler industry.
Distance Between the Feed Mill and Growers: Broiler companies prefer to locate in
region where the growers’ concentration is high. They want the grower to be closely located to

58
the feed mill in order to reduce the cost of transporting the feed. Therefore, this study sets a
hypothesis that distance between the feed mill and growers will have a negative impact on
broiler complex location.
Heating Cost and Electricity Cost: Heating and electricity costs are among the major
costs of broiler production. They constitute 45% of the total cost of broiler production (Fluck,
1992). Therefore, this study hypothesizes that heating cost and electricity cost will have a
negative impact on the broiler complex location decision.
Proximity to input and output markets: Proximity to markets plays an important role in
the location decision of firms. As mentioned before, firms are located near farms when it is
costly to transfer raw materials and near the final market when it is difficult to transfer processed
output. Previous studies showed that the proximity to market is an important consideration in the
location decision of a firm (Lopez and Henderson, 1989). This study hypothesizes that proximity
to markets is considered as an important factor in the location decision of a broiler industry. It is
expected that broiler processors look for sites that are closer to input and output markets.
Unemployment Rate in the Region: Availability of low skilled labor is considered to be
important for the broiler industry. This factor is expected to have a positive impact on the
location decision of a broiler industry.
Waste Water Treatment and Waste Disposal Facilities: Most of the previous studies
show that broiler processing firms are concerned with the availability of wastewater treatment
and waste disposal facilities. The broiler industry disposes of a large quantity of broiler waste
every day. Therefore, this study hypothesizes that broiler processors will give an important
consideration to the availability of wastewater treatment and waste disposal facilities in their
59
location decision of the broiler complex. Presence of wastewater treatment and waste disposal
facilities is expected to have a positive effect on site selection.
Water Waste Disposal Costs: Water waste disposal costs are those incurred by firms to
dispose of wastewater that is released by broiler processing plants every day. Previous studies
found that the broiler processors considered water waste disposal costs as an important factor
affecting the site selection (Lopez and Henderson, 1989). Therefore, this study sets a hypothesis
that water waste disposal costs play an important role in the location decision of a broiler
complex. High water waste disposal costs are expected to have a negative effect on site selection.
This chapter discussed the models and the methods that are applied to estimate the
importance of attributes in the broiler complex location decision. The next chapter will discuss
the results obtained from this study.
60
Chapter 4
Results
The previous chapter discussed the experimental design, attributes and levels, questionnaire
design, survey procedure and the model. This chapter reports the results obtained from the
conjoint analysis. Part worth estimates are obtained using the model specified in chapter 3. The
first section of the chapter deals with descriptive data of respondent’s broiler operations. The
second section deals with partworth estimates of attributes for the three enterprise designs. The
third part of the chapter deals with bridging estimates obtained from the three designs. The final
section of the chapter deals with the analysis of additional attributes affecting the broiler
complex location decision.
Summary of Sample Characteristics
The results showed that the respondents are operating 72 broiler complexes in the United
States. Table 4.1 presents the frequency of responses to the responding company’s broiler
operations. Approximately 44% of the respondents indicated their oldest broiler complex was
constructed over 40 years ago. Moreover, 44% of the respondents indicated that they expanded
their poultry operations by building a new broiler complex in the last 5 years. Thirty-three
percent of the respondents employ more than 10,000 workers in their broiler operations, and had
sales of more than $1 billion in the last fiscal year. Approximately 66% of the respondents are
planning to expand their broiler operations in the next 5 years. Most of the respondents planning
to expand prefer to expand an existing complex (i.e., adding growers, feed mills, and processing
plants), and/or build processing facilities that add value to ready-to-cook products. Most of the
respondents indicated that growth of domestic markets and expansion of market share were the
primary forces driving the expansion of their broiler operations.

61
Table 4.1: Results of questions related to respondents broiler operations.
1 The percentage is calculated for the nine respondents
2 The percentage is calculated for the 6 respondents who showed willing ness to expand in next 5 years
3 The respondents were allowed to choose more than one category
Broiler Operation questions and their categories Percentage1
Age of the oldest broiler complex 5-10 years 11.11 11-20 years 11.11 21-30 years 33.33 31-40 years 0.0 More than 40 years 44.44 Age of the newest broiler complex 1-5 years 44.44 6-10 years 33.33 11-20 years 22.22 More than 20 years 0.0 Planning to expand in the next 5 years Yes 66.67 No 33.33 Ways of expanding2, 3 Build a new complex plant 0.0 Expand an existing complex ( i.e. adding growers 83.33 feed mills, and broiler processing plant) Build a further processing facility that adds value 50 to ready to cook products Other 16.67 Primary forces driving the expansion2,3 Growth in domestic market 33.33 Growth in export market 0.0 Expansion of market share 50 Other 0.0 Total number of employees working in broiler operation 100-999 11.11 1000-2499 33.33 2500-4999 0.0 5000-9999 22.22 More than 10,000 33.33 Total sales of the company in last fiscal year Less than $250 million 33.33 $250-$500 million 11.11 $500million-$1 billion 22.22 More than $1 billion 33.33

62
Conjoint Analysis of Individual Enterprises
The two-limit tobit estimates are presented in table 4.2 for the broiler growing enterprise.
The log-likelihood ratio is significant at the greater than 1% level, indicating that the part-worth
estimates are jointly different from zero. Most of the coefficients associated with the attributes
have expected signs. The coefficients associated with distance between feed mill and growers,
and community attitude toward the broiler industry are significant at the 5% level. The electricity
cost, which has the expected sign, is significant at the 10 percent level. The coefficients
associated with heating cost, water cost, and number of growers and potential growers are not
significant.
Reducing distance between the feed mill and growers is found to be an important attribute
associated with locations of broiler growers. The coefficient is positive, indicating that as the
distances between the feed mill and growers increase, the average respondent’s preference for a
particular grower’s location decreases (1.005 for 30 miles and -1.005 for 100 miles). This result
is consistent with the location theory reviewed in chapter 2, which suggests that the
transportation cost is an important determinant of grower location. This result is also consistent
with the findings of Vest et al (1996), who concluded that the companies specify a maximum
allowable distance between a broiler farm and the feed mill or processing plant in order to lower
the cost of transportation. Since integrators provide the feed for the chicks, they prefer growers
located close to the feed mill in order to reduce transportation costs. Community attitude toward
the broiler industry is also found to be an important factor in broiler growing. The coefficient is
positive, indicating that as the community attitude changes from favorable to unfavorable, the
average respondent’s preference for that location decreases (0.798 for favorable community
attitude and -0.798 for unfavorable community attitude). This implies that broiler companies

63
prefer to locate in regions where the community attitude is favorable to the broiler industry.
Broiler growing involves the emission of a foul smell, and the discharge of large amount of
broiler litter, which may be a source of concern for a community. Public concern will result in
the state and local government placing some strict regulations on broiler production. This result
is also consistent with the survey conducted by Lopez and Henderson (1989), which concluded
that environmental regulations such as water pollution regulations, solid waste regulations,
stringency of enforcement of environmental regulations, and capital expenditures for pollution
abatement etc are found to be important factors affecting the location of the broiler industry.
The insignificant coefficients for water cost, heating cost, and electricity cost may be
attributed to the fact that integrators are not responsible for utility costs under the terms of the
typical broiler production contract. As mentioned earlier, the company provides technical
assistance, baby chicks, feed, and medication to the growers. The grower is responsible for
chicken houses, land, labor, litter, equipment, taxes, utilities, and insurance associated with
growing broilers.
The relative importances (RI) of the attributes are calculated using the formula discussed in
chapter 3. The RI estimates for broiler growing are presented in table 4.3. The distance between
feed mill and growers accounted for 28.75% of the variation in preference scores. This finding is
not surprising given that broiler companies transport feed to broiler houses twice every five days.
Community attitude toward the broiler industry is the second most important factor contributing
to the location decision. Approximately 23% of the variation in preference rating is associated
with community attitude. Water cost is found to be the least important factor from the
respondent’s point of view. Respondents also considered electricity cost to be more important
than number of growers.

64
Table 4.2: Two-Limit Tobit Part worth Estimates for Broiler the Growing Enterprise.
* = Significant at the 10% level ** = Significant at the 5% level *** = Significant at the 1% level
Table 4.3: Relative Importance of the Broiler Growing Attributes.
Variable Coefficient S. E. b/S.E. |P[|Z|>z]| Constant 3.617*** 0.3476 10.406 0.0000
Water cost: High cost, $2.50 per thousand gallons
-0.281 0.3470 -0.811 0.4176
Heating cost: High cost, LP gas $1.00 per gallon
0.376 0.3472 1.085 0.2779
Electricity cost: High cost, 6.50 cents per kWh
-0.585* 0.3470 -1.686 0.0917
Number of growers and potential growers available:250-300
0.438 0.3470 1.264 0.2061
Distance between feed mill and grower: 30 miles
1.005*** 0.3477 2.890 0.0039
Community attitude towards broiler industry: Favorable
0.798** 0.3474 2.300 0.0215
χ2 Log L: 17.55***
Broiler Growing Attributes Relative importance Distance between feed mill and grower 28.75 Community attitude towards broiler industry 22.94 Electricity cost 16.82 Number of growers and potential growers available 12.59 Heating cost 10.81 Water cost 8.08

65
The TLT estimates for the feed mill enterprise are presented in table 4.4. The log-likelihood
ratio is significant at the 1% level, indicating that the part-worth estimates are jointly different
from zero. All coefficients associated with the attribute-levels have the expected sign and are
found to be significant at the 1% level.
The coefficient associated with the lowest feed cost is positive (4.845), indicating that as the
cost of feeding chicks decreases, the preference for a particular site location increases.
Conversely, higher feed costs reduce the preference for a particular site location. This is shown
by the negative coefficient on the intermediate feed cost (-1.925). Thus, in accordance with
location theory, in order to lower their cost of production, firms locate at a site with low feed
cost. The quality of roads between feed mill and growers, and community attitude toward the
broiler industry are also found to be important in the feed mill location decision. The coefficient
for both attributes is positive, indicating that if quality of roads is poor, the average respondent’s
preference for a particular location decreases (1.075 for food roads and -1.075 for poor roads).
This result is consistent with economic theory, which predicts that firms prefer locations with
good access to input and output markets in order to transport materials safely.
The RI estimates of attributes for the feed mill location are presented in table 4.5. As
expected, the cost of feed ingredients is found to be the most important attribute, accounting for
59% of the variation in preference rating. This result is consistent with the fact that the cost of
feed ingredients is one of the major costs of broiler production, accounting for 60% of total cost
to produce one pound of live broiler (Bastien and Goan, 1998). Broiler companies tend to locate
broiler complexes in regions where feed costs are low. Following feed cost, community attitude
toward the broiler industry is the second most important factor, accounting for 24.5% of the

66
Table 4.4: Two-Limit Tobit Part worth Estimates for the Feed Mill Enterprise.
***= Significance at the 1% level
Table 4.5: Relative Importance of the Feed Mill Attributes.
Variable Coefficient S. Error b/S.Error |P[|Z|>z]| Constant 3.607*** 0.4176 8.639 0.0000 Cost of Feed Ingredients: $160.00 per ton
4.845*** 0.6659 7.276 0.0000
Cost of Feed Ingredients: $260.00 per ton
-1.925*** 0.6155 -3.128 0.0018
Quality of roads from feed mill to growers: Good
1.075*** 0.3987 2.697 0.0070
Community attitude towards broiler industry: Favorable
1.612*** 0.4028 4.003 0.0001
χ2 LogL: 59.41***
Feed Mill Attributes Relative Importance Cost of Feed Ingredients 59.09 Community attitude towards broiler industry 24.53 Quality of roads from feed mill to growers 16.05

67
variation in the preference rating. Even though quality of roads is the least important attribute, it
is significant and accounts for 16% of the variation in preference rating. These findings suggest
that broiler companies prefer good quality of roads between feed mill and growers, to ensure
good access to current and potential growers in the region.
The TLT estimates for the broiler processing conjoint design are presented in table 4.6. The
log-likelihood ratio is significant at the 1% level, indicating that the part-worth estimates are
jointly different from zero. The coefficients of all attribute levels have the expected sign, and
most of the coefficients are found to be significant at the 1% level. Exceptions include
electricity cost and sewer cost, which have the expected sign, but are significant at the 5% level.
The coefficients for water cost and proximity to major metropolitan markets have the correct
sign, but are not significantly different from zero.
Community attitude toward the broiler industry is found to be an important factor in the
location decision of the broiler processing plant. The coefficient associated with a favorable
community attitude is positive (1.497), indicating that broiler companies prefer to locate their
broiler complex in a location with favorable community attitudes. Conversely, unfavorable
community attitudes reduce the preference for a particular site location. This is shown by the
negative coefficient on the unfavorable community attitude (-1.497). This result is
understandable given that broiler firms face problems from the residents because of the emission
of large amounts of solid waste and wastewater into the surrounding areas creating some
environmental concerns. Moreover, the processing enterprise is the most visible to the
community, as broiler growing and feed mills are geographically dispersed in more remote areas.

68
Table 4.6: Two-Limit Tobit Part-worth Estimates for Broiler Processing Enterprise.
*=Significant at the 10% level ** = Significant at the 5% level *** = Significant at the 1% level
Variable Coefficient S. E. b/S.E. |P[|Z|>z]| Constant 4.557*** 0.2779 16.396 0.0000 Water cost: High cost, $2.50 per thousand gallons
-0.360 0.2779 -1.296 0.1951
Electricity cost: High cost, 6.50 cents per kWh
-0.571** 0.2782 -2.054 0.0400
Proximity to major metropolitan markets:400miles
0.177 0.2780 0.638 0.5236
Unemployment rate in the region: High 0.933*** 0.2784 3.352 0.0008 Average hourly wage in the region: High wage, $8.50 per hour
-0.914*** 0.2787 -3.283 0.0010
Sewer cost: High cost, $3.00 per thousand gallons
-0.594** 0.2781 -2.138 0.0325
Community attitude towards broiler industry: Favorable
1.497*** 0.2791 5.367 0.0000
χ2 LogL: 45.08***

69
The Unemployment rate is also found to be an important factor in the broiler processing
location decision. The coefficient associated with higher unemployment rates is positive (0.933),
indicating that broiler companies prefer to locate their broiler processing plants in locations with
high unemployment rates. Conversely, low unemployment rates reduce the preference for a
particular site location. This is shown by the negative coefficient on the low unemployment rate
(-0.933). Unemployment rates in the region refer to the availability of large numbers of low-
skilled workers. This result is consistent with economic theory, which predicts that firms relying
on low skilled labor prefer locations where low-skilled workers are available. Average hourly
wage in the region is also found to be significant. The coefficient is negative indicating a
decrease in preference for locations where wage rates are higher (-0.914 for a wage of $8.50 per
hour and 0.914 for a wage of $7.50 per hour). This result is consistent with economic theory,
which predicts that firms prefer locations where labor costs are low in order to lower the total
cost of production. This result is also consistent with the findings of Easterling et al (1986),
and Aho (1998), who concluded that low labor costs are among the critical factors for the broiler
industry concentration in the South. The coefficients associated with electricity cost, sewer cost,
and water cost have negative signs, indicating that they have negative impacts on location
preferences for a broiler processing plant.
The RI estimates for the broiler processing plant conjoint are presented in table 4.7. Results
show that community attitude is the most important attribute, accounting for approximately 30%
of the variation in the preference rating. Following community attitude, labor factors are found to
be the second and third most important attributes, each accounting for 18% of variation in
preference rating. Proximity to major metropolitan markets is found to be the least preferred
attribute, accounting for only 3.5% of variation in preference rating.

70
Table 4.7: Relative Importance of Broiler Processing Attributes.
Broiler Processing Attributes Relative Importance Community attitude towards broiler industry 29.67 Unemployment rate in the region 18.49 Average hourly wage in the region 18.11 Sewer cost 11.77 Electricity cost 11.31 Water cost 7.13 Proximity to major metropolitan markets 3.51

71
Bridging Estimates
Table 4.8 presents the overall partworths and relative importance of attributes obtained by
bridging the broiler growing and processing conjoints. The results show that distance between
feed mill and grower is the most important attribute, accounting for 19% of the variation in the
overall preference for these two components of the broiler complex. Community attitude toward
the broiler industry is the second most important attribute, contributing around 17% of variation
in preference rating. Proximity to major metropolitan markets is found to be the least important
factor, contributing only 2.3% of variation in preference rating.
Table 4.9 presents the overall partworths and relative importance of attributes affecting the
location of the broiler complex. Cost of feed ingredients was found to be the most important
factor affecting the location of a broiler complex. It accounts for approximately 27% of the
variation in the preference rating for the broiler complex location. As the cost of feed increases,
the preference for that particular location decreases, (11.441 for $160.00 per ton, -4.538 for
$260.00 per ton, -6.903 for $310.00 per ton), which is consistent with economic theory. Distance
between feed mill and growers was found to be the second most important factor, accounting for
12.5% of variation in preference rating. Community attitude toward the broiler industry
accounted for 11% of variation in preference rating. Proximity to major metropolitan markets
was found to be the least important factor accounting for just 1.5% of variation in preference
rating. Results also show that utility costs individually are less important in the broiler industry
location decision compared to some other factors in the study, but together they account for
19.4% (Electricity cost + Water cost + Sewer cost + Heating cost) of variation in the preference
rating. Electricity cost was found to be most important among the utility costs accounting for
6.32% of variation in preference rating.

72
Table 4.8: Pooled Analysis: Bridging Estimates for Broiler Growing and Processing.
Attributes Part worth Relative Importance
Distance between feed mill and grower 19.01 30 miles 2.464 100 miles -2.464 Community attitude towards broiler industry 16.92 Favorable 2.196 Not favorable -2.196 Unemployment rate in the region 12.05 High 1.565 Low -1.565 Average hourly wage in the region 11.82 High wage, $8.50 per hour -1.532 Low wage, $7.50 per hour 1.532 Electricity cost 9.58 High Cost, 6.50 cents per kWh -1.238 Low Cost, 4.00 cents per kWh 1.238 Number of growers and potential growers available 8.35 25-300 1.084 7-100 -1.084 Sewer cost 7.65 High cost, $3.00 per thousand gallons -0.993 Low cost, $1.00 per thousand gallons 0.993 Heating cost 7.26 High cost, LP gas $1.00 per gallon 0.936 Low cost, LP gas $0.90 per gallon -0.936 Water cost 5.02 High cost, $2.50 per thousand gallons -0.656 Low cost, $1.00 per thousand gallons 0.656 Proximity to major metropolitan markets 2.32 400 miles 0.303 800 miles -0.303

73
Table 4.9: Bridging Estimates for the Broiler Complex Location. Attributes Part -worth RI Cost of feed Ingredients 26.84 $160.00 per ton 11.441 $260.00 per ton -4.538 $360.00 per ton -6.903 Distance between feed mill and grower 12.50 30 miles 4.27 100 miles -4.27 Community attitude towards broiler industry 11.12 Favorable 3.806 Not favorable -3.806
Unemployment rate in the region 7.93 High 2.713 Low -2.713
Average hourly wage in the region 7.76 High wage, $8.50 per hour -2.655 Low wage, $7.50 per hour 2.655
Quality of roads between feed mill and grower 7.41 Good 2.529 Poor -2.529
Electricity cost 6.29 High Cost, 6.50 cents per kWh -2.146 Low Cost, 4.00 cents per kWh 2.146
Number of growers and potential growers available 5.50 250-300 1.879 75-100 -1.879
Sewer cost 5.03 High cost, $3.00 per thousand gallons -1.721 Low cost, $1.00 per thousand gallons 1.721
Heating cost 4.74 High cost, LP gas $1.00 per gallon 1.623 Low cost, LP gas $0.90 per gallon -1.623
Water cost 3.34 High cost, $2.50 per thousand gallons -1.366 Low cost, $1.00 per thousand gallons 1.366 Proximity to major metropolitan markets 1.52 400 miles 0.525 800 miles -0.525

74
Analysis of Additional Factors
In addition to the attributes tested in the conjoint study, respondents were also asked to rate
some additional factors affecting the location decision of the broiler complex. The respondents
were asked to rate the importance of the attributes on a scale of 1 to 7 (1 represents not important
and 7 represents very important). Table 4.10 shows the frequency distribution of additional
factors in the location decision of broiler complex. The results indicate that the grower’s attitude
toward contract production, stringency of water pollution regulations, proximity of railroads to
the feed mill, availability of local lenders, and state and local fiscal policies are rated in the very
important category. The results are consistent with the fact that broiler companies always prefer
to have contract growers who work in accordance with the terms set by them in the contract
agreement.
Several environmental regulations may be imposed on the broiler industry as it emits large
amounts of solid and liquid waste. Because of this, broiler companies consider stringency of
environmental regulations in the region as an important factor affecting their location decisions.
Availability of local lenders is considered to be an important factor in the broiler complex
location decision as broiler growers generally look for loans to build the broiler houses and buy
the necessary equipment for broiler production. The existence of an old broiler complex was
found to have little effect on the location decision of a new broiler industry.

75
Table 4.10: Percentage Importance of Additional Attributes Related to Infrastructure in the Broiler Industry Location Decision.
a includes local factors that are not included in the conjoint portion of the questionnaire b includes factors related to environmental regulations imposed on the broiler industry c includes factors related to broiler labor that are not included in the conjoint portion of the questionnaire
d includes factors related to incentives and taxes
Additional Factors Ratings Percentage Not Imp. Very Imp.
1 2 3 4 5 6 7
Infrastructurea
Availability of local grain supply 0.0 11.1 0.0 22.2 22.2 33.3 11.1 Proximity of rail roads to feed mill 0.0 0.0 11.1 0.0 11.1 0.0 77.8
Cost of land in the region 0.0 0.0 11.1 22.2 44.4 22.2 0.0
Broiler industry already established in the region 22.2 22.2 0.0 0.0 44.4 11.1 0.0 Availability of a municipal facility for waste water 0.0 11.1 11.1 22.2 11.1 22.2 22.2
treatment and solid waste disposal
Proximity to farmland or other sources 0.0 0.0 11.1 22.2 11.1 33.3 22.2
for litter disposal
Availability of local lenders for broiler 0.0 0.0 0.0 33.3 0.0 11.1 55.6
growers, (e.g. mortgage, operating loans).
Availability of local contacts to assist 0.0 11.1 11.1 33.3 44.4 0.0 0.0
in analysis of community attitude
Quality of life in the region for the employees 0.0 0.0 22.2 11.1 44.4 22.2 0.0
Regulationsb
Stringency of water pollution regulations 0.0 0.0 11.1 11.1 11.1 22.2 44.4 Stringency of dead bird and litter disposal regulations 0.0 0.0 22.2 33.3 22.2 22.2 0.0
Laborc
Growers attitude towards contract production 0.0 0.0 11.1 0.0 0.0 55.6 33.3
Availability of catchers 0.0 0.0 11.1 0.0 33.3 33.3 22.2
Availability of skilled labor(e.g. electricians 0.0 0.0 0.0 11.1 33.3 33.3 22.2
general mechanics, and refrigeration mechanics)
State and Local Policiesd
State development incentives (Income 0.0 0.0 0.0 11.1 22.2 55.6 11.1
tax credit, Job training, Direct loans etc,)
State property tax 0.0 0.0 0.0 0.0 33.3 66.7 0.0
Local property tax 0.0 0.0 0.0 0.0 33.3 55.6 11.1
State fuel tax 0.0 0.0 0.0 0.0 44.4 55.6 0.0

76
Chapter 5 Summary and Conclusions
Summary
The United States broiler industry is concentrated primarily in the southeastern and south
central regions of the U. S. These regions account for 85 percent of the domestic broiler meat
supply. The top broiler producing states are Georgia, Arkansas, Alabama, Mississippi, and North
Carolina, which account for more than 60% of the total U. S. broiler supply. Even though
Louisiana is not among the top broiler producing states, the poultry industry is Louisiana’s
largest animal industry, and the second largest agricultural industry in terms of value of
production. In order to encourage the broiler companies to establish new broiler complexes, or
expand existing complexes in Louisiana, it is important to identify the factors affecting the
location decision of a broiler complex. This study has focused on identifying these attributes, and
measuring their relative importance in the broiler complex location decision.
The specific objectives of the study were to: 1) identify factors affecting location decisions
of broiler complexes in the United States; and 2) quantify the effects and measure the relative
importance of each of the above-determined factors on the broiler complex location decision. In
order to accomplish these objectives, various methods and techniques were implemented, which
are summarized in this chapter, along with the results and conclusions.
An important contribution of this study is the application of the conjoint analysis to the
industry location problem. This is among of the few studies which have employed conjoint
analysis for analyzing the relative importance of each attribute in the location decision of an
industry. Another important contribution of this study is the application of a bridging technique,
which is utilized to bridge the three conjoints. A total of 30 attributes were analyzed, of which
the relative importance of 12 attributes were determined by utilizing conjoint analysis, and the

77
remaining 18 attributes were analyzed based on attitude ratings given by each respondent. The
attributes and levels that were analyzed by the conjoint design were selected based on the
literature review, group discussions, and personal interviews with experts of the U. S. broiler
industry. The attributes related to broiler growing, feed production, and broiler processing were
studied separately, and later bridging techniques were used to measure the relative importance of
the attributes in the location decision of a total broiler complex.
Statistical Results
A two-limit Tobit model was used to estimate part worth effects of attributes on eight
location features for broiler growing, feed mill, and broiler processing, respectively. The
attributes found to have a positive effect on the location of a broiler growing enterprise were the
distance between the feed mill and grower, and the community attitude toward the broiler
industry. The largest part worth utility, i.e., the highest contribution to the preference rating, was
30 miles between the feed mill and grower. On the other hand, the lowest part-worth utility
(-1.005) was associated with 100 miles between the feed mill and grower. Water cost, heating
cost, and electricity cost associated with broiler growing were not found to be significant. This
may be attributed to the fact that integrators are not responsible for utility costs under the terms
of the broiler production contract. The distance between the feed mill and grower was found to
be the most important factor in the location decision of broiler growing enterprise, accounting for
28.75 percent in the variation of the preference rating. This is closely followed by the
community’s attitude toward the broiler industry which accounts 22.94 percent in variation of
preference rating.
The cost of feed ingredients, community attitude toward the broiler industry, and quality of
roads between feed mill and grower were found to have positive effect on location of a feed mill

78
enterprise. The highest contribution to the preference rating was the $160.00 per ton cost of feed
ingredients. Conversely, the lowest part-worth utility (-2.92) was associated with $310.00 per ton
cost of the feed ingredients. The cost of feed ingredients was found to be the most important
factor in the location decision of the feed mill enterprise, accounting for 59.09 percent in the
variation of the preference rating.
The community attitude toward the broiler industry, unemployment rate in the region, and
average hourly wage in the region were found to have significant effects on the location decision
of broiler processing enterprise. The highest and lowest utilities were associated with favorable
and unfavorable community attitude, respectively. Therefore, unlike broiler growing and feed
mill enterprise, community attitude toward the broiler industry was found to be the most
important in the location of a broiler processing plant, accounting for 29.67 percent in the
variation of the preference rating. The reason for this may be attributed to the fact that broiler
processing plants represent a broiler complex whereas broiler houses and feed mills are scattered
around the region. The other important factors for broiler processing enterprise location were
unemployment rate and average hourly wage in the region, where each accounted for 18 percent
in variation of preference rating. Proximity to major metropolitan markets was found to be the
least important factor, accounting for only 3.5 percent in variation for preference rating.
The results from the bridging design show that the cost of feed ingredients is the most
important factor in the location decision of the total broiler complex, accounting for 26.84
percent in the variation of the preference rating. Distance between the feed mill and grower,
which is found to be the most important factor for the location decision of the broiler growing
enterprise, is found to be the second most important factor in the location decision of the total
broiler complex, accounting for 12.5 percent in variation of the preference rating. Community

79
attitude toward the broiler industry, which is found to be the most important factor for the
location decision of a broiler processing enterprise, is found to be the third most important factor
in the location decision of the total broiler complex, accounting for 11.12 percent of the variation
of preference rating. Proximity to major metropolitan markets is found to be the least important
attribute, accounting only 1.5 percent in variation of preference rating.
Conclusion
An important finding of this study is that respondents consider cost of feed ingredients as
the most critical factor in the location decision of their broiler complex. They prefer to locate in
the region with low feed cost. As previously mentioned, this result is consistent with the fact that
feed cost account for 60% of the total cost of producing one pound of live broiler. The result is
also consistent with the location theory discussed in chapter 2 of this study, which predicts
industries prefer to locate in a region where the cost of transporting the raw material (feed) is
lower. Easterling, Braschler and Kuehn (1986) also found that cost of importing feed is the most
critical variable in the location decision of a broiler complex. The feed cost generally includes
the transportation cost incurred by transporting the feed ingredients from the source to the feed
mill. The Midwest is considered to be the primary source for broiler feed where corn and
soybean are produced in large quantities. Thus, the broiler companies for their broiler complex
location will prefer a region that can import the feed ingredients from the Midwest at a relative
low cost. In 2002, the cost of feed in the Delta region, which includes Louisiana, was $248 per
ton, this is relatively high compared to $158 per ton in the southeast region (GA, AL, FL, SC)
and relatively low compared to $311 per ton in the southern plains (TX and OK). However, even
though the cost of feed is high in Texas, Arkansas, and Mississippi, they produce more broilers
than Louisiana. This may be attributed to other favorable factors of production such as favorable

80
community attitude, labor costs, and concentration of growers. Therefore, this study concludes
that Louisiana should analyze the factors that can lower the costs of importing feed and/or
analyze other important factors affecting a broiler complex location, which are discussed later in
this chapter under directions for future research.
The broiler industry prefers locations with relatively concentrated availability of growers.
Industry executives prefer growers to be concentrated close to the feed mill in order to lower the
transportation cost incurred by transporting feed to the broiler houses. Vest and Lacy (1996) also
found that companies specify a maximum allowable distance between a broiler farm and the feed
mill or processing plant in order to lower the cost of transportation. The grower’s attitude toward
contract production was also considered to be an important factor in the respondent’s broiler
complex location decision. The respondents prefer to locate in a favorable community, which is
considered to reflect the level stringency of environmental regulations in that region. The
environmental regulations such as waste water discharge and solid waste disposal regulations
may be stringent in a region where the community is sensitive to health, wellbeing and
environmental contamination risk. Thus, assurance of both economic benefits and environmental
protection by the company could lead to a favorable community attitude toward the broiler
complex location (Spies, Murdock, White, Krannich, Wulfhorst, Wrigley, Leistritz, Sell, and
Thompson, 1998).
The concentration of broiler complexes in the South are also attributed to the labor factors
included in the conjoint study, i.e, unemployment rate and average hourly wage in region. This
study authenticates the rationale behind concentration of broiler complexes in the South, in spite
of lower feed costs in the Midwest. These results are consistent with location theory discussed in
chapter 2, which indicate that industries prefer to locate in regions with low labor cost.

81
Easterling, Braschler, and Kuehn (1986), and Aho (1998) also concluded that broiler companies
prefer to locate their complexes in regions with low labor costs. The individual costs associated
with utilities were found to be less significant in the broiler complex location decision compared
to the above-discussed factors. This result is consistent with the findings of Easterling, Braschler,
and Kuehn (1986) who found that electricity cost is less important in the broiler industry location
decision. But, utility costs together were found to be significant in the broiler complex location
decision.
Another important finding of this study was that none of the respondents preferred to build
a new broiler complex in the next five years. Most of the respondents preferred to expand their
existing broiler complex, (i.e., adding growers, feed mills, and broiler processing plants) and/or
build a further processing plant that would add value to ready to cook products. Therefore, this
study concludes that, for the next five years, Louisiana should develop strategies that will
enhance existing companies in expansion of existing broiler complexes.
Limitations and Future Research
Although survey respondents accounted for 50 percent of industry output, they accounted
for only 21 percent of the total number of integrated broiler companies in the United States.
Results of the study could change with a higher response rate. One reason for the somewhat low
response rate is the nature of the experimental design (Halbrendt et. al (1991) (12% response
rate), Harrison et. al (1998) (16.3% response rate). This study used conjoint analysis to determine
the companies’ preferences, and the nature of the problem required a mail survey with three
conjoint designs. This increased the length of the questionnaire. Moreover, the questionnaire was
directed to company CEOs, whose time is very limited and valuable.

82
Since feed cost was found to be the most important attribute, future research could focus on
analyzing the cost differentials of feed in the southeastern and south central states. As discussed
earlier, the feed cost varies by a large amount among the delta ($248 per ton), southeastern ($158
per ton) and southern plains ($311 per ton). Analyzing the factors behind these price differences
would provide a better understanding of location decisions. Another direction for future research
could focus on factors that affect community attitude, which was found be an important factor in
the broiler complex location decision. Analyzing the factors important to the community that
leads to a favorable attitude toward the broiler industry would aid in promoting broiler
operations. The results of this study can be integrated with the findings of future project to better
understand and develop strategies to attract broiler companies.

83
References
Agricultural Statistics Board, NASS, USDA. “Agricultural Prices, April 2002. B-9-11. Aho Paul. “Regional Trends in Broiler Production”. Broiler Industry, (March 1998):18-22. Albaum Gerald. “BRIDGER”. Journal of Marketing Research, (November 1989): 486-488. Barkley L. David. “ Employment Generation Strategies For Small Towns: an Overview of
alternatives”. REDRL Research Report, Clemson University, Feb., 2001. Barkley L. David, Mark s. Henry, and Mellie L. Warner. “ Estimating the Community-Level
Impacts of Attracting New Businesses: The Implications of Local Labor Market Adjustments”. REDRL Research Report, Clemson University, Jan., 2001.
Bastien R. W. & H. Charles Goan. “Commercial Broiler & Egg Production”. Cooperative
Extension - University of Tennessee. 1998. Berry Joe. “Factors Involved in Site Selection for New and Modified Poultry Facilities”.
Oklahoma Cooperative Extension service, Oklahoma State University. (Aug. 1999). Braun, Michael A., and Srinivasan, V. “Amount of Information as a Determinant of Consumer
Behavior Towards New Products,” 1975 Combined Proceedings, Chicago: American Marketing Association, 373-8.
Bretton-Clark, Conjoint Designer Version 2, 1987. Carawan Roy, Patricia Curtis, Kevin Keener, and Melissa Taylor. “Pollution Prevention Pays in
Food Processing”. North Carolina Extension Service. (May, 1999) County Business Patterns, U. S. Census Bureau. (1993-2000). Cunningham Dan. “Contract Broiler Production: Questions and Answers”. The University of
Georgia College of Agricultural and Environmental sciences Cooperative Extension Service. (May, 1999).
Curtis Larry, Jim Hairston, Jim Donald, Mike Eckman. “Key Water Factors for Broiler
Production”. The Alabama Poultry Engineering and Economics, Auburn University, No. 7 September 2000.
Dillman, D. “Mail and telephone Surveys: the Total Design Method”. New York: John Wiley and
sons. 1978. Easterling Edward H., Curtis H. Braschler and John A. Kuehn. “Optimal Location of the US
Broiler industry”. Journal of Agribusiness. (February 1986): 57-62.
84
Francois Pierre and Douglas L. MacLachlan. “Bridging Designs for Conjoint Analysis: The Issue of Attribute Importance”. Working paper (September 1997).
Fuerst, W. F. and M. R. Kare. “The influence of pH on fluid tolerance and preferences”. Poultry
Sci. (1962)41:71-77. Gan Christopher EC. “A Conjoint Analysis of Wetland-Based Recreation: A Case Study of
Louisiana Waterfowl Hunting”. Unpublished Thesis, submitted to Department of agricultural Economics and Agribusiness, Louisiana State University (May 1992).
Georgia Agricultural Resources (Poultry). The University of Georgia College of Agricultural and
Environmental sciences Cooperative Extension Service www.ect.uga.edu/agguide/Poultry.htm, (Date last visited 07/19/01).
Green, Paul E. “On the Design of Choice Experiments Involving Multifactor Alternatives”.
Journal of Consumer Research. Vol: 1 (1974). Green, P. E. and Y. Wind. “New Way to Measure Consumer’s Judgment”. Harvard Business
Review 53(July-August 1975): 107-17. Green Paul E. and V. Srinivasan. “Conjoint Analysis in Consumer Research: Issues and Outlook”.
Journal of Consumer Research, 5 (September 1978): 103-123. Green Paul E. and V. Srinivasan. “Conjoint Analysis in Marketing: New Developments With
Implications for Research and Practice”. Journal of Marketing. Vol. 4 (October 1990): 3-19. Greenhut Melvin L. “Plant Location in Theory and in Practise, the Economics of Space”. The
Theory of Least-Cost Location, Chapter one. Greenwood Press, Publishers. 1982. Gregory Thomas L. and Vernon Rhodes. “Ag Report”. USDA- Mississippi Department of
Agriculture and Commerce. Vol. 01-21(November 2001). Griffith David. “Poultry Processing, Rural Industrialization and the Latinization of Low-Wage
Labor”. Hay Trabajo (October 11th 1993). Halbrendt, C.K., F.F Wirth and G.F. Vaughn. “Conjoint Analysis of the Mid-Atlantic Food-Fish
Market for Farm-raised Hybrid Striped Bass”. S. J. of agr. Econ. 23, 1(July 1991) 155-63. Hair J. F., Anderson R. E., Tatham R. L., Black W. C. “Conjoint Analysis”. Multivariate Data
Analysis, Chapter 10(Pg.556-601). Halbrendt, C.K., F.F Wirth and G.F. Vaughn. “Conjoint Analysis of the Mid-Atlantic Food-Fish
Market for Farm-raised Hybrid Striped Bass”. S. J. of agr. Econ. 23,1(July 1991) 155-63. Halbrendt Catherine, Michael Buescher, Pauline Sullivan, Yi Zheng. “ Community-Business
Matching: a New Model for Rural Economic Development”. Working paper May, 1999.

85
Harrigan, K. R. “Strategies for Vertical Integration. Lexington, MA:D. C. Heath and Company,
1983. Harrison, R.W., “Analysis of State and Site Specific Determinants for Growth of Food
Manufacturing in Louisiana”. Project proposal 2000. Louisiana State University Agricultural Center, Research and Extension.
Harrison, R.W., A. Ozayan, and S. P. Meyers. “ A Conjoint Analysis of New Food Products
Processed from Underutilized Small Crawfish”. J. of Agr. And Applied Econ. 30,2(December 1998) 257-265.
Harrison R. Wes, Timothy Stringer, and Witoon Prinyawiwatkul. “An Analysis of Consumer
Preferences for Value-Added Seafood Products Derived from Crawfish”. Agriculture and Resource Economics Review 31/2 (October 2002): 157-170.
Hoover, Edgar M. Location of Economic Activity, 1st ed. New York; McGraw-Hill, 1948. Hopman J.K.K., J.H. van Niejenhuis, J.A. Renkema. “Application of Conjoint Analysis to Elicit
Growers Preferences for Horticultural Location in the Netherlands”. ISHS Acta Horticulturae 429 (1996)
Hughes David W. and R. Wes Harrison. “A Comparison of the Size and Location of Agribusiness
Industries for Louisiana and its Parishes: 1982-1992”. Louisiana State University Agricultural Center. Bulletin Number 858 (April, 1997).
Hughes David W. “Measuring the Effect of Louisiana Agriculture on the State Economy Through
Multiplier and Impact Analysis”. Louisiana State University Agricultural Center. Bulletin Number 849 (October, 1995).
Humane Society of United States and Sustainable Agriculture Section. “Factory Farming-Broiler
Chickens, Chickens Under Contract: The U. S. Broiler Industry Today”. (Aug, 1997). Jackson Wendy C., Roy Carawan, Patricia Curtis, Kevin Keener, and Melissa Taylor. Pollution
Prevention Pays in Food Processing. “Survey Shows That Poultry Processors Can Save Money by Conserving Water”. North Carolina Extension Service. (March 1996)
Jacob Jacqueline P. and F. Ben Mather. “Florida’s Commercial Broiler Industry”. University of
Florida, Cooperative Extension Service, Institute of Food and Agricultural sciences. (June 1997).
Johnson, Richard M. “Trade-off Analysis of Consumer Vales,” Journal of Marketing Research, 11
(1974):121-7.

86
Jones Harold B., Jr., and Steve R. Lee. “Energy Use and Costs in Broiler Processing Plants in the South”. University of Georgia College of Agriculture Experiment Stations, Research Bulletin 205 (October 1977).
Kohls, Richard L. and Joseph N. Uhl. Marketing of Agricultural Products, 7th ed. MacMillan
Publishing Company, N.Y., and 1990. Lacy Michael P. “Management of Large Broiler Firms”. The University of Georgia, College of
Agricultural and Environmental Sciences Cooperative Extension Service. http://www.ces.uga.edu/pubcd/L419-w.html (Date last visited March 13th 2002). Lavergne Theresia. “Poultry and Eggs”. Louisiana’s Agriculture 2000 Outlook. Louisiana State
University Agricultural Center, Research and Extension. (page 40).
Leistritz, Larry F. “Agribusiness firms: Location Determinants and Economic Contribution.” Agribusiness: An International Journal.8, 2(July 1992):273-286.
Lopez, Rigoberto A. and Nona R. Henderson. “The Determinants of Location Choices for Food
Processing Plants.” Agribusiness: An International Journal.5, 6(January 1989) 619-632. Louiviere, Jordan J. “Analyzing Decision Making-Metric Conjoint Analysis”. Sage University
paper series on Quantitative Applications in the Social Sciences. Beverly Hills: sage Publications. 1988.
Luce, R. Duncan, and Tukey, John W., “Simultaneous Conjoint Measurement: A New Type of
Fundamental Measurement,” Journal of Mathematical Psychology, 1, 1-27. Merka Bill, Mike Lacy, Stan Savage, Larry Vest, and Cecil Hammond. “Composting Poultry
Mortalities”. http://www.ces.uga.edu/pubcd/c819-15w.html (Date last visited March 13th 2002).
Meyer Luca. “Predictive Accuracy of Conjoint Models for Data Collected by Means of World
Wide Web Survey”. Final Paper, Master of Statistics Program, Katholieke Universiteit Leuven-Belgium. (June 1998).
Morgan Wallace G. and Murray Steve. “Economic Impact of the Mississippi Poultry industry at
the year 2000”. A publication of the Mississippi Agricultural & Forestry Experimentation Station, Mississippi State University, Information Bulletin 364, January 2000.
Morse George W. “Economic Importance of Minnesota’s Poultry Industry”. http://www.extension.umn.edu/distribution/livestocksystem/DI7020.html (Date last visited Feb 8th 2002). Mulhearn, C.J., “Assessing suitability of water for livestock”. Dept. Agric. S. Australia. (1957)
61:49-58.

87
Olson, O. E., L. B. Embry, M. A. Hoelrosher, R. C. Wahlstorm, C. W. Carlson, L. M. Krista, W. R. Boars and G. F. Gastler,. Salinity and livestock water quality. South Dakota Agric. Exp. Sta. Bull. 481(1959).
Ozayan, Aylin. “Market Analysis of New Minced Meat Products Made From Undersized
Crawfish”. Unpublished Thesis, submitted to Department of agricultural Economics and Agribusiness, Louisiana State University (May 1997).
Spies sherril, Steve H. Murdock, Steve White, Richard Krannich, J.D. Wulfhorst, Krissa Wrigley,
F. Larry Leistritz, Randy Sell, and JoAnn Thompson. ‘Support for waste Facility Siting: Differences between Community Leaders and Residents”. Rural Sociology 63 (1), 1998, p.65-93.
Sporleder Thomas L. “Managerial Economics of Vertically Coordinated Agricultural Firms”.
Amer. J. Agricultural Economics. Leaflet 423(December 1992):1226-1231. Stringer Timothy Allen. “Attribute Optimization of Prototype Products Derived from
Underutilized Crawfish: An Application of Conjoint Analysis”. Unpublished Thesis, submitted to Department of agricultural Economics and Agribusiness, Louisiana State University (May 1999).
U. S. Department of Energy, Energy Information administration. EIA Reports, October 2000. United States Department of Agriculture / National Agricultural Statistics Service. “Poultry-
Production and Value 2001summary”. April 2002. United States Department of Agriculture / Economic Research Service and National Chicken
Council. “Per Capita Consumption of Poultry and Livestock, in Pounds, 1960 to Estimated 2002”. http://www.eatchicken.com/statistics/consumption_pounds_60-02.cfm (Date last visited April 10th 2002).
United Food and Commercial Workers Union / National Interfaith Committee for worker Justice.
“Poultry Justice Campaign”. http://www.nicwj.org/pages/issues.Poultryfacts.html (Date last visited Jan 25th 2002).
Von Thünen J. H., Der Isolierte Staat in Beziehung auf Landwirtschaft und Nationalökonomie, 3rd
edition Berlin: Schumacher-Zarchlin, 1875. Varian, Hal R. “Intermediate Microeconomics”. Fourth Edition. W. Norton and Company
Publishing. (1996). Vest Larry R. and Michael P. Lacy. “Broiler Production and Management”. The University of
Georgia College of Agricultural and Environmental sciences Cooperative Extension Service. (May 1999). Circular 446 (October, 1996).

88
Webber Alfred. “Theory of the Location of Industries”. Simplifying Assumptions (Chapter 2), Transport Orientation (Chapter 3), and Labor Orientation (Chapter 4). The University of Chicago Press. Seventh impression 1969. Translated by C. J. Friedrich.
Wegenhoft Kenneth N. “June 2002 Broiler Situation and Outlook”. Louisiana Agricultural Center
Research and Extension. Wittink, Dick R., and P. Cattin. “Commercial Use of Conjoint Analysis: An Update.” Journal of
Marketing. Vol. 53. (July 1989).

89
Appendex
Copy of Mail Questionnaire

90
A Survey of Factors Affecting
Site-Location for the U. S. Broiler Industry
Louisiana State University → Please complete the questionnaire as soon as possible and return in the postage paid envelope. → Your answers are completely confidential. Do not write your name on the questionnaire.
Thank you for your help

91
Introduction
The purpose of this questionnaire is to collect information regarding site-specific determinants affecting the growth of broiler processing in the United States. The questionnaire is organized into five sections. The first three sections contain questions regarding factors related to; 1. broiler growing, 2. feed supply, and 3. broiler processing. The fourth section contains questions regarding business infrastructure, state regulations, labor, and state and local policies associated with the broiler industry. The last section contains questions pertaining to your company’s current broiler operations.
Section І: Broiler Growing
Please review the nine boxes shown below. Each box contains information about location features for a hypothetical broiler grower’s location. Please rate each box using a scale from “0” to “10”, where: 0=Least preferred combination of location features, and 10= Most preferred combination of location features. Ties are okay.
Broiler growing Water cost: High cost, $2.50 per thousand gallons Heating cost: Low cost, LP gas $0.90 per gallon Electricity cost: High cost, 6.50 cents per kwh
Number of growers and potential growers available: 75-100 Distance between feed mill and grower: 30 miles
Community attitude towards broiler industry : Favorable
RATING_________
Broiler growing Water cost: High cost $2.50 per thousand gallons Heating cost: Low cost, LP gas $0.90 per gallon Electricity cost: Low cost, 4.00 cents per kwh
Number of growers and potential growers available: 250-300 Distance between feed mill and grower: 30 miles
Community attitude towards broiler industry: Not favorable
RATING_________
Broiler growing Water cost: Low cost, $1.00 per thousand gallons Heating cost: Low cost, LP gas $0.90 per gallon Electricity cost: Low cost, 4.00 cents per kwh
Number of growers and potential growers available: 75-100 Distance between feed mill and grower: 100 miles
Community attitude towards broiler industry: Not favorable
RATING_________
Broiler growing Water cost: Low cost, $1.00 per thousand gallons Heating cost: Low cost, LP gas $0.90 per gallon Electricity cost: High cost, 6.50 cents per kwh
Number of growers and potential growers available: 250-300 Distance between feed mill and grower:100 miles
Community attitude towards broiler industry: Favorable
RATING_________

92
Broiler growing Water cost: Low cost, $1.00 per thousand gallons
Heating cost: High cost, LP gas $1.00 per gallon
Electricity cost: Low cost , 4.00 cents per kwh
Number of growers and potential growers available: 75-100 Distance between feed mill and grower : 30 miles
Community attitude towards broiler industry: Favorable
RATING_________
Broiler growing Water cost: High cost $2.50 per thousand gallons Heating cost: High cost LP gas $1.00 per gallon Electricity cost: Low cost 4.00 cents per kwh
Number of growers and potential growers available: 250-300 Distance between feed mill and grower: 100miles
Community attitude towards broiler industry : Favorable
RATING_________
Broiler growing Water cost: Low cost, $1.00 per thousand gallons Heating cost: Low cost, LP gas $0.90 per gallon Electricity cost: Low cost, 4.00 cents per kwh
Number of growers and potential growers available: 250-300 Distance between feed mill and grower: 100 miles
Community attitude towards broiler industry: Favorable
RATING_________
Broiler growing Water cost: High cost of $2.50 per thousand gallons Heating cost: High cost of LP gas $1.00 per gallon Electricity cost: High cost of 6.50 cents per kwh
Number of growers and potential growers available: 75-100 Distance between feed mill and grower: 100 miles
Community attitude towards broiler industry : Not favorable
RATING_________
Broiler growing Water cost: Low cost, $1.00 per thousand gallons Heating cost: High cost, LP gas $1.00 per gallon Electricity cost: High cost , 6.50 cents per kwh
Number of growers and potential growers available: 250-300 Distance between feed mill and grower: 30 miles
Community attitude towards broiler industry: Not favorable
RATING_________

93
Section ІІ: Feed Mill
Please review the nine boxes shown below. Each box contains information about location features for a hypothetical feed mill location. Please rate each box using a scale from “0” to “10”, where: 0=Least preferred combination of location features, and 10= Most preferred combination of location features. Ties are okay.
Feed Mill Cost of feed ingredients: $260.00 per ton Quality of roads from feed mill to growers: Good
Community attitude towards broiler industry: Not favorable
RATING_____
Feed Mill Cost of feed ingredients: $310.00 per ton Quality of roads from feed mill to growers: Good
Community attitude towards broiler industry: Not favorable
RATING_____
Feed Mill Cost of feed ingredients: $310.00 per ton Quality of roads from feed mill to growers: Good
Community attitude towards broiler industry: Favorable
RATING_____
Feed Mill Cost of feed ingredients: $260.00 per ton Quality of roads from feed mill to growers: Poor
Community attitude towards broiler industry: Favorable
RATING_____

94
Feed Mill Cost of feed ingredients: $160.00 per ton Quality of roads from feed mill to growers: Good
Community attitude towards broiler industry: Favorable
RATING_____
Feed Mill Cost of feed ingredients: $160.00 per ton Quality of roads from feed mill to growers: Poor
Community attitude towards broiler industry: Not favorable
RATING_____
Feed Mill Cost of feed ingredients: $310.00 per ton Quality of roads from feed mill to growers: Poor
Community attitude towards broiler industry: Not favorable
RATING_____
Feed Mill Cost of feed ingredients: $260.00 per ton Quality of roads from feed mill to growers: Good
Community attitude towards broiler industry: Favorable
RATING_____
Feed Mill Cost of feed ingredients: $310.00 per ton Quality of roads from feed mill to growers: Poor
Community attitude towards broiler industry: Favorable
RATING_____

95
Section ІIІ: Broiler Processing Plant
Please review the nine boxes shown below. Each box contains information about location features for a hypothetical broiler-processing plant location. Please rate each box using a scale from “0” to “10”, where: 0=Least preferred combination of location features, and 10= Most preferred combination of location features. Ties are okay.
Broiler processing Water cost: Low Cost, $1.00 per thousand gallons Electricity cost: Low cost, 4.00 cents per kwh
Proximity to major metropolitan markets: 800 miles Unemployment rate in the region: Low Average hourly wage in the region: High wage, $8.50 per hour Sewer cost: Low cost, $1.00 per thousand gallons
Community attitude towards broiler industry: Favorable
RATING_____
Broiler processing Water cost: Low cost, $1.00 per thousand gallons Electricity cost: High cost, 6.50 cents per kwh
Proximity to major metropolitan markets: 800 miles Unemployment rate in the region: High Average hourly wage in the region: Low wage, $7.50 per hour Sewer cost: Low cost, $1.00 per thousand gallons
Community attitude towards broiler industry: Not favorable
RATING_____
Broiler processing Water cost: High cost, $2.50 per thousand gallons Electricity cost: High cost, 6.50 cents per kwh
Proximity to major metropolitan markets: 800 miles Unemployment rate in the region: Low Average hourly wage in the region: Low wage, $7.50 per hour Sewer cost: High cost, $3.00 per thousand gallons
Community attitude towards broiler industry: Favorable
RATING_____
Broiler processing Water cost: Low cost, $1.00 per thousand gallons Electricity cost: Low cost, 4.00 cents per kwh
Proximity to major metropolitan markets: 400 miles Unemployment rate in the region: Low Average hourly wage in the region: Low wage, $7.50 per hour Sewer cost: High cost, $3.00 per thousand gallons
Community attitude towards broiler industry: Not favorable
RATING_____

96
Broiler processing Water cost: High cost, $2.50 per thousand gallons Electricity cost: Low cost, 4.00 cents per kwh
Proximity to major metropolitan markets: 400 miles Unemployment rate in the region: High Average hourly wage in the region: Low wage, $7.50 per hour Sewer cost: Low cost, $1.00 per thousand gallons
Community attitude towards broiler industry : Favorable
RATING_____
Broiler processing Water cost: Low Cost, $1.00 per thousand gallons Electricity cost: High cost, 6.50 cents per kwh
Proximity to major metropolitan markets: 400 miles Unemployment rate in the region: High Average hourly wage in the region: High wage, $8.50 per hour Sewer cost: High cost, $3.00 per thousand gallons
Community attitude towards broiler industry: Favorable
RATING_____
Broiler processing Water cost: High cost, $2.50 per thousand gallons Electricity cost: : High cost, 6.50 cents per kwh
Proximity to major metropolitan markets: 400 miles Unemployment rate in the region: Low Average hourly wage in the region: High wage, $8.50 per hour Sewer cost: Low cost, $1.00 per thousand gallons
Community attitude towards broiler industry: Not favorable
RATING_____
Broiler processing Water cost: Low Cost, $1.00 per thousand gallons Electricity cost: Low cost, 4.00 cents per kwh Proximity to major metropolitan markets: 400 miles Unemployment rate in the region: Low Average hourly wage in the region: Low wage, $7.50 per hour Sewer cost: Low cost, $1.00 per thousand gallons
Community attitude towards broiler industry: Not favorable
RATING_____
Broiler processing Water cost: High cost, $2.50 per thousand gallons Electricity cost: Low cost, 4.00 cents per kwh
Proximity to major metropolitan markets: 800 miles Unemployment rate in the region: High Average hourly wage in the region: High wage, $8.50 per hour Sewer cost: High cost, $3.00 per thousand gallons
Community attitude towards broiler industry: Not favorable
RATING_____

97
Section І V: Additional Factors
Please indicate the importance of the following additional factors regarding the location of a broiler complex (Circle a number for each factor, where 1 represents Not Important and 7 represents Very Important)
Factor Not Important Very Important Infrastructure: Availability of local grain supply 1 2 3 4 5 6 7 Proximity of railroads to feed mill 1 2 3 4 5 6 7 Cost of land in the region 1 2 3 4 5 6 7 Broiler industry already established in the region 1 2 3 4 5 6 7 Availability of a municipal facility for wastewater treatment and solid waste disposal 1 2 3 4 5 6 7 Proximity to farmland or other sources for litter disposal 1 2 3 4 5 6 7 Availability of local lenders for broiler growers, (e.g. mortgage, operating loans). 1 2 3 4 5 6 7 Availability of local contacts to assist in analysis of community attitude 1 2 3 4 5 6 7 Quality of life in the region for the employees 1 2 3 4 5 6 7 Regulations: Stringency of water pollution regulations 1 2 3 4 5 6 7 Stringency of dead bird and litter disposal regulations 1 2 3 4 5 6 7

98
Factor Not Important Very Important Labor: Growers attitude towards contract production 1 2 3 4 5 6 7 Availability of catchers 1 2 3 4 5 6 7 Availability of skilled labor (e.g. electricians, general mechanics, and refrigeration mechanics) 1 2 3 4 5 6 7 State and Local Policies: State development incentives (Income tax credit , Job training, Direct loans etc,) 1 2 3 4 5 6 7 State property tax 1 2 3 4 5 6 7 Local property tax 1 2 3 4 5 6 7 State fuel tax 1 2 3 4 5 6 7
Section V: Questions Related To Your Total Broiler Operations
1) How many broiler complexes do you presently operate?
________(Please specify the number)
2) Please circle the category that most nearly reflects the age of your oldest broiler complex. a. 5-10 years b. 11-20 years c. 21-30 years d. 31-40 years e. More than 40 years
3) Please circle the category that most nearly reflects the age of your newest broiler complex. a. 1-5 years b. 6-10 years c. 11-20 years d. More than 20 years
4) Are you planning to expand in the next 5 years? (Circle appropriate answer)
a. Yes (Please continue with question 5) b. No (Please continue with question 6)

99
5) Are you planning to expand in any of the following ways? (Circle all appropriate answer)
a. Build a new complex plant b. Expand an existing complex (i.e. adding growers, feed mills, and broiler processing plants ) c. Build a further processing facility d. Other, please specify _____________ that adds value to ready to cook products
6) What are the primary forces driving your expansion? (Circle appropriate answer) a. Growth in domestic market b. Growth in export market c. Expansion of market share d. Other, please specify ____________
7) Please indicate the total number of employees currently working in the broiler operations you specified in question 1. (Circle appropriate answer)
a. 100-999 b. 1000-2499 c. 2500-4999 d. 5000-9999 e. More Than 10,000
8) Please indicate total sales of your company for the last fiscal year. (Circle appropriate answer)
a. Less $250million b. $250-$500 million c. $500million-$1 billion d. More than $1 billion
* Would you like a copy of the results? (Circle appropriate answer) a. Yes b. No

100
Please use the space below to make any additional comments.
Thank you for your time and your suggestions
101
Vita
Pramod Sambidi was born on April 25, 1976, in Hyderabad, Andhra Pradesh, India. He
attended high school at St. Joseph’s high school, Ramanthapur, Hyderabad, India, and graduated
in May of 1991. He obtained a bachelor of science majoring in agriculture from the College of
Agriculture, Acharya N. G. Ranga Agricultural University, Hyderabad, India, in July 1999. He
began his master’s program in agricultural economics, in the Department of Agricultural
Economics and Agribusiness, Louisiana State University, Baton Rouge, Louisiana, in August
2000. He is a candidate for the degree of Master of Science in agricultural economics in May
2003.