Embed Size (px)
Citation preview

P E O P L E S C I E N C E & P O L I C Y 1
Factors Affecting Science Communication
The Royal SocietyResearch Councils UKThe Wellcome Trust
May 2006 05/013
People Science & Policy Ltd, Hamilton House, Mabledon Place, London WC1H 9BB. Tel: 020 7554 8620E-mail: [email protected] Web: www.peoplescienceandpolicy.com
Registered in England and Wales, no. 3891609

P E O P L E S C I E N C E & P O L I C Y 2
Contents
1. Introduction
2. Sample profile
3. Data
4. Cluster Analysis
Annex A
Questionnaire

INTRODUCTION SAMPLE PROFILE DATA CLUSTER ANALYSIS ANNEX A
P E O P L E S C I E N C E & P O L I C Y 3
1. INTRODUCTION
People Science & Policy Ltd (PSP) project was commissioned by The Royal Society, Research
Councils UK and The Wellcome Trust to undertake the "Factors Affecting Science Communication"
project. There were six aims:
1. To establish the relative importance of science communication to UK researchers
2. To examine the amount and type of science communication activities undertaken by UK
researchers
3. To explore factors that may facilitate or inhibit science communication
4. To explore the extent to which researchers may wish to
undertake further science communication
5. To explore the views of funders, senior academics, social scientists and other relevant groups
on factors affecting research scientists engaging in science communication activities
6. To provide evidence about how universities, other research institutions and funders can promote
effective science communication.
This report sets out the findings from the quantitative survey of research scientists and engineers
working in UK higher education institutions (HEIs).
1.1 Technical detailsThe survey was hosted on the PSP website and potential respondents were invited to take part via a
personal email setting out the objectives of the survey and providing a hyperlink to the website. The
survey was only accessible to those with a link to ensure that the sample is statistically representative
of research scientists and engineering in UK HEIs.
The sample is designed to be representative of scientists and engineers undertaking research in UK
higher education institutions and used a two stage sampling procedure. 66 HEIs were invited to take
part in the project and 50 agreed to do so (a response rate of 75%). 3,000 research staff at these HEIs
were invited to take part and the achieved response rate is 52%, allowing for deadwood, that is, email
addresses which bounced back as not having reached the intended recipient and people who told us
that they were not eligible or no longer in post.
Fieldwork took place between 5 September and 18 November 2005.
A separate technical report is available setting out how the sample and survey were constructed and
details of the final response rate.

P E O P L E S C I E N C E & P O L I C Y 4
1.2 Weighting Rim weighting was applied to the data to ensure that the demographic profile of the survey
respondents matched that of the target universe. Target profiles were set for four variables: academic
employment function, gender, ethnic group and grade based on data from the Higher Education
Statistics Authority (HESA). The Snap SurveyPlus Rim Weighting program was then run, which
automatically applied a weight to each respondent in order to achieve the target demographic profile.
The table below shows the demographic profile before and after weighting:
INTRODUCTION SAMPLE PROFILE DATA CLUSTER ANALYSIS ANNEX A
Unweighted Weighted
No. % No. %
ACADEMIC EMPLOYMENT FUNCTIONClinical 110 7% 384 26%Non-clinical bio 568 38% 414 28%Other 800 54% 680 46%Total 1478 100% 1478 100%
GENDERMale 1078 73% 970 66%Female 392 27% 500 34%Total 1470 100% 1470 100%
ETHNIC GROUPWhite 1306 91% 1079 75%Non-white 133 9% 360 25%Total 1439 100% 1439 100%
GRADESenior 734 50% 455 31%Junior 734 50% 1013 69%Total 1468 100% 1468 100%
1.3 AnalysisIt should be noted that this was a self-completion survey and as such respondents were able to skip
questions. Only a very few questions, those which routed respondents depending on their answers,
were set as ’must answer’ questions. The result is that different numbers of respondents have
answered each question. The overall percentages presented for each question are based on all those
who answered the question. Where analysis by sub-group has been presented the percentages
presented have been based on those who answered the question and also answered the question(s)
on which the sub-group has been determined. So, for example, there are 1485 valid respondents but if
only 1480 answered a specific question, the overall results for that question will be based on 1480. If
only 1450 of those who answered this question also gave their grade, analysis for that question by
grade will be presented based on the 1450 who gave valid answers to both questions.

SAMPLE SIZE APPROXIMATE SAMPLING ERROR* APPLICABLE TO PERCENTAGES AT OR NEAR THESE LEVELS (+/-)
10% or 90% 20% or 80% 30% or 70% 40% or 60% 50%
1,500 1.5 2.0 2.3 2.5 2.51,000 1.9 2.5 2.8 3.0 3.1500 2.6 3.5 4.0 4.3 4.4
P E O P L E S C I E N C E & P O L I C Y 5
In the tables, ’-’ means no respondent gave the particular response, ’*’ indicates that more than none
but fewer than 0.5% gave the particular response.
The results presented in this report are based on a sample of the population, not on the entire
population of science and engineering researchers based in UK HEIs and are therefore subject to
sampling error, hence not all differences between sub-groups are statistically significant.
When looking at the percentage distribution for the whole sample it is 95% sure that the true
percentage who give each answer lies within three percentage points of the percentage shown. When
looking at data for a subsample, for example all males, the error will be increased because the sample
size is smaller. The table below gives an indication of the sampling error for sub-samples.
INTRODUCTION SAMPLE PROFILE DATA CLUSTER ANALYSIS ANNEX A
ACHIEVED SAMPLE SIZE SAMPLING ERROR*(+/-%)1,500 2.51,250 2.81,000 3.1750 3.6500 4.4250 6.2150 8.0100 9.850 13.9
*At 95% level of confidence, assuming proportion of people in the population being surveyed
who are expected to answer a certain way is 50%.
For questions where respondents are asked to answer yes or no (for example) the error will vary
depending on the percentage giving each answer. The table below show approximate sampling errors
for different distributions of answers.
*At 95% level of confidence.
The data has been weighted to correct for the distortions introduced by the sampling method and for
any disproportionate non-response, as shown above. This has the effect of reducing the effective
sample size for some sub-groups.
In interpreting the data presented, while consideration should be given to the statistical reliability,
attention should also be paid to the overall story and the trends that emerge. Sub-groups smaller
than 75 should not be be used to calcuate percentage distributions.
The main variables, with their unweighted sample sizes, against which analysis has been
conducted, are:

P E O P L E S C I E N C E & P O L I C Y 6
Current Post (Q26)
SENIOR
• Professor or above (Unweighted sample size 314)
• Reader/senior lecturer/researcher/fellow (Unweighted sample size 420)
JUNIOR
• Lecturer/researcher/fellow (Unweighted sample size 475)
• Junior/assistant researcher/fellow (Unweighted sample size 257)
• Technician/other support (Unweighted sample size 2)
Age group (Q35)
• Under 40 (Unweighted sample size 665)
• 40 and over (Unweighted sample size 780)
Discipline group (Q29)
• Clinical medical (Unweighted sample size 110)
• Non-clinical bioscience (Unweighted sample size 568)
• Other science and engineering (Unweighted sample size 800)
RAE score (Q31)
• 1-5 (Unweighted sample size 852)
• 5* (Unweighted sample size 419)
Gender (Q36)
• Male (Unweighted sample size 1078)
• Female (Unweighted sample size 392)
English first language (Q38)
• Yes (Unweighted sample size 1105)
• No (Unweighted sample size 366)
Research Status (28)
• Research Only (code 1) (Unweighted sample size 565)
• Research and teaching (code 2) (Unweighted sample size 852)
What training, if any, have you had in communicating science to the non-specialist public? Do not
include any teaching training you may have had. (Q19)
• No training (code 1) (Unweighted sample size 1096)
• Formal training (codes 2-6) (Unweighted sample size 332)
• Experience only excluded
Are the researchers in your department generally supportive towards
those who take part in activities that engage the non-specialist public in science? (Q24)
• Yes (codes 1&2) (Unweighted sample size 750)
• No (codes 3&4) (Unweighted sample size 347)
INTRODUCTION SAMPLE PROFILE DATA CLUSTER ANALYSIS ANNEX A

P E O P L E S C I E N C E & P O L I C Y 7
Do other members of your department take part in activities
that engage the non-specialist public in science? (Q23)
• Yes (codes 1&2) (Unweighted sample size 573)
• No (code 3& 4) (Unweighted sample size 656)
Would you like to spend more time, less time or about the same amount of time as you do now
engaging with the non-specialist public about science? (Q14)
• More time (code 1) (Unweighted sample size 695)
• About the same (code 2) (Unweighted sample size 627)
Only 28 people replied "less time" so this has not been used as a variable in analysis
How easy or difficult do you think it is to get involved
in science engagement activities for those who want to do so? (Q17)
• Easy (codes 1&2) (Unweighted sample size 603)
• Difficult (codes 3&4) (Unweighted sample size 573)
How well equipped do you personally feel you are to engage with the
non-specialist public about your research? (Q18)
• Well (codes 1&2) (Unweighted sample size 783)
• Not well (codes 3&4) (Unweighted sample size 645)
In relation to other things you have to do in your working life, how important
is it to you that you find time to engage with the non-specialist public? (Q13)
• Important (codes 3&4&5) (Unweighted sample size 695)
• Not Important (codes 1&2) (Unweighted sample size 785)
Do you think your work has implications for society
and/or policy-makers and regulators? (Q30)
• Yes (Unweighted sample size 1063)
• No (Unweighted sample size 227)
Thinking about public engagement with, and communication about, science, roughly how many
times in the past 12 months have you done each of the following? (Q7a-Q7k)
We devised a scoring system to enable us to assess the amount of public engagement activity any
individual researcher had undertaken in the last 12 months. On the basis of the scoring system we
constructed three groups: those who do no activity, those who do some and those who do a great
deal. This is based on responses to Q7 and only those who answered all of Q7 have been included,
except that Q7b (taking part in an institutional open day) was excluded from the scoring system. Those
classified as having done ’some’ activity reported doing between one and nine activities in the last 12
months. Those who were ’very active’ must have reported taking part in least ten activities in the last
12 months.
Don’t know and no reply responses have been excluded from the cross-breaks.
The questionnaire is appended at Annex A.
INTRODUCTION SAMPLE PROFILE DATA CLUSTER ANALYSIS ANNEX A

P E O P L E S C I E N C E & P O L I C Y 8
1.4 The reportSection 2 begins by setting out the sample profile for the weighted and unweighted data. Section 3
takes each question in turn it sets out the responses for all those who answered the question and
highlights any important differences between sub-groups. Not all of these differences are statistically
significant but there are repeated tendencies in the data for certain sub-groups and these have been
reported. The focus of analysis has been on exploring what would encourage researchers to become
more involved in public engagement activities.
INTRODUCTION SAMPLE PROFILE DATA CLUSTER ANALYSIS ANNEX A

UNWEIGHTED WEIGHTEDProfessor or above 314 185
21% 12%Reader/senior lecturer/ 420 270researcher/fellow 28% 18%Lecturer/ 475 663researcher/fellow 32% 45%Junior/assistant 257 348researcher/fellow 17% 24%Technician/ 2 2other support staff * *No reply 17 17
1% 1%
UNWEIGHTED WEIGHTEDUnder 15 years 758 973
51% 66%15 years and over 694 481
47% 32%No reply 33 31
2% 2%
UNWEIGHTED WEIGHTEDMale 1078 970
73% 65%Female 392 500
26% 34%No reply 15 15
1% 1%
P E O P L E S C I E N C E & P O L I C Y 9
2. SAMPLE PROFILE
This section sets out the overall profile of the sample for key characteristics showing both weighted
and unweighted sample sizes.
Q36 Are you-male or female?
INTRODUCTION SAMPLE PROFILE DATA CLUSTER ANALYSIS ANNEX A
Q35 What was your age last birthday?
UNWEIGHTED WEIGHTEDUnder 40 665 806
45% 54%40 and over 780 646
53% 44%No reply 40 33
3% 2%
Q34 To the nearest year, how long have you been working in scientific research, whether in academia or elsewhere?
Q26 Which of these best describes your current position?

P E O P L E S C I E N C E & P O L I C Y 10
INTRODUCTION SAMPLE PROFILE DATA CLUSTER ANALYSIS ANNEX A
Q27 Working StatusUNWEIGHTED WEIGHTED
Working full-time 1408 1384(>35 hours per week) 95% 93%
Working part-time 63 90(<35 hours per week) 4% 6%No reply 14 12
1% 1%
Q28 Which best describes your main role at your institution?UNWEIGHTED WEIGHTED
Research 565 744(including clinical research) 38% 50%
Research and teaching 852 67657% 46%
Teaching only 14 171% 1%
Clinical work only 5 13* 1%
Management/ 39 24administration 3% 2%
No reply 10 111% 1%
UNWEIGHTED WEIGHTEDClinical medicine 110 384(including dentistry) 7% 26%
Non-clinical bioscience 568 414(including medical, psychology, 38% 28%veterinary, agricultural)
Engineering/ 338 307engineering sciences 23% 21%(including IT)
Chemical/chemical 90 79engineering 6% 5%
Physics 144 123(including materials sciences) 10% 8%and astronomy
Mathematics 82 596% 4%
Environmental sciences 146 113
(including earth and 10% 8%marine sciences)
No reply 7 7* *
Q29 From the list below which discipline most closely describesyour current area of research interest?
NB the sample size for clinical researchers is quite small.
This should be borne in mind when interpreting the responses for this group.

P E O P L E S C I E N C E & P O L I C Y 11
INTRODUCTION SAMPLE PROFILE DATA CLUSTER ANALYSIS ANNEX A
Q31 What was the latest RAE score for your department/unit of assessment?
Q37 What is your ethnic origin?
UNWEIGHTED WEIGHTED1 1 1
* *2 7 3
* *3 67 56
5% 4%4 252 232
17% 16%5 525 444
35% 30%5* 419 448
28% 30%Don’t know 201 291
14% 20%No reply 13 10
1% 1%
UNWEIGHTED WEIGHTED
White - UK 960 78965% 53%
White - Europe 245 20216% 14%
White - US 26 202% 1%
White - Other 75 685% 5%
Black - African 2 5* *
Black - Caribbean 1 3* *
Black - UK 1 2* *
Black - US - -- -
Black - Other 2 5* *
Chinese 66 1544% 10%
Indian 19 471% 3%
Pakistani 8 281% 2%
Other Asian 20 881% 6%
Mixed race 14 291% 2%
No reply 46 463% 3%

P E O P L E S C I E N C E & P O L I C Y 12
INTRODUCTION SAMPLE PROFILE DATA CLUSTER ANALYSIS ANNEX A
Q38 Is English your first language?
Q39 Do you intend to work in the UK long term?
UNWEIGHTED WEIGHTEDYes 1105 1022
75% 69%No 366 449
25% 30%No reply 14 14
1% 1%
UNWEIGHTED WEIGHTEDYes 1199 1184
81% 80%No 51 62
3% 4%Don’t know 221 225
15% 15%No reply 14 14
1% 1%

P E O P L E S C I E N C E & P O L I C Y 13
3. DATA
Q1.Scientists are being asked to engage more with the non-specialist public.
What if anything, does this mean to you?
INTRODUCTION SAMPLE PROFILE DATA CLUSTER ANALYSIS ANNEX A
34%
15%
13%
13%
10%
10%
9%
7%
7%
6%
6%
5%
4%
4%
4%
10%
Informing, explaining, promoting understanding (public)
Implications, relevance, utility of research, value of science
Listening, understanding public, involving people in science,science-based debates, science-based decisions
Communicating with, or speaking to, the public, speaking in public, lectures, shows
Media work
Explaining the process of science, what is done, why, limitations
Talking to schools, inspiring young people
Good, worthwhile, important
Accountability, duty of public funded researchers
Disseminating research, research findings
Informing, stimulating, promoting understanding (other researchers,policy-makers, users)
PR (positive) raise profile, attract students, attract funding
Writing general books, articles
Additional call on time, waste of time
Counteracting poor media coverage, stereotypes
Other comment
This was a completely open ended question.
Senior researchers were more likely than junior researchers to think that
engaging with the non-specialist public meant:
• Implications, relevance, utility of research, value of science (18% v 14%)
• Communicating with or speaking to the public, speaking in public, lectures, shows (17% v 11%)
• Media work (14% v 9%)

P E O P L E S C I E N C E & P O L I C Y 14
Whereas, junior researchers and those under 40 were more likely than senior researchers or those
over 40 to think that engagement with the non-specialist public meant:
• ’Informing, explaining, promoting understanding to the public’
(36% V 30% - junior v senior and 38% v 28% - under 40 v over 40).
Those in departments with RAE scores of 1-5 were more likely to say that engaging with the non-
specialist public is ’Good, worthwhile, important’ compared to those in departments with a RAE score
of 5* (9% v 5%).
Clinical researchers were more likely than non-clinical bioscience or non-bioscience researchers to
agree that engaging with the non-specialist public is about:
• Listening, understanding public, involving people in science, science-based debates,
science-based decisions (22% v 10% v 10%)
• Explaining the process of science, what is done, why, limitations (18% v 9% v 6%)
Those with formal training are more likely than those with no formal training to think that engaging with
the non-specialist public means:
• Implications, relevance, utility of research, value of science (20% v 13%)
• Listening, understanding public, involving people in science, science-based debates, science-
based decisions (20% v 11%)
Respondents working in departments where others do not take part in public engagement were less
likely to think that engaging with the non-specialist public is about media work when compared to
those working in departments where others do take part (8% v 14%).
People who wanted to spend more time engaging with the non-specialist public were more likely than
those who did not want to spend more time to think that it was about:
• Communicating with or speaking to the public, speaking in public,
lectures, shows (16% v 11%)
• Talking to schools, inspiring young people (12% v 7%)
Those who felt that getting involved in public engagement activities was difficult were more likely to
think that engagement was about ’Informing, explaining, promoting understanding to the public’
compared to those who felt that getting involved was easy (36% v 31%)
The only significant difference between men and women was that men were more likely to see it as
about the ’Implications, relevance, utility of research, value of science’ (18% v 9%) respectively.
Those who felt they are not well equipped for public engagement felt that it was more likely to be about
’Listening, understanding public, involving people in science, science-based debates, science-based
decisions’ than those that felt that they were well equipped (16% v 11%) respectively.
INTRODUCTION SAMPLE PROFILE DATA CLUSTER ANALYSIS ANNEX A

P E O P L E S C I E N C E & P O L I C Y 15
Some differences were also apparent between those who only undertake research and those whose
work involves both research and teaching. Research only staff felt that engaging with the public was
about: Informing, explaining, promoting understanding (public) (37% v 30%), whereas, those who
research and teach were more likely to feel it was about:
Implications, relevance, utility of research, value of science (18% v 12%)
Communicating with or speaking to the public, speaking in public, lectures, shows (16% v 10%)
Media work (13% v 8%)
Those who felt their work had implications for society were more likely than those who did not feel their
work had implications to say that engaging with the public meant:
Listening, understanding public, involving people in science, science-based debates, science-based
decisions (15% v 5%)
Informing, explaining, promoting understanding (public) (36%v30)
Those who felt their work did not have implications were more likely to say that it meant ’Nothing, not
much, very little’ (10% v 3%)
When comparing those with English as their first language to those whose first language is not English
two main differences stand out. Those with English as there first language are more likely to say
engaging with the public is about:
Media work (12% v 7%)
Explaining the process of science, what is done, why, limitations (12% v 6%)
Those who felt public engagement was less important than other work when compared to those that
say it is as important or more important than other work are more likely to say that it is about:
Additional call on time, waste of time (7% v 1%)
Nothing, not much, very little (6% v *)
However, the most noticeable difference between these two groups is that those who think public
engagement is as important or more important than other work are much more likely to think that it is
about ’Informing, explaining, promoting understanding to the public’ (42% v 26%) respectively.
INTRODUCTION SAMPLE PROFILE DATA CLUSTER ANALYSIS ANNEX A

P E O P L E S C I E N C E & P O L I C Y 16
Q2.How important do you feel it is that you personally, in your current post,
directly engage with each of the following groups about your research?
INTRODUCTION SAMPLE PROFILE DATA CLUSTER ANALYSIS ANNEX A
Generaljournalists
Popular sciencejournalists
Others in themedia
Schools andschool teachers
Young peopleoutside school
Policy-makers Industry/businesscommunity
The non-specialistpublic
NGoverOrgan
Not important 1 2 3 4 Very important 5
For all the groups listed in the question a similar pattern emerges. More senior and older researchers,
those in departments rated 5 or below by the RAE, those who have teaching as well as research
responsibilities, those who think their work has social implications and those who are active engagers,
generally rate engagement with these groups as more important than their counterparts. In some
cases the difference is more clearly expressed as less negativity rather then greater positivism. With
respect to engaging with popular science journalists and the non-specialist public, the differences were
less marked but still present. Reaching policy-makers stands out as an activity generally more
positively regarded.
There are also indications that male researchers think communication is more important than do
women researchers.
The seniority finding is borne out by the qualitative research which found that young researchers keen
to climb the research career ladder were focused on research and publishing and/or felt that they
needed more experience before they could engage with those outside their research community.
Those who had received training in communication skills also said that communicating with the
majority of these groups was more important than those who had not had formal training but this may
be why they had sought training. Those who feel it is easy to get involved in engagement activities
also think it is more important to do so.
The impact of research disciplinary group varies between the groups listed with clinical researchers
focusing on communicating with general journalists, policy makers and the non-specialist public and
non-biological scientists focusing more on communicating with schools and industry.

P E O P L E S C I E N C E & P O L I C Y 17
Communicating with popular science journalists seems to be generally more positively viewed as the
groups who see communication as less important rate communication with this group as more
important than they rate communication with the other groups listed.
Industry is the group where the overall pattern described above is weakest. Some categories of
respondents who were less likely to say that communicating with any of these groups is important
tended to say that communicating with industry is important, most notably younger researchers, those
in RAE 5* rated departments and those without teaching responsibilities.
Q3.Which of these groups do you find it easiest to talk with about your research findings?
INTRODUCTION SAMPLE PROFILE DATA CLUSTER ANALYSIS ANNEX A
29%
23%22%
21%20%
17%16%
14%12%
10%9%
19%
0%
5%
10%
15%
20%
25%
30%
35%
40%
Industry/business comm
unity
Popular science journalists
Schools and school teachers
Young people in schools
The non-specialist public
Patients/patient groups
Press officers in your institution
Policy-makers
Young people outside school
General journalists
NGOs
Others in the m
edia
None/Don't know
29%
Policy makers easiest for:
• Senior rather than junior (25% v 12%)
• Older rather than younger (21% v 12%)
• Clinical rather than non-clinical bioscience and non-bioscience (23% v 13% v 14%)
• RAE 1 to 5 rather than 5* (20% v 12%)
• Those who think their work has implications for society (19% v 4%)

P E O P L E S C I E N C E & P O L I C Y 18
Industry/business community easiest for:
• Non-biosciences rather than clinical or non-clinical biosciences (43% v 16% v 19%)
• Men rather than women (35% v 19%)
Patient groups easiest for:
• Senior rather than junior (30% v 16%)
• Clinical rather than non-clinical bioscience and non-bioscience (55% v 18% v 3%)
• Those who think their work has implications for society (24% v 5%)
Q4.Why do you say that?
The main reason respondents found a particular group easiest to deal with was because they had not
dealt with any of the other groups (25%). However, ’they want to know’ (24%), ’we speak the same
language’ (21%) and ’my work is relevant to them’ (17%) were also popular reasons for groups being
regarded as easy to communicate with. The option ’my work is relevant to them’ was particularly cited
by clinical researchers (29%). Even the most active engagement group are mainly talking to groups
they feel are actively interested in their work and with whom they share a common language.
Q5.Which of these groups do you find it hardest to talk with about your research findings?
INTRODUCTION SAMPLE PROFILE DATA CLUSTER ANALYSIS ANNEX A
21%19%
15%12% 11% 10%
7% 6% 6% 5% 5% 4%
47%
0%
5%
10%
15%
20%
25%
30%
35%
40%
45%
50%
General journalists
Policy-makers
The non-specialist public
Industry/business comm
unity
Young people outside school
Others in the m
edia
Young people in schools
Popular science journalists
School teachers
Press officers in universities
Non-Governmental O
rganisations
Patients/patient groups
None/don't know
The main difference here was clinical researchers find it less difficult to talk to the non-specialist public
than those working in the non-clinical biosciences and outside the biosciences (6% v 15% v 19%).

P E O P L E S C I E N C E & P O L I C Y 19
Q6.Why do you say that?
The main reason given was that the respondent had no experience of the group in question (27%).
This was particularly true of junior and younger researchers (32% for both) compared to senior and
older researchers (19% and 21%).
Wariness of the press and ’they don’t understand me’ were the second and third most cited reasons for
finding particular groups difficult to communicate with (18% and 17%). A lack of interest among the
public was cited by 14%.
Senior researchers (26%) and men (21% v 11% of women) were more concerned about the press
’twisting’ what they had said.
The highly active group do not like talking to those they believe want to ’twist’ what they say or groups
they feel do not understand them.
Q7. Thinking about public engagement with, and communication about, science, roughly how may
times in the last 12 months have you done each of the following?
INTRODUCTION SAMPLE PROFILE DATA CLUSTER ANALYSIS ANNEX A
0% 10% 20% 30% 40% 50% 60% 70% 80% 90% 100%
Worked with teachers/schools
Participated in an institutionalopen day
Given a public lecture
Taken part in a public dialogueevent/debate
Been interviewed on radio
Been interviewed by anewspaper journalist
Written for the non-specialistpublic
Engaged with policy- makers
Engaged with Non-GovernmentalOrganisations
Worked with sciencecentres/museums
Judged competitions
None Once 2-3 times 4-5 times More than 5 times

P E O P L E S C I E N C E & P O L I C Y 20
26%
63%
11%
No activity or none except institutional open day
Some activity (between 1 and 9 activities in the previous 12 months)
High level of activity (at least 10 activities in the previous 12 months)
Amount of activity based on responses to Q7a and Q7c to Q7k
Male 66% 64% 65% 74%Female 34% 36% 35% 26%Senior staff 30% 14% 31% 65%Junior staff 70% 86% 69% 35%Aged under 40 56% 65% 58% 30%Aged 40 and over 44% 35% 42% 70%RAE score 1-5 62% 58% 61% 73%RAE score 5* 38% 42% 39% 27%Clinical 26% 19% 28% 31%Non-clinical bioscience 28% 38% 24% 23%Non-bioscience 46% 43% 47% 46%Have had PE training 25% 11% 28% 46%No PE training 75% 89% 72% 54%In department where others take part 46% 40% 47% 53%In department where others do not take part 54% 60% 53% 47%Find it easy to get involved in PE activities 45% 40% 43% 63%Find it difficult to get involved in PE activities 55% 60% 57% 37%Feel well equipped for PE activities 52% 36% 54% 78%Feel poorly equipped for PE activities 48% 64% 46% 22%PE activities as important as other activities 48% 29% 52% 71%PE activities less important than other activities 52% 71% 48% 29%Want to do more PE activities 53% 53% 54% 48%Want to do same amount of PE activities 47% 47% 46% 52%Research staff 53% 70% 50% 36%Research and teaching staff 47% 30% 50% 64%English first language 69% 68% 67% 81%English not first language 31% 32% 33% 19%Expect to stay in UK 80% 78% 80% 83%Do not expect to stay in UK 4% 5% 5% 3%Work has implications for society 71% 57% 73% 93%Work has no implications for society 15% 24% 13% 3%
INTRODUCTION SAMPLE PROFILE DATA CLUSTER ANALYSIS ANNEX A
LEVEL OF INVOLVEMENT WITH ACTIVITIESTO ENGAGE THE PUBLIC WITH SCIENCE
Totalsampleprofile
No activity(or onlyopen day)
Someactivity
Highactivity
NB numbers in the sample profile may not add to 100% because of missing answers or other
codes not included in this summary.Bases are weighted bases and vary between groups.

P E O P L E S C I E N C E & P O L I C Y 21
Q7.Main funding source of those who take part in different levels of public engagement activity
INTRODUCTION SAMPLE PROFILE DATA CLUSTER ANALYSIS ANNEX A
Wholly or principally funded by 39% 41% 39% 34%a Research Council
Wholly or principally funded by 7% 2% 8% 15%a Government Department
Wholly or principally funded by a Higher 5% 6% 5% 4%Education Funding Council
Wholly or principally funded by an 7% 10% 6% 8%EU research grant
Wholly or principally funded by 8% 12% 7% 5%The Wellcome Trust
Wholly or principally funded by 1% 1% 1% -the Royal Society
Wholly or principally funded by 16% 12% 17% 18%another charity
Wholly or principally funded by industry 11% 11% 12% 8%
Other sources of funding 5% 4% 6% 9%
LEVEL OF INVOLVEMENT WITH ACTIVITIESTO ENGAGE THE PUBLIC WITH SCIENCE
Funding source
Analysis by individual Research Council in this sample is not possible because of the sample sizes.
INSTRUCTION TO RESPONDENTS IN THE QUESTIONNAIRE:For the remainder of the questionnaire, we will be talking about communication and engagement with the non-specialist public only. By this we mean adults with no specialist knowledge of, or training in, science
No activity(or onlyopen day)
Someactivity
Highactivity
Totalsampleprofile

P E O P L E S C I E N C E & P O L I C Y 22
INTRODUCTION SAMPLE PROFILE DATA CLUSTER ANALYSIS ANNEX A
Q8.How important do you think it is that you personally, in your current post, engage directly with the non-specialist adult public on each of the following?
0%
10%
20%
30%
40%
50%
60%
70%
80%
90%
100%
Thescientific
findings ofyour
research
Areas forfurther
research
Policy andregulatory
issues
Wider socialand ethical
implicationsof your
researchfindings for
society
Thepotential
benefits ofyour work toindividuals
Thescientific
process/thenature ofscience
Scientificuncertainty
Theenjoyment
andexcitement
of doingscience
Therelevance ofscience to
everyday life
To raiseawarenessof careeroptions inscience
Not important 1 2 3 4 Very important 5
There is a slight tendency for more senior researchers to say that it is more important to engage on all
these aspects.
The main drivers of opinion for this set of attitudes are disciplinary group and whether or not the
respondent thinks that their work has implications for society. With respect to disciplinary group there
tends to be a trend with clinical researchers being most likely to think that engagement on most of the
topics listed is important and non-bioscience researchers least likely to think public engagement on
these topics is important, with non-clinical bioscience researchers falling in between.

P E O P L E S C I E N C E & P O L I C Y 23
Q8.Importance of engagement with the public for different groups
INTRODUCTION SAMPLE PROFILE DATA CLUSTER ANALYSIS ANNEX A
RESPONDENTS GIVING A SCORE OF 4 OR 5 TO ENGAGEMENT WITH THE PUBLIC INEACH CATEGORY (WHERE 1 IS NOT IMPORTANT AND 5 IS VERY IMPORTANT)
Total giving ascore of 4 or 5
Clinical researchersgiving a score of 4 or 5
Those who think their workhas implications for societygiving a score of 4 or 5
The scientific findings 563 175 447of your research 38% 46% 43%Areas for further research 527 170 403
36% 44% 38%Policy and regulatory issues 463 153 378
32% 40% 37%
The wider social and 731 236 619ethical implications of your 49% 62% 59%research findings for society
The potential benefits of 874 291 696your work to individuals 60% 76% 67%The scientific process/the 680 173 498nature of science 46% 45% 48%Scientific uncertainty 665 212 503
45% 56% 48%The enjoyment and 861 205 621excitement of doing science 59% 54% 59%The relevance of science 949 246 695to everyday life 64% 64% 66%To raise awareness of career 694 156 492options in science 47% 40% 47%
With respect to the other groups clinical researchers see public engagement on:
• scientific findings (46% scoring this 4 or 5)
• further research (44% scoring this 4 or 5)
• policy and regulation (40% scoring this 4 or 5)
• the social and ethical implications of their research (62% scoring this 4 or 5)
• the potential benefits to individuals (76% scoring this 4 or 5)
• scientific uncertainty
(56% v 37% of non-bioscience respondents scoring this 4 or 5)
as particularly important.
Where the non-bioscience group really stand out is on the importance they attach to:
• conveying the enjoyment and excitement of science (62% scored this 4 or 5)
• the importance of raising awareness of career opportunities
(52% scored this 4 or 5).
However, non-bioscience researchers also attach some importance to engaging the public
on the potential benefits to individuals (51% scoring this 4 or 5), which, while lower than the
scores given by the other two disciplinary groups to this topic, is higher than the scores they
give to many of the other issues listed in this question.

P E O P L E S C I E N C E & P O L I C Y 24
Q9. Looking at the list below, what do you think is the main reason for scientists and engineers to engage with the non-specialist public?
INTRODUCTION SAMPLE PROFILE DATA CLUSTER ANALYSIS ANNEX A
35%
12%
11%
11%
10%
8%
5%
0% 5% 10% 15% 20% 25% 30% 35% 40%
To ensure the public is better informedabout science and technology
To raise aw areness ofscience generally
To raise aw areness aboutyour subject
To contribute to publicdebates about science and
scientif ic issues
To be accountable for theuse of public funds
To generate/stimulateadditional funds for
universities and colleges
To contribute to discussionsabout the social and ethical
issues science can raise
To recruit students to your subject 4%
There are no differences of note between the various sub-groups.
Q10. Looking at the list below, what do you think is the second most important reason for scientists
and engineers generally to engage with the non-specialist public?
Unweighted base 1413Weighted base 1428
To ensure the public is better informed about science and technology 24817%
To contribute to public debates about science and scientific issues 22015%
To be accountable for the use of public funds 21015%
To raise awareness of science generally 19714%
To raise awareness about your subject 18813%
To generate/stimulate additional funds for universities and colleges 1339%
To contribute to discussions about the social and ethical issues science can raise 1309%
To recruit students to your subject 846%

P E O P L E S C I E N C E & P O L I C Y 25
Q11. Looking at the list below, what do you think is the main drawback to scientists and engineersgenerally engaging with the non-specialist public?
INTRODUCTION SAMPLE PROFILE DATA CLUSTER ANALYSIS ANNEX A
29%
27%
19%
10%
3%
3%
0% 5% 10% 15% 20% 25% 30% 35%
It takes up time that is betterused on research
There are no draw backs toengaging w ith any of these groups
It can send out thew rong messages
It makes them a target
It takes up time that isbetter used on other,
non-research, activities
Most scientists are bad atIt / misrepresentation
Non-bioscience researchers are more likely to see the main draw back as the time it takes away from
research (35%) whereas clinical researchers are equally concerned about the time it takes away from
research (25%) as they are about sending out the wrong messages (25%). Only 4% of non-bioscience
researchers expressed concern about becoming a target.
Q12. Looking at the list below, what do you think is the second main drawback to scientists and
engineers generally engaging with the non-specialist public?
Unweighted base 893Weighted base 938
There are no drawbacks to engaging with any of these groups 21523%
It takes up time that is better used on research 15016%
It can send out the wrong messages 14716%
It takes up time that is better used on other, non-research, activities 13214%
It makes them a target 12714%
It diverts money from research projects 647%

P E O P L E S C I E N C E & P O L I C Y 26
INTRODUCTION SAMPLE PROFILE DATA CLUSTER ANALYSIS ANNEX A
10%
42%
21%
19%
9%
Not at all important Not very important Equally important
Fairly important Very important
Senior and older researchers (35% and 31%) are more likely than junior and younger researchers
(24% and 23%) to say that engaging with the non-specialist public is very or fairly important. Again,
clinical researchers (35%) and those who think their work has implications for society (31%) are more
likely to say that engaging with the non-specialist public is very or fairly important.
Q14. Would you like to spend more time, less time, or about the same amount of time as you do
now engaging with the non-specialist public about science?
45%
41%
3%
11%
I would like to spend more time I am content with the time I spend on thisI would like to spend less time Don't know

P E O P L E S C I E N C E & P O L I C Y 27
Non-clinical bioscience and non-bioscience researchers are more likely than clinical researchers to say
that they would like to spend more time engaging with the non-specialist public about science (50% v
46% v 39%) but they are currently more likely to be inactive than clinical researchers (19% of clinical
researchers said they had done no engagement activities in the previous 12 months (apart from
possibly taking part in an open day) compared to 35% of non-clinical bioscience researchers and 24%
of non-bioscience researchers).
55% of those who said they thought it was difficult to get involved in public engagement activities said
that they would like to spend more time on it but those who felt ill equipped were less likely to say that
they wanted to spend more time on public engagement (41%).
Language issues do not appear to be important, at least for respondents, because 40% of those
who said that English is not their first language also said that they would like to spend more time on
public engagement. However, those whose English is weaker may have been less likely to respond
to the survey.
Q15. Why do you say that?
INTRODUCTION SAMPLE PROFILE DATA CLUSTER ANALYSIS ANNEX A
Overwhelmingly, those who want to spend more time on public engagement said that they wanted to
do so because scientists and engineers should engage more with the community and no sub-group
stands out from this trend.
The main points to note are:
• Clinical researchers are more likely to want to engage because they feel their work is topical or
controversial (36% and 19% of clinical researchers gave these two responses respectively
• Non-bioscience researchers were more likely to say scientists and engineers should engage
more with the community compared to clinical and non-clinical bioscientists
• Those with teaching responsibilities are conscious of the need to recruit students and 18%
of those with teaching responsibilities gave student recruitment as a reason for engagement
compared with 11% of those without teaching responsibilities.
66%
28%
14% 13%10%
0%
10%
20%
30%
40%
50%
60%
70%
80%
Scientists and engineers should engage more with
the community
I work in a topical area of science
There is a need to recruit more
students
Scientists and engineers need to
be more accountable
I work in a controversial area
of science

P E O P L E S C I E N C E & P O L I C Y 28
Q16. Below are some things that people have said about engaging with the non-specialist public about science and engineering. Please indicate whether you agree or disagree with each statement.
INTRODUCTION SAMPLE PROFILE DATA CLUSTER ANALYSIS ANNEX A
0% 10% 20% 30% 40% 50% 60% 70% 80% 90% 100%
Scientists who communicate a lo tare not well regarded by other scientists
Engaging with the non-specialistpublic might help researchers make
new contacts for their research
Funders of scientific researchshould help scientists to communicate
with the non-specialist public
Scientists have a moral duty toengage with the non-specialist public
about the social and ethicalimplications of their research
I don't think my research isinteresting to the
non-specialist public
The main reason to engage with thenon-specialist public is to get their
support for science and engineering
I simply don't have time to engagewith the non-specialist public
I would not want to be forced to takea public stance on the issues raised
by my research
Engagement with the non-specialistpublic is best done by trainedprofessionals and journalists
Engaging the non-specialist public inscience is personally rewarding
M y research is too specialised tomake much sense to the
non-specialist public
I would need help to develop ascience engagement pro ject
I would be happy to take part in ascience engagement activity thatwas organised by someone else
Public engagement couldhelp withmy career
Engaging with the non-specialistpublic is best done by senior researchers
There are no personal benefits forme in engaging with the non-specialist public
Strongly Agree Agree Neither Disagree Strongly Disagree Don't know

P E O P L E S C I E N C E & P O L I C Y 29
Points worthy of note about the statements listed above are:
Junior researchers were more likely than senior researchers to agree that:
Engaging the non-specialist public might help researchers
make new contacts for their research (57% v 44%)
My research is too specialised to make much sense to the non-specialist public (23% v 17%)
Pubic engagement could help with my career (42% v 28%)
Engaging with the non-specialist public is best done by senior researchers (26% v 18%)
And less likely to agree that:
• There are no personal benefits for me in engaging with the non-specialist public (18% v 25%)
Clinical researchers were more likely than non-clinical bioscience or non-bioscience researchers to
agree that:
Engaging the non-specialist public might help researchers
make new contacts for their research (61% v 50% v 51%)
Scientists have a moral duty to engage with the public about
the social and ethical implications of their research (77% v 71% v 65%)
And less likely to agree that:
• I don’t think my work is interesting to the non-specialist public (12% v 15% v 21%)
• My research is too specialised to make much sense to the non-specialist public (13% v 19% of
non-clinical bioscientists and 27% of non-bioscientists)
Non-bioscience researchers stand out particularly in their lower level of agreement with the statement
’engaging with the non-specialist public is best done by senior researchers’ (18% v 28% of clinical and
27% of non-clinical bioscience researchers).
Women were more likely than men to agree that:
Engaging the non-specialist public might help researchers
make new contacts for their research (59% v 51%)
Scientists have a moral duty to engage with the public about
the social and ethical implications of their research (74% v 68%)
I would not want to be forced to take a public stance on
the issues raised by my research (39% v 26%)
INTRODUCTION SAMPLE PROFILE DATA CLUSTER ANALYSIS ANNEX A
1 Figures given as agree in the text here refer to those who
said agree strongly and agree and figures given for disagree
refer to those who said disagree strongly and disagree.

P E O P L E S C I E N C E & P O L I C Y 30
Research only staff were more likely than those with teaching responsibilities to agree that:
• ’Engaging the non-specialist public might help researchers make new contacts for their research’
(59% v 47%)
• ’I would not want to be forced to take a public stance on
the issues raise by my research’ (35% v 26%)
• ’Engaging with the non-specialist public is best done by senior researcher’ (27% v 20%)
Those who thought that their research has implications for society were less likely than those who
think that their work does not have implications for society to agree that:
• ’I don’t think my research is interesting to the non-specialist public’ (13% v 39%)
• ’My research is too specialised to make much sense
to the non-specialist public’ (14% v 44%)
• ’There are no personal benefits for me in engaging with
the non-specialist public’ (18% v 25%)
And are more likely to agree that:
• ’Engaging the non-specialist public in science is personally rewarding’ (69% v 50%)
• ’I would be happy to take part in a science engagement activity that was organised by someone
else’ (71% v 58%)
• ’Engaging the non-specialist public in science might help researchers make new contacts for
their research’ (58% v 35%)
• ’Scientists have a moral duty to engage with the public about the social and ethical implications
of their research’ (73% v 61%)
Those who do not feel well equipped are more likely to think that engagement with the non-specialist
public is best done by trained professionals (44% v 27%). This group is also more likely to say that
their research is too specialised to make sense to the non-specialist public (29% v 14%), that they
would need help to develop a science engagement project (66% v 53%) and that they do not want
to be forced to take a public stance on the issues raised by their research (36% v 26%). By contrast,
those who feel well equipped are more likely to see engagement as personally rewarding
(75% v 52%).
INTRODUCTION SAMPLE PROFILE DATA CLUSTER ANALYSIS ANNEX A

P E O P L E S C I E N C E & P O L I C Y 31
Q17.How easy or difficult do you think it is to get involved in
science engagement activities for those who want to do so?
INTRODUCTION SAMPLE PROFILE DATA CLUSTER ANALYSIS ANNEX A
4%
31%
35%
6%
24%
Very easy Fairly easy Fairly difficult Very difficult Don't know/can't say
Those who said they thought it was easy or very easy to get involved were:
• Senior researchers rather than junior researchers (44% v 30%)
• Those who felt well equipped for communication (46% v 23%)
• Men rather than women (37% v 30%)
• Those with teaching responsibilities rather than
those only doing research (37% v 31%)
On the other hand:
• Clinical researchers found it more difficult to get involved (27% said it was easy or very easy
compared to 49% who said it was very or fairly difficult). However, this may be a reflection of their
availability for such activities rather than their ability, taking their other answers into account.

P E O P L E S C I E N C E & P O L I C Y 32
Q18. How well equipped do you personally feel you are to
engage with the non-specialist public about your research?
INTRODUCTION SAMPLE PROFILE DATA CLUSTER ANALYSIS ANNEX A
Those who felt very or fairly well equipped to engage with the public were:
• Senior rather than junior (64% v 45%)
• Clinical researchers rather than non-clinical bioscientists
or non-bioscientists (64% v 48% v 45%)
• Those who have received some formal training rather than those who have not (61% v 46%)
• Those who find it easy to get involved rather than those who do not (66% v 45%)
• Those who think their work has implications for society
rather than those who do not (56% v 40%)
• Those with teaching responsibilities feel perhaps less well equipped
when compared to those without this responsibility than might be thought,
given some of their other answers (52% v 49%)
While women are no more likely than men to say that they feel very well equipped, men are more
likely to say that they feel fairly well equipped (45% v 39%).

P E O P L E S C I E N C E & P O L I C Y 33
INTRODUCTION SAMPLE PROFILE DATA CLUSTER ANALYSIS ANNEX A
Q19. What training, if any, have you had in communicating science to the non-specialist public? Donot include any teaching training you may have had.
73%
14% 11% 10%
4% 3% 3%
0%
10%
20%
30%
40%
50%
60%
70%
80%
None Being interview ed by journalists
Speaking to the public
Writing for the public
Speaking to school children
Understanding the school system
Other Informal training/experience
The only point of note here is the relatively high proportion of clinical researchers who have had media
training on being interviewed by journalists 23% v 15% of non-clinical bioscientists and 8% of non-
bioscience researchers. This really accounts for the difference in the percentage of each group saying
they have had no training of any kind (63%, 76%, 77% respectively).
Q20. What would encourage you personally to get involved in activities
that engage the non-specialist public in science?
36%
15%
11%
10%
10%
8%
6%
5%
5%
0% 5% 10% 15% 20% 25% 30% 35% 40%
Public EngagementInfrastructure
Recognition
Skills and training
If it was part of my job
Time (General)
Interested educated public
Institutional support
Public Engagement Funding
More support from my headof department

P E O P L E S C I E N C E & P O L I C Y 34
Public engagement infrastructure includes responses coded as:
If it was easier to organise such activities/if someone else initiated it/if it was offered to me/if other
people got involved too/better links to relevant groups/contacts/framework/if there was an area I felt I
could contribute in/if I could see the benefit/positive feedback/a strategy or plan.
Recognition includes responses coded as:
If it was part of getting professional status/if it helped with my own career/if it was part of the RAE
exercise/if it wasn’t viewed as inferior to other work/if other people weren’t against it/if it wasn’t
detrimental to my career.
Skills and training includes responses coded as:
If I had some (more) training/skills not good.
If it was part of my job include responses coded as:
If I was relieved of other work/if it brought money into the department/having a more permanent
position/job security/if it was part of my job.
Time (general) is a stand alone response.
Interested educated public includes responses coded as:
If people were more interested in my work/a better educated public/recruiting more students.
Institutional support includes responses coded as:
Support (other than from head of department)/more backroom support or infrastructure/longer term
funding — more free time/better funding.
Public engagement funding includes responses coded as:
If engagement grants covered staff time as well as costs/financial reward (unspecified).
More support from my head of department is a stand alone response.
Removing the RAE is not included as only 5 respondents cited this as something that would
encourage them to engage.
This was presented as an open-ended question and subsequently coded. Q21 gave respondents a list
of options which might motivate researchers to get involved in engagement activities and asked them
to tick those they felt might encourage them to do so. Because this was a self-completion
questionnaire it is possible that respondents looked at the list before answering this open ended
question.
The main option which would encourage all groups to engage with the public is to develop an
infrastructure for public engagement activities (36%). Within this overall picture there are a few
nuances set out below and an indication that recognition is important at the margins.
INTRODUCTION SAMPLE PROFILE DATA CLUSTER ANALYSIS ANNEX A

P E O P L E S C I E N C E & P O L I C Y 35
Clinical Researchers
Clinical researchers are more likely to be encouraged by improved public engagement infrastructure
than non-clinical bioscientists and non-bioscientists (44% v 35% v 33%).
RAE Score
Those in departments with an RAE Score of 5* compared to those in lower rated departments said
they would be more likely to take part in public engagement if the public were more interested (11% v
5%). Those in departments with a RAE score of 1-5 compared to those in 5* rated departments said
they would be more likely to engage if they had more time (13% v 6%) or if they felt it was part of their
job (15% v 7%).
Easy to engage
In comparison with those who felt it was difficult to engage, those who felt it was easy were much
more likely to say that they would be encouraged by more time (15% v 7%), in contrast to this,
those that felt it was difficult to engage would be encouraged by public engagement infrastructure
(46% v 31%) and by having the right skills and training (14% v 8%).
Women
A much higher proportion of women (20%) compared to men (7%) said that they would be more
encouraged if they had more skills and training.
Work has implications for society
Those who felt that their work has no implications for society were more likely to say that nothing
would encourage them to get involved (8% compared to 1%).
Research and teacing
Those involved in teaching were more likely than those only doing research to believe that time (14% v
5%) would encourage them to engage. Those in research only posts were more encouraged by skills
and training (14% v 9%) and public engagement infrastructure (40% v 32%).
INTRODUCTION SAMPLE PROFILE DATA CLUSTER ANALYSIS ANNEX A

P E O P L E S C I E N C E & P O L I C Y 36
Q21.To what extent would you personally be encouraged to get more involved in activities toengage the non-specialist public in science and engineering by each of the following?
INTRODUCTION SAMPLE PROFILE DATA CLUSTER ANALYSIS ANNEX A
0% 10% 20% 30% 40% 50% 60% 70% 80% 90% 100%
If my head of department/linemanager were to give me more
support and encouragement
If there were awards and prizes forme as an individual
If it was part of gettingprofessional status
If it helped with my own career
If I was relieved of other work
If the RAE exercise was changedto encompass communicationwith the non-specialist public
If my department or institutionwas recognised by an
award or prize
If it brought money intomy department
If it was easier for me to get fundsfor engagement activities
If grants for engagement coveredstaff time as well as other costs
If it was easier toorganise such activities
If I had some (more) training
A great deal To some extent Not very much Not at all Don't know
Support from head of department is more important for junior staff (73% said ’a great deal’ or ’to some
extent’) but relatively unimportant for those who do not think their work has implications for society
(19% of this group said this would not encourage them at all).
Making public engagement count towards professional status is more influential for junior rather than
senior researchers (64% v 48%) and younger rather than older staff (65% v 52% said this would
influence them a great deal or to some extent). This idea is less influential in the non-biosciences
(54% said this would influence them a great deal or to some extent) and marginally less important to
those in RAE 5* rated departments (55%). It has less impact on those who do not think their work has
social implications, only 11% said it would influence them a great deal, and on those with teaching
responsibilities (only 12% said it would influence them a great deal).

P E O P L E S C I E N C E & P O L I C Y 37
INTRODUCTION SAMPLE PROFILE DATA CLUSTER ANALYSIS ANNEX A
Those who would be more likely to be encouraged if it helped their career are:
• Junior rather than senior researchers
(83% v 64% said this would influence them a great deal or to some extent)
• Younger rather than older researchers
(86% v 66% said this would influence them a great deal or to some extent)
• Women rather than men
(81% v 74% said this would influence them a great deal or to some extent)
Being relieved of other work seems to influence:
• Men more than women
(64% v 58% said this would influence them a great deal or to some extent)
• Those with teaching responsibilities more than those without
(71% v 52% said this would influence them a great deal or to some extent)
Changing the RAE to encompass communication with the non-specialist public would influence:
• Senior staff more than junior
(71% v 58% said this would influence them a great deal or to some extent)
• Those in departments rated 5 or below by the RAE more than those in 5* rated departments
(70% v 59% said this would influence them a great deal or to some extent)
• Those who think their work has implications for society more than those who do not (65% v 53%
said this would influence them a great deal or to some extent)
• Women more than men
(66% v 59% said this would influence them a great deal or to some extent)
• Those with teaching responsibilities more than those without (70% v 54% said this would
influence them a great deal or to some extent)
Recognising the researcher’s department with an award would influence:
• Clinical researchers more than others
(62% said this would influence them a great deal or to some extent)
• Those in departments rated 5 or below by the RAE rather than those in 5* rated departments
(59% v 52%) said this would influence them a great deal or to some extent
• Women (61% v 55% of men) said this would influence them a great deal or to some extent
But those who do not believe their research has implications for society would be very unmoved by
this option, with 24% of them saying this would not influence them at all.
Bringing money into their department is particularly important for:
• Clinical researchers, 47% say this would influence them a great deal
• Those who have had formal training, 41% say it would influence them a great deal

P E O P L E S C I E N C E & P O L I C Y 38
Again, those who do not think their research has implications for society are hardest to influence, 30%
saying that they would not be influenced very much or at all.
If it was easier to get funds for engagement activities is a potentially strong motivator for all groups.
However, those who do not think their research has implications for society would not be influenced
very much or at all by this idea, 39% v 19% of those who think their research has implications for
society.
If grants covered staff time as well as other costs is also a potentially strong motivator for all groups.
But again, those who do not think their research has implications for society are hardest to influence,
30% saying that they would not be influenced very much or at all by this proposition.
Training would influence:
• Junior staff rather than senior staff (25% v 16% a great deal)
Æ • Younger researchers rather than senior researchers (25% v 19% a great deal)
• Non-bioscience researchers least (18% a great deal)
Æ • Women rather than men (33% v 17% a great deal)
• Those without teaching responsibilities rather than those with
(74% v 62% a great deal or to some extent)
• Those who find it difficult to get involved in public engagement activities rather than those who
find it easy (27% v 13% a great deal)
• Those who do not feel well equipped for public engagement to a greater extent than those who
feel equipped (28% v 17% a great deal)
If it was easier to organise such activities would help
• Those who find it difficult to get involved (32% a great deal)
But would still not have much impact on those who do not think their work has implications for society
(19% of this group said a great deal)
Analysis by level of activity reveals that neither those who are not currently active in public
engagement, nor those who currently do some engagement nor those who are currently highly active
would be motivated to do more by the instigation of personal awards. Only 36%, 41% and 35%
respectively would be motivated a great deal or to some extent by such awards. Departmental awards
are slightly more popular but are nowhere near the most effective motivators (52%, 59% and 62%
respectively).
The inactive and less active groups would be strongly motivated by things that helped their career
(78% of both groups would be greatly or to some extent encouraged). The most active group is less
motivated by this (70% would be greatly or to some extent encouraged), although it is still quite a
strong motivating factor.
INTRODUCTION SAMPLE PROFILE DATA CLUSTER ANALYSIS ANNEX A

P E O P L E S C I E N C E & P O L I C Y 39
All three groups are motivated by bringing money in to their department - 75% of the inactive group,
83% of the less active group and 86% of the highly active group would be motivated a great deal or to
some extent by this.
Training would help the inactive and the less active groups (68% and 72% respectively would be
encouraged a great deal or to some extent).
Both those who do some activities and those who are highly active would be encouraged to do more if
grants covered staff time (82% and 92% respectively), it was easier to get funds (77% and 85%
respectively) and if it was easier to organise such activities (77% and 78% respectively).
Q22. What is stopping you from getting (more) involved in activities that
engage the non-specialist public in science?
INTRODUCTION SAMPLE PROFILE DATA CLUSTER ANALYSIS ANNEX A
64%
43%
34%
24%
23%
22%
18%
16%
13%
9%
8%
6%
4%
3%
3%
0% 10% 20% 30% 40% 50% 60% 70% 80%
I need to spend more time on my research
need to spend more time getting funding for my research
I w ould have to do it in my ow n time
I need to spend more time on administration
I need to spend more time teaching
I am too junior
There is not enough funding
There is no senior level support
English is not my f irst language
I am already involved enough
I am only in the UK for a limited period
I just don't w ant to
Lack of opportunity/I don’t know how
Peer pressure
I feel that I am encroaching on Press Off ice w ork
Funding pressures are keenest for men rather than women (46% v 37% said they needed to spend
more time finding funding for their research) and for those in departments rated 5 or below by the RAE
(52% v 44% said they needed to spend more time finding funding for their research).
Time spent teaching was a particular barrier for those in departments rated 5 or below (31% v 21% of
those in 5* rated departments gave this as a reason for not getting (more) involved). This group was
also slightly more concerned about administration (29% v 24%).

P E O P L E S C I E N C E & P O L I C Y 40
Q22. Barriers to engagement, analysed by current level of involvement in activities to engage the non-specialist public with science
INTRODUCTION SAMPLE PROFILE DATA CLUSTER ANALYSIS ANNEX A
Unweighted 1382 317 865 200Weighted 1387 360 871 1 I need to spend more time on my research 901 239 572 90funding for my research 64% 66% 66% 58%I need to spend more time getting 603 123 415 65
43% 34% 48% 41%I would have to do it in my own time 467 105 313 48
34% 29% 36% 31%I need to spend more time on administration 331 69 222 40
24% 19% 25% 26%I need to spend more time teaching 325 59 235 32
23% 16% 27% 20%I am too junior 301 106 190 5
22% 30% 22% 3%There is not enough funding 238 41 155 42
18% 11% 18% 27%There is no senior level support 228 59 143 26
16% 16% 16% 17%English is not my first language 190 60 121 9
13% 17% 14% 6%I am already involved enough 127 7 68 52
9% 2% 8% 33%I am only in the UK for a limited period 116 26 83 7
8% 7% 10% 5%I just don’t want to 80 35 45 -
6% 10% 5% -Lack of opportunity/I don’t know how 61 21 36 6
4% 6% 4% 3%Other 53 13 37 3
4% 4% 4% 2%Peer pressure 41 5 33 4
3% 1% 4% 3%I feel I am encroaching on Press Office work 37 13 24 -
3% 4% 3% -
CURRENT LEVEL OF INVOLVEMENT INACTIVITIES THAT ENGAGE THE NON-SPECIALIST PUBLIC WITH SCIENCE
Total No activity(or onlyopen day)
Someactivity
High level of activity
The table above highlights that the main pressures against doing more public engagement work come
from research activities and that the same pressures affect those who are involved and those who are
not. We can also see reflected the concern from some respondents that they are too junior to spend
more time on activities to engage the public. Peer pressure against getting involved is only cited by
very few respondents.

P E O P L E S C I E N C E & P O L I C Y 41
Q23. Do other members of your department take part in activities that engage the non-specialist public in science?
INTRODUCTION SAMPLE PROFILE DATA CLUSTER ANALYSIS ANNEX A
3%
33%
35%
8%
20%
Yes, most of them Yes, some of them Yes, one or two of them
None of them Don't know
The most striking points about this question are that clinical researchers have the most active and the
least active departments and those who say that getting involved is easy are more likely to work in
departments where others are active in engagement activities.
Q24. Are the researchers in your department generally supportive towards those who take part in
activities to engage the non-specialist public in science?
12%
38%
18%
2%
30%
Yes, very supportive Yes, fairly supportive Not particularly supportive
Not at all supportive Don't know
P E O P L E S C I E N C E & P O L I C Y 42
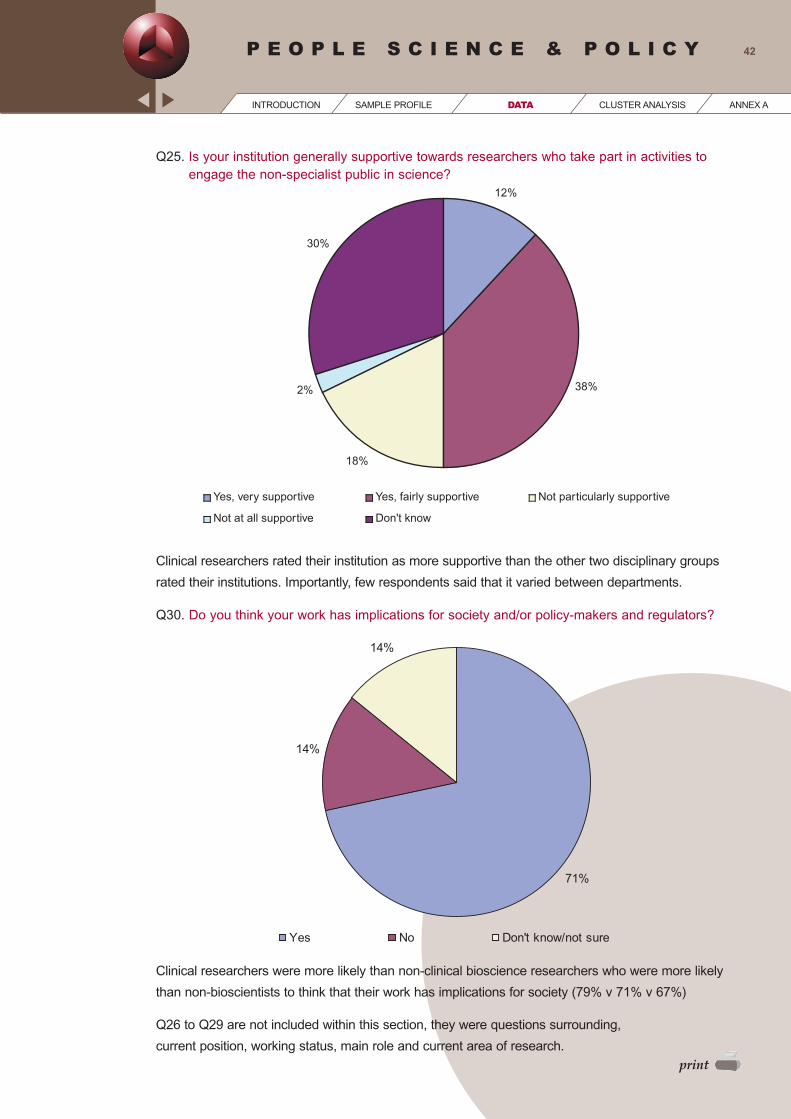
Q25. Is your institution generally supportive towards researchers who take part in activities toengage the non-specialist public in science?
INTRODUCTION SAMPLE PROFILE DATA CLUSTER ANALYSIS ANNEX A
12%
38%
18%
2%
30%
Yes, very supportive Yes, fairly supportive Not particularly supportive
Not at all supportive Don't know
Clinical researchers rated their institution as more supportive than the other two disciplinary groups
rated their institutions. Importantly, few respondents said that it varied between departments.
71%
14%
14%
Yes No Don't know/not sure
Clinical researchers were more likely than non-clinical bioscience researchers who were more likely
than non-bioscientists to think that their work has implications for society (79% v 71% v 67%)
Q26 to Q29 are not included within this section, they were questions surrounding,
current position, working status, main role and current area of research.
Q30. Do you think your work has implications for society and/or policy-makers and regulators?
P E O P L E S C I E N C E & P O L I C Y 43
4. CLUSTER ANALYSIS
Using Q16 we ran a factor and cluster analysis to see whether there are distinct attitudinal groups
within the overall sample. The cluster analysis identified two groups, the main difference being the
extent to which respondents felt that their research was interesting to the non-specialist public and the
extent to which they felt that their research is too specialized to make much sense to the non-specialist
public. However, the distinction was small and it was decided that dividing the sample into these two
groups for further analysis was not worthwhile.
The sample is likely to be fairly homogeneous - these are all research scientists and engineers based
in UK HEIs. The total size of the group is only some 60,000 individuals.
INTRODUCTION SAMPLE PROFILE DATA CLUSTER ANALYSIS ANNEX A

P E O P L E S C I E N C E & P O L I C Y 44
ANNEX A QUESTIONNAIRE
Factors affecting science communication:a survey of scientists and engineers
There are increasing calls for scientists and engineers to engage with the public and to discuss their
research with those outside their field. The Royal Society, the Wellcome Trust and the Research
Councils want to know what you think about this. Is this a good use of your time? If so, how can you
be supported? If not, it is still important that your views are heard because they will impact on policy
decisions.
Towards the end of the questionnaire you will be asked some questions about yourself so that we can
compare the results for different groups.
You have been selected using robust sampling procedures and it is important that you personally reply.
Your replies will be treated in the strictest confidence. Nothing any individual says will be attributed in
the final report or passed on to the funders or anyone else. People Science & Policy Ltd has been
appointed to undertake this survey by the funders.
INTRODUCTION SAMPLE PROFILE DATA CLUSTER ANALYSIS ANNEX A

P E O P L E S C I E N C E & P O L I C Y 45
INTRODUCTION SAMPLE PROFILE DATA CLUSTER ANALYSIS ANNEX A
Q4 Why do you say that? WRITE IN
Q5 Which of these groups do you find it hardest to talk with about your research findings?
� Policy-makers
� Industry/business community
� Popular science journalists (e.g. on New Scientist)
� General journalists (i.e. in press, TV and radio)
� Others in the media such as writers, documentary and other programme makers
� Press officers in universities
� School teachers
� Young people in schools
� Young people outside school
� The non-specialist public
� (NGOs) Non-Governmental organisations
� Patients/patient groups
� None/don’t know
Q6 Why do you say that? WRITE IN
Q1 Scientists are being asked to engage more with the non-specialist public.What, if anything, does this mean to you? PLEASE WRITE IN
Q2 How important do you feel it is that you personally, in your current post, directly engage with each of thefollowing groups about your research? Please rate importance on a scale of 1 to 5, where 1 is not important and 5 is very important
Not important Very important 1 2 3 4 5
a) General journalists (i.e. in press, TV and radio) � � � � �
b) Popular science journalists (e.g. on New Scientist) � � � � �
c) Others in the media such as writers, � � � � �documentary and other programme makers
d) Schools and school teachers � � � � �
e) Young people outside school � � � � �
f) Policy-makers � � � � �
g) Industry/business community � � � � � (other than where directly concerned with funding your research)
h) The non-specialist public � � � � �
i) Non-Governmental organisations (NGOs) � � � � �
Q3 Which of these groups do you find it easiest to talk with about your research findings?
� Policy-makers
� Young people in schools
� Industry/business community
� Young people outside school
� Popular science journalists (e.g. on New Scientist)
� The non-specialist public
� General journalists (i.e. in press, TV and radio)
� NGOs (non-Governmental organisations)
� Others in the media such as writers, documentary and other programme makers
� Patients/patient groups
� Press officers in your institution
� None/Don’t know
� Schools and school teachers

P E O P L E S C I E N C E & P O L I C Y 46
INTRODUCTION SAMPLE PROFILE DATA CLUSTER ANALYSIS ANNEX A
Q7Thinking about public engagement with, and communication about, science, roughly how many times in thepast 12 months have you done each of the following?
None Once 2-3 times 4-5 times More than 5 times
a) Worked with teachers/schools � � � � �(including writing educational materials)
b) Participated in an institutional open day � � � � �
c) Given a public lecture, � � � � �including being part of a panel
d) Taken part in a public dialogue event/debate � � � � �
e) Been interviewed on radio � � � � �
f) Been interviewed by a newspaper journalist � � � � �
g) Written for the non-specialist public � � � � �(including for the media, articles and books)
h) Engaged with policy-makers � � � � �
i) Engaged with non-Governmental � � � � �organisations (NGOs)
j) Worked with science centres/museums � � � � �
k) Judged competitions � � � � �
For the remainder of the questionnaire, we will be talking about communication and engagement with the non-specialistpublic only. By this we mean adults with no specialist knowledge of, or training in, science.
Q8 How important do you think it is that you personally, in your current post, engage directly with the non-specialist adult public on each of the following? Please rate importance on a scale of 1 to 5, where 1 is notimportant and 5 is very important
Not important 1 2 3 4 Very important 5
a) The scientific findings of your research � � � � �
b) Areas for further research � � � � �
c) Policy and regulatory issues � � � � �
d) The wider social and ethical implications � � � � �of your research findings for society
e) The potential benefits of � � � � �your work to individuals
f) The scientific process/the nature of science � � � � �
g) Scientific uncertainty � � � � �
h) The enjoyment and � � � � �excitement of doing science
i) The relevance of science to everyday life � � � � �
j) To raise awareness of � � � � �career options in science

P E O P L E S C I E N C E & P O L I C Y 47
INTRODUCTION SAMPLE PROFILE DATA CLUSTER ANALYSIS ANNEX A
Q9 Looking at the list below, what do you think is the main reason for scientists and engineers generally to engage with the non-specialist public?
� To be accountable for the use of public funds
� To contribute to public debates about science and scientific issues
�To contribute to discussions about the social and ethical issues science can raise
� To generate/stimulate additional funds for universities and colleges
� To recruit students to your subject
� To ensure the public is better informed about science and technology
� To raise awareness about your subject
� To raise awareness of science generally
� There are no reasons to engage with this group (GO TO QUESTION 11)
� Other, PLEASE SPECIFY
Q10 Looking at the list below, what do you think is the second most important reason for scientists and engineersgenerally to engage with the non-specialist public?
� To be accountable for the use of public funds
� To contribute to public debates about science and scientific issues
� To contribute to discussions about the social and ethical issues science can raise
� To generate/stimulate additional funds for universities and colleges
� To recruit students to your subject
� To ensure the public is better informed about science and technology
� To raise awareness about your subject
� To raise awareness of science generally
� There are no other reasons to engage with this group
� Other, PLEASE SPECIFY
Q11 Looking at the list below, what do you think is the main drawback to scientists and engineers generallyengaging with the non-specialist public?
� It makes them look bad in front of their peers
� It makes them a target
� It can send out the wrong messages
� It diverts money from research projects
� It diverts money from other, non-research, activities
� It takes up time that is better used on research
� It takes up time that is better used on other, non-research, activities
� There are no drawbacks to engaging with any of these groups (GO TO QUESTION 13)
� Other, PLEASE SPECIFY

P E O P L E S C I E N C E & P O L I C Y 48
INTRODUCTION SAMPLE PROFILE DATA CLUSTER ANALYSIS ANNEX A
Q12 Looking at the list below, what do you think is the second main drawback of scientists and engineersgenerally engaging with the non-specialist public?
� It makes them look bad in front of their peers
� It makes them a target
� It can send out the wrong messages
� It diverts money from research projects
� It diverts money from other, non-research, activities
� It takes up time that is better used on research
� It takes up time that is better used on other, non-research, activities
� There are no other drawbacks to engaging with any of these groups
� Other, PLEASE SPECIFY
Q13 In relation to the other things you have to do in your working life, how important is it to you that you find timeto engage with the non-specialist public?
� Not at all important
� Not very important
� Equally important
� Fairly important
� Very important
Q14 Would you like to spend more time, less time or about the same amount of time as you do now engaging withthe non-specialist public about science?
� I would like to spend more time (GO TO QUESTION 15)
� I am content with the amount of time I spend on this now (GO TO QUESTION 16)
� I would like to spend less time (GO TO QUESTION 16)
� Don’t know (GO TO QUESTION 16)
Q15 Why do you say that?
� I work in a topical area of science
� I work in a controversial area of science
� There is a need to recruit more students
� Scientists and engineers need to be more accountable
� Scientists and engineers should engage more with the community
� Other, PLEASE SPECIFY

P E O P L E S C I E N C E & P O L I C Y 49
INTRODUCTION SAMPLE PROFILE DATA CLUSTER ANALYSIS ANNEX A
Q16 Below are some things people have said about engaging with the non-specialist public about science andengineering. Please indicate whether you agree or disagree for each statement.
Strongly Agree Agree Neither Disagree Strongly Disagree Don't know
a) Scientists who communicate a lot � � � � � �are not well regarded by other scientists
b) Engaging with the non-specialist public might � � � � � �help researchers make new contacts for their research
c) Funders of scientific research should help � � � � � �scientists to communicate with the non-specialist public
d) Scientists have a moral duty to engage � � � � � �with the non-specialist public about the social and ethical implications of their research
e) I don’t think my research is interesting � � � � � �to the non-specialist public
f) The main reason to engage with the � � � � � �non-specialist public is to get their support for science and engineering
g) I simply don’t have time to engage � � � � � �with the non-specialist public
h) I would not want to be forced to take a � � � � � �public stance on the issues raised by my research
i) Engagement with the non-specialist public � � � � � �is best done by trained professionals and journalists
j) Engaging the non-specialist public � � � � � �in science is personally rewarding
k) My research is too specialised to make � � � � � �much sense to the non-specialist public
l) I would need help to develop a science � � � � � �engagement project
m) I would be happy to take part in a science � � � � � �
n) Public engagement could help with my � � � � � �career engagement activity that wasorganised by someone else
o) Engaging with the non-specialist public is � � � � � �best done by senior researchers
p) There are no personal benefits for me in � � � � � �engaging with the non-specialist public

P E O P L E S C I E N C E & P O L I C Y 50
INTRODUCTION SAMPLE PROFILE DATA CLUSTER ANALYSIS ANNEX A
Q17How easy or difficult do you think it is to get involved in science engagement activities for those who want to do so?
� Very easy
� Fairly easy
� Fairly difficult
� Very difficult
� Don’t know/can’t say
Q18How well equipped do you personally feel you are to engage with the non-specialist public about your research?
� Very well equipped
� Fairly well equipped
� Not very well equipped
� Not at all equipped
� Don’t know
Q19What training, if any, have you had in communicating science to the non-specialist public? Do not include any teaching training you may have had.
� None
� Media training on being interviewed by journalists
� Training in writing for the non-specialist public
� Training in speaking to the non-specialist public
� Training in understanding the UK school education system
� Training in speaking to school children (of any age)
� Other] Informal means / experience
� Other PLEASE SPECIFY
Q20What would encourage you personally to get involved in activities that engage the non-specialist public in science?

P E O P L E S C I E N C E & P O L I C Y 51
INTRODUCTION SAMPLE PROFILE DATA CLUSTER ANALYSIS ANNEX A
Q21To what extent would you personally be encouraged to get more involved in activities to engage the non-specialist public in science and engineering by each of the following?
A great deal To some extent Not very much Not at all Don’t know
a) If my head of department/line manager � � � � �were to give me more support and encouragement
b) If there were awards and prizes for me � � � � �were to give me more support and as an individual
c) If it was part of getting professional status, � � � � �such as chartered engineer or membership of my professional body
d) If it helped with my own career � � � � �
e) If I was relieved of other work � � � � �
f) If the RAE exercise was changed � � � � �to encompass communication with the non-specialist public
g) If my department or institution was � � � � �recognised by an award or prize
h) If it brought money into my department � � � � �
i) If it was easier for me to get funds for � � � � �engagement activities
j) If grants for engagement covered staff � � � � �time as well as other costs
k) If it was easier to organise such activities � � � � �
l) If I had some (more) training � � � � �
Q22 What is stopping you from getting (more) involved in activities that engage the non-specialist public inscience? Please mark all that apply
Q23 Do other members of your department take part in activities that engage the non-specialist public inscience?�Yes, most of them�Yes, some of them �Yes, one or two of them�None of them �Don’t know
�I am already involved enough � There is not enough funding�I am too junior � I need to spend more time on my research�I am only in the UK for a limited period � I need to spend more time teaching�English is not my first language � I need to spend more time on administration�I feel that I am encroaching on � I need to spend more time getting funding for my
Press Office workresearch � I would have to do it in my own time�There is no senior level support � Peer pressure�Other PLEASE SPECIFY � I just don’t want to

P E O P L E S C I E N C E & P O L I C Y 52
INTRODUCTION SAMPLE PROFILE DATA CLUSTER ANALYSIS ANNEX A
Q24 Are the researchers in your department generally supportive towards those who take part in activities thatengage the non-specialist public in science?
� Yes, very supportive� Yes, fairly supportive� Not particularly supportive� Not at all supportive� Don’t know
Q25 Is your institution generally supportive towards researchers who take part in activities to engage the non-specialist public in science?
� Yes, very supportive� Yes, fairly supportive� Not particularly supportive� Not at all supportive� It varies between departments� Don’t know
In order for us to understand the views of different types of respondent, please tell us something about yourself. All replieswill be treated in the strictest confidence.
Q26 Which of these best describes your current position?
� Professor or above� Reader/senior lecturer/researcher/fellow� Lecturer/researcher/fellow� Junior/assistant researcher/fellow� Technician/other support staff
Q27 Working status
� Working full-time (>35 hours per week)� Working part-time (<35 hours per week)
Q28 Which best describes your main role at your institution?
� Research (including clinical research) � Research and teaching� Teaching only� Clinical work only� Management/administration
Q29 From the list below, which discipline most closely describes your current area of research interest?
� Clinical medicine (including dentistry)� Non-clinical bioscience (including medical, psychology, veterinary, agricultural)� Engineering/engineering sciences (including IT)� Chemical/chemical engineering� Physics (including materials sciences) and astronomy � Mathematics� Environmental sciences (including earth and marine sciences)�Other PLEASE SPECIFY

P E O P L E S C I E N C E & P O L I C Y 53
Q30 Do you think your work has implications for society and/or policy-makers and regulators?
� Yes� No� Don’t know/not sure
Q31 What was the latest RAE score for your department/unit of assessment?
� 1� 2� 3� 4� 5� 5*� Don’t know
Q32 What is the principal source of funding for your research?
� Wholly or principally funded by a Research Council� Wholly or principally funded by a Government Department� Wholly or principally funded by a Higher Education Funding Council� Wholly or principally funded by an EU research grant� Wholly or principally funded by The Wellcome Trust� Wholly or principally funded by the Royal Society� Wholly or principally funded by another charity� Wholly or principally funded by industry� Other principal source of funding, PLEASE SPECIFY
Q33 Which council is funding your research?
� BBSRC� MRC� NERC� EPSRC� PPARC� ESRC� AHRB/AHRC
Q34 To the nearest year, how long have you been working in scientific research, whether in academia orelsewhere? If less than six months enter 0, if more than six months but less than a year enter 1.
Q35 What was your age last birthday?
Q36 Are you:
� Male� Female
Q37 What is your ethnic origin?
� White - UK � Black - US� White - Europe � Black - Other� White - US � Chinese � White - Other � Indian� Black - African � Pakistani� Black - Caribbean � Other Asian � Black - UK � Mixed race �Other, PLEASE SPECIFY
Q38 Is English your first language?
� Yes� No
INTRODUCTION SAMPLE PROFILE DATA CLUSTER ANALYSIS ANNEX A

P E O P L E S C I E N C E & P O L I C Y 54
Q39 Do you intend to work in the UK in the long term?
� Yes� No� Don’t know
Thank you for giving up your time to complete this survey. Your views will be treated in confidence, and we will not passindividual comments back to the Royal Society, the Wellcome Trust or Research Councils UK. Over the coming months, wewould like to talk to some respondents to this survey in more depth about their views. If you are willing to be contacted byPeople Science & Policy Ltd. for a short interview by telephone or in person please enter your contact details below.
Q40 Please provide us with the following contact details
INTRODUCTION SAMPLE PROFILE DATA CLUSTER ANALYSIS ANNEX A
Your name . . . . . . . . . . . . . . . . . . . . . . . . . . . . . . . . . . . . . . . . . . . . . . . . . . . . . . . . . . . . . . . . . . . . .
Your telephone number . . . . . . . . . . . . . . . . . . . . . . . . . . . . . . . . . . . . . . . . . . . . . . . . . . . . . . . . . .
Your e-mail . . . . . . . . . . . . . . . . . . . . . . . . . . . . . . . . . . . . . . . . . . . . . . . . . . . . . . . . . . . . . . . . . . . .
Thank you very much for your help.Please press "submit" to send us your responses.