Embed Size (px)
Citation preview

S i 1 1 1 " m
m Hi 1 EH If III •
Factors Affecting the Cost of Production of Milk in the Kurunegala District
H.M.SJ.M. Hitihamu
January 2007

Factors Affecting the Cost of Production of Milk in the Kurunegala District
H.M.S.J.M. Hitihamu N.P.G. Samantha
R.M.G.K.B. Rathnayake
Research Study No. 120 January 2007
Hector Kobbekaduwa Agrarian Research and Training Institute 114, Wijerama Mawatha
Colombo 07 Sri Lanka
3 51853 LiBR :
H A R T J •9»

First Published 2007
© Hector Kobbekaduwa Agrarian Research and Training Institute All rights reserved
ISBN: 978-955-612-078-3
Cover Page Design: Mrs. Shayama Ranasinghe and Mrs. Dilanthi Hewavitharana
FOREWORD
Dairy farming has played an important role in the rural economy of Sri Lanka. It contributes to the nutrition of the rural farm families and can easily be managed by women alone with their other household work.
The domestic production can only meet 15% of the total milk requirement of the country. Importation of milk and allied products covered the balance. Government spent more than Rs.13 billion in 2006 to import milk and milk based products. If Sri Lanka can produce this milk requirement, this huge amount of money can be invested for the development of the country. The lack of profitability in milk production directly contributed to the stagnation of production during the last decade. The milk farmers state that the dairy industry is unprofitable and uneconomical due to the low price.
In this context, the study on the "Factors Affecting the Cost of Production of Milk in the Kurunegala District" is timely and relevant This study mainly focuses on the economics of milk production in the Kurunegala district and more importantly it attempts to analyze the cost and benefit in dairy farming.
This study also reveals the importance of the institutional factors in the milk production, identifies the efficiencies in the different cattle management systems related to agro-ecological zones and examines the status quo in the dairy production sector to suggest policy measures aiming at improving the milk production efficiency.
Furthermore, the study shows that milk production is profitable when only maintenance costs are taken into account. The profitability of the industry is 32% on that basis. The variable cost such as labour, feed, cost of veterinary medicine, etc. and fixed cost such as milking equipments, shed cleaning equipments and ropes are the factors that determine the profitability of the dairy farming. The study also notes that the feed cost is the highest cost element incurred in cost of production of milk and it was around 67% of the total cost of production in the Kurunegala district.
I hope that the findings of this study will be useful for policy formulation and planning for the development of the dairy sector in Sri Lanka.
V.K. Nanayakkara Director Hector Kobbekaduwa Agrarian Research and Training Institute (HARTI)

ACKNOWLEDGMENT
We wish to express our propound gratitude to Prof. H.P.M. Gunasena, the former Executive Director, CARP for providing funds under the research grant scheme to carry out this study.
We are much thankful to Mr. V. K Nanayakkara, the present Director of HARTI for his valuable comments and immense support for publishing the report. The support extended by Dr. W.G. Jayasena, the Deputy Director (Research) of HARTI in conducting this study is also acknowledged.
We are grateful to Professor M.O.A.de Zoyza the former Director of HARTI for his invaluable guidance and encouragement given during the initial stages of this study.
We are immensely grateful to Dr. H.M.A. Chandrasoma, Provincial Director (North Western Province), Department of Animal Production and Health (DAPH) who helped in numerous ways to undertake the field survey successfully, and for providing necessary information and data required for the study. We take this opportunity to extend our special appreciation to the respondent farmers, who spent their valuable time to provide the information required for this study.
A special word of appreciation to Mr.J.K.M.D. Chandrasiri, Head, Agricultural Policy and Project Evaluation Division (APPE) of HARTI, Mr. M.M.M. Aheeyer, and Mrs. S. Kusum Kumara, Research Associates of HARTI for providing valuable comments on the draft report.
We are extremely grateful to Prof. C Bogahawatta, Department of Economics, Prof. M.N.M Ibrahim, Department of Animal Science, Faculty of Agriculture, University of Peradeniya and Dr. Mangala De Zoyza, Department of Agriculture Economics, University of Ruhuna, for providing valuable comments to improve this report.
We wish to express our sincere gratitude and special thanks to Mr. Ananda de Silva, Statistical Officer and Mr. L.G. Ariyaratne, Statistical Assistant of the APPE Division, for assisting us to collect field data, processing these data and preparing the statistical tables for the study report.
We are extremely grateful to Mr. E.N.R. Fernando, Data Analyst and Mr. S. Epasinghe, Research Officer, HARTI for helping us to complete the fieldwork successfully.
A special note of appreciation is due to Mr. Sunil Fernando, former Lecturer of University of Illinois, USA for his continuous encouragement to complete this report
We wish to express our sincere gratitude to Mr. H.A. Siriwardana, an outside copy editor and Mr. S. Rameshwaran, Acting Head, Publication Unit of HARTI for the expert editorial assistance.
ii

Finally, we express our gratitude to Miss. Rajika Shayamelie, Mrs. Kaman Karunarathne and Mrs. Dilanthi Hewavitharana who helped us in typesetting and preparing the research report.
H.M.S.J.M. Hitihamu Research Officer Agricultural Policy and Project Evaluation Division
N.P.G. Samantha Research Officer Agricultural Policy and Project Evaluation Division
R.M.G.K.B. Rathnayake Research Associate Agricultural and Environmental Resource Management Division
iii

EXECUTIVE SUMMARY
Sri Lankan Economy has persistently relied on agriculture. With the emergence of the open economy in 1978, vast changes in the economic structure followed with a declining impact on the agricultural pursuits. Conversely, at present, around 40% of the total labour force is engaged in the country's farming sector. Historically, dairy farming has played an important role in the rural economy. It provides a supplementary source of income to nearly 6 million smallholders. Dairy fanning contributes to the nourishment of the rural farm families and it is an activity which can easily be management by women alone with their other household work.
The recommended per capita consumption of milk per day is 180 ml. In the year 2002 the domestic milk production was 348 million litres, which amounted to only 15% of the total market share. Importation of milk, and allied products covered the balance. A major proportion of milk is imported in powdered form.
The lack of profitability in milk production which attracted a greater focus in the recent past, directly contributed to the stagnation of this activity during the last decade. The GDP contribution from the dairy sector was 1.2% during year 2002; the main problem in this sphere is the cost of production. Therefore, the study presents a detailed investigation of production efficiency and economic viability of milk production.
The study mainly focuses on the economics of milk production in Kurunegala district; more specifically it attempts the specific objectives to analyze the cost and benefit in dairy farming, to examine the importance of institutional factors in milk production, to identify the efficiencies in different cattle management systems related to agro-ecological zones and to examine the status quo in the dairy production sector for the proposal policy measures aiming at improving the efficiency in milk production.
The study was conducted in Kurunegala district, which consists of three different agro ecological zones: the Wet Zone (WZ), the Intermediate Zone (IZ), and the Dry Zone (DZ). Depending on the features of these agro-climatic zones, six Veterinary Surgeon divisions were selected within which 12 LDI ranges formed the study location. Forty farmers from each VS range composed the total sample population of 240. Farmers were selected randomly based on the number of milk suppliers scattered in different ecological zones. The sample population composed of 80 farmers from the WZ, 120 farmers from the IZ and 40 farmers from the DZ.
Data collection consisted of three main components: (i) a comprehensive literature review, (ii) focus group and key informant discussion, and (iii) a structured questionnaire survey to understand the livestock rearing systems in the area.
The structured questionnaire focused on getting detailed information about the, management practices of dairy farmers, herd characteristics, feeding practices and costs, animal health and veterinary services, labour utilization, cost of herd management, income received, the extension programme and other supporting services. The economics of milk production was analyzed using arithmetic calculation, production function analysis (Cobb-Doglas), cost benefit analysis, and partial factor productivity. The data
iv

was tabulated and a frontier computer package was used to find the significant factors of milk production.
In the study, the cost of production per liter of milk per day was calculated with and without family labour cost. This cost with family labour amounted to Rs. 10.79, Rs. 11.40, and Rs. 10.95 in WZ, DZ, and IZ respectively. The calculation did not include the fixed cost for animals, lands and buildings and other capital investments. The study was carried out to calculate the short run basis within one-year period. The COP/cow/day was calculated as Rs.82.54, Rs.66.28, and Rs.71.03 in the WZ, the DZ, and the IZ respectively. The total average COP/cow/day was Rs.73.33 in Kurunegala district. The COP/cow/day without family labour was Rs.32.28, Rs.21.04, and Rs.24.66 in the WZ, the DZ and the IZ respectively. The average COP/cow/day was Rs.26.19 in Kurunegala district. The concentrate cost was the highest input cost, when considered without family labour. Generally in Sri Lanka, the dairy industry is maintained in herds which include both productive and non-productive animals. The COP/herd/day without family labour was Rs.153.16, Rs. 156.38, and Rs.160.10, in the WZ, the DZ and the IZ respectively. Head/herd was 6.3, 10.5 and 6.5 in the WZ, the DZ and the IZ respectively. If the above mentioned fixed costs are excluded, the profitability of the dairy industry is around 32%, but with the inclusive of fixed costs such as the cost for animals, land, buildings and capital, the profitability is likely to drop. Dairy farmers earn a higher income compared with that of the other agricultural farmers, paving the way to better socio-economic standards.
A production analysis, using a backward selection of explanatory variables was applied to develop the economic relationship. The co-efficient of determining the WZ, the IZ and the DZ are 0.49. 0.68 and 0.42 respectively. The variables such as labour, feed, cost of veterinary medicine, and fixed costs are the factors that determine the profitability of dairy farming.
The partial factor productivity indicates the net positive production related to labour and the capital. It signifies the profit margin. But, it can be increased up to the optimum level.
Kurunegala district has the potentials to increase the milk production and the income level of the dairy farmers. This venture could also emerge as a much profitable enterprise if those farmers could be diverted to the production of value added products with assured feed supply. To develop the dairy sector in Sri Lanka, the following policy measures and plans are recommended:
• Maximize the utilization of crop residues, natural grasses and legumes providing proper technical knowledge through training programmes.
• Identify and establish pasture subsidy schemes, credit, and other facilities needed to boost the dairy farming industry.
• Establishment of common pasture lands in prominent dairy production areas, especially in the dry zone of Sri Lanka, and encourage the farmers to grow grass on small plots of available land.
• Researchers should be encouraged to develop low cost feed rations for different regions using locally available feed resources.
Implement projects to grow compounded feed crops locally, facilitate marketing of the products, and encourage regional entrepreneurs to establish small scale animal feeding mills. Establishment of Artificial Insemination (AI) units in highly dense cattle breeding villages and introduce improved breeds suited to the climatic conditions of the region. Restructure the extension system as a demand driven system and encourage and provide facilities to the private sector enterprises engaged in the dairy industry, to fill the gap of extension services. Encourage the farmers to produce value added products as well as selling raw milk. Facilitate evening milking by providing evening milk collection facilities or establishment of chilling centers at village level. Introduction of an annual market price fixation programme with the COP
vi

CONTENTS
« Page No. FOREWORD i ACKNOWLEDGMENT ii EXECUTIVE SUMMARY iv CONTENTS vii List of Tables x List of Figures xii List of Abbreviations xiii
Chapter One INTRODUCTION
1.1. Introduction 01 1.2. Present Context of the Dairy Industry 01 1.3. Problems and their Relevance to the Study 02 1.4. Objectives of the Study 03 1.4.1 Scope of the Study 03 1.5 The Study Location 03 1.6 Research Methodology 04 1.6.1 Data Collection 04 1.6.2 Literature Review 04 1.6.3 Key Informants Discussion 05 1.6.4 Questionnaire Survey 05 1.6.5 Sampling Procedure 05 1.6.6 Methods of Analysis 06 1.6.7 Assumptions - Scale of Operations 06 1.6.8 Study Period 06 1.6.9 Limitations of the Study 06
Chapter Two DAIRY FARMING IN SRI LANKA
2.1 Breeds and Rearing Systems 07 2.1.1 Hill Country Zone 08 2.1.2 Mid Country 08 2.1.3 Low Country Wet Zone 08 2.1.4 Dry Zone 08 2.1.5 Coconut Triangle 09 2.1.6 Jaffna Peiiinsula 09 2.2 Cattle and Buffalo Population 09 2.3 Type of Feeds 11 2.3.1 Roughage 11 2.3.2 Concentrates 12 2.4 Milk Production and Marketing 12 2.4.1 Production 12
LIBRARY
H A R T I

2.4.1.1 Milk Availability per Capita 14 2.4.2 Marketing 14 2.4.2.1 Milk Collection and Marketing 14 2.4.2.2 Pricing Mechanism of Milk 15 2.4.3 Milk Consumption per Capita 15 2.5 Government and Non Governmental Institutions in Livestock Sector 15 2.5.1 State Sector 16 2.5.2 Public Enterprises (Prostates) 16 2.5.3 Co-operative Sector 17 2.5.4 Private Sector 17 2.6 Veterinary Services 17 2.7 Extension and Training Services 17 2.8 Breeding and Insemination Services 18
Chapter Three SOCIO - ECONOMIC BACKGROUND OF THE DAIRY FARMERS
3.1 Demographic Characteristics of the Sample 3.2 Education Levels of the Farmers 3.3 Family Income and Source of Income 3.4 Pattern of Labour Use 3.5 Pattern of Land Use
19 20 20 23 23
Chapter Four DAIRY FARMING SYSTEM OF THE STUDY AREA
4.1 Type of Breeds 4.2 Herd Size 4.3 Dairy Management Systems 4.3.1 Intensive System of Management 4.3.2 Extensive Management System 4.3.3 Semi-Intensive System of Management 4.4 Feeding Pattern in the Study Area 4.5 Livestock Services in the Study Area 4.5.1 Diseases 4.5.2 Extension Services 4.6 Breeding Programme 4.7 Milk Production and Marketing in the Study Area 4.7.1 Milk Procurement System 4.7.2 Milk Prices in the Study Area 4.8 Credit Systems
25 27 29 29 30 30 30 31 33 34 35 38 39 40 40
Vlll

Chapter Five ECONOMICS OF MILK PRODUCTION
5.1 Cost Variables in Milk Production 5.1.1 Fixed Cost 5.1.2 Variable Cost 5.1.3 Imputed Cost 5.2 Production Function 5.2.1 Estimation of Production Function 5.3 Arithmetic Calculation for Cost of Production Analysis 5.4 Cost Benefit Analysis of Milk Production in the Study Area 5.5 Partial Factor Production in Dairy Production 5.6 Production Function Analysis
Chapter Six PROBLEMS AND RECOMMENDATIONS
6.1 Constraints, Potentials, and Recommendation 6.1.1 Cost of Production of Milk 6.1.2 Feeding Patterns 6.1.3 Breeding and Herd Improvement Programmes 6.1.4 Extension Services 6.1.5 Production and Marketing
Chapter Seven SUMMARY AND CONCLUSION
REFERENCES

LIST OF TABLES
Table No. Page No.
Chapter One
1.1 Selection Criteria 04 1.2 Milk Suppliers in Three Different Zones 05
Chapter Two
2.1 Agro Climatic Zones and Salient Features 07 2.2 Cattle and Buffalo Population of Sri Lanka, 2002 09 2.3 National Herd Composition, 1998-2003 10 2.4 Cattle and Buffalo Population in the Kurunegala District,
1997-2002 10 2.5 Location and Areas of Natural Grazing Lands in Sri Lanka 11 2.6 Annual Total Milk Production 1992-2002 (Million litres) 13 2.7 Milk Production of Kurunegala District in 1998-2002 13 2.8 Imports of Milk and Cream 14 2.9 Number of Artificial Insemination (AI), Pregnancy Diagnosis (PD)
and AI Calves Reportedly Born from 1992-2002 in Sri Lanka 18
Chapter Three
3.1 Distribution of Cattle Farmers According to the Level of Monthly Household Gross Income 21
3.2 Composition of Average Annual Household Gross Income by Sources of Income 22
3.3 Pattern of Labour Used for all Operations of Cattle Management by Type 23
3.4 Operational Extent of Highland (including home gardens) Classified by Agro-Ecological Zones and Types of Cattle Management 24
3.5 Operational Extent of Lowland, Classified by Size, Agro Ecological Zones and Types of Cattle Management 24
Chapter Four
4.1 Cattle Population by Breed Type in the Study Area 4.2 Average Milk Yield in the Cattle Population by Breed Type 4.3 Average Milk Yields in Different Zones by Breed Type 4.4 Average Herd Size of the Cattle Farmers Related to the Operational
Highland 4.5 Scale of Operators in the Three Ecological Zones 4.6 Number of House Holds Classified by Different System of Cattle
Management and Agro Ecological Zones
x

4.7 Concentrated Feeding Patterns and Treatment for Common Diseases 31 4.8 Pasture Cultivation Maintained by the Cattle Farmers in the Study Area 32 4.9 Diseases of Cows During the Year 2003 33 4.10 Reported Diseases of Cattle (other than cows) During the Year 2003 34 4.11 Number of Cattle Farmers Obtaining Advices from the Sources 35 4.12 Methods of Breeding in the Study Area 3 5 4.13 Distribution of Number of Cattle Breeds in Different Zones in the
Study Area by Method of Breeding 36 4.14 Average Cost for Cattle Breeding in 2003 36 4.15 Number of Attempts for Pregnancy Using Al and Natural Breeding 3 8 4.16 Monthly Average Milk Production in the Kurnegala District
(1997-2002) 38 4.17 Average Milk Production in Different Zones of the Study Area 39 4.18 Place of Disposal of Milk 39 4.19 Number of Loans Borrowed from 1996-2003 for Cattle Management 40
Chapter Five
5.1 Cost of Production of milk per Litre (Rs) under Different Agro Ecological Zones 45
5.2 Cost of Production of Milk per Litre (Rs) Excluding Family Labour 47 5.3 Cost of Production of Milk per Cow/day 49 5.4 Cost of Production of Milk/Cattle/day (Rs) Excluding
Family Labour 51 5.5 Cost of Production of Milk per Herd (Rs) Excluding Family Labour 52 5.6 Cost of Production of Milk per Herd (Rs) Including Family Labour 54 5.7 Cost of Production of Milk per Litre (Rs/Litre)-Excluding Family Labour
by Number of Milking Cows 55 5.8 Cost of Production of Milk per Litre (Rs) - Including Family Labour
by Number of Milking Cows 56 5.9 Income per Day (Rs) 57 5.10 The Cost Benefit Analysis of Milk Production (including family
labour/day) 58 5.11 Cost Benefit Analysis (excluding family labour) 58 5.12 Net Changes in Partial Factor Productivity 60 5.13 Estimated Log-Linearized Cobb-Douglass Production Functions
in Dairy Farms 61

LIST OF FIGURES
Figures Page No.
Chapter Two
2.1 National Herd Composition, 1998-2003 10
Chapter Three
3.1 Age Distribution of Dairy Farmers 19 3.2 Education Levels of the Farmers 20 3.3 Level of Monthly Household Gross Income (Rs) 21
Chapter Four
4.1 Scale of Operators in the Three Ecological Zones 29
Chapter Five
5.1 Cost of Production of milk/litre/day with Family Labour 48 5.2 Cost Differences of litre of milk/day in 3 Different Regions 48 5.3 Cost of Production Without Family Labour 48 » 5.4 Cost of Production Without Family Labour in 3 Different Regions 48 5.5 Cost of Production Rs/Cattle/Day 50 5.6 Cost of Production of Milk/Cattle/day (Rs/Cattle) 50 5.7 Comparison of Cost of Production/Cow/day with and
Without Family Labour 51 5.8 Comparison of Cost/Herd/Day with and Without Family Labour 53 5.9 Average Daily Herd Milk Income in Three Different Zones 57 5.10 Price Analysis of Input/ Output Including Family Labour (herd/day) 59 5.11 Price Analysis of Input/ Output Without Family Labour (herd/day) 59
xii

LIST OF ABBREVIATIONS
Al Artificial Insemination COP Cost of Production cs Chilling Semen CTMU Coconut Triangle Milk Union DAPH Department of Animal Production and Health DF Deep Frozen DZ Dry Zone GDP Gross Domestic Production IZ Intermediate Zone LDI Livestock Development Instructor MILCO Milk Industries of Lanka Co. Ltd (Kiriya) NLDB National Livestock Development Board SNF Solid Non-Fat VRI Veterinary Research Institute
vs Veterinary Surgeon wz Wet Zone
•9
*
Chapter One
INTRODUCTION
1.1 Introduction
Even after the industrial revolution and the IT revolution in the world, Sri Lanka is still dependant as an agriculture-based economy and the contribution of the agriculture to the GDP is about 19% (Department of Census and Statistics, 2003). Agriculture which provides employment to 34% of the total labour force is the main source of employment in the rural sector. Historically, dairy farming has been an integral part of the rural economy of Sri Lanka. It provides a supplementary source of income to nearly 6 million smallholders who operate at near subsistence level in integrated crop livestock farming (Policy Strategy for Dairy Industry, 2000). Dairy farming makes a positive contribution to the family nutrition and income levels. Before the trade liberalization in 1978, the local production accounted for about 40%-50% of the Sri Lankan milk requirement. Due to the low productivity, poor management practices, and rapid population growth the national production has dropped to around 15% of the total requirement of today (Livestock Statistics 2003, Department of Agriculture). Improving the Sri Lankan dairy industry would accrue three major benefits: meeting the domestic demand with local dairy products, reducing the import bills and using the industry as an instrument to alleviate rural poverty.
There is a tremendous potential in the Sri Lankan dairy sector. For example, the sector can achieve sustainable production by integrating crops with livestock. As animal feed one can use crop residues. Crop residues produced per year runs into more than 5.8 million metric tons and straw from rice cultivation is about 4.5 million metric tons. Amount of grain refuse from the grain industry is more than 3 million tons (Rajaguru, 2004). This is a promising base for animal feed. Dairy farming promotes soil fertility through farmyard manure helping to increase productivity.
1.2 Present Context of the Dairy Industry
The GDP share of the livestock sector including the fisheries industry was 2.4% in 2003. The contribution of the dairy sector alone to the GDP was very low compared with that of the other sectors in agriculture. The total milk production in the year 2004 was 162 million litres, just enough to meet around 15% of the annual national requirement. The daily per capita milk consumption in Sri Lanka is below 100 grams, in contrast to the world average of 258 grams per day. Sri Lanka imports milk mainly in powdered form due to the shortfall of local milk production. In 2003, the quantity of milk and milk based products imported was 67,941 metric tons, which incurred an import bill of Rs.l 1.5 billion (Department of Census Statistics, 2003). During the last few years, this import bill has increased unprecedentedly.
Organizationally, the combined milk collecting capacity of both the public and the private sectors with regard to the daily milk collection is a modest 350,000 pounds per day. The state run institutions are Milk Industries of Lanka Company Limited (MILCO), the National Livestock Development Board (NLDB), and the Co-operative
| getea?3(3cs J LIBRARY
SK > . © 2 S : > . & E ' J , 0 . g .QS
I F A R T !

Milk Producers which account for about 180,000 pounds of milk collection. The balance collection is mainly by the private sector represented by large multi-national and small-scale local companies (FAO, 2003). In order to develop the dairy industry, the past governments had undertaken a number of dairy development programmes. Even though these programmes did not result in remarkable changes in the industry, it is important to have a suitable and sustainable dairy development programme in Sri Lanka with the use of the available natural resources.
1.3 Problems and their Relevance to the Study
Nevertheless the dairy industry in Sri Lanka has undergone tremendous changes during the last couple of decades in line with the implementation of liberal economic policies. According to the national policy on agriculture and livestock 2003-2010, it is planned to achieve self-sufficiency in milk and milk products within 10 years. The ultimate aim of this policy is to mobilize the private and the public sector resources to increase the productivity to meet the national needs.
The lack of profitability, the main reason for the stagnation of the dairy industry, had received wider focus in the recent past. The contribution from the dairy sector to the national GDP was only 1.2 during 2002 (Dept. of Census and Statistics, 2002). Hardly any studies were undertaken in the past to address the socio-economic aspects of the smallholder dairy farmers in Sri Lanka, with stress on regional variations, production technologies, and cattle rearing systems. Therefore, a detailed investigation of production efficiency and the economic viability of milk production at smallholder level is timely and relevant. The findings of such a study would produce insights into the economics of milk production in relation to levels of inputs, management systems, and support services, cost and return, and marketing.
From the early days the livestock had been a potential source of supplementary income, particularly for the small farmers with limited land and other resources. Therefore, several ongoing livestock development programmes have been re-oriented to suit the poor farmers; these programmes include development and dissemination of improved breeds, disease control, improved pasture, and in general the dairy development in the country.
Small-scale dairy producers contribute a remarkable share to the total milk production in the country. But, the industry has undergone tremendous changes during the last few decades in line with the implementation of liberal economic policies.
Lack of profitability is one of the main problems in the milk production sector. Furthermore, the average milk yield stagnated during the last few decades in the absence of proper technology, the unsatisfactory extension and the other supporting services, and the unavailability of proper and low cost input delivery systems worsened the situation. Conversely the dairy farmers could not receive a reasonable income for want of a proper procurement system and the low floor price milk fetches in relation to the cost of production (Final Report, Government of Sri Lanka/FAO, 2003).
2

Hardly any studies have been undertaken in the past to address the economics of milk production of the smallholder farmers. In addition to this, the absence of a proper database on cost of production has posed severe problems in the formulation of policy documents and the strategies in the dairy sector. Therefore, a detailed, timely and relevant investigation into the production efficiency and economic viability of milk production at small holder level was undertaken in this study.
1.4 Objectives of the Study
The main objective of this research is to study the economics of milk production in Sri Lanka specified to Kurunegala district.
The specific objectives are: 1. To analyze the cost and benefits of milk production of the dairy farmers; 2. To examine the importance of institutional factors for milk production; 3. To identify the efficiencies in different cattle management systems related to the
different ecological zones; 4. To examine the status quo in the dairy production sector; 5. To suggest policy measures to improve the efficiency in milk production,
1.4.1 Scope of the Study
Paucity of empirical research on cost benefit analysis of the dairy farming system poses a major difficulty for the policy makers. The present research study is an attempt to fill the gaps in knowledge concerning this area providing information for a cost benefit analysis of milk. The findings would help in mapping out effective policy directions in planning and developing the dairy sector in the study area
1.5 The Study Location
The project area is in the coconut triangle of Sri Lanka. The study was conducted in Kurunegala district, characterized by three different agro ecological zones; the dry zone, the wet zone and the intermediate zone. The elevation of coconut triangle is 0-450 meters above the sea level and the expected mean annual rainfall varies from 1,200 mm-4,000 mm. The relative humidity of Kurunegala district is 60%-80%. The average ambient temperature varies from 24C° to 29C°. The topography of the study area is somewhat rolling, undulating and, flat. The types of soil in the study area are red yellow podzodic soils with strongly molted sub soil; low humid gley soils, yellow podzolic soils, with salt, hard laterite and regosols on red and yellow sand.
In the coconut triangle, there is a special integrated cattle-rearing system. Cattle tethered to the coconut palms provide extra benefits, with cattle manure increasing the soil fertility. Weeds are also controlled, since the cattle feed on grasses and weeds under the coconut plants. In the coconut triangle nearly 20% of the cattle were pure-bred, 25% were cross-bred dairy cattle and the remaining 55% were of local breed. The average herd size is 4.8 with a mean of 1.2 lactating cows. The daily milk production of dairy cross-bred cattle is 4.6 litres per cow.

All the major milk collectors operate a good procurement service (Nestle, MILCO and CTMU) in urbanized areas, but the rural areas hardly get such a service (Ibrahim et al 1999).
Going by the agro ecological zones, six Veterinary Service Areas and twelve Livestock Development Instructor Ranges (LDI) from these areas were selected including 240 farmers for the study.
Table 1.1: Selection Criteria
Ecological Zone VS Range LDI Range No. of Farmers
Wet Zone Mawathagama Weuda 20 Mawathagama 20
Ibbagamuwa Malsiripura 20 Ibbagamuwa 20
Intermediate Zone Kuliyapitiya Degalle 20 Kithalawa 20
Pannala Pannawala 20 Welpalla 20
Kobeigane Thelahera 20 Kobeigane 20
Dry Zone Mahawa Ridibedialla 20 Abampola 20
Total 240
1.6 Research Methodology
The following devices of research methodology were applied to collect and analyze the data and other information.
1.6.1 Data Collection
In line with specific objectives of this study, the methods of data collection consisted of 3 major components including a comprehensive literature review, focus group and key informant discussions and a questionnaire survey to identify the existing livestock cattle rearing systems in the area.
1.6.2 Literature Review
Literature review was relied on collecting the existing published information on dairy sectors in Sri Lanka. The information thus collected helped to select the farmers for the study. Wayamba Veterinary Provincial Office records have given a very clear picture of the dairy production systems in Kurunegala district and the distribution pattern of the farmers in the different ecological regions.

1.6.3 Key Informants Discussion
The officers in the North Western Province involved in the livestock development programmes were identified as key informants. The Director of the Provincial Livestock Office and the Veterinary Surgeons of the study area and the Livestock Development Instructors were interviewed using guidelines. Informal discussions were also held to gather necessary information about the dairy sector.
1.6.4 Questionnaire Survey
For the questionnaire survey, the farmers were selected according to the agro-ecological zones and the number of milk suppliers in the different zones. The questionnaires were pre-tested, revised, and finalized with the help of livestock economic experts. Structured questionnaires were prepared to collect detailed information about the following aspects:
a. Dairy management systems; b. Socio economic aspects of the dairy farmers; c. Herd characteristics; d. Feeding practices and expenditures; e. Animal health and veterinary services; f. Labour utilization; g- Cost of herd management and incomes; h. Extension programmes and supporting services.
1.6.5 Sampling Procedure
Two hundred and forty farmers were interviewed using a structured questionnaire. Farmers were selected according to the number of milk suppliers scattered in the different ecological zones. The information about milk suppliers was obtained from the records of the North Western Provincial Livestock Development Office.
Table 1.2: Milk Suppliers in Three Different Zones
Target groups Numbers Wet zone Intermediate zone Dry zone Total
No. of Milk suppliers 1,949 2,991 1,086 6,029 No. of selected 80 120 40 240 Farmers
Source: Evaluation Report -2003, Dept. o f Animal Production and Health, North Western Province
The ratio of milk suppliers within the LDI range formed the basis for the selection of a sample population. The ratio of milk suppliers in the wet, the intermediate, and the dry zones is 2:3:1 respectively. The basic unit of the sample area was the LDI range. From each of which twenty farmers were selected. Table 1.1 reveals these selection criteria. Based on the information of the LDI officers, the milk farmers were selected randomly.
1.6.6 Methods of Analysis
As the main objective of the study is to find out the economics of milk production the following economic analysis methods were used to realize the objectives:
(i) Arithmetical calculation for cost of production; (ii) Production function analysis/Cobb-Douglas; (iii) Cost -Benefit Analysis; (iv) Partial factor productivity analysis.
1.6.7 Assumptions - Scale of Operations
Based on the information of previous reports and the preliminary observations made under this study, the scale of production was categorized as follows:
• Large scale - more than 10 animals; • Medium scale - 6-10 animals; • Small scale - below 6 animals.
1.6.8 Study Period
The field data collection of this study was carried out from January 2004 to May 2004.
1.6.9 Limitations of the Study
Literature on the subject which is hard to come by somewhat constrained the study. Very often the farmers were either reluctant or unable to provide accurate information. Most of the farmers do not keep records on their herds and they hesitate to come out with the exact milk production levels and other income related information. Farmers always over estimate their input information and under estimate their income information. Hence, it took more time to have accurate data on input and output values. Some herdsmen were not so positive about the future of their livelihood. The farmers, who were randomly selected, were scattered everywhere in the LDI divisions, rendering it rather difficult to make contacts with them.
6

Chapter Two
DAIRY FARMING IN SRI LANKA
This chapter presents an overview of the breeds and the systems of rearing the neat cattle and buffalo population, type of feed, milk production and marketing, government and non-governmental institutions involved in the livestock sector, extension services, veterinary services, and breeding and insemination services in Sri Lanka. It also outlines the general condition of Kurunegala district so far as the above factors are concerned.
2.1 Breeds and Rearing Systems
There are three main agro ecological zones in Sri Lanka. The management of the dairy farming system differs depending on the climatic zones. Within these climatic conditions, 6 dominant dairy farming systems were identified. Nearly 67% of the total cattle population of Sri Lanka is concentrated in the dry and the dry intermediate zones of Sri Lanka whereas the rest are in the wet zone.
Table 2.1 Agro Cl imatic Zones and Salient Features
Hill Country Zone
Mid Country Zone
Low Country Wet Zone
Dry Zone Coconut Triangle
Jaffna Peninsula
Elevation (M) > 1200 450-1200 0-450 0-450 0-450 0-450 Ambient 10-24 21-32 24-35 21-38 24-39 27-35 Temperature (C°) Rainfall (mm) > 2 0 0 1,675- 1,875- 1,000- 1,200- 1,000-
5,000 2,500 1,750 4 ,000 1,500 Relative 5 8 - 7 5 55-75 75-90 70-85 60-80 71-74 humidity (%) Type o f farmers
Mostly plantation workers
Agricultural farmers
Agricultural farmers
Agricultur al farmers
Coconut land owners
and agricultural
farmers
Agricultur al farmers
Typical fodder Road sides Road sides Post harvest Post Under Harvested base and and home crop fields harvest coconut and and post
railway lines
plots and home plots
crop field tank bunds and scrub
jungle
post harvest crop fields
harvest crop fields
Type o f cattle European European Local and Local Local and Local and crosses crosses cross breeds cross breeds cross
breeds Average herd 2-5 2-5 2-10 25-100 5-20 30-50 size
Source: Ibrahim et. al. 1999
7

2.1.1 Hill Country Zone
The up country or the hill country zone is situated 1,200 m above sea level and the ambient temperature range is between 10 C° - 24 C°. There are two special ways of cattle rearing systems in this zone. These are the estate based and the village based systems. In the former, the dairy operators are mainly the plantation workers, especially in tea estates. They feed their cattle with weeds and fodder from the estate lands and fodder from other common property. In the village-based system, the main operators are agricultural farmers, who grow paddy and other crops as well. Weed from their agricultural lands, crop residues and other fodder are used to feed the cattle. They are crop-livestock integrated farmers.
Generally in the hill country, the temperate breeds show higher performances. Friesian, Ayrshire, Jersey and their cross breeds are popular in this region. Average daily milk yield is reported as 8 litres/cow or 2,500 litres/cow/lactation, but better management conditions can increase this up to about 20 litres/cow/day. According to the Central Bank of Sri Lanka report (2003), Nuwara Eliya district recorded the highest milk production. Manure is also considered as a secondary source of income for the dairy farmers in the hill country, because there is a high demand for cow dung in the vegetable cultivation, especially in Nuwara Eliya district. High quality grass and other inputs are essential to obtain higher production within the zone.
2.1.2 Mid Country
Mid country is situated 450 m - 1,200 m above sea level and the ambient temperature range is between 21C°-32C°. The home garden production system is popular in this region. In low lands, the farmers grow paddy and their home gardens mainly consist of export agricultural crops. The animals feed on grass along the roadsides and home grass plots, crop residues, and tree fodder are the other sources of fodder. The breed, which is suited for the mid country is a European cross with Indian breeds. The average daily milk production is 6 litres/cow or around 1,500 litres/cow/lactation. They mainly practice zero grazing or intensive system of management.
2.1.3 Low Country Wet Zone
Low country wet zone lies between 0 m-450 m above sea level and the ambient temperature ranges between 29C°-38C°. The farmers, involved in dairy production pursue their other farming activities too. They mainly grow paddy, vegetables and other home garden crops. The main cattle feed sources are post harvest crop fields and home grazing plots. Here pure Indian breeds or their cross breeds are reared under intensive or semi-intensive management system.
2.1.4 Dry Zone
The elevation of the dry zone varies from 0 m-450 m from the sea level and the average ambient temperature is between 21C°-35C°. Two thirds of the national cattle population are found in the dry and the dry intermediate zones of Sri Lanka but the milk production is relatively low. The cattle breeds are predominantly Zubu, Sahiwal cross-bred cattle,
8

improved buffalo and indigenous breeds. Farmers here mainly practice the extensive management system and cattle are not fed with concentrate feeds. Animals generally graze in the scrub jungles and other grasslands. Most of the farmers practice zero input production system and the average herd size varies from 25-100. Normally, the average daily milk production varies from 1-2 litres/cow. In the dry zone, the seasonal availability of grass can be seen and straw feeding is a mostly common practice.
2.1.5 Coconut Triangle
The coconut triangle spreads 0 m-450 m from the sea level and the average ambient temperature is between 24C°- 29C°. The main feature in cattle rearing is that the animals are grazed under coconut palms. Animals have a dual role in controlling weeds in the gardens and providing manure to the coconut palms. The breeds, which can be found in this region, are European and Indian crosses, especially Sahiwal, Friesian or Jersey crosses. The average daily milk production is about 4 litres/cow. Animals with European genetic composition normally give a higher yield. They mostly practice the semi intensive type of management system. Animals are fed with considerable amounts of concentrate. Buffaloes are also reared in the coconut triangle and the milk is generally converted to curd to meet the local demand.
2.1.6 Jaffna Peninsula
The elevation varies from 0 m-450 m above the sea level and the average temperature is around 28 C°. In the Jaffna peninsula there is a special management system in line with the cultural functions of the Jaffna peninsula farmers. The animals are Indian crosses and local breeds. The nutritional condition of the animals is higher than in any other region of the country. They feed the animals with homestead grasses and post harvest crop residue. The kitchen refuse as well as other feeds consumed by people are also fed to animals which receive special attention of the farmers. The herd size varies from 3-50/farm.
2.2 Cattle and Buffalo Population
The total cattle and buffalo population in Sri Lanka was around two million in the year 2002. According to the statistics, the cattle population is three times higher than the buffalo population in Sri Lanka
Table 2.2 Cattle and Buffalo Population of Sri Lanka, 2002
Regions Catt le % Buffalo % Wet Zone 238 ,700 29.7 93 ,500 24.1 Wet Intermediate 170,000 21.1 55,800 14.8 Dry Intermediate 394,900 49.1 225 ,800 60.1 Total 803,600 100.0 375 ,100 100.0
Source: Sri Lanka Livestock Statistics (2003)
Two thirds of the population is scattered in the dry and the dry intermediate zones and 1/3 in the wet zone. When one considers the milk production, 2/3 of the production comes from the wet zone, and 1/3 from the dry and dry intermediate zones of Sri Lanka.
9

Buffalo population is less in the wet zone, while the majority of the buffalo herds can be seen in the dry intermediate zone.
Table 2.3: National Herd Composition, 1998-2003
Neat Cattle
N u m b e r 1998 1999 2000 2001 2002 2003
Milk at present 219,300 221,700 213,600 214,600 207,110 211,800 Milking not at present 283,800 286,800 280,400 281,000 271,124 277,400 Other cows 225,200 223,700 210,300 210,200 202,890 207,600 Bulls 187,500 180,300 180,000 181,100 174,733 178,800 Calves 262,600 269,000 263,300 266,400 257,091 263,100 Total Cattle 1,178,400 1,191,500 11,476,001 1,153,200 1,112,948 1,138,700 %of milking cows
18.6 18.6 18.6 18.6 18.6 18.6
Source: Revised Series of Annual Estimates Based on Census of Agriculture, 2002 (www.statisticgov.lk')
Fig. 2.1: National Herd Composition, 1998 - 2003
1.22 i
1.06 -I , , , , , 1998 1999 2000 2001 2002 2003
Year
Source: Revised Series of Annual Estimates Based on Census of Agriculture (www.statisticgov.lk)
The table 2.3 describes the national herd composition during the period 1998-2003. According to the table, although the total cattle population registered a drop during the last 5 years, the percentage of milking cows remained unchanged.
Table 2.4: Cattle and Buffalo Population in the Kurunegala District, 1997-2C 02
Year Cattle Buffalo Total 1997 202,500 152,000 354,500 1998 198,000 142,700 340,700 1999 200,900 141,600 342,500 2000 198,400 142,500 340,900 2001 193,900 119,800 314,700 2002 192,300 118,700 311,000
Source: Livestock Statistics, Ministry of Agriculture, 2002
10

Table 2.4 reveals a slight decrease in the total number of cattle and buffalo populations in the Kurunegala district. The last five years, have marked a downward trend in the number of cattle or buffaloes.
2.3 Types of Feeds
Two types of feeds are used in milk production, namely roughage and concentrates. Roughage can be divided into two main types which are pasture and fodder. Roughage mainly consists of structural carbohydrates whereas concentrates consist of readily available soluble carbohydrates.
In domestic milk production, the main influencing factor is the quality and the quantity of the available feeds. The feed resources, which farmers use, are natural grasslands and weeds which do not supply the nutrient needs for higher level of milk production. The natural vegetation, especially the grasses are low in digestibility. Crude protein content and dry matter production is low during dry months of the year and most of the up graded cows do not achieve their genetic potential due to inadequate feeding. They need an year round supply of quality forages to obtain a high level of production.
2.3.1 Roughage
Roughage can be divided into 2 types such as pasture and fodder. The production is mainly influenced by the quality and the quantity of the available roughage. The feed resource farmers' use to feed their animals is cultivated pasture and fodder, natural grassland grasses, fodder and roadside weeds. The organized large scale farmers cultivate grasses, but most of the small scale and medium scale farmers mainly depend on natural grass, land grass and road side weeds and fodder available in their own lands. Inefficient feeding management has contributed to drop in the supply of the necessary nutrition for high level of production. Most of the time the naturally available grasses are low in digestibility, less in crude protein content and lower in dry matter production
The natural grasses and fodder are inadequate to meet the essential nutrition required for lactating cows. In the dry period of the year, the natural grasslands run dry depriving the animals of the year round good feeding of pasture and fodder for a higher level of production.
Table 2.5: Locations and Areas of Natural Grazing Lands in Sri Lanka Location Hectares
Dry zone (non irrigated) 400,000 Coconut plantation 140,000 Hill country patna lands 55,000 Fallow paddy fields 30,000 Homestead gardens 20,000 Road sides/Railway embankments etc 5,500 Others 5,000 Total area 655,500 Source: Ebrahim et al 1999
11

Natural grasses are mostly available in the dry zone and dry intermediate zone of Sri Lanka which account for the highest cattle and buffalo population in Sri Lanka.
In a country where agriculture is the mainstay, a large amount of crop residues and grain refuse are available for the cattle. The crop residues produced per year is 5.8 million metric tons. Of this, 4.5 million are in the form of straw; a residue of paddy, which is the main crop grown by the majority of the farmers. Other than rice straw, maize, cowpea, millet, black gram and soybean are also considered as providing principle crop residues to the small holder dairy farmers as substitute to the natural pasture and fodder (Rajaguru, 2004).
According to table 2.5, the second highest available natural grasslands are under coconut plantations. In Kurunegala district, most of the farmers depend on them, allowing their cattle to graze under coconut lands which form the main source for the cut and feed system also.
2.3.2 Concentrates
Concentrates provide a high amount of soluble carbohydrates, needed for higher production of milk. Soluble carbohydrate is essential to increase the rumen microbial population, which helps to digest the complex carbohydrate. At present, several private sector companies produce and market concentrates island wide on a commercial scale but such large-scale feed producers are only a few. These companies import several feed ingredients to produce the compounded feeds. For the importation of the ingredients, the companies have to pay more taxes, rendering the compounded feed prices generally high. Ninety eight percent of the total compounded feed produced is used for poultry and the rest for cattle and swine feed (Livestock Statistics, 2003). Other than compounded feed, rice bran, coconut, poonac and molasses are the main sources of concentrates used in dairy production and the amount available is 40,000 tons. The estimated annual rice bran production is 70,000-90,000 tons, but due to inefficient milling methods, the amount of rice bran, available for use annually is 25,000 tons (Ibrahim, et al, 1999). Soya bean hull, oil seed meal, cotton seed meal and limited quantities of gingerly cake are also used as concentrate feeds.
2.4 Milk Production and Marketing
The milk production depends specially on breed type, management practices, climatic conditions, and other related factors. Marketing of milk in Sri Lanka is mainly determined by the policy activities taken by the government.
2.4.1 Production
The domestic milk production has increased gradually from 1992 to 2002, but an increase in the heads of the cattle is not observable. Table 2.3 reveals that the percentage of milking cows has been constant during related period. The slight increase of the milk production can be attributed to the existing herd improvement and management programmes.
12

Table 2.6: Annual Total Milk Productions, 1992-2002 (Million litres)
Year C o w milk Buffalo milk Total
1998 147.38 29.7 177.1 1999 149.68 30.1 179.9 2000 151.24 30.2 181.5 2001 152.76 30.2 183.0 2002 156.55 30.3 183.2 2003 152.84 30.2 186.8 2004 159.69 30.6 190.1 2005 161.82 30.9 192.7
Source: Census and Statistics Revised Data, 2005
With the increase which is almost negligible, the present production supply is only around 15%-20% of the domestic demand. The balance of the national requirement is fulfilled by the importation of milk and milk based products, the majority of which was imported in powdered form.
From 1993 to 2003, the quantity of imports marked a drastic increase involving a heavy foreign exchange component. But, successive governments implemented several policy measures with no significant increase in the dairy development including milk production during the last decade.
Table 2.7: Milk Production of Kurunegala District in 1998-2002
Year Cow milk Buffalo milk Total milk (litres) (litres) (litres)
1998 1,555,900 305,900 1,861,800 1999 1,610,300 293,200 1,903,500 2000 1,640,800 307,700 1,948,500 2001 1,624,000 287,100 1,911,100 2002 1,707,000 375,300 2,082,300
Source: Sri Lanka Livestock Statistics, Ministry of Agriculture, 2003
According to table 2.7, the total milk production of Kurunegala district slightly increased during the period of 1998-2002 following the introduction of high yielding animals and better management practices. In the year 2002, the share of the milk production in Kurunegala district was 0.59% of the total production in the country. Other reason for this improvement is that the study area has relatively better resources for the dairy activities.
J B R -13
i . K ,1

Table 2.8: Imports of Milk and Cream
Year Quantity (mt)
Value (billion rupees)
1995 47,492 5.2 1996 43,198 5.5 1997 41,902 5.3 1998 54,094 7.1 1999 54,250 7.1 2000 57,083 8.4 2001 52,341 9.6 2002 62,221 9.9 2003 67,941 11.5 2004 54,557 12.3 2005 53,038 12.6
Source: Central Bank of Sri Lanka, 2005
2.4.1.1 Milk Availability per capita
Comparatively low national production coupled with the increasing population has resulted in a low per capita milk production. The total average per capita availability of milk and milk products was 16.08 kg in the year 2003 (Department of Census and Statistics). The recommended per capita milk requirement is 46.35 kg (Ministry of Agriculture, Livestock, Land and Irrigation 2005). In the last decade, there has been no tangible increase in the per capita availability of total milk and milk products.
2.4.2 Marketing
Marketing of milk is the most important activity in dairy farming which determines the economic viability of the industry.
2.4.2.1 Milk Collection and Marketing
The small-scale milk production scattered all over the country. Fresh milk is collected from scattered collection centers. The formal milk collection network consists of public and private enterprises. According to the statistics, the MILCO and the Nestle companies collected much of the production with the Kothmale, CTMU, Araliyakale and other Co-operatives too having a considerable share. The informal milk collection is by these which sell the fresh milk to the neighbours and other institutions such as village boutiques, etc. The private milk collectors also play a major role in the milk procurement mechanism.
On the other hand, a considerable amount of milk is marketed through the informal channels, because of the insufficient coverage of the formal milk collection network and its high costs and quality problems.
14

In this study area, the highest milk production was from Kurunegala VS range which belongs to the WZ of the Kurunegala district. The farmers have observed intensive management practices and reared improved cross-breeds. The second highest production was observed in Pannala VS range (Progress Report, 2004, North Western Province, Department of Animal Production and Health).
Milk collecting centers in Kurunegala district, numbered 447 and was scattered over the district. The main collectors were MILCO, Nestle, and CTMU, followed by the other collectors such as Araliyakele, the Fisheries Ministry, and Co-operative Societies which also purchased a considerable amount of milk in Kurunagela district. MILCO is the leading milk collector in the study area and their collecting centers are spread over all the other VS ranges except Pannala. In Pannala VS range, there is a milk-processing center owned by Nestle Pvt (Ltd) with a strong collection network in the area. The CTMU is also involved in milk collecting activities in this VS range (Progress Report, 2004, North Western Province, Department of Animal Production and Health).
2.4.2.2 Pricing Mechanism of Milk
The fresh milk price is mainly determined by fat and solid non-fat (SNF) content in the milk. Procurement of small quantities of milk from a large number of small farmers may be a constraint in the adoption of quality standards, although the testing of milk for fat and SNF is widespread in the industry. The average nominal price for farm milk (4.3% fat, 8.4% SNF) was set at Rs.10.54 litre in 1994 (Ibrahim et al, 1999). At present, the average purchasing price of milk varies from Rs.16 to Rs.20 with MILCO. Price appears to vary depending on the market competition, the government policies and milk collectors.
At the time of the research, the guaranteed milk price was around Rs. 16/- litre and the prices paid by different organizations differed. The purchasing price varied from Rs.12/- to Rs.16/- per litre. But, due to a government policy of price revision in 2004, the price of milk was increased up to Rs.20/- per litre.
2.4.3 Milk Consumption per Capita
The annual per capita consumption of milk and milk based products in Sri Lanka (about 36 kg) is quite low, as compared to that of some of the other countries in South Asia like Pakistan (122.8 kg) and India (69.2 kg). Nevertheless, the level is marginally higher than the average for developing countries (32.9 kg) and close to the Medical Research Institute recommended level of 41.6 kg. The average monthly expenditure on milk and milk products is relatively low and even lower in rural households than in the urban and estate sectors. The rural population's demand for milk is more sensitive to income than here in other sections (Ibrahim et al, 1999).
2.5 Government and Non Governmental Institutions in Livestock Sector
The institutions, functioning in the livestock sector, are the state sector, the public enterprises, the co-operative sector and the private sector. The smallholder livestock
15

farmers are scattered all over the country. The majority of the dairy farmers of the study area were at the lower end of the socio-economic scale. The following institutions are responsible for managing different functions in the livestock sector of Sri Lanka.
2.5.1 State Sector
Institution Function Ministry of Agriculture and Development (MAD)
Policy formulation, resource mobilization, monitoring and evaluation of progress and programmes
Department of Animal Production and Health (DAPH) Peradeniya, and affiliated bodies such as Veterinary Research Institute (VRI), Veterinary Hospital, etc
Technical support for policy implementation, animal health and disease control systems, veterinary research, production of vaccines, technical support for animal breeding, enforcement of laws and regulations, human resources development and training, monitoring and evaluation and dissemination of information.
Provincial Department of Animal Production and Health (Provincial DAPHs)
Policy/programme implementation through field veterinary units with an emphasis on animal health and breeding, extension services through farmer contact and limit training, Provincial level planning and programme implementation, implementation of special projects determined at the central level and provincial level
Faculty of Veterinary Medicine and Animal Science, University of Peradeniya
Academic degrees for development of higher level expertise and skills for the livestock industry, livestock related research and dissemination of information.
Seven Agricultural Faculties in the Universities
All faculties incorporate Department of Animal Science responsible for degree courses in a wide range of livestock relate disciplines
Source: Ministry of Agriculture and Development
2.5.2 Public Enterprises (Prostates)
Institution Function National Livestock Development Board (NLDB)
Breeding and supplying improved varieties of livestock to farmers, trainings related to livestock farming, to selected groups of youth
MILCO Procurement and processing of milk and production of value added milk products, institutional support for dairy farming sector.
Mahaweli Livestock Enterprise, of Mahaweli Authority of Sri Lanka
Promotion of livestock farming among settler communities through maintenance of cattle and goat farms for multiplication and distribution
Source: Ministry of Agriculture and Development 16

2.5.3 Co-operative Sector
Institution Function Various Co-operative Societies including MILKFED
Promotion of procurement of milk and value added milk products, welfare schemes for members
Source: Ministry of Agriculture and Development
2.5.4 Private Sector
Institution Function Dairy industry: Nestle Lanka Ltd., Kotmale Dairy, Nelna Farm, Ariyakelle Farm, Richdale Dairy, Lanka Milk Foods Ltd., etc.
Procurement and processing of milk, packaging and marketing of milk products
Dairy Development Milk Procurement and Processor's Association (DDMPPA)
Acts as a representative of producer interests and active in the promotion of product quality and farm gate prices
Animal feed industry: Master Feeds, New Bernards, Nutrena Feeds, Prima
Manufacture and market animal feeds
Source: Department of Agriculture
2.6. Veterinary Services
The Department of Animal Production and Health is responsible for research in animal production, disease identification, vaccination and technical support for animal breeding, human resources development and training, monitoring and evaluation, and dissemination of information. Those functions are mainly carried out through the Veterinary Research Institute (VRI).
Policy planning and implementation, dissemination of the technical know-how to the farmers, conducting the vaccination and breeding programmes and management of other dairy activities at provincial level, come under the purview of the Provincial Department of Animal Production and Health.
All these programmes are basically conducted by the officers attached to the livestock sector under the supervision of the Veterinary Surgeons and other higher-level officials in the livestock sector.
2.7 Extension and Training Services
The state extension sector plays a key role in the development and management of the livestock sector in the country. The extension and training services, offered by the government, is mainly through a Veterinary Surgeon (VS) and Livestock Development
17

Instructors (LDI). They disseminate knowledge and advice and offer relative training to the farmers.
In addition to the government sector, the private sector, the collectors and the cooperative sector also provide extension and training and disseminate new knowledge to the livestock farmers. The CTMU, the Nestle, and the Kothmale are the leading organizations involved.
These public and private sector extension services are pivotal, but are not accessible to the smallholder dairy farmers in the rural areas.
2.8 Breeding and Insemination Services
The Department of Animal Production and Health is responsible for the continuous breeding programmes to improve the dairy industry. At present, most of the farmers follow the artificial insemination method to upgrade their animals. Artificial insemination increases the genetic standards of the national herd.
Two semen production units are located at Kundasale in the Central Province and Polonnaruwa in the North Central Province to produce most of the semen for insemination of cattle in Sri Lanka. Both are equipped to produce deep frozen semen (DFS) and chilling semen (CS).
Production of semen in Pollonnaruwa is limited to small amounts of fresh semen (Ibrahim et al, 1999) while the unit at Kundasale mainly supplies the semen requirements for Kurunegala district.
Table 2.9: Number of Artificial Insemination (AI), Pregnancy Diagnosis (PD),
Year AI PD AI calves 1992 66,901 9,441 7,684 1993 73,516 8,105 1,186 1994 83,077 11,555 12,207 1995 95,135 14,242 13,592 1996 109,008 20,060 16,183 1997 115,418 22,152 21,245 1998 122,480 26,105 27,409 1999 116,720 23,769 27,318 2000 131,389 44,286 37,891 2001 134,919 51,715 41,372 2002 125,719 40,614 40,928
Source: Department of Animal Production and Health
Artificial insemination by using DFS or chilling semen (CS) is done by the LDI concerned in the veterinary range. The expansion of the AI services through-out the country would contribute to an increasing milk production potential of the national herd. The number of AIs has doubled by 2002 and consequently this method of breeding has become popular even in the remotest parts of Sri Lanka.
18

Chapter Three
SOCIO - ECONOMIC BACKGROUND OF THE DAIRY FARMERS
Socio-economic characteristics such as family composition, education level, income sources and income level, labour and land usage of selected farmers in the study area are briefly discussed in this chapter. The data collected from the sample survey is utilized to have an understanding of the socio- economic characteristics of the sample farmers according to the type of farm management and ecological zone.
3.1 Demographic Characteristics of the Sample
Out of the 240 farm families selected for this study sample, 120 families were from the intermediate zone, 80 from the wet zone, and 40 from the dry zone in Kurunegala district. The total population of the sample is 1,075 with 523 males and 552 females. The family size ranges from 1 to 8 members with an average of 4.48. Family size has a slight difference according to the ecological zones; as the average family size of the wet zone is 4.8%, dry zone is 4.2% and intermediate zone is 4.34%. In the sample of the 240 householders, 231 respondents are males and the rest are females.
As indicated in the Fig. 3:1, a considerable number (35%) of dairy farmers belong to the 40 <=50 age group. The proportion of farmers below 30 years of age (8%) signifies that the involvement of the younger generation in dairy farming is relatively low.
19

Fig. 3.2: Education Levels of the Farmers
Graduates No Schooling
Passed G.C.E. (O/L) 3 0 %
Passed G.C.E. (A/L) 8 %
Secondary Education
Primary Education
4 7 %
1 3 %
Source: Survey Data, 2004
3.2 Educational Levels of the Farmers
As indicated in fig. 3.2, 47% of the farmers in the sample population have received education up to the secondary level. Of the rest, 30% have passed the G.C.E. O/L, (General Certificate of Examination) and 8% have passed the G.C.E. A/L (General Certificate of Examination) and 1.25% have reached the degree level in learning. Two farmers have not received any schooling at all.
According to the survey results, a connection emerges between the education level of the farmer and the system of cattle management they resorted to. It is clear that the farmers who have substantial educational attainments such as the G.C.E. (A/L) or a degree or diploma tend to practice intensive or semi-intensive management systems. In the sample, almost all the farmers with such educational qualifications practice intensive and semi-intensive cattle management systems.
3.3 Family Income and Source of Income
All sources of income from primary and secondary occupations of all the family members were considered for the estimation of family income. The estimated average gross monthly income was based on the seasonal family income. For this purpose, data were collected from May 2003 up to May 2004.
20

Fig. 3.3: Level of Monthly Household Gross Income (Rs)
0<=1,250 1,250<=3,000
10,000<=25,000 45.4%
Source: Survey Data 2004
According to fig. 3.3, a higher proportion of farmers (45%) receive a monthly income ranging between Rs.l0,000-Rs.25,000. The lowest income was Rs. 1,200, while the highest income was Rs.86,050 and 5% of the selected farmers received a monthly income of below Rs.3,000. A considerable percentage (8%) of dairy farmers received a monthly income of over Rs.25,000.
Table 3.1: Distribution of Cattle Farmers According to the Level of Monthly Household Gross Income
Level of Month ly Household Gross
Income (Rs.)
W e t Zone Dry Zone Intermediate Zone Level of Month ly Household Gross
Income (Rs.) No. % No. % No. %
0<= 1,250 1 1.25 3 - - -1,250<=3,000 2 2.50 3 7.50 6 5.00 3,000<=5,000 4 5.00 8 10.00 10 8.30 5,000<=10,000 27 33.75 16 40.00 35 29.16 10,000<=25,000 41 51.25 12 30.00 56 46.66 >25,000 5 6.25 1 2.50 13 10.83 Total 80 100 40 100 120 100 Source: Survey Data, 2004
Table 3.1 shows the distribution of family incomes relating to the ecological zones. Accordingly, most of the households receive an income ranging from Rs. 10,000-Rs.25,000 in the wet and intermediate zones while it is Rs 5,000-Rs. 10,000 in the dry zone. Majority (57% - same in wet and intermediate zones) of farmers in wet and intermediate zones receive a gross monthly income above Rs. 10,000. But, it is only 32.5% in the dry zone. The main reason for this is that a larger proportion of family members in wet and intermediate zones are engaged in government and private sector income earning activities compared to those at the dry zone.
21

Table 3.2: Composition of Average Annual Household Gross Income by Sources of Income
Sources of Income W e t Zone Dry Zone Intermediate Zone
Total Sources of Income
Amount (Rs.) % Amount
(Rs.) % Amount (Rs.) % Amount
(Rs.) %
Paddy- 7,610 5.0 10,296 9.2 19,778 10.8 14,142 8.8
Minor Export Crops 1,360 0.9 358 0.3 5,393 3.0 3,209 2.0
Other Crops 22,268 14.7 11,706 10.4 27 ,738 15.2 23,243 14.5
Government Employments 28,557 18.8 10,391 9.2 17,376 9.5 19,939 12.4
Private Sector Employments 18,004 11.9 8,900 7.9 22 ,475 12.3 18,722 11.7
Agriculture Labour 3,337 2.2 750 0.7 1,790 1.0 2,132 1.3
Non-Agriculture Labour 2,625 1.7 3,615 3.2 2,208 1.2 2,581 1.6
Skilled Employment 2,325 1.5 4,290 3.8 4 ,350 2.4 3,665 2.3
Self Employment 8,268 5.5 4,215 3.7 7,853 4.3 7,385 4.6
Foreign Employment 4,500 3.0 2,700 2.4 966 0.5 2,433 1.5
Hiring Agriculture Implements 3,175 2.1 1,225 1.1 5,366 2.9 3,945 2.5
Pensions/ Rents 7,255 4.8 187 0.2 5,692 3.1 5,295 3.3
Government Subsidies 0 0.0 5,547 4.9 0 0.0 924 0.6
Samurdi 1,054 0.7 3,681 3.3 1,828 1.0 1,879 1.2
Other Subsidies 450 0.3 0 0.0 260 0.1 280 0.2
Milk 33,989 22.4 34,257 30.5 44,401 24.3 39,240 24.4
Other Income from the cattle management 5,855 3.9 3 ,715 3.3 3,571 2.0 4,356 2.7
Other Livestock (excluding cattle management) 233 0.2 6,650 5.9 5,374 2.9 3,873 2.4
Others 812 0.5 0 0.0 6,150 3.4 3,345 2.1
Grand Total 151,677 100.0 112,483 100.0 82,569 100.0 160,588 100.0
Source: Survey Data, 2004
Table 3.2 indicates the average annual household gross income by sources of income which reflects that the income derived from cattle management provides the largest contribution to the average family income. It is higher in the dry zone compared to those of the others. In the dry zone, income from cattle management represents 34% of the average annual household gross income while it was 26% in the wet and the intermediate zones. The contribution from government employments to the average annual household gross income is relatively higher in the wet zone. In the wet zone, it is 19% while it was 9% in the dry and the intermediate zones. Income derived from other crops occupies the second place in the dry and intermediate zones as 20% and 15% respectively, while in the wet zone it drops to the third place as 15%. According to the survey results, the majority of the farmers (54%) practice cattle management not as their mainstay. Farming, state and private sector employments represent a considerable percentage as main employments.
22

3.4 Pattern of Labour Use
Dairy farming being a highly labour intensive industry, the family labour is heavily used in every management system (intensive, semi-intensive and extensive) as indicated in table 3.3. The majority (95%) of the farmers use only family labour in all operations in dairy farming. The proportion of farmers who use only hired labour is negligible. In the sample, the majority of the farmers pursue small and medium scale industries which they could manage only with family labour.
Table 3.3: Pattern of Labour Used for All Operations of Cattle Management by Type
Pattern of L a b o u r used Intensive Semi-Intensive Extensive Total
Pattern of L a b o u r used No . of Farms
% No. of
Farms
% No. of
Farms
% No. of
Farms
%
Family Labour only 26 92.9 200 96.2 3 75.0 229 95.4
Hired Labour only 0 0.0 1 0.5 0 0.0 1 0.4
Family +Hired Labour 2 7.1 7 3.4 1 25.0 10 4.2
Grand Total 28 100.0 208 100.0 4 100.0 240 100.0
Source: Survey Data, 2004
3.5 Pattern of Land Use
To have an understanding of land use, the data were collected using different categories such as land type, holding pattern, size, etc.
Table 3.4 indicates the distribution of highlands according to the size, different ecological zones and systems of cattle management. The data reveal that the majority (59%) of the farmers in the wet zone operate on a holding of one acre or below. A large proportion of the farmers in the wet zone work on highland ranging between 0.25-0.5 ac. A majority of farmers in the dry and the intermediate zones operate on highland over one acre (dry zone - 78% and intermediate zone - 57%). A considerable number of farmers both in the dry and the intermediate zones operate on highland in extent of 1 -2 ac (dry zone 38% and intermediate zone - 26%).
A comparison between the operational highland size and the cattle management system brings out clear differences. A large proportion of farmers who practice the intensive system operate on highland, the extent of which ranges between 0.5-01 ac, while it is 2-5 for the semi-intensive system and 1-2 for the extensive system.
23

Table 3.4 Operational Extent of Highland (including home gardens) Classified by Agro - Ecological Zones and Types of Cattle Management
Size of low land
Wet zone Dry zone Intermediate zone
Size of low land 1
No. 2
No.
Total 1
No. 2
No. 3
No.
Total 1
No. 2
No. 3
No.
Total Size of low land 1
No. 2
No. No. %
1 No.
2 No.
3 No. No. %
1 No.
2 No.
3 No. No. %
Not oper.
Land - 3 03 3.75 - - - - - - 1 - 1
0.83
0<=0.25 2 12 14 17.5 - 1 - 1 2.5 - 8 1 9 7.5
0.25<=0.5 1 16 17 21.25 - 2 - 2 5 1 14 - 15 12.5
0.5<=1 1 15 16 20 2 4 - 6 15 6 21 - 27 22.5
1<=2 2 6 08 10 2 11 2 15 37.5 4 27 - 31 25.8
2<=5 1 14 15 19 1 10 - 11 27.5 4 25 1 30 25
5< - 7 07 9 1 4 - 5 12.5 - 7 - 7 5.8
Total 7 73 80 100 6 32 2 40 100 15 103 2 120 100 Source: Survey Data, 2004 Type of cattle management in DZ, WZ and IZ
1. Intensive 2. Semi- intensive 3. Extensive
According to table 3.5, a majority of farmers in all the zones operate on low (paddy) land of one acre or below. The farmers who do not operate on paddy land too amount to a considerable percentage. It is 30% in the wet zone, 20% in the dry zone and 25% in the intermediate zone. The largest proportion of farmers in the wet and the intermediate zones (wet-19% and intermediate-25%) operate on low land ranging between 0.5 -1.00 ac. Corresponding figures for the dry zone are 1.00 ac.-2.00 ac.
Table 3.5: Operational Extent of Lowland, Classified by Size, Agro - Ecological Zones and Types of Cattle Management.
Size of low land
Wet zone Dry zone Intermediate zone Size of low land 1
No. 2
No Total 1
No 2
No. 3
No. Total 1
No. 2
No. 3
No. Total
Size of low land 1
No. 2
No No %
1 No
2 No.
3 No. No. %
1 No.
2 No.
3 No. No. %
Not oper.
Land 0 24 24 30.0 2 6 0 8 20.0 5 25 0 30 25.0
0<=0.25 1 4 5 6.25 0 1 0 1 2.5 1 5 0 6 5.0
0.25<=0.5 3 9 12 15.0 1 8 0 9 22.5 4 14 0 18 15.0
0.5<=1 1 14 15 18.75 1 6 1 8 20.0 2 28 0 30 25.0
1<=2 0 12 12 15.0 2 7 1 10 25.0 2 16 1 19 15.8
2<=5 2 8 10 8.0 0 4 0 4 10.0 1 14 1 16 13.3
5< 0 2 2 2.50 0 0 0 0 0 0 1 0 1 0.8
Total 7 73 80 100.0 6 32 2 40 100.0 15 103 2 120 100.0
Source: Survey data - 2004 Type of cattle management in DZ, WZ and IZ
1. Intensive 2. Semi- intensive 3. Extensive
Different land holding patterns can be identified in the selected sample. Most of the highlands and the paddy lands feature single ownership, 87% and 69% respectively. The remaining 13% of high land area is under different holding patterns such as jointly owned (9%), encroached (2%) and lease and other (2%). The remaining of the 31% of the paddy land area is distributed as rented (ande) - 21%, jointly owned - 8% and cumulatively leased and mortgaged - 2%.

Chapter Four
DAIRY FARMING SYSTEM OF THE STUDY AREA
The main focus of this chapter is directed to a discussion on breeds, herd characteristics, dairy management systems, feeding patterns, milk production and marketing, livestock services such as veterinary service, disease control, extension, and breeding programmes in the study area. The data collected from the sample population were utilized to examine the situation of dairy farming in the study area.
4.1 Type of Breeds
European breeds, European Indian crosses and local crosses were identified as common breeds in the study area.
Table 4.1: Cattle Population by Breed Type in the Study Area
Breed type Wet zone Dry zone Intermediate
zone Total
Breed type No % No % No % No %
Sahiwal 34 18.5 11 8.7 26 8.3 71 11.4 Sindhi 2 1.1 2 1.6 5 1.6 9 1.4 Friesian 35 19.0 13 10.3 58 18.5 106 17.0 Jersey 80 43.5 61 48.4 166 52.9 307 49.2 Hariana 0 0.0 1 0.8 3 1.0 4 0.6 Khillari 0 0.0 0 0.0 1 0.3 1 0.2 Ayrshire 0 0.0 0 0.0 1 0.3 1 0.2 AMZ 0 0.0 1 0.8 1 0.3 2 0.3 AFS 2 1.1 0 0.0 2 0.6 4 0.6 Short horn 0 0.0 1 0.8 1 0.3 2 0.3 Imported cross breed 11 6.0 2 1.6 21 6.7 34 5.5
Local x imported breeds
5 2.7 0 0.0 2 0.6 7 1.1
Unidentified cross breeds
3 1.6 22 17.5 7 2.2 32 5.1
Local 12 6.5 11 8.7 18 5.7 41 6.6 Total 184 100.0 126 100.0 314 100.0 624 100.0
Source: Survey Data, 2 0 0 4
There are 624 heads of cattle in the sample population of the 240 families. The dominant breed type is Jersey which is considered as a heat resistant breed and it represents 49.2% of the total sample. The second highest available breed (17%) in the area was Friesian. The highest Friesian population was found in the wet zone, which
25

provides the suitable environmental conditions for Friesian cattle. The Sahiwal breed represents 11.4% of the sample population. Other than the above-mentioned pure breeds, Jersey Friesian, Jersey Sahiwal and Friesian Sahiwal crosses also account to 5.5% of the total sample population. The local breed population in the sample population was around 6%.
Table 4.2: Average Milk Yield in the Cattle Population by Breed Type
Breed Type Milk Yield
Breed Type Litre/day Range (litre/day)
Jersey 5.56 (2-14) AFS 6.50 (5.9) Short horn 6.50 (5-8) Jersey Frisian 6.48 (2-13) Jersey Sahiwal 7.14 (4-12) Freisian 6.22 (3-16) Friesian x Sahiwal 6.00 (5-7) Sahiwal 5.67 (2-8) Ayarshire 5.62 (2-12) Sindhi 5.50 (5-6) Local Jersey (Jersey x local) 4.55 (2-6) Local Sahiwal (Sahiwal x local) 4.00 (3-5) Hariana 2.5 (2-3) AMZ 2.0 (1-3) Unidentified cross breed 2.0 (1-5) Local 3.26 (1-6)
Source: Survey Data, 2004
The table 4.2 indicates that breeds such as Jersey Sahiwal cross, Jersey Friesian cross, AFS, Khillari and Shorthorn gave the highest milk yield. They produced more than 6 litres/day. The cross-breeds show higher yield potentials than pure breeds. According to the survey, Jersey Sahiwal cross gives the highest average milk production - 7.14 litres/day. Sahiwal, Ayrshire and Friesian Sahiwal crosses indicate a medium potential, yielding more than 5 litres/day. Sindhi and local Jersey averagely produce more than 4 litres/day. The survey data indicate that the local breeds {Batu haraka) produce around 3.14 litres/day in Kurunegala district, with breeds like Khillari and Kangayam giving less than 2 litres/day.
26

Table 4 .3: Average Milk Yields in Different Zones by Breed Type
Breed type Mil k yield (Litre/day)
Breed type Wet Dry Intermediate Sahiwal 5.88 3.36 7.27 Sindhi 6.00 5.00 3.38 Friesian 6.34 6.26 6.08 Jersey 6.35 5.32 5.16 Hariyana - 2.00 -Ayrshire - 6.00 5.33 AMZ - 2.00 2.00 Short horn - 5.00 8.00 Jersey x Friesian 7.93 7.00 5.67 Jersey x Sahiwal 7.75 - 6.00 Friesian x Sahiwal - - 5.67 Local x Jersey - 3.00 5.00 Local x Sahiwal 3.00 - 2.00 Unidentified cross bred 4.17 2.78 4.50 Local 2.96 2.23 4.64
Source: Survey Data, 2004
The breed performances differ in terms of the three climatic zones of Kurunegala district. The table 4.3 depicts that in the wet zone, Jersey Frisian cross and Jersey Sahiwal cross produce a higher yield of around 7.8 litres/day. The pure breeds like Sindhi, Sahiwal and Friesian also give around 6 litres/day. In the dry zone also Jersey Friesian performs the best yielding around 7 litres/day. The table also describes that in the intermediate zone, Shorthorn produce around 8-litres/day the highest yields recorded in the study area.
The data tend to conclude that Jersey, Friesian, Jersey Friesian cross and Jersey Sahiwal cross are suitable breeds for the Wet Zone on the basis of the milk production. Jersey, Friesian, Ayirshire and Jersey Friesian cross give higher yields compared with the other crosses in the Dry Zone. The survey depicts that Sahiwal, Frisian, Shorthorn and Jersey Sahiwal cross are appropriate for the environment condition of the intermediate zone.
4.2 Herd Size
The normal herd size in the coconut triangle is between 5-20 animals, as against the average herd size/household which is 4.8 (Ibrahim et al, 1999). The study data discloses that the average herd size in the wet zone, the dry zone and in the intermediate zone is 6.3, 10.5 and 6.5 respectively. The number of animals/household has slightly increased from the wet zone to the dry zone.
27

Table 4.4: Average Herd Size of the Cattle Farmers Related to the Operational Highland
Size of highland
acres
Wet zone Dry zone Intermediate zone Size of highland
acres No. of
Farmers Average herd size
No. of Farmers
Average herd size
No. of Farmers
Average herd size
No-lands 3 9.3 - - 1 6.0 0-0.25 14 5.1 1 14.0 9 5.3 25-50 17 8.0 2 8.0 15 6.5 0.5-1.00 16 5.7 6 7.0 27 5.9 1.00-2.00 8 7.9 15 13.5 31 6.1 2.00-5.00 15 6.4 11 8.0 30 8.0 >5.00 7 6.1 5 11.8 7 10.9 Total 80 6.3 40 10.5 120 6.8
Source: Survey Data, 2004
There is a considerable relationship between the available land size and the herd size. Four farmers were practicing dairy activities without owning any land at all and they totally depended on roadside grass, fallow paddy field grass and other public property such as grounds, railway sites, lake sites, etc.
The average herd size of the wet zone is 6.3, which is smaller compared with that of the other two zones, as they resorted to a high cost intensive management system. In the dry and intermediate zones, a majority of the farmers were practicing extensive management systems due to the availability of large land extents and low cost breeds. Hence, they can rear a larger herd than those in the wet zone. The dry zone average herd size is relatively higher (10.3). The majority of the farmers were practicing small-scale management systems in the IZ.
Table 4.5: Scale of Operators in the Three Ecological Zones
Size of herd
Wet Zone % Dry
Zone % Intermediate
Zone % Total %
<6 46 58 12 30 69 57 127 53 6-10 23 29 11 27 31 26 65 27 10< 11 13 17 43 20 17 48 20
Source: Survey Data, 2004
28

Fig. 4.1: Scale of Operators in the Three Ecological Zones
6 0
Small Scale
50 A
4 0 H
Medium Scale 30 A Large Scale
20 H
10
v 0
5 3 % 27% 20%
Source: Survey Data, 2004
In the study area, where the herds below six heads of cattle were considered as small-scale herd, the majority (53%) of the reported families were rearing such herds. Herds with 6-10 animals were considered as medium scale herds, and around 27% of the respondent farmers had those herds. A large-scale herd was considered to be a flock with more than 10 cattle and around 20% of the farmers in the study location owned the large scale herds.
4.3 Dairy Management Systems
Three main management systems were identified in the study area and the characteristic features of these systems are detailed below.
4.3.1 Intensive System of Management
The intensive system of management is a high tech, expensive and efficient method in dairy farming. The following salient features are observed in this system: higher level of input per unit of land area, housing indoors and zero grazing (housing is a necessity). A system, under which the animals are given following facilities, is considered as an intensive system of management.
• Cut and feed management, zero grazing and skilled labour. • Housing facilities provided with other necessary inputs within the house.
29
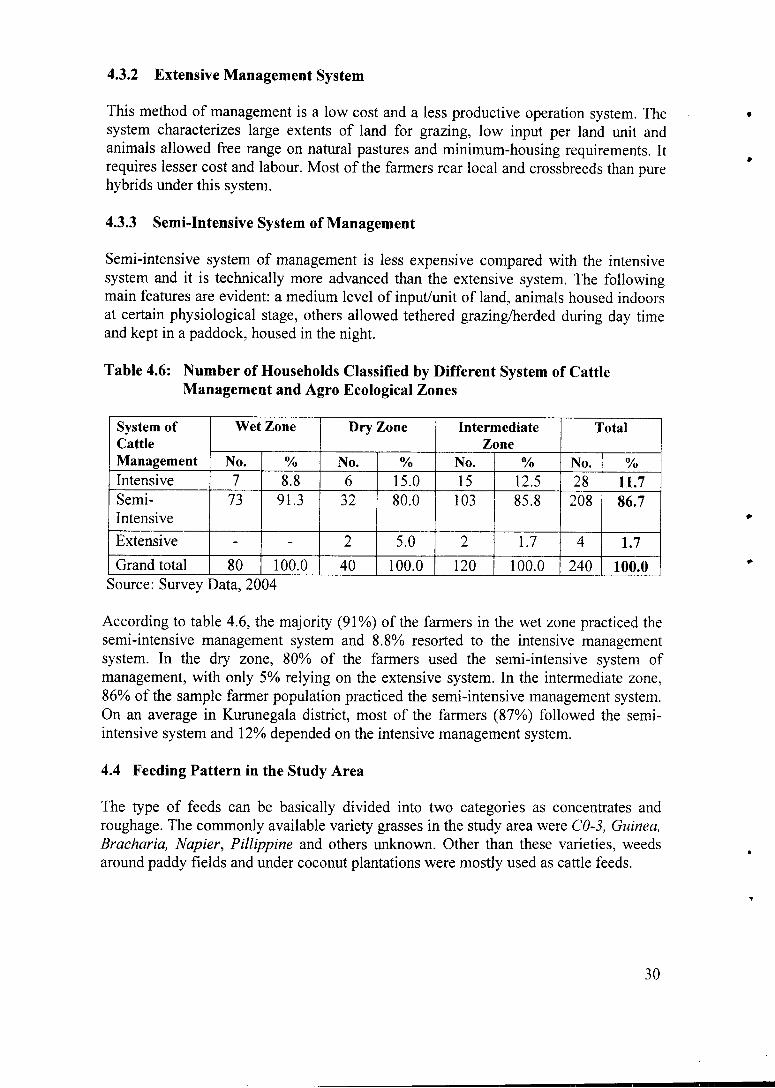
4.3.2 Extensive Management System
This method of management is a low cost and a less productive operation system. The system characterizes large extents of land for grazing, low input per land unit and animals allowed free range on natural pastures and minimum-housing requirements. It requires lesser cost and labour. Most of the farmers rear local and crossbreeds than pure hybrids under this system.
4.3.3 Semi-Intensive System of Management
Semi-intensive system of management is less expensive compared with the intensive system and it is technically more advanced than the extensive system. The following main features are evident: a medium level of input/unit of land, animals housed indoors at certain physiological stage, others allowed tethered grazing/herded during day time and kept in a paddock, housed in the night.
Table 4.6: Number of Households Classified by Different System of Cattle Management and Agro Ecological Zones
System of Cattle Management
Wet Zone Dry Zone Intermediate Zone
Total System of Cattle Management No. % No. % No. % No. % Intensive 7 8.8 6 15.0 15 12.5 28 11.7 Semi-Intensive
73 91.3 32 80.0 103 85.8 208 86.7
Extensive - - 2 5.0 2 1.7 4 1.7 Grand total 80 100.0 40 100.0 120 100.0 240 100.0
Source: Survey Data, 2004
According to table 4.6, the majority (91%) of the farmers in the wet zone practiced the semi-intensive management system and 8.8% resorted to the intensive management system. In the dry zone, 80% of the farmers used the semi-intensive system of management, with only 5% relying on the extensive system. In the intermediate zone, 86% of the sample farmer population practiced the semi-intensive management system. On an average in Kurunegala district, most of the farmers (87%) followed the semi-intensive system and 12% depended on the intensive management system.
4.4 Feeding Pattern in the Study Area
The type of feeds can be basically divided into two categories as concentrates and roughage. The commonly available variety grasses in the study area were CO-3, Guinea, Bracharia, Napier, Pillippine and others unknown. Other than these varieties, weeds around paddy fields and under coconut plantations were mostly used as cattle feeds.
30

Table 4.7: Concentrated Feeding Patterns and Treatments for Common Diseases
Wet Zone Dry Zone Intermediate Zone
Total
Prima 37.5 22.2 33.5 32.5 Broken rice/Rice brand 67.7 64.3 74.7 70.5 Poonac 33.3 15.9 22.5 24.4 Minerals 71.4 64.3 70.3 69.4 Tick treatments 89.1 75.4 92.1 87.9 Worms treatments 78.6 72.2 89.2 82.5
Source: Survey Data, 2004
The compounded feed and tick and worm treatments in the sample population are tabulated in table 4.7. The compounded feeds, very common in the area, were prima, broken rice/rice bran and poonac. The broken rice/ rice bran consumption requested a higher percentage of 70. Next comes prima with around 33% and poonac was used by 24% of the sample population as a cattle feed. The mineral consumption was also found to be at a higher level (69%). The survey results indicate that over 80% of the cattle were given tick and worm treatment.
Around 36% of the interviewed farmers cultivated their own pasture lands. The extent cultivated fell short of the requirements of the animals. Even with their own pasture lands, the farmers had to depend on natural grasslands and other sources too.
The most common pasture variety grown in the study area is Co-3. Bracheria brisantha is also grown on a considerable extent of land. Bracheria resisiensis, Napier, Guinea and Pillipine are the other grass varieties, grown in the study area.
4.5 Livestock Services in the Study Area
The Department of Animal Production and Health is the key state institution in the North Western Province responsible for veterinary services. The functions of the provincial office are policy/programme implementation through field veterinary units with an emphasis on animal health and breeding, extension services through farmer contact and limited training, provincial level planning, and implementation of special projects determined at the centre level. Other than these activities, vaccination programmes were mainly conducted with the help of the Department of the Animal Production and Health.
31

Table 4.8: Pasture Cultivation Maintained by the Cattle Farmers in the Study Area
Type of Pasture W e t Z o n e D r y Zone Intermediate Z o n e Average Zone Type of Pasture No . of
farmers Total
Extent ( A C )
A v e r a g e Extent ( A C )
N o . of farmers
Total Extent ( A C )
A v e r a g e Extent ( A C )
N o . of farmers
Total Extent ( A C )
A v e r a g e Extent ( A C )
N o . of farmers
Total Extent (AC)
A v e r a g e Extent ( A C )
1. CO-3 15 4.76 0.32 15 5.54 0.37 42 18.51 0.44 72 28.81 0.40 2. Guinea 1 0.02 0.02 3 0.76 0.25 4 6.78 0.20 3. Bracharia brisentha
1 0.10 0.10 3 3.25 1.08 4 3.35 0.84
4. Bracharia Rucisiensis
2 0.75 0.38 2 0.75 0.38
5. Napier 1 0.1 0.10 1 0.1 0.10 6. Philippine 1 0.25 0.25 2 0.13 0.07 1 0.01 0.01 1 0.01 0.01 7. Variety not known
4 1 0.25 7 1.38 0.20
Total 16 5.11 0.32 18 5.69 0.32 54 24.38 0.45 88 35.18 0.40 Source: Survey Data, 2004

4.5.1 Diseases Diseases Identified in the Study Area
The veterinary surgeons and LDIs are the personnel responsible for the control and prevention of diseases in the study area. Farmers also relied on indigenous methods of treatment. The diseases in the study area are detailed below:
Table 4.9: Diseases of Cows During the Year 2003
Type of diseases Wet Zone Dry Zone Intermediate Total to the cows Zone
N= 24 N=10 N=27 N=61 No. of No. of No. of No. of cases % cases % cases % cases %
reported reported reported reported Mastitis 13 54.2 1 10.0 9 33.3 23 37.7 Foot and Mouth 2 20.0 3 11.1 5 8.2 Tick/Milk fever 5 20.8 2 20.0 7 25.9 14 23.0 Navel ill 1 3.7 1 1.6 Paralysis 1 10.0 1 1.6 Diarrhea 2 20.0 2 7.4 4 6.6 Leg deformity 1 4.2 1 10.0 1 3.7 3 4.9 Leg paralysis 0.0 2 20.0 2 3.3 Stomach bloat 3 11.1 3 4.9 Worn infections 2 8.3 1 10.0 3 4.9 Eye disease 1 3.7 1 1.6 Wound infections 1 4.2 1 10.0 3 11.1 5 8.2 Parturient diseases 5 20.8 1 3.7 6 9.8 Hemorrhagic 1 3.7 1 1.6 septicemia Loss of appetite 1 4.2 1 1.6
Source: Survey Data, 2004
"N" denotes the number of farmers who reported of diseases and the percentages are based on numbers.
Table 4.9 shows that mastitis is the widespread disease among cows - 38% in the study area and 54% in the wet zone. The tick/milk fever was the second commonest disease among the cows.
Table 4.10 indicates that cattle other than milking cows affected by tick fever were around 26% of the reported cases and wound infections and leg deformity amounted to 14%.
33

Table No. 4.10: Reported Diseases of Cattle (other than cows) During the Year 2003
Type of diseases contacted to the cows
W e t Zone Dry Zone Intermediate Zone Total Type of diseases contacted to the cows
N = 1 5 N =9 N = 1 0 N=34 Type of diseases contacted to the cows
No. of cases
reported %
No. of cases
reported %
No. of cases
reported %
No. of cases
reported %
Foot & Mouth 1 6.7 1 10.0 2 5.9 Tick/ Milk fever 2 13.3 1 11.1 6 60.0 9 26.5 Navel ill 1 6.7 2 20.0 3 8.8 Paralysis 1 11.1 1 2.9 Diarrhea 2 22.2 1 10.0 3 8.8 Leg deformity 3 20.2 1 11.1 1 10.0 5 14.7 Leg paralysis 1 6.7 1 2.9 Stomach bloat 2 13.3 1 11.1 1 10.0 4 11.8 Dewlap edema 1 11.1 1 2.9 Worm infections 1 11.1 1 2.9 Wound infections 5 33.3 5 14.7 Downer cow syndrome
1 11.1 1 2.9
Parturient diseases 1 6.7 1 2.9 Hemorrhagic septicemia
2 13.3 2 5.9
Source: Survey Data , 2004
4.5.2 Extension Services
Extension services were mainly delivered through veterinary related officers in the relevant areas. Farmers also received information from private milk collectors such as the MILCO the Nestle, and the CTMU (Coconut Triangle Milk Union) in Kurunegala. Sharing instructions and knowledge was common among the farmers. Training programmes were arranged mainly with the help of the North Western Province Livestock Development Office. In the year 2004 (January to June) in Kurunegala district, 690 training activities were held - 45 institutional trainings, 200 field days, 253 farmer-training days, 73 farmer seminars and 43 training programmes on milk related industry development. In addition, the provincial office offered to train officers, school children, etc (Monthly Progress Report 2004, North Western Province Livestock Office).
According to table 4.11, the majority of the farmers (80%) received extension services through the government institutions, and the rest from other sources. The data convey that the usage of silage/hay was negligible because the knowledge and technology has not reached the farmers. Despite the fact that 80% of the farmers were exposed to the extension services, they were unaware of the advanced new technologies and other new improved practices in the dairy sector. The main reason for the above constraint is that the officers, who were attached to the Veterinary Surgeon Division, could not take time off their day-to-day routine programmes and other duties. They also have to service a huge number of farmers and cover a large extent of area. The extension services provided by the private sector extension officers mainly focused on marketing of milk rather than on other activities.
34
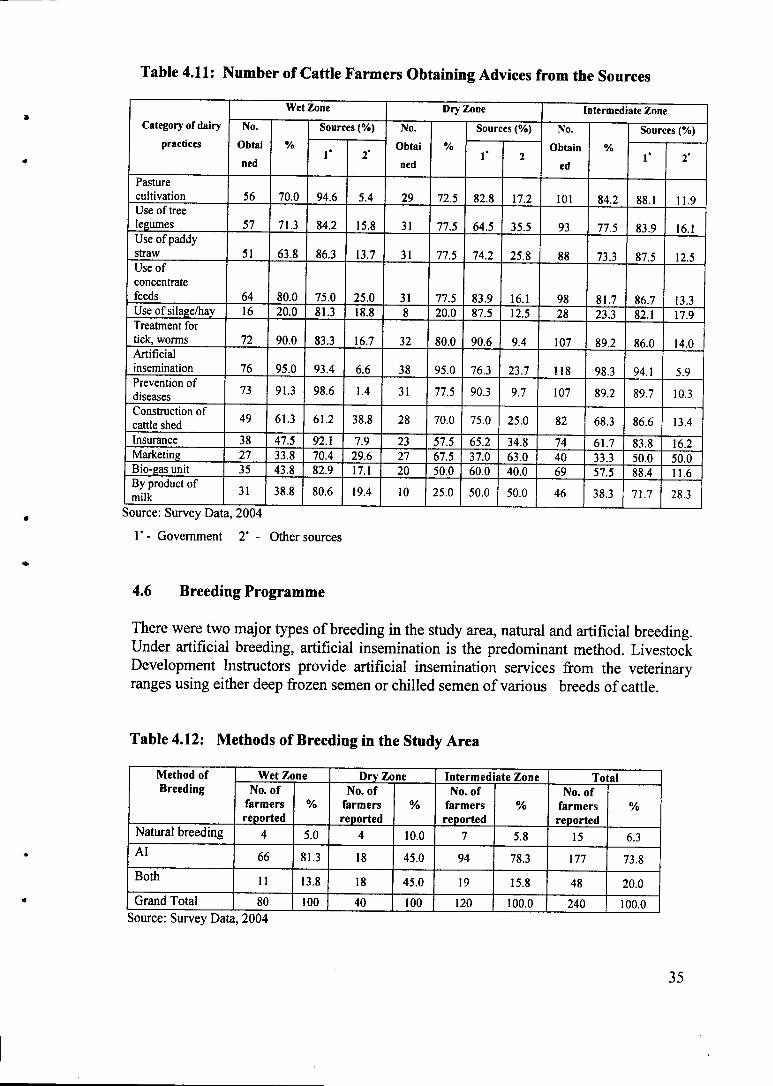
Table 4.11: Number of Cattle Farmers Obtaining Advices from the Sources
Category of dairy
practices
Wet Zone Dry Zone Intermediate Zone Category of dairy
practices No.
Obtai
ned
% Sources (%) No.
% Sources (%) No.
% Sources (%) Category of dairy
practices No.
Obtai
ned
% r 2"
Obtai
ned
% 1' 2
Obtain
ed
% 1" 2'
Pasture cultivation 56 70.0 94.6 5.4 29 72.5 82.8 17.2 101 84.2 88.1 11.9 Use of tree legumes 57 71.3 84.2 15.8 31 77.5 64.5 35.5 93 77.5 83.9 16.1 Use of paddy straw 51 63.8 86.3 13.7 31 77.5 74.2 25.8 88 73.3 87.5 12.5 Use of concentrate feeds 64 80.0 75.0 25.0 31 77.5 83.9 16.1 98 81.7 86.7 13.3 Use of silage/hay 16 20.0 81.3 18.8 8 20.0 87.5 12.5 28 23.3 82.1 17.9 Treatment for tick, worms 72 90.0 83.3 16.7 32 80.0 90.6 9.4 107 89.2 86.0 14.0 Artificial insemination 76 95.0 93.4 6.6 38 95.0 76.3 23.7 118 98.3 94.1 5.9 Prevention of diseases 73 91.3 98.6 1.4 31 77.5 90.3 9.7 107 89.2 89.7 10.3 Construction of cattle shed 49 61.3 61.2 38.8 28 70.0 75.0 25.0 82 68.3 86.6 13.4
Insurance 38 47.5 92.1 7.9 23 57.5 65.2 34.8 74 61.7 83.8 16.2 Marketing 27 33.8 70.4 29.6 27 67.5 37.0 63.0 40 33.3 50.0 50.0 Bio-gas unit 35 43.8 82.9 17.1 20 50.0 60.0 40.0 69 57.5 88.4 11.6 By product of milk 31 38.8 80.6 19.4 10 25.0 50.0 50.0 46 38.3 71.7 28.3
Source: Survey Data, 2004
1 ' - Government 2 ' - Other sources
4.6 Breeding Programme
There were two major types of breeding in the study area, natural and artificial breeding. Under artificial breeding, artificial insemination is the predominant method. Livestock Development Instructors provide artificial insemination services from the veterinary ranges using either deep frozen semen or chilled semen of various breeds of cattle.
Table 4.12: Methods of Breeding in the Study Area
Method of Breeding
Wet Zone Dry Zone Intermediate Zone Total Method of Breeding No. of
farmers reported
% No. of
farmers reported
% No. of
farmers reported
% No. of
farmers reported
%
Natural breeding 4 5.0 4 10.0 7 5.8 15 6.3 AI 66 81.3 18 45.0 94 78.3 177 73.8 Both 11 13.8 18 45.0 19 15.8 48 20.0 Grand Total 80 100 40 100 120 100.0 240 100.0
Source: Survey Data, 2004
35

Around 75% of the farmers, according to the data, reported as practicing artificial insemination only. The natural insemination was practiced only by 7% of the reported farmers. 20% of the total number of farmers resorted to both practices.
Table 4.13: Distribution of Number of Cattle Breeds in Different Zones in the Study Area by Method of Breeding
Method of breeding Wet zone Dry zone Intermediate zone
Total Method of breeding
No. of cattle
% No. of cattle
% No. of cattle
% No. of cattle
%
Natural Breeding (uncontrolled) 10 3.3 1 1.2 3 1.1 14 0.8
Stud services (own bulls) 0 0.0 10 11.9 5 1.9 15 2.8
Natural breeding (other farmers bulls) 0 0.0 15 17.9 17 6.3 32 7.1
Artificial Insemination 174 96.7 58 69.0 244 90.7 476 89.3
Grand total 184 100 84 100 269 100 533 100 Source: Survey Data, 2004
According to the sample population, 533 cattle were inseminated naturally, or artificially in 2004. Out of that, 57 cattle were inseminated using natural methods. Natural insemination was categorized as uncontrolled, using their own bulls, or using other farmers' bulls. The artificial insemination was done using around 90% of the cows in the sample population. The wet zone showed the highest artificial insemination rate in the study area.
Table 4.14: Average Cost for Cattle Breeding in 2003
Wet Zone
Dry Zone Intermediate Zone
Ave.Total
Artificial Insemination (1) No. of times inseminated per cow
2 (1.52}*
2 (1.69)*
2 (1.88)*
2 (1.72)*
(2) Cost per cattle (Rs.) 154.65 210.19 201.81 185.60 (3) % of farms adopted Al 93.8 77.5 88.3 88.3 (4) Cost per farm (Rs.) 358.75 393.26 464.55 416.69 Natural breeding (Control) (1) No. of inseminations per cow
1 (1.0)*
1 (1.1)*
1 (1.3)*
1 (1.2)*
(2) Cost per cow (Rs.) 33.33 26.32 71.75 49.43 (3) % of farms adopted Al 7.5 32.5 13.3 14.6 (4) Cost per farm (Rs.) 50.00 62.50 156.55 96.88
Source: Survey Data, 2004
* Average number of breeding/cow
36

The average cost incurred for cattle breeding in the study area in 2003 is tabulated in table 4.14. Around 89% of the farmers adopted AI for breeding purposes. Majority of the cows were inseminated twice for pregnancy and the rest once, or thrice. There is a slight variation which can be identified relating to the three different region of the study area. The average number of insemination per cow is 1.5, 1.69, and 1.88 in the WZ, the DZ and the IZ respectively. The survey results show that the majority of the cows did not conceive in the first attempt of AI. The total average cost per pregnancy per cow was Rs. 185.60 in the study area; another addition to the total cost of production at the initial period but eventually, it will result in an increase in the milk production at the profit margins.
On an average, a successful insemination needed more than one attempt for conception. Normally the insemination is a basic duty of the LDI. But, his/her wider range of authority renders him/her impossible to attend to this activity on time.
Table 4.14 reveals that only one farmer has adopted the natural controlled breeding method using stud bulls and the number of insemination per cattle was also one. The cost, the farmers incur for this method is also low. Nevertheless are constraints in the lack of availability of genetically up graded bulls in the study area.
The practice of natural and artificial insemination methods did not show a significant difference in the three study zones. In the wet zone, the artificial insemination was the predominant method of breeding, adopted by 94% of the sample farmer population in Kurunegala district. Natural controlled breeding amounted to a negligible 3%. Situation in the dry zone of the study area was somewhat different. Natural breeding was practiced by 30% of the farmers, whereas 70% respondents of the study sample depended on artificial insemination of cattle. In the dry zone, most of the farmers practiced the extensive system of management and the natural breeding percentage was higher than in other regions. In the intermediate zone, 90% of the cattle were subjected to artificial insemination and the rest were bred naturally.
37

Table 4.15: Number of Attempts for Pregnancy Using Al and Natural Breeding
Method of breeding/No. for the attempts made for cattle
W e t Z o n e D r y Z o n e I n t e r m e d i a t e Z o n e
T o t a l Method of breeding/No. for the attempts made for cattle
No. of cattle
% No. of cattle
% No. of cattle
% No. of cattle
%
Artificial Insemination
1 s t attempt 110 63.2 31 53.4 134 54.9 275 57.8 2 n d attempt 46 26.4 15 25.9 57 23.4 118 24.8 3'^attempt 13 7.5 11 19.0 32 13.1 56 11.8 More than 3 attempts 5 2.9 1 1.7 21 8.6 27 5.7
Natural breeding
1 s t attempt 6 100.0 24 92.3 18 72.0 48 84.2 2 n d attempt 0 0.0 0 0.0 2 8.0 2 3.5 3 r d attempt 0 0.0 1 3.8 1 4.0 2 3.5 More than 3 attempts 0 0.0 0 0.0 1 4.0 1 1.8
Not known 0 0.0 1 3.8 3 12.0 4 7.0 Source: Survey Data, 2004
What is of central concern in that natural breeding has yielded better results than the artificial insemination? Around 60% of the cows conceived in the first attempt through artificial insemination and 25% in the second attempt. According to table 4.15, natural controlled breeding was a success within about 85% of the reported sample cases. Hence, in natural controlled breeding, the conception ratio was higher.
4.7 Milk Production and Marketing in the Study Area
Milk production and marketing are the most important activities in dairy production. In the study area, the main suppliers are the small-scale farmers and the main collectors are the MILCO, the Nestle, and the CTMU.
Table 4.16: Monthly Average Milk Production in the Kurunegala District (1997-2002)
Year Cow Milk (litres) Buffalo Milk (litres) Total Milk (litres) 1997 1,689,700 296,300 1,986,000 1998 1,555,900 305,900 1,861,800 1999 1,610,300 293,200 1,903,500 2000 1,640,800 307,700 1,948,500 2001 162,400 287,100 1,911,100 2002 1,707,000 375,300 2,082,300
Source: Department of Censes and Statistics
Kurunegala district is one of the major milk-producing districts in Sri Lanka. During the period from 1997-2002, the production of fresh milk in the district did not indicate a remarkable change except for a slight increase from 1998 to 2002. Buffalo milk
38

production was low since the farmers pay scant attention for the buffalo milk industry. On the other hand, the government and the non-government extension services too are not very much concern with the upliftment of this industry. But, more buffalo milk can increase the profit margin of the farmers. Production of milk is directly related to the breed type, management systems and climatic conditions. Table 4.2 shows that the milk production potentials in the study area vary according to the breeds. The breeds, which can tolerate heat, can give a better production than the other non-heat tolerant breeds.
Table 4.17: Average Milk Production in Different Zones of the Study Area
Zone Average milk production (litres/ cow/day)
Wet zone 5.94 Dry zone 4.63 Intermediate zone 5.47 Source: Survey Data, 2004
In the wet zone of the study area, the average production was higher than in the other two zones. It was 5.94 litre/day. Normally the farmers milk their cows once a day early in the morning and the collection is also done once a day. If milk collectors are willing to collect milk twice a day, it would increase the quantity of milk yield.
4.7.1 Milk Procurement System
Farmers sell their milk to a wide range of collectors in the study area; the main milk collectors being the MILCO, the Nestle and the CTMU (Coconut Triangle Milk Union). Other farmers sold their milk to their neighbours, the King's Joy, Kotmale Dairy Products and other private collectors.
Table 4.18: Place of Disposal of Milk
Name of collector Wet Zone Dry Zone Intermediate Zone Total Name of collector
No. % No. % No. % No. % CTMU 3 3.8 8 20.0 37 30.8 48 20.0 Nestle 28 35.0 20 50.0 31 25.8 79 32.9 MILCO 27 33.8 7 17.5 25 20.8 59 24.6 Neighbours 11 13.8 2 5.0 4 3.3 17 7.1 Kings-joy 0 0.0 0 0.0 11 9.2 11 4.6 Kotmale 0 0.0 0 0.0 6 5.0 6 2.5 Private Collector (Melsiripura) 4 5.0 0 0.0 0 0.0 4 1.7
Co-op Society 0 0.0 3 7.5 3 2.5 6 2.5 Nestle+ Neighbours 1 1.3 0 0.0 1 0.8 2 0.8 MILCO+Neighbours 2 2.5 0 0.0 0 0.0 2 0.8 Nestle+ MILCO 1 1.3 0 0.0 1 0.8 2 0.8 Not sold 3 3.8 0 0.0 1 0.0 4 1.7 Total 80 100.0 40 100.0 120 100.0 240 100.0
Source: Survey Data, 2004
39
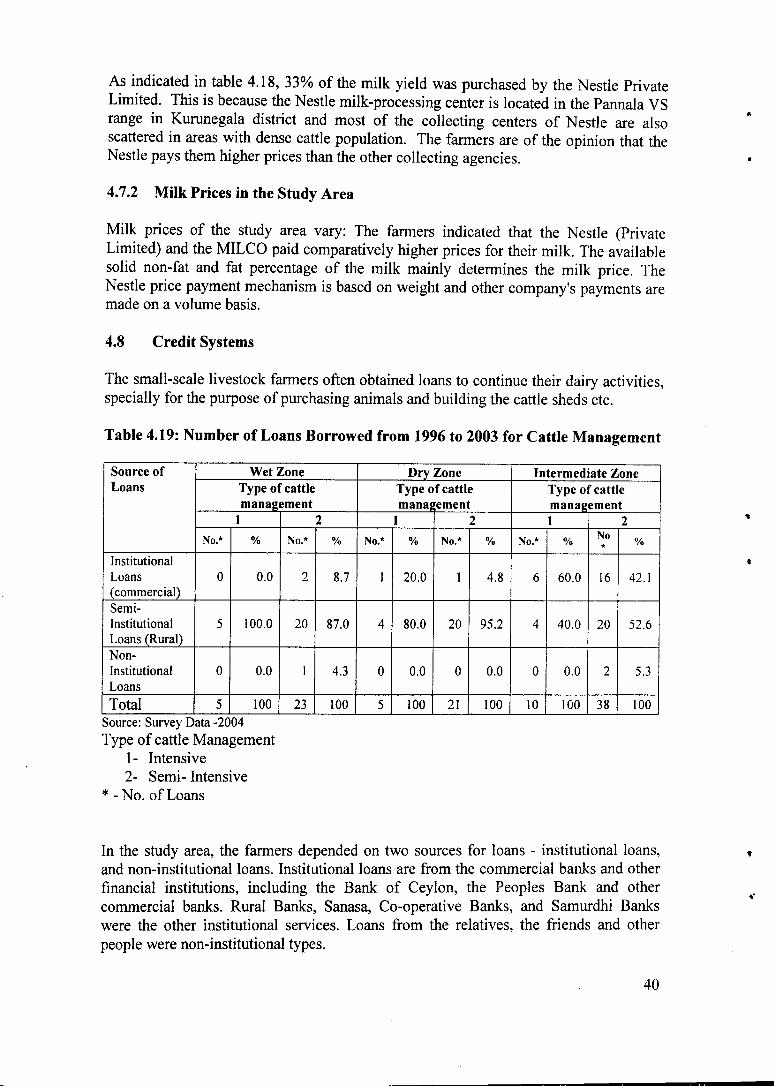
As indicated in table 4.18, 33% of the milk yield was purchased by the Nestle Private Limited. This is because the Nestle milk-processing center is located in the Pannala VS range in Kurunegala district and most of the collecting centers of Nestle are also scattered in areas with dense cattle population. The farmers are of the opinion that the Nestle pays them higher prices than the other collecting agencies.
4.7.2 Milk Prices in the Study Area
Milk prices of the study area vary: The farmers indicated that the Nestle (Private Limited) and the MILCO paid comparatively higher prices for their milk. The available solid non-fat and fat percentage of the milk mainly determines the milk price. The Nestle price payment mechanism is based on weight and other company's payments are made on a volume basis.
4.8 Credit Systems
The small-scale livestock farmers often obtained loans to continue their dairy activities, specially for the purpose of purchasing animals and building the cattle sheds etc.
Table 4.19: Number of Loans Borrowed from 1996 to 2003 for Cattle Management
Source of Loans
W e t Zone Dry Zone Intermediate Zone Source of Loans Type of cattle
management T y p e o manaf
f cattle fement
Type of cattle management
Source of Loans
1 2 1 2 1 2
Source of Loans
N o . * % N o . * % N o . * % N o . * % N o . * % N o * %
Institutional Loans (commercial)
0 0.0 2 8.7 1 20.0 1 4.8 6 60.0 16 42.1
Semi-Institutional Loans (Rural)
5 100.0 20 87.0 4 80.0 20 95.2 4 40 .0 20 52.6
Non-Institutional Loans
0 0.0 1 4.3 0 0.0 0 0.0 0 0.0 2 5.3
Total 5 100 23 100 5 100 21 100 10 100 38 100 Source: Survey Data -2004
Type of cattle Management 1- Intensive 2- Semi- Intensive
* - No. of Loans
In the study area, the farmers depended on two sources for loans - institutional loans, and non-institutional loans. Institutional loans are from the commercial banks and other financial institutions, including the Bank of Ceylon, the Peoples Bank and other commercial banks. Rural Banks, Sanasa, Co-operative Banks, and Samurdhi Banks were the other institutional services. Loans from the relatives, the friends and other people were non-institutional types.
40
Table 4.19 reveals that the majority (52%) of the farmers relied on the semi-institutional sources for their loans. It means that the small-scale loans were mainly obtained as semi-institutional loans. 42% of the farmers have taken their loans as institutional loans. Generally the farmers expend their own financial resources for cattle management activities. It is very difficult to find large and medium scale loan schemes for animal husbandry in institutional, or non-Institution financial sectors in the study area.
41

Chapter Five
ECONOMICS OF MILK PRODUCTION
The output of the economic analysis of milk production is presented in this chapter. This analysis was done using the methods such as basic arithmetic calculations with and without family labour, Cobb-Douglas production function analysis, partial factor production and cost benefit analysis. The chapter also describes the constraints, the potentials and the recommendations, to address such issues.
5.1 Cost Variables in Milk Production
Cost of production of milk, mainly represent the fixed costs and the variable costs. Production refers to the transformation of input resources into output. Resources, or factors of production are the means of producing goods and services demanded by the society. Inputs can be classified broadly into labour or human resources, capital, or investment goods, land, or natural resources and others.
5.1.1 Fixed Cost
In dairy production, this includes depreciation on animals, equipment and buildings (cattle shed), interest on fixed capital (12 .5%-16% in the government and the non government financial banking sector, 2003), interest on loans taken for cattle rearing, and other fixed costs. Depreciation on movable and immovable assets was not included to calculate the COP in this study. The short-term equipment, which is needed in dairy management, was taken into account as per the straight-line method.
5.1.2 Variable Cost
This includes the value of roughage (green and dry fodder), concentrates, medical expenses (medicines and veterinary services), labour charges, transport, insurance premiums and other miscellaneous expenses. The insurance premium was calculated at 3.5%o based on the value of the animal in the current year (Agricultural Insurance Board, 2003).
5.1.3 Imputed Costs
These included the free inputs like; labour provided by the farmer or his/her family members, feed and fodder readily and freely available for the dairy farms which do not involve any payment. Even though they have monetary values for the cost of production in the study, these were considered as imputed costs.
5.2 Production Function
A production function is an unique relationship between inputs and outputs. It can be represented by a table, a graph or an equation that shows the maximum output of a commodity that can be produced in a period of time with each set of inputs (Salvatore D, 2003)
42

Both inputs and outputs are measured in physically rather than monitory units. Technology is assumed to remain constant. A simple short run production function is obtained by applying various amounts of labour/acre of land and recording the resulting output, or total product (TP) for a period of time.
Inputs are classified based on the basis of time, short run (less than one year), and long run (more than 10 years). Short run inputs can be divided into fixed inputs and variable inputs. Fixed inputs are assets, which do not change over a short period, whereas variable inputs change over time. It depends according to the situation. In milk production as mentioned earlier, concentrates, pasture, drugs, labour, and credit can be considered as variable inputs. Cattle, machines, equipment, tractors, land, building and loans are fixed inputs.
5.2.1 Estimation of Production Function
Cobb-Douglas is a common production function used in agricultural and livestock sectors. It is linear in its logarithmic form and convenient in computer analysis (Heady and Dillon, 1961).
The following Cobb -Douglas function (1) fitted to the data in its log- linear form (2)
Y=AX, b l X 2
b 2 X,o b l ° e u (1)
Log Y= Log A+b, Log X] +b 2 Log X 2 + +bi 0 Log X ] 0 +u (2)
Where Y is the dependent variable and Xj ....Xio represent the different independent variables and the bi, .... bio are the partial elasticities of different independent variables.
Dependent Variable Y= Milk production - litres per herd per day
Independent variables X) = labour man day per herd per day; (The human labour variable consists of family labour and hired labour by men, women and children. 0.75 and 0.5 weighed the women and child labour respectively. The labour variable was incorporated in terms of man-day. Equivalents of working 8 hours) X 2 . Cost of concentrate feed = Rs /herd/day (kg); X3 - Cost of veterinary and medicine (Rs/herd /day); X4 - Cost of transport (Rs/herd/day); X5 - Cost of insurance and other maintenance (Rs/herd/day); X 6 - Fixed cost Rs/farm/day); X7 - Breed type (Pure high, cross, local) Xg - Level of education (grade attended of school); X9 - Years of experience in cattle raring (years); Xio - Management type (intensive, semi-intensive and extensive).
The estimation was done by ordinary least squares and evaluated by statistical criteria, viz R 2 ' F, t (standard t) values, sign of co-efficient and significance of co-efficient.
43

5.3 Arithmetic Calculation for Cost of Production Analysis
Cost of production is the most crucial factor to the dairy farmers. In this study, the cost of production per litre of milk per cow and the cost of production of milk per herd per day were calculated separately. These were calculated excluding and including the family labour component.
Normally in Sri Lanka, the livestock farmers use family labour for their livestock enterprises because a majority of the farmers have small-scale dairy farms.
44
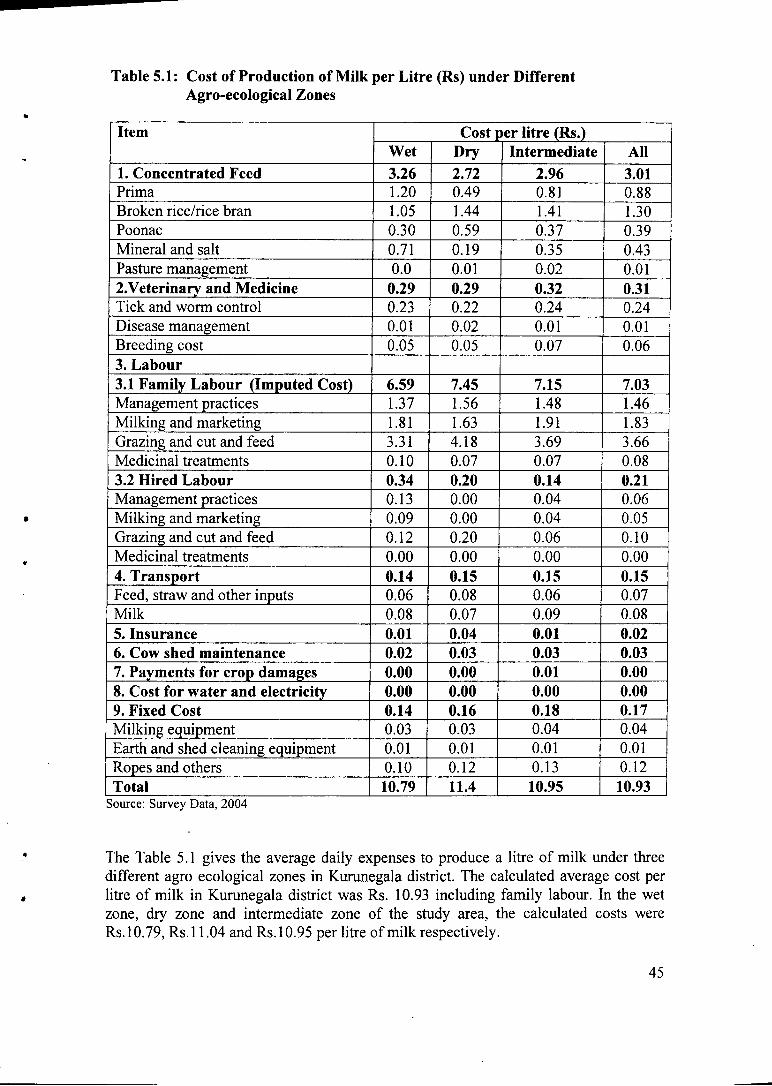
Table 5.1: Cost of Production of Milk per Litre (Rs) under Different Agro-ecological Zones
Item Cost per litre (Rs.) Item Wet Dry Intermediate All
1. Concentrated Feed 3.26 2.72 2.96 3.01 Prima 1.20 0.49 0.81 0.88 Broken rice/rice bran 1.05 1.44 1.41 1.30 Poonac 0.30 0.59 0.37 0.39 Mineral and salt 0.71 0.19 0.35 0.43 Pasture management 0.0 0.01 0.02 0.01 2.Veterinary and Medicine 0.29 0.29 0.32 0.31 Tick and worm control 0.23 0.22 0.24 0.24 Disease management 0.01 0.02 0.01 0.01 Breeding cost 0.05 0.05 0.07 0.06 3. Labour 3.1 Family Labour (Imputed Cost) 6.59 7.45 7.15 7.03 Management practices 1.37 1.56 1.48 1.46 Milking and marketing 1.81 1.63 1.91 1.83 Grazing and cut and feed 3.31 4.18 3.69 3.66 Medicinal treatments 0.10 0.07 0.07 0.08 3.2 Hired Labour 0.34 0.20 0.14 0.21 Management practices 0.13 0.00 0.04 0.06 Milking and marketing 0.09 0.00 0.04 0.05 Grazing and cut and feed 0.12 0.20 0.06 0.10 Medicinal treatments 0.00 0.00 0.00 0.00 4. Transport 0.14 0.15 0.15 0.15 Feed, straw and other inputs 0.06 0.08 0.06 0.07 Milk 0.08 0.07 0.09 0.08 5. Insurance 0.01 0.04 0.01 0.02 6. Cow shed maintenance 0.02 0.03 0.03 0.03 7. Payments for crop damages 0.00 0.00 0.01 0.00 8. Cost for water and electricity 0.00 0.00 0.00 0.00 9. Fixed Cost 0.14 0.16 0.18 0.17 Milking equipment 0.03 0.03 0.04 0.04 Earth and shed cleaning equipment 0.01 0.01 0.01 0.01 Ropes and others 0.10 0.12 0.13 0.12 Total 10.79 11.4 10.95 10.93
Source: Survey Data, 2004
The Table 5.1 gives the average daily expenses to produce a litre of milk under three different agro ecological zones in Kurunegala district. The calculated average cost per litre of milk in Kurunegala district was Rs. 10.93 including family labour. In the wet zone, dry zone and intermediate zone of the study area, the calculated costs were Rs. 10.79, Rs.l 1.04 and Rs. 10.95 per litre of milk respectively.
45

In the calculation the variable costs stand for concentrated feed, veterinary services and medicine, labour, cowshed management, crop damages and costs for water and electricity. The milking equipment, earth and shed cleaning equipment, ropes and other items were calculated in the fixed cost basket.
Short run expenditures in the calculations were considered on an annual basis in this study. The fixed cost for animal purchasing and the initial costs for building cattle sheds were not included in the calculations, which if included will increase the average cost per litre of milk.
In the three different agro-climatic zones of the study area, the cost of production did not depict significant differences. According to the calculations, the highest cost was incurred for family labour. Family labour included all necessary activities in the dairy farming exercise. Generally this would cost around Rs.7.00 per litre of milk, or 64.3% of the total cost.
The second highest cost was for the concentrated feed and it was around Rs.3.00 per litre or 27.5% of the total cost. This cost registered a slight increase (Rs 3.26) in the wet zone and because most of the farmers practiced intensive and semi-intensive types of management. The concentrated feeds included, prima feed, broken rice, poonac, mineral, salt, etc. It also included the cost of pasture maintenance and the calculation was based on labour and cost of fertilizer. The other cost components were not significant in the calculation of cost of production of milk.
46

Table 5.2: Cost of Production of Milk per Litre (Rs)-Excluding Family Labour
Item Cost per litre (Rs.) Item Wet Dry Intermediate All
1. Concentrate Feed 3.26 2.72 2.96 3.01 Prima 1.20 0.49 0.81 0.88 Broken rice/ rice bran 1.05 1.44 0.41 1.30 Poonac 0.30 0.59 0.37 0.39 Mineral and salt 0.71 0.19 0.35 0.43 Pasture management 0.00 0.01 0.20 0.01 2. Veterinary and Medicine 0.29 0.29 0.32 0.31 Tick and worm control 0.23 0.22 0.24 0.24 Disease management 0.01 0.02 0.01 0.01 Breeding cost 0.05 0.05 0.07 0.06 3. Labour 3.1 Hired Labour 0.34 0.20 0.14 0.21 Management practices 0.13 0.00 0.04 0.06 Milking and marketing 0.09 0.00 0.04 0.05 Grazing and cut and feed 0.12 0.20 0.06 0.10 Medicinal treatments 0.00 0.00 0.00 0.00 4. Transport 0.14 0.15 0.15 0.15 Feed, straw and other inputs 0.06 0.08 0.06 0.07 Milk 0.08 0.07 0.09 0.08 5. Insurance 0.01 0.04 0.01 0.02 6. Cow shed maintain 0.02 0.03 0.03 0.03 7. Payments for crop damages 0.00 0.00 0.01 0.00 8.Cost for water and electricity 0.00 0.00 0.00 0.00 9. Fixed Cost 0.14 0.16 0.18 0.17 Milking equipment 0.03 0.03 0.04 0.04 Earth and shed cleaning equipments 0.01 0.01 0.01 0.01 Ropes and others 0.10 0.12 0.13 0.12 Total 4.20 3.59 3.80 3.90
Source: Survey Data, 2 0 0 4
Table 5.2 describes the cost of production of milk excluding family labour. The total average cost for a litre of milk was Rs. 3.90. The cost of production of milk was Rs.4.20, Rs.3.59 and Rs.3.80 for the wet, the dry, and the intermediate zones respectively. The wet zone indicates a marginally higher COP because in this zone the cost for concentrated feed was higher compared with that of the other two zones. The percentage of concentrated feed cost was 77 out of the total average cost per litre of milk in Kurunegala district excluding family labour. The other costs were negligible and the percentage of hired labour was 5, a mere of the total COP in the Kurunegala district.
47

Fig. 5.1: Cost of Product ion o f milk/litre/day with Family L a b o u r
Fig. 5.2: Cost differences of a litre of milk/day in 3 different regions
Fig. 5.3: Cost of Product ion without Family Labour
Fig. 5.4: Cost of Product ion without Family L a b o u r in 3 different regions
in o o
Zones
4.2
3.89
3 .59 m Wet Dry Intermediate
The maintenance cost per cow per day was also calculated with and without family labour. The average cost of production of milk per cow in Kurunegala district was Rs. 73.33 with family labour. The cost of production of milk per cow varied according to the three climatic zones in the study area.
Table 5.3 indicates that the production cost of the wet zone was higher than that of the other two regions. The total cost/cattle/day was Rs.82.54, Rs.66.28, and Rs.71.03 in the wet, the dry and the intermediate zones respectively. The cost difference in the wet zone and the dry zone was Rs. 16.26. In the dry zone, the highest cost component was family labour. It was around 64% of the total cost. Family labour was calculated as an imputed cost. The average working time per day was considered as 8 hours per day and the total average family labour cost per cow in Kurunegala district was Rs. 47.14
Table 5.4 describes the cost of production per cow/day excluding family labour. The total average cost/cow per day in the Kurunegala district was Rs. 26.19 inclusive of the fixed costs mentioned in table 5.4. The wet zone, the dry zone and the intermediate zone costs were calculated separately. There was not much difference observed in the calculated costs, which amounted to Rs. 32.28, Rs. 21.64 and Rs.24.66 respectively.
48

According to table 5.4, the cost of concentrate feed was around 77% of the average cost/day/cow excluding family labour. The percentage of average hired labour was around 5.4% of the total average cost/day/cow. Insurance, cowshed management, compensations for crop damage and the cost for water and electricity incurred lesser costs. Crop damages which compensation was given included instances when cattle caused damages to neighbouring agricultural crops.
Table 5.3: Cost of Production of Milk per Cow/day
Item Cost for Cattle (Rs) Item Wet Dry Intermediate AH
1. Concentrate Feed 24.86 16.32 19.17 20.19 Prima 9.13 2.95 5.26 5.88 Broken rice/rice bran 7.98 8.63 9.13 8.72 Poonac 5.41 1.15 2.26 2.91 Mineral and salt 2.32 3.53 2.40 2.60 Pasture management 0.02 0.07 0.12 0.08 2. Veterinary and medicine 2.20 1.78 2.07 2.05 Tick and worm control 1.78 1.35 1.53 1.56 Disease management 0.04 0.11 0.06 0.07 Breeding cost 0.38 0.32 0.48 0.42 3. Labour 3.1 Family Labour (imputed cost) 50.26 44.65 46.38 47.14 Management practices 10.43 9.37 9.62 9.80 Milking and marketing 13.79 9.79 12.37 12.27 Grazing and cut and feed 25.26 25.05 23.95 24.54 Medicinal treatments 0.79 0.44 0.43 0.53 3.2 Hired Labour 2.59 1.19 0.92 1.43 Management practices 0.96 0.00 0.24 0.39 Milking and marketing 0.69 0.00 0.26 0.33 Grazing and cut and feed 0.93 1.19 0.40 0.70 Medicinal treatments 0.01 0.00 0.02 0.01 4. Transport 1.07 0.89 0.99 0.99 Feed, straw and other inputs 0.48 0.46 0.42 0.45 Milk 0.60 0.43 0.56 0.55 5. Insurance 0.13 0.27 0.09 0.13 6. Cow shed maintenance 0.15 0.22 0.22 0.20 7. Payments for crop damages 0.04 0.00 0.04 0.03 8. Cost for water and Electricity 0.05 0.02 0.04 0.04 9. Fixed Cost 1.19 0.94 1.11 1.12 Milking equipment 0.87 0.74 0.77 0.82 Earth and shed cleaning equipments 0.05 0.03 0.05 0.04 Ropes and others 0.27 0.18 0.29 0.26 Total 82.54 66.28 71.03 73.33
Source: Survey Data, 2 0 0 4
49

Fig. 5.5: Cost of Production Rs/cattle/day
Other cost
6%
concentrate feed
2 8 %
Family labour
64%
According to figure 5.5, the imputed family labour cost was the highest cost, which contributed to 64% of the COP. The highest actual monetary cost of 28% of the total COP was accounted for concentrated feed.
Figure 5.6: Cost of Production of Milk/Cattle/day (Rs./Cattle)
82.54
I Wet
66.28 71.03
iiHiflii IK»HI ^ ^ ^ ^ ^ ^ ^ ^
*HHllilp INK INK NlliNI PalllPiiBP
Dry Intermediate
50

Table 5.4: Cost of Production of Milk/Cattle/day (Rs)-Excluding Family Labour
Item Cost per Cattle (Rs.) Item Wet Dry Intermediate All
1. Concentrate Feed 24.86 16.32 19.17 20.19 Prime 9.13 2.95 5.26 5.88 Broken rice/rice brand 7.98 8.63 9.13 8.72 Poonac 5.41 1.15 2.26 2.91 Mineral and salt 2.32 3.53 2.40 2.60 Pasture management 0.02 0.07 0.12 0.08 2. Veterinary and medicine 2.20 1.78 2.07 2.05 Tick and worm control 1.78 1.35 1.53 1.56 Disease management 0.04 0.11 0.06 0.07 Breeding cost 0.38 0.32 0.48 0.42 3. Labour 3.1 Hired Labour 2.59 1.19 0.92 1.43 Management practices 0.96 0.00 0.24 0.39 Milking and marketing 0.69 0.00 0.26 0.33 Grazing and cut and feed 0.93 1.19 0.40 0.70 Medicinal treatments 0.01 0.00 0.02 0.01 4. Transport 1.07 0.89 0.99 0.99 Feed, straw and other inputs 0.48 0.46 0.42 0.45 Milk 0.60 0.43 0.56 0.55 5. Insurance 0.13 0.27 0.09 0.13 6. Cow shed maintenance 0.05 0.22 0.22 0.20 7. Payments for crop damages 0.04 0.00 0.04 0.03 8. Cost for water and electricity 0.05 0.02 0.04 0.04 9. Fixed Cost 1.09 0.94 1.11 1.12 Milking equipment 0.87 0.74 0.77 0.82 Earth and shed cleaning equipments 0.05 0.03 0.05 0.04 Ropes and others 0.27 0.18 0.29 0.26 Total 32.28 21.64 24.66 26.19 Source: Survey Data, 2004
Fig. 5.7: Comparison of Cost of production/cow/day with and without Family Labour
re •o o o
to (0 o o
82.54
Wet
66.28 71.03 73.33
21.64 24.66 26.19
Dry Intermediate
Zones Average
• without • with
51
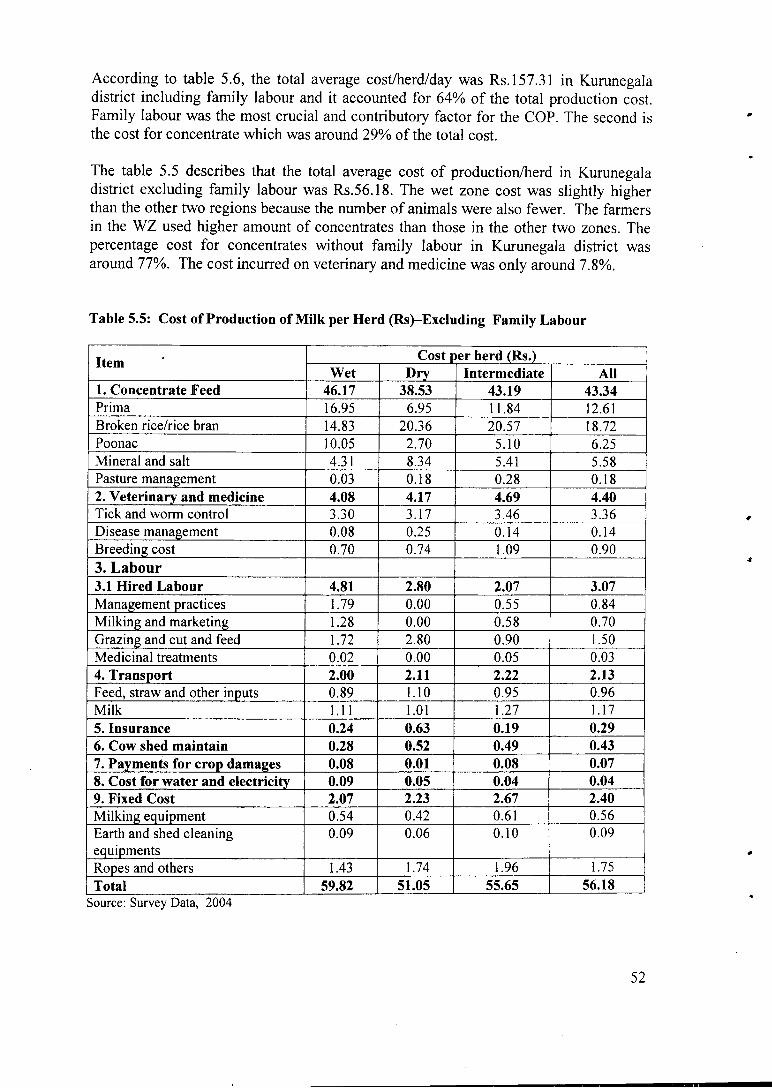
According to table 5.6, the total average cost/herd/day was Rs. 157.31 in Kurunegala district including family labour and it accounted for 64% of the total production cost. Family labour was the most crucial and contributory factor for the COP. The second is the cost for concentrate which was around 29% of the total cost.
The table 5.5 describes that the total average cost of production/herd in Kurunegala district excluding family labour was Rs.56.18. The wet zone cost was slightly higher than the other two regions because the number of animals were also fewer. The farmers in the WZ used higher amount of concentrates than those in the other two zones. The percentage cost for concentrates without family labour in Kurunegala district was around 77%. The cost incurred on veterinary and medicine was only around 7.8%.
Table 5.5: Cost of Production of Milk per Herd (Rs)-Exchiding Family Labour
Item Cost per herd (Rs.) Item Wet Dry Intermediate All
1. Concentrate Feed 46.17 38.53 43.19 43.34 Prima 16.95 6.95 11.84 12.61 Broken rice/rice bran 14.83 20.36 20.57 18.72 Poonac 10.05 2.70 5.10 6.25 Mineral and salt 4.31 8.34 5.41 5.58 Pasture management 0.03 0.18 0.28 0.18 2. Veterinary and medicine 4.08 4.17 4.69 4.40 Tick and worm control 3.30 3.17 3.46 3.36 Disease management 0.08 0.25 0.14 0.14 Breeding cost 0.70 0.74 1.09 0.90 3. Labour 3.1 Hired Labour 4.81 2.80 2.07 3.07 Management practices 1.79 0.00 0.55 0.84 Milking and marketing 1.28 0.00 0.58 0.70 Grazing and cut and feed 1.72 2.80 0.90 1.50 Medicinal treatments 0.02 0.00 0.05 0.03 4. Transport 2.00 2.11 2.22 2.13 Feed, straw and other inputs 0.89 1.10 0.95 0.96 Milk 1.11 1.01 1.27 1.17 5. Insurance 0.24 0.63 0.19 0.29 6. Cow shed maintain 0.28 0.52 0.49 0.43 7. Payments for crop damages 0.08 0.01 0.08 0.07 8. Cost for water and electricity 0.09 0.05 0.04 0.04 9. Fixed Cost 2.07 2.23 2.67 2.40 Milking equipment 0.54 0.42 0.61 0.56 Earth and shed cleaning equipments
0.09 0.06 0.10 0.09
Ropes and others 1.43 1.74 1.96 1.75 Total 59.82 51.05 55.65 56.18
Source: Survey Data, 2004
52
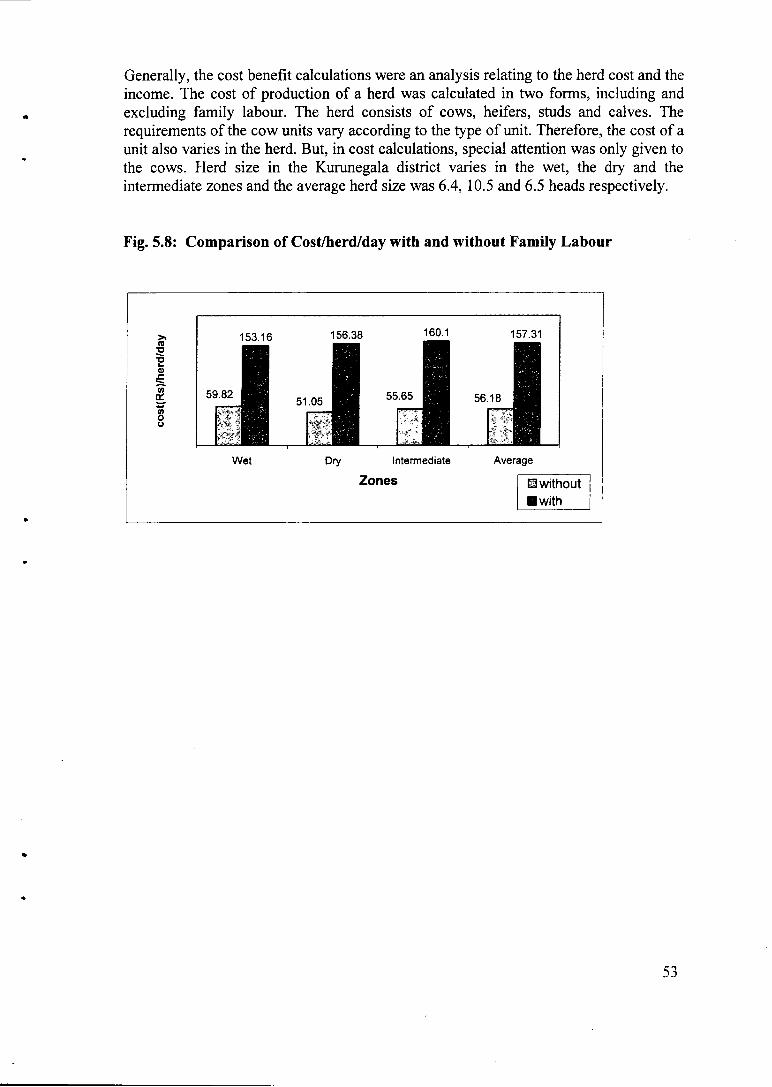
Generally, the cost benefit calculations were an analysis relating to the herd cost and the income. The cost of production of a herd was calculated in two forms, including and excluding family labour. The herd consists of cows, heifers, studs and calves. The requirements of the cow units vary according to the type of unit. Therefore, the cost of a unit also varies in the herd. But, in cost calculations, special attention was only given to the cows. Herd size in the Kurunegala district varies in the wet, the dry and the intermediate zones and the average herd size was 6.4, 10.5 and 6.5 heads respectively.
Fig. 5.8: Comparison of Cost/herd/day with and without Family Labour
53

Table 5.6: Cost of Production of Milk per Herd (Rs)-Including Family Labour
Item Cost per herd (Rs.) Item Wet Dry Intermediate All
1. Concentrate Feed 46.17 38.53 43.19 43.34 Prima 16.95 6.95 11.84 12.61 Broken rice/rice bran 14.83 20.36 20.57 18.72 Poonac 10.05 2.70 5.10 6.25 Mineral and salt 4.31 8.34 5.41 5.58 Pasture maintain 0.03 0.18 0.28 0.18 2. Veterinary and medicine 4.08 4.17 4.69 4.40 Tick and worn control 3.30 3.17 3.46 3.36 Disease management 0.08 0.25 0.14 0.14 Breeding cost 0.70 0.74 1.09 0.90 3. Labour 3.1 Family Labour(Imputed cost) 93.34 105.32 104.45 101.14 Management practices 19.36 22.10 21.67 21.03 Milking and marketing 25.61 23.10 27.87 26.32 Grazing and cut and feed 46.91 59.10 53.95 52.65 Medicinal treatments 1.47 1.03 0.96 1.13 3.2 Hired Labour 4.81 2.80 2.07 3.07 Management practices 1.79 0.00 0.55 0.84 Milking and marketing 1.28 0.00 0.58 0.70 Grazing and cut and feed 1.72 2.80 0.90 1.50 Medicinal treatments 0.02 0.00 0.05 0.03 4. Transport 2.00 2.11 2.22 2.13 Feed, straw and other inputs 0.89 1.10 0.95 0.96 Milk 1.11 1.01 1.27 1.17 5. Insurance 0.24 0.63 0.19 0.29 6. Cow shed maintain 0.28 0.52 0.49 0.43 7. Payments for crop damages 0.08 0.01 0.08 0.07 8. Cost for water and electricity 0.09 0.05 0.04 0.04 9. Fixed cost 2.07 2.23 2.67 2.40 Milking equipment 0.54 0.42 0.61 0.56 Earth and shed cleaning equipments 0.09 0.06 0.10 0.09
Ropes and others 1.43 1.74 1.96 1.75 Total 153.16 156.38 160.10 157.31
Source: Survey Data, 2004
The average cost of production of milk per herd including family labour did not indicate significant differences among the three zones. This was Rs.153.16, Rs. 156.36 and Rs.160.10 in the WZ, the DZ and the IZ respectively.
LIBRA r;Y
H A R T I
54

1(2
Ml
o U oc a 3
o
s s
a «
to en s 9
ii tm
o a
u s -e o u Pui
O
i3 a _
o a
ii I n
•** 1
^ o
00 I en
oo
S r e
fa
« a o l U i
o
l-g c o cd a o o
a
u >
ON O o
©
oo
ii
s o «
9 e « •e v
C D
u "•-»
o
u 00 S 3
op|
a
00
IT/
00
O o o
» H O
u 3
o 1 3
O «
H
oo
u
©I© O
ON CN O o o
f*5
OS r n
oe
e
8 00 en
CN o o
r n
al 4»
ii OX •
a •e a o
a
I
-e «
O U .
1*1
c D S &
" g -00 c
09
o •e
a
C D
001 ON
M=3
C D
o T3
o o
IQ >.
03 C D C D
O 00
55

O
U 9 3
ON
s s
u 9 O X) CS
l<-> a " 2
NO
I "5
00 x
oo
00
NO
\*r> in ON ©
o a -PS
SI «N|
CN O
©
© o
s CS
TO
. 1 "31 s\ "5 a c/> LA
cu a
O •
9 •a o to
o U 00
eu CS
H
o U CN X
X ON.
00 ON ©
NO
NO d
© © ©
ON <N ©
CN NO ©
© ©
© © ©
© ©
CN ©
© ©
00 © ©
CN ©
©
©
CN ©
O o
NO
© ©
X ml ©
00 © ©
CN © ©
©
©
©I
<N d|
NO ©
©
©
• 8
to
a ai U a
cd
.8
B
T3
CU
ed c/i ' • S
ed
<L> O d ed C cj C "id 6
c o cd c o o 0- I «
to
L>L
o •5
c cd o
H
E cd °
o | &4 c W
CD
S
o CS
-J
S
e c cd
E -o M l 00|
S 'N cd a
ICO
NO NO
tn
ON
o © ©
in
ON
CN CN
ON NO
NO CN ©
© ©
© in ©
NO CN
tree x*
00 © ©
©
NO ©
NO © ©
© ©
©
© © ©
© © d
© ©
© © ©
NO X ©
CN ©I
CN d CN CN ©
NO © ©
© ©
© © ©
©
©
Pi ©
© ©
CN CN CN o
©
NO
NO
CN d
© © CN © ©
©
ON © ©
V) X
CN
© © ©
©
©
© I
O
NO C*i
X ON
U 9 O «
s CS to CN
c e
I
oq _c '• CL> Cdl el •a c cd 0C| C
w
XI c cd
T3 c cd 60 C
' N
cd O
cd <u
3 a .a
, &
o a an a cs U
H
cd
-a
CD to
U a cs c cu a '3 E •o {»
I
U
R
cs T3 U U U
eu
a cs cu cs
.o
3 O" Cl> 00 'c cd CO
§1
S I
IT) NO r- x on cd
CD
cd | C/l
§ at
o o CN cd "cd
IQ >>
CU 3
LEW i i o — 3 O CW
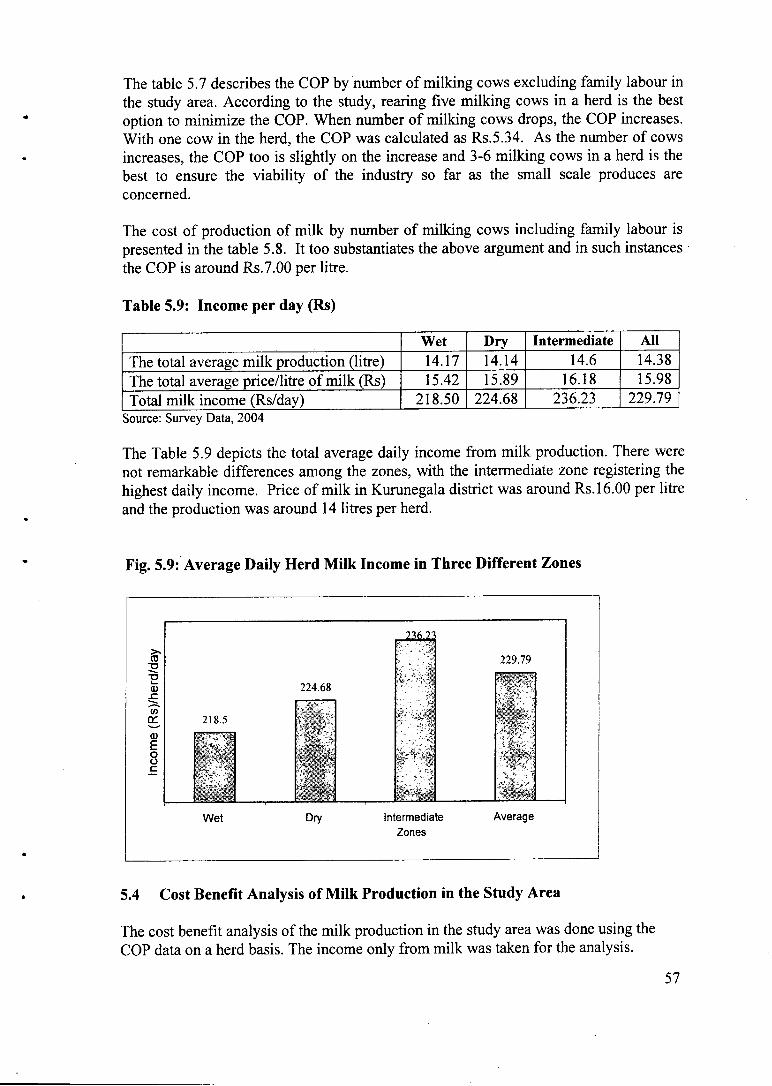
The table 5.7 describes the COP by number of milking cows excluding family labour in the study area. According to the study, rearing five milking cows in a herd is the best option to minimize the COP. When number of milking cows drops, the COP increases. With one cow in the herd, the COP was calculated as Rs.5.34. As the number of cows increases, the COP too is slightly on the increase and 3-6 milking cows in a herd is the best to ensure the viability of the industry so far as the small scale produces are concerned.
The cost of production of milk by number of milking cows including family labour is presented in the table 5.8. It too substantiates the above argument and in such instances the COP is around Rs.7.00 per litre.
Table 5.9: Income per day (Rs)
Wet Dry Intermediate All The total average milk production (litre) 14.17 14.14 14.6 14.38 The total average price/litre of milk (Rs) 15.42 15.89 16.18 15.98 Total milk income (Rs/day) 218.50 224.68 236.23 229.79
Source: Survey Data, 2 0 0 4
The Table 5.9 depicts the total average daily income from milk production. There were not remarkable differences among the zones, with the intermediate zone registering the highest daily income. Price of milk in Kurunegala district was around Rs. 16.00 per litre and the production was around 14 litres per herd.
Fig. 5.9: Average Daily Herd Milk Income in Three Different Zones
236.23
229.79
224.68 - v . -
218.5 -"•-i 'T*
• >" &
• ?i v-'
Dry Intermediate Average Zones
5.4 Cost Benefit Analysis of Milk Production in the Study Area
The cost benefit analysis of the milk production in the study area was done using the COP data on a herd basis. The income only from milk was taken for the analysis.
57

Table No.5.10: The Cost Benefit Analysis of Milk Production (Including family labour/day)
Wet zone Dry zone Intermediate
zone All
Cost/day (Rs) 153.16 156.38 160.10 157.31 Income/day (Rs.) 218.50 224.68 236.23 229.79 Profit (Rs.) 65.34 68.3 76.13 72.48 Income/Cost 1.43 1.44 1.48 1.46 Rate of Return* 42.66 43.68 47.55 46.07
Source: Survey Data, 2004
• R a t e o f Return = Prof i t /Cost xlOO ( Inc lud ing imputed c o s t o f f ami ly labour)
Table 5.10 describes the cost benefit analysis based only on milk production without other income generated in dairy management which was relatively negligible in the short run COP analysis. The total average profit gained from the dairy industry was Rs.72.48 per day. In the three zones, a serious profit difference was not observable in the dairy management. The percentage of profitability of the industry was around 32 including family labour. The cost benefit ratio was 1.46 in the district. The rate of return in dairy farming was analyzed under two scenarios-returns including imputed family labour and excluding family labour. There is not much statistical difference among the three regions. The average rate of return was 46.07 in the study area which is not of a higher dimension due to the cost accounted, which contributed to the high imputed cost for family labour.
According to the table 5.11, the rate of return excluding imputed cost of family labour was 309.02 in Kurunegala District, a higher value due to its major portion of family labour in the total cost basket.
Table 5.11: Cost Benefit Analysis (excluding family labour)
Wet Dry Intermediate All
Cost/ day Rs. 59.82 51.05 55.65 56.18 Income/day (Rs.) 218.50 224.68 236.23 229.79 Profit (Rs.) 158.65 173.63 180.58 173.61 Income/cost 3.65 4.40 4.24 4.09 Rate of return* 265.21 340.12 324.49 309.02
Source: Survey Data, 2004
•Rate of Return = Profit/Cost xlOO (Excluding imputed cost of family labour)
According to the survey data, the average profit percentage was around 75. Its profit was more than two times higher than the cost which included family labour in the study area. The average benefit cost ratio was 4.09 in the study sample.
58

Fig. 5.10: Price Analysis of Input/Output Including Family Labour (herd/day)
Rup
ees
. 1
j53i<jr
• •k -
t f * Mm
Rup
ees
Wet Dry Intermediate Average Zones • Profit
El Cost
Fig. 5.11: Price Analysis of Input/Output without Family Labour (herd/day)
a.
5.5 Partial Factor Production in Dairy Production
Partial factor production in dairy production can be calculated using milk productivity, labour productivity, capital productivity and land productivity. The effectiveness of farm management in the dairy sector of Kurunegala district is reflected through improving partial factor productivity. In the study area, the partial factor productivity of milk and labour was estimated with and without family labour. The capital productivity was explained under the section, cost benefit analysis. Due to unavailability of sufficient data, the land productivity was not analyzed.
59

Table 5.12: Net Changes in Partial Factor Productivity
System Net change in milk productivity
Net changes in labour productivity ( including
family labour)
Net changes in labour productivity (excluding
family labour) Gross
income Rs/litre
Net income Rs/litre
Milk Product ion litre
Gross income Rs/man
days
Net income Rs/man
days
Yield/man days
litre/man days
Gross income Rs/
man days
Net income Rs/man
days
Yield/man days
litre/ man days
Wet Zone 23.8 9.27 14.17 440.98 129.58 28.85 8988.24 2641.18 588.24 Intermediate Zone 26.3 9.13 14.60 456.52 156.10 27.43 23771.43 8128.57 1428.57 Dry Zone 27.9 9.36 14.14 337.14 103.49 21 .16 15930.0 4890 1000.0 All 25.6 9.15 14.38 441.16 139.23 27.62 15209.52 4800 952.38
Milk Productivity (Gross)= Production/Cost x 100(Rs/litre)Excluding Family Labour Cost Milk Productivity (Net) = Production/Cost x 100 (Rs/litre) Including Family Labour Labour Productivity = Gross Income/Man days (Rs); Net Income/Man Days (Rs)
Yield/Man Days (litre) Including and Excluding Imputed Family Labour are used in production process. One man day = 8 hours
The milk productivity was measured with and without family labour in the calculation of cost related to the production. The highest milk productivity was in the DZ (gross-27.9, net-9.36) due to the lower COP. The labour productivity was analyzed under three scenarios, - gross income per man day (Rs); net income per man day (Rs) and milk production/man day (Rs) including and excluding family labour. The level of net income/man day varied from 103.49, 129.58 and 156.10 in the DZ, the WZ and the IZ respectively. It indicated that the IZ gives the highest income per man-day. The positive net changes in partial factor productivity parameters (eg: labour and capital) of dairy farming were observed in the zones of Kurunegala district. However, it was observed that the farmers were gaining net income rather than optimum farm productivity alone, from their investment in dairy farming. The productivity levels of labour and capital were somewhat higher (10%-15%), compared to the national average productivity of small-scale agriculture sector (National Agriculture Policy, 2003).
5.6 Production Function Analysis
Cobb-Douglas type production function was used in wet, intermediate and dry zones in milk production calculation. The estimated production functions used in this section are given in table 5.13.
60

Table 5.13: Estimated Log-linearized Cobb-Douglas Production Functions in Dairy Farms Model Y = f (AX, b l X 2
b 2 X« b 6 ) in the linearized form
Item Wet Zone (n=70)
Intermediate Zone (n=lll)
Dry Zone (n=39)
Dependent Variable Milk production - litre Independent Variables Xi - Labour - Mandays 0.7218
(4.8429) 0.5797
(3.0166) 0.4795
(2.7910) X 2 - Cost of concentrate feed - Rs. -3.4741
-(2.0504) -72.0374 -(0.5547)
2.9089 (1.2441)
X3 - Cost of veterinary and medicine -Rs.
3.9416 (4.4106)
0.3810 (4.2722)
6.9007 (1.6138)
X» - Cost of transport - Rs. -89.8539 -(0.5855)
1.9051 (1.2508)
-0.2228 -(54.2978)
X 5 - Cost of insurance and other maintenance - Rs.
3.3705 (2.1539)
1.2407 (0.8499)
-3.9497 -(0.1575)
X 6 - Fixed cost - Rs. 0.3332 (3.0275)
0.2469 (2.4845)
0.1652 (1.1947)
X 7 . Breed type Pure high, cross, local breeds
-0.2967 -(1.1660)
0.1312 (0.6482)
1.0783 (2.1987)
Xg level of education- grade attended to school
-0.4039 -(1.2083)
0.2472 (0.7456)
-0.6646 -(1.4792)
X9 experience in dairy farming - years 0.4391 (1.7994)
-0.1436 -(2.3119)
-0.2618 -(2.7708)
X10 Management type - IS, SIS, ES -0.5812 -(0.3538)
-0.4023 -(1.1079)
-.06039 -(1.1584)
Intercept 0.1689 0.8848 0.2398 F 55.8869 87.8480 29.5043
0.4939 0.6816 0.4217 Source: Survey Data, 2004
It was found that the co-efficient of determining the wet zone, the intermediate zone and the dry zone are 0.4939, 0.6816 and 0.4217 respectively. This indicates that out of the total variations in milk production, 30 percent of the wet zone, 40 percent of the intermediate zone, and 28 percent of the dry zone variations are caused by independent variables.
In the wet zone the F calculated value 55.89 was larger than the F value 2.69 and 5 percent significant level. In the intermediate zone regression, it was found that computed F value 87.85 was larger than the table F value of 5 percent significant level.
Since R 2 values are quite high, the feasibility of the model was proved. When the model runs with all direct and indirect variables (breed, experience, educational level, rearing system) at the 1 s t attempt little R 2 value and negative signs for indirect independent variable. This indirect variable was excluded from the backward process of the analysis. The R 2 obtained higher values compared to the past. This indeed, predicts more accurate ranges of production.
61

In the IZ farms, these variables appear to be used more productively than in the WZ and the DZ. Low efficiency of these variables in the DZ would be due to differences of farming practices.
This may have also been influenced by other factors such as other inputs and management practices.
The calculated F values of WZ, IZ, and DZ were 55.89, 87.85 and 29.50 respectively. Those values were larger than the table F values at 5 percent significant levels.
The independent variables in the WZ milk production: Labour, feed, veterinary services and medicine, insurance and maintenance, fixed costs and experiences of dairy farming were statistically significant of a 5 percent value. In the IZ, labour, veterinary services and medicine, and fixed costs were statistically significant at 5 percent of significant levels. Finally, in the DZ, labour and breed type were significant at 5 percent level of significance.
The co-efficient of cost on concentrate, transport, breed type, and management type in WZ showed negative signs. The co-efficient of cost of concentrate, experience in dairy farming and management type in the IZ indicated a negative sign. Factor determining the cost of veterinary services and medicine, insurance and other maintenance costs, experience in dairy farming and management systems showed negative signs in the DZ and all other independent variables were positive in the three zones. The negative value of co-efficient indicates a decreasing trend of milk production.
The negative signs of feed cost in the WZ and DZ may be explained by the fact that cattle were mainly fed on roughage and grass.
The services are not delivered at correct time such as medical treatment at the initial stage of a disease. Therefore, the remaining service delivery system is not effective in controlling diseases. The negative signs for breed type may be due to lack of suitable breeds for specific environment conditions in the WZ of the study sample.
Lack of proper extension service is a major constraint in the dairy farming sector. Timely and proper extension service is a must and urgent requirement of the farmers.
The regression of the co-efficient of labour variable of WZ, IZ, and DZ were 0.72, 0.58 and 0.48 respectively. The main labour productivity was higher in the WZ compared to that of the other two zones. The reason for this in the WZ may be the higher number of labour utilized in intensive and semi-intensive system of management practices.
It was observed that the regression of the co-efficient of fixed cost was a lesser value in DZ (1.19) than in the WZ (3.02) and IZ (2.49). The reason for this reduction of the fixed cost in the DZ, was due to the fact that a higher percentage of farmers had not allocated any funds for cowsheds, pasture cultivation, electricity, etc.
62

Chapter Six
Problems and Recommendations
6.1 Constraints, Potentials and Recommendations
Based on the findings of this study, constraints, potentials and recommendations are discussed in this chapter. The focus is mainly on the cost of production, feeding pattern, labour, procurement system, herd improvement and extension and management systems.
6.1.1 Cost of Production of Milk
In the milk production, the main factors impacting the COP are, feeding, labour, and breed type, veterinary and extension services, management systems, milk marketing, price, procurement systems and other effective factors in the dairy industry.
6.1.2 Feeding Pattern
Roughage: According to Ibrahim, et al, the climatic conditions of Kurunegala district in Sri Lanka are suitable for high yielding tree fodder and grasses. This area also has a higher potential and availability of land to cultivate roughage and legumes under coconut plantations. Unavailability of a better feeding pattern is one of the main constraints for higher milk production. It was understood that most animals were underfed and full potentials remained unrealized. The cultivated pasturelands in the area seem to be very rare. Most of the small-scale farmers depend on natural pasture and fodder. The available natural fodder resources are poorly managed and under utilized. Most of the crop residues and by-products go waste. If these farmers can harvest the natural roughage at the correct time (when 15% of the blooming occurs) they can supplement the cattle feed with a considerable supply of nutrients. The haymakers and silage producers were almost non-existent in the study sample due to the lack of proper technical know-how.
Recommendations
1. Maximizing the use of crop residues, natural grasses and legumes by providing proper technical knowledge to the dairy farmers through training programmes.
2. Introduction of a pasture subsidy scheme and the supply of recommended suitable varieties.
3. Establishment of common pasture lands in prominent dairy production areas especially in the dry zone of Sri Lanka, and encourage farmers to grow grass on small plots of available land.
4. Educating the farmers about the preservation of available grass in the rainy season, to be used during the dry period of the year, as hay, silage, etc.
63

5. Researchers should be encouraged to probe and develop low cost feed rations for different regions using local available feed resources.
6. The Government should implement a programme to promote the coconut cattle grasses Silvo-pastoral system in large-scale coconut lands in the coconut triangle.
Concentrate: The high prices are the main problem associated with concentrated feed. The compounded feeds are mixed and manufactured by a few private sector companies. These companies import several feed ingredients utilizing the duty waiver facilities offered by the government and they do island wide marketing. Small scale feed mixing is seen very rarely. The locally available poonac, rice brand, etc also have to be purchased at higher prices.
Recommendations:
1. Educate the farmers to prepare feed ration using locally available resources (poonac, rice brand, rice polish, crop residues, legumes, etc.)
2. Implementation of projects to grow compounded feed crops locally and facilitate the marketing requirement of the farmers (eg: maize, soya bean, sesame etc)
3. Encourage the regional entrepreneurs to establish small-scale mills manufacturing animal feed.
4. Educate and encourage the farmers to use low cost self-mixing concentrate feed rations under a reasonable subsidy scheme.
6.1.3 Breeding and Herd Improvement Programmes
The core-issue of milk production is low productivity and low genetic potential of animals in the national herd compared with the leading milk producers in the world. Therefore to overcome this problem, the national herd has to be upgraded and suitable breeds introduced for different climatic regions. The common problem in herd improvement is the poor quality of the upgrading and breeding programme in Sri Lanka. Upgrading of the indigenous cattle and buffalo population to dairy breed types has been a major success, contributing substantially to increase milk production (Ibrahim, et al, 1999). The key breeding strategy is through Al but in very remote areas due to the limited extension staff, the farmers had to Al their animals 2-3 times to be successful. The Government plays a significant role in breeding services to facilitate natural breeding, but the stud bulls, which have high potentials, are scarce in the country.
Recommendations
1. Proper replacements of studs at semen collection centers. 2. Establishment of Al service units in highly dense cattle villages. 3. Providing transport for VS and Al technicians to carry out their duties. 4. Establishment of stud bull centers where Al facilities are hardly sufficient. 5. Use government farm studs for breeding purposes in the surrounding areas. 6. Introduce improved suitable breeds related to the climatic conditions of the
region.
64

6.1.4 Extension Services
Even though many organizations are involved in dairy development, the extension services provided to the rural farmers remain unorganized and inadequate. The dissemination of new knowledge to the farmers has suffered a set back due to limited government extension staff. Mastitis and milk fever were commonly observed in Kurunegala district. The farmers had little exposure to the technical knowledge, benefits, and advantages of semi-intensive and intensive management systems. According to the survey results, the farmers in the study area are reluctant to invest in the dairy industry due to the higher risks of the industry, absence of funding and credit facilities and difficulties in finding suitable breeds. The farmers hesitate to insure their cattle in its absence of proper insurance schemes.
Recommendation
1. Establishment of separate extension units in VS ranges employing agriculture graduates.
2. Encourage and provide more facilities to the private sector, engaged in extension services to fill the gap.
3. Conducting training, or allied programmes to disseminate knowledge regarding technology, management, marketing, benefits and advantages of the hi-tec intensive systems.
4. Introduce farmer friendly credit programmes. 5. Introduce and create awareness of suitable attractive and feasible insurance
schemes.
6.1.5 Production and Marketing
The production potentials of animals differ according to the breed type, management practices, and climatic regions in the study area. The COP of cattle is very high, and it is especially due to the high cost imputed to family labour. The fresh milk consumption of the study area is also relatively low. Marketing of milk is also a problem for the farmers, because their milk fetches lower prices. The number of dairy farmers, involved in milk processing, is extremely low in the study area. Under the semi-intensive type of management, the farmers earn higher profits than through the other two systems and the average herd size, which is required to run the industry at a profit is 5-10 heads. In the study area, a proper herd replacement programme was not in place. Therefore, the cattle population in the area is ageing. According to the survey results, dairy farming is a profitable industry with a lot of potential for the small-scale farmers, because they can effectively utilize the family labour resources. In the study area, it was observed that milking was done once in the morning only because of the absences of marketing facilities in the evening.
65
Recommendation
1 . Establishment of milk collecting centers in areas where the milk production is high.
2. Increase the habit of liquid milk consumption through educational and mass media programmes
3. Encourage and educate identified farmers to obtain higher profits, by producing value added products rather than selling raw milk.
4. The government collecting centers can offer more attractive reasonable prices and the introduction of a transparent milk collection system is an urgent necessity.
5. Facilitate evening milking by providing evening collection facilities or by the establishment of chilling centers in economically viable and higher producing areas.
6. Increase the capacity of local milk processing and establish new small and medium scale processing plants in proportion with the quantity of milk production.
7. Removal of taxes on necessary items for the dairy industry (eg: machinery, chilling plants, feeding materials, etc).
8. Educate farmers to produce milk under proper hygienic conditions in order to get higher prices and reducing the milk rejections.
9. Provide credit, at reasonable interest rates. Strengthen the farmer organizations to take responsibilities by active participation in production, processing and marketing.
10. Introduction of an annual market price fixation programme with the COP. 11 . Encourage the establishment of small and medium scale, intensive and semi-
intensive dairy farms related to available capacity of family labour supported by government infrastructure and subsidies.
66

Chapter Seven
Summary and Conclusion
The study was carried out in Kurunegala district, in the coconut triangle belt of Sri Lanka. The district is considered as one of the most important areas resource-wise for milk production in the country. The area consists of three main agro-ecological zones such as the WZ, the DZ and the IZ. The climatic conditions in the study area are favourable to increase the production of natural resources such as grasses, fodder and legumes to the optimum. The other resources like coconut based products for animals are commonly available. The majority are small-scale farmers, but the medium scale farmers out number the large-scale farmers in the sample population.
The study proves that the majority of the animals are pure breeds and cross-high breeds. European crosses are more commonly found than Indian breeds in Kurunegala district. According to the survey the commonly available breed is the Jersey which shows heat resistant abilities. Based on milk production in the study sample, Jersey Frisian and Jersey Sahiwal crosses are the best (around 7.8 litres/day) for the WZ and pure breeds also give better yields. The Jersey Frisian cross shows a higher productivity in the dry zone of the study area; yet the survey results indicate that Sahiwal is the best breed for the area. European crossbreeds also give the highest average milk yield.
Majority of the farmers use natural grasses and fodder to feed their animals. A few farmers cultivate improved and recommended varieties in their own lands. Mostly weeds under coconut plants are used to feed the animals. Animals reared in coconut plantations provide a two-fold benefit (Provide fertilizer to the coconut plants through cow dung, control the weed growth in plantations and in turn plantation provide feed to the animals). However, a majority of the farmers have not used the coconut plantation lands to grow improved recommended varieties of grass to feed the animals.
In the study area, most of the milking cows were fed with concentrates, but not the heifers, calves and stud bulls. The common type of concentrate used in the study area is broken rice. Prima feed and coconut poonac are also in use. Most of the animals were fed with minerals. According to the study findings, a majority of the farmers were unable to supply concentrated feed to their animals due to financial limitations and lack of knowledge.
The livestock services in the study area are provided through the VS office, on the request by the farmers. The farmers had to pay the transport cost of the officers and the cost of treatment. Most of the animals were treated with tick and worm treatments. The common diseases in the area were mastitis, milk fever and foot and mouth disease. Giving a better training to the farmers about the correct milking methods and other management practices can minimize these diseases.
Farmers are deprived of proper advice and technology from the government in the absence of an adequate staff. The VS officers of the study area mainly deliver the
67
extension services on a demand-oriented basis. The private sector also contributes to the extension services mainly about the marketing of milk.
The VS and the LDI carry out the major breeding tool, the AL The Al coverage in the area is sufficient, but most of the time, it was unable to provide the service at the correct time. A very few farmers in the study area practiced natural insemination. By improving the Al facilities, the production potentials of the animals can be improved, while upgrading the genetic standards of cattle and thus productivity.
The average milk production was higher in the WZ than in the other two zones of the study area. Due to the unavailability of evening milk collection, the farmers milked their animals only in the morning and the main milk collectors in the area were the MILCO, the Nestle and the CTMU. The study indicates that Nestle is the biggest purchaser in the area because a Nestle processing plant is located in Kurunegala District. The farmers opined that the Nestle paid better prices than other collectors in the area. The production of value added products was very low among the sample population. If such production could be turned out following a proper training, the profitability of the dairy industry can be enhanced.
According to the socio-economic standards, the dairy farmers earn higher incomes than other farmers engaged in agricultural activities. Most of the farmers in the sample are middle aged and they are engaged in other income earning activities as well. Due to the extensive use of family labour, the profit margin of dairy farming has increased remarkably.
This study supports the argument that dairy farming could emerge as a profitable enterprise. Intensifying the small-scale dairy farms in the coconut triangle could also increase milk production. But, it requires land and capital to maintain large herds with assured feed supplies.
Under the study, the cost of production per litre of milk per day was calculated with and without family labour. The cost calculated per litre/day with family labour was Rs.10.79, Rs. 11.40, and Rs.10.95 in the WZ, the DZ, and the IZ respectively. This calculation include the fixed cost for animals, lands and buildings, but other capital investments were not calculated in this study. The COP/cow/day was calculated as Rs.82.54, Rs.66.28 and Rs.71.03 in the WZ, the DZ, and the IZ respectively. The total average COP/cow/day was Rs.73.33 in Kurunegala district. The COP/cow/day without family labour was Rs.32.28, Rs.21.04, and Rs.24.66 in the WZ, the DZ and the IZ respectively. The average COP/cow/day was Rs.26.19 in Kurunegala district. The concentrate cost was the highest input cost, when considered without family labour. Generally in Sri Lanka, the dairy industry is maintained on a herd basis. It includes productive and non-productive animals. The COP/herd/day without family labour was Rs.153.16, Rs.156.38 and Rs. 160.10 in the WZ, the DZ and the IZ respectively. Without the above-mentioned fixed costs, the profitability of the dairy industry is around 32%, but with the fixed costs, such as the cost for animals, land, buildings and capital, the profitability will mark a drop.
68

A production analysis, using a backward selection of explanatory variables was applied to develop the economic relationship. The model explains that, out of total variations in the production of milk, 49% wet zone, 68% intermediate zone and 42% dry zone of the variations caused by independent. The variables such as labour, feed, cost of veterinary medicine, and fixed costs were determining factors on the profitability of dairy farming.
The partial factor productivity indicates the net positive production related to labour and capital. But, it can be increased up to the optimum level.
A better farmgate price for milk, or steps to reduce the cost of production seems to be possible solutions to achieve the objectives. Considering the potentials and constraints in the dairy farm in the coconut triangle, many alternatives are available for the overall expansion of dairy industry in Sri Lanka. According to the production analysis, there is a high relationship between milk production, labour, concentrated feed, maintenance cost, etc. But, it also shows negative relationships between milk production with management type, climatic zones and herd size.
According to the cost benefit analysis, the cost benefit ratio of dairy farming is fairly good. Therefore, it is a profitable industry to invest under intensive and semi-intensive management systems.
69

REFERENCES
Annual Report, (2002), Central Bank of Sri Lanka,
Asian Productivity Organization, (1976), Livestock.
Annual Livestock Report, (2003), North Western Province, Kurunegala, Sri Lanka.
Department of Census and Statistics, 2003/2002 annual reports, Sri Lanka
Dominick, S., (2003), "Micro-economics. Theory and Applications", Fourth edition Ford Ham University, Oxford University Press, New York.
FAO, (2003) Final Report, Volume 1, Ministry of Agriculture and Livestock.
FAO, (2003) Final Report, Volume 2, Ministry of Agriculture and Livestock
French, D.L., Miller, R.C.J and Jenninings, P.G., (2002), "Cost of Production per Litre of Milk in Jamaica", Dairy Development Board, Jamaica.
Gary, F and Jenny Vanderlin, (2000), "Milk Production Costs in 1999 on Selected Wisconsin Dairy Farms", University of Wisconsin Madison.
Heady Earn O. and J.L. Dillon, (1961), "Agricultural Production Function", Low State University Press, Ames, USA.
Hemme, T. Garcia, O. and Khan, A.R., (2004), "A Review of Milk Production in Bangladesh with Particular Emphasis on Small Scale Producers Pro-poor Livestock Policy Initiatives", Working Paper No. 7, FAO.
Ibrahim M.N.M., Staal S.J, Daniel S.L.A and Thorpe W. (1999), "Appraisal of the Sri Lanka Dairy Sector", Volume 2, Colombo, Sri Lanka.
Jayathilake et al, (1995), "Dairy Faming Systems and Economics of the Production under the Existing Policies and Support Services", HARTI, Colombo, Sri Lanka - Unpublished.
Jeffery C. et al, (1982), "Livestock in Asia: International Development Research Centre", Ottawa, CA
Kotagama H.B., (1986), "An Economic Analysis on the Effect of Differential Access to Water on Paddy Production of a Gravity Irrigation System in Sri Lanka", M.Sc. Thesis, Loss Banos, Philippines
Ministry of Agriculture and Livestock, (2003), "Evaluation and Review of the Livestock Breeding Project", Colombo, Sri Lanka.
70

Ministry of Agriculture and Livestock, (2003), Policy Strategy Paper. Colombo, Sri Lanka.
Ministry of Agriculture and Livestock, (2003), Sri Lanka Livestock Statistics, 2003, Sri Lanka.
Ministry of Agriculture and Livestock and Food and Agriculture Organization, (2003), "Improved Services to the Livestock Sector in Sri Lanka", Volume 1, Colombo, Sri Lanka.
Ministry of Agriculture and Livestock and Food and Agriculture Organization, (2003), "Improved Services to the Livestock Sector in Sri Lanka", Volume 11, Colombo, Sri Lanka.
National Agricultural Policy, (2003), Ministry of Agriculture and Livestock, Colombo, Sri Lanka.
Navaratne, Maduwe, A.J.S. and Buchenrieder, (2003), "Economics of Small Scale Dairy Farming in Sri Lanka", A Case Study from Coconut Cattle Silvo Pastoral System. In Technological and Institutional Innovations for Sustainable Rural Development. Agricultural Economics and Social Sciences in the Tropics and Social Sciences in the Tropics and Sub Tropics, University of Hohenheim, Stuttgart, Germany.
Navaratne, Maduwe A.J.S. (2002), "Economics of Small Scale Dairy Farming in Sri Lanka": A Case Study from Coconut - Cattle Silvo - Pastoral System. Master Thesis, Agricultural Economics and Social Sciences in the Tropic and Sub Tropics, University of Hohenheim, Stuttgart, Germany.
Policy Strategy for Dairy Industry, (2000), Ministry of Livestock and Development, Sri Lanka.
Pundir, R.S, (1986), "Cost of Price Determination Models for Milk", Indian Journal of Agricultural Marketing, Vol. 17, (No.l), Indian Society of Agricultural Marketing, Nagpur, India.
Rajaguru, (2004), "Can we Overcome the Dream of Self Sufficiency Milk Production", Paper Article in Lankadeepa Newspaper, Sri Lanka.
Rao,V.M., (1991), "Socio-Economic Analysis of Milk Production", Reliance Publishing House, New Delhi.
Smith, G., (1982), "Weed Control and Rice", IRDP, International Weed Society. Los Banos, Lognre, Philippines.
71