Embed Size (px)
Citation preview

FACTORS AFFECTING TRANSPORT INFRASTRUCTURE
ACCOUNTING IN COUNTY GOVERNMENTS: CASE STUDY OF
NAIROBI COUNTY.
ISIAHO FREDRICK AKHONYA
D61/72760/2009
A RESEARCH PROJECT SUBMITTED IN PARTIAL
FULFILLMENT OF THE REQUIREMENTS FOR THE AWARD OF
THE DEGREE OF MASTER OF BUSINESS ADMINISTRATION,
SCHOOL OF BUSINESS, UNIVERSITY OF NAIROBI
2016

i
DECLARATION
This research project is my original work and has not been presented for a degree in any
other University
Signature---------------------------Date-------------------------------------
Isiaho Fredrick Akhonya
D61/72760/2009
This project has been submitted for examination with my approval as University
Supervisor;
Name------------------------------------ Signature--------------------- Date--------------

ii
DEDICATION
This thesis is dedicated to my late father-Patrick Asewe, who did not live to see this
work. It is also dedicated to my mother-Jane Awino, who taught me that even the largest
task can be accomplished if it is done one step at a time.
To my friends Elijah Korir and Samuel Mwendia thank you too for all the support. Not
forgetting Mr. Gichana Jay my supervisor and mentor who guided me throughout the
project, i am totally indebted.

iii
ACKNOWLEDGEMENT
I acknowledge the almighty God for his mercies and grace that have seen me come this
far. I am sincerely thankful to my wife Linnet, daughter Keira-Jayne and son
Patrick Asewe for moral and financial support during my MBA studies.
My deepest gratitude goes to Mr. Gichana Jay who has worked tirelessly to ensure my
Project is a success. He has provided me with valuable knowledge and guidance in
ensuring i understand the theoretical concept of research.

iv
ABSTRACT
Transport infrastructure is a critical ingredient in economic development at all levels of
income. It supports personal well-being and economic growth. Transport infrastructure
plays a role as a capital input into production and wealth generation. The purpose of this
study is to examine the factors that affect the effective transport infrastructure accounting
with the following objectives, to examine the role of valuation (allocation of cost) and
depreciation in transport infrastructure accounting, examine the role of maintenance,
repairs and operations in transport infrastructure accounting, examine the role of proper
financial reporting in transport infrastructure accounting. A case study of Nairobi County
has been conducted to accomplish this. The method is based on a qualitative approach
applied the descriptive survey design. A total of 50 interviews were conducted. The
interviewees possess different positions within the company, ranging from the top
management down through the junior staffs. The study concludes that Maintenance and
repairs, proper financial reporting, valuation and depreciation affect transport
infrastructure accounting. Having established the factors that affect transport
infrastructure accounting, the study recommends that organizations should update their
departmental asset valuation and depreciation registers regularly for effective recording
keeping and ideal asset valuation. The study also recommends proper financial reporting
by organizations to ensure the availability of useful financial statements that are accurate,
faithful to the financial circumstances and can be produced in time to help the decision-
making process.

v
TABLE OF CONTENTS
DECLARATION................................................................................................................ i
DEDICATION................................................................................................................... ii
ACKNOWLEDGEMENT ............................................................................................... iii
ABSTRACT ...................................................................................................................... iv
LIST OF TABLES ......................................................................................................... viii
CHAPTER ONE: INTRODUCTION ............................................................................. 1
1.1 Background of the study ............................................................................................... 1
1.1.2 The Concept of Transport Infrastructure ............................................................ 3
1.1.3 Overview of Nairobi County .............................................................................. 3
1.2 Statement of the problem .............................................................................................. 4
1.3 Research Objectives ...................................................................................................... 6
1.3.1 General Objective ............................................................................................... 6
1.3.2 Specific Objectives ............................................................................................. 6
1.4 Research questions ........................................................................................................ 6
1.5 Value of the Study ........................................................................................................ 7
CHAPTER TWO: LITERATURE REVIEW ................................................................ 8
2.1 Introduction ................................................................................................................... 8
2.2 Theoretical Foundation of the Study............................................................................. 8
2.3 Determinants of independent variables ....................................................................... 10
2.3.1 Valuation and depreciation ............................................................................... 10
2.3.2 Proper financial reporting ................................................................................. 11
2.3.3 Maintenance, Repair, Operations (MRO) ......................................................... 11
2.4 Empirical review ......................................................................................................... 11
vi
2.4.1 Valuation and depreciation ............................................................................... 11
2.4.2 Proper financial reporting ................................................................................. 13
2.4.3 Maintenance, Repair, Operations (MRO) ......................................................... 15
2.5 Conceptual Framework ............................................................................................... 18
2.6 Summary of the Literature review .............................................................................. 19
CHAPTER THREE: RESEARCH METHODOLOGY ............................................. 20
3.1 Introduction ................................................................................................................. 20
3.2 Research design .......................................................................................................... 20
3.3 Study Population ......................................................................................................... 20
3.4 Sample size and sampling technique .......................................................................... 21
3.5 Data Collection tools and techniques .......................................................................... 22
3.6 Data collection procedures .......................................................................................... 22
3.7 Data analysis and presentation .................................................................................... 23
3.8 Ethical considerations ................................................................................................. 24
CHAPTER FOUR: RESEARCH FINDINGS ............................................................. 25
4.1 Introduction ................................................................................................................. 25
4.2.1 Response rate .................................................................................................... 25
4.3 Factors that affect transport infrastructure accounting ............................................... 26
4.4 Valuation and Depreciation ........................................................................................ 27
4.4.1 Updating of department asset valuation and depreciation register ................... 28
4.5 Maintenance and Repairs ............................................................................................ 28
4.6 Financial Reporting ..................................................................................................... 29

vii
CHAPTER FIVE: DISCUSSION, CONCLUSION AND RECOMMENDATIONS 31
5.1 Introduction ................................................................................................................. 31
5.2 Discussion ................................................................................................................... 31
5.3 Conclusion .................................................................................................................. 32
5.3 Recommendation ........................................................................................................ 33
REFERENCES ................................................................................................................ 34
APPENDIX I: QUESTIONNAIRE ................................................................................. 36

viii
LIST OF TABLES
Table 2.1: Conceptual framework .................................................................................... 18
Table 3.1: Target population ............................................................................................ 21
Table 3.2: Sample size ..................................................................................................... 22
Table 4.1: Respondents perception on factors that affect transport infrastructure
accounting ........................................................................................................................ 26
Table 4.2: Respondent‟s perception on Valuation and Depreciation factors that affect
transport infrastructure accounting .................................................................................. 27
Table 4.3 Updating of department asset valuation and depreciation register .................. 28
Table 4.4: Respondent‟s perception on maintenance and repairs factors that affect
transport infrastructure accounting .................................................................................. 28
Table 4.5: Respondent‟s perception on financial reporting factors that affect transport
infrastructure accounting ................................................................................................. 29

1
CHAPTER ONE
INTRODUCTION
1.1 Background of the study
Though no definite definition of infrastructure exists, the accounting world describe
infrastructure as the basic structural foundation of a society or enterprise that includes
roads, bridges, sewers among others and are greatly regarded as a country's economic
foundation (Braconier, Pisu and Bloch, 2013; Morisugi and Hayashiyama, 1997). The
existence and condition of infrastructure affects everyone from individuals to
governments and the modern society cannot function or grow without infrastructure.
Carlevaro (2011) argue that the indirect contribution of infrastructure to economic
development arises through a multitude of channels, including the enabling of productive
private investment, the creation of new activities (supply chains), or the reshaping of
economic geography. It plays a determining role in a community's ability to diversify,
expand, cope with population increases and improve environmental conditions. A well-
developed infrastructure can to larger extent boost productivity and lower costs (Morisugi
and Hayashiyama, 1997).
Over the years, billions of United States Dollars have been invested in transport
infrastructure in both developed and developing countries (Carlevaro, 2011).In
developing countries, much of the transport infrastructure has been developed with grants
from developed countries and the World Bank. In Africa, the African Development
Corporation (ADC) has funded thousands of tarmac roads across the continent (Kumar

2
and Sankar, 2012). In Kenya, the famous Thika Super highway was a joint partnership
between the Government of Kenya (GoK) and the People‟s Republic of China (PRC)
government. Roads with Nairobi County and its environs were either funded by the
national government or international donor agencies.
Against this background, accounting of transport infrastructure is crucial to determine its
performance. A central point in deciding an administration's money related capacity to
keep up its existing service levels is access to budgetary data about the stock, utilize and
state of its vehicle framework. Such data is key for comprehension the budgetary requests
Foundation puts on governments, including the cost of its projects, and for the ongoing
upkeep and substitution of that framework (Prud'homme, 1996). At the point when the
cost of utilizing framework is not reported, the cost can't be taken into account and
governments can't sufficiently practice the stewardship responsibilities assigned to them.
Facilitate, without comprehension the future upkeep and replacement costs connected
with having framework, governments can't easily assess whether they can bear to keep up
existing projects or grow both the type and nature of projects (Fogel, 2009).
Looney (2013) includes that knowing the supply of foundation is critical in light of the
fact that it bears an immediate relationship to the cost of giving current administrations
and gives a premise to evaluating maintenance and substitution costs over the long haul.
The issues of present and future affordability and money related manageability of
foundation must be a noteworthy point of convergence in the choice making process
(Wagenvoort and Kappeler, 2010).
3
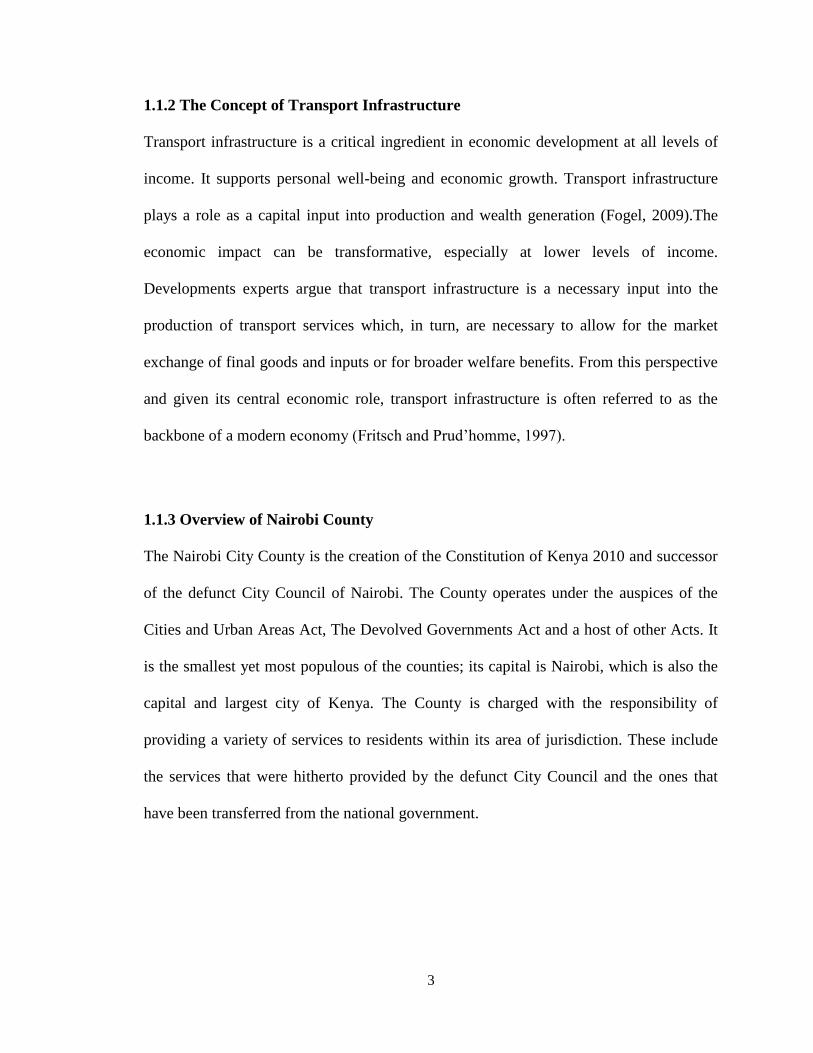
1.1.2 The Concept of Transport Infrastructure
Transport infrastructure is a critical ingredient in economic development at all levels of
income. It supports personal well-being and economic growth. Transport infrastructure
plays a role as a capital input into production and wealth generation (Fogel, 2009).The
economic impact can be transformative, especially at lower levels of income.
Developments experts argue that transport infrastructure is a necessary input into the
production of transport services which, in turn, are necessary to allow for the market
exchange of final goods and inputs or for broader welfare benefits. From this perspective
and given its central economic role, transport infrastructure is often referred to as the
backbone of a modern economy (Fritsch and Prud‟homme, 1997).
1.1.3 Overview of Nairobi County
The Nairobi City County is the creation of the Constitution of Kenya 2010 and successor
of the defunct City Council of Nairobi. The County operates under the auspices of the
Cities and Urban Areas Act, The Devolved Governments Act and a host of other Acts. It
is the smallest yet most populous of the counties; its capital is Nairobi, which is also the
capital and largest city of Kenya. The County is charged with the responsibility of
providing a variety of services to residents within its area of jurisdiction. These include
the services that were hitherto provided by the defunct City Council and the ones that
have been transferred from the national government.
4
The former include Physical Planning, Public Health, Social Services and Housing,
Primary Education Infrastructure, Inspectorate Services, Public Works, Environment
Management while the latter include Agriculture, Livestock Development and Fisheries,
Trade, Industrialization, Corporate Development, Tourism and Wildlife, Public Service
Management.
1.2 Statement of the problem
Despite the huge budgets that have been spend on transport infrastructure; most
governments do not have financial information about the transport infrastructure, its use
and maintenance especially at the local level. This lack of information can directly affect
the financial management of existing transport infrastructure systems and financial
planning for new systems (Prud‟homme, 1996). From a financial management
standpoint, information about operating costs and the extent of maintenance requirements
is crucial (Braconier, Pisu and Bloch, 2013)
Previous studies have found out that less transport infrastructure accounting happen and
this has affected the performance of the transport sector (Looney, 2013). For instance, a
study on financial failure of a city in north eastern United States found out that the
authorities were unable to adequately provide for maintenance and replacement of its
aging infrastructure. This led to collapsing of bridges and roads become unusable because
of inadequate funding (ESA, 2010).
5
Another study on transport infrastructure accounting found out that some governments
constructed facilities, such as roads and bridges, from the proceeds of various lottery
programs. These facilities were seen as a major advantage, but some did not factor into
their future funding requirements the ongoing, incremental maintenance and operating
costs of them which in turn led to the collapse of many of them (Crafts, 2009). A
different study on decision making in infrastructure accounting cited that the
understanding of the responsibilities and costs associated with infrastructure is critical to
any government and that in view of the long-lived nature of transport infrastructure, the
financial resources required must be planned for over the long term (Carlevaro, 2011).
The rainy season is a nightmare to the residents of Nairobi County and its environments.
Majority of the roads have huge potholes and almost half of the city roads get flooded
whenever the city experiences rain. This can be linked to failure of proper decision
making on appropriate financial information about the costs of operating and maintaining
the existing transport infrastructure within the city.
Though several studies have been done on transport infrastructure, the accounting part of
it has not been fully exhausted hence creating a gap (Braconier, Pisu and Bloch, 2013;
Kumar and Sankar, 2012; OECD, 2009). Many governments and private institutions have
been unable to fully account for their transport infrastructure hence increasing the cost or
surpassing the allocated budget which in turn affects the overall financial performance.
The allocation of cost and depreciation to transport infrastructure by county governments
is dominated by financial issues and has little, if any, bearing on the efficient and
effective management of these assets. It is against this backdrop that this study

6
endeavored to close this gap by examining the factors that affect the effective transport
infrastructure accounting with a case study of Nairobi County.
1.3 Research Objectives
1.3.1 General Objective
The general objective of this study was to examine the factors that affect the effective
transport infrastructure accounting in Nairobi County.
1.3.2 Specific Objectives
The specific objectives of the study were:
1. Examine the role of valuation (allocation of cost) and depreciation in transport
infrastructure accounting in Nairobi County.
2. Examine the role of maintenance, repairs and operations in transport
infrastructure accounting in Nairobi County
3. Examine the role of proper financial reporting in transport infrastructure
accounting in Nairobi County
1.4 Research questions
The study was guided by the following research questions
1. To what extent does valuation (allocation of cost) and depreciation affect
transport infrastructure accounting in Nairobi County?
2. To what extent does maintenance and repairs affect transport infrastructure
accounting in Nairobi County?
3. To what extent does proper financial reporting affect transport infrastructure
accounting in Nairobi County?
7
1.5 Value of the Study
This study sought to highlight the factors that affect transport infrastructure accounting
and the benefits that the findings accrue to the organization. The beneficiaries of the
study are the county government of Nairobi, the national government, county
governments and private institutions. The study further outlines and discuss the pitfalls
of transport infrastructure and effectively let the player(s) and policymakers in this field
have a grip of how they can be able to improve their transport infrastructure accounting
practices for better management and performance. To Nairobi County, the core
beneficiary, the study gives recommendations for better transport infrastructure
accounting. To theory, the research contributes to the existing literature on transport
infrastructure accounting.

8
CHAPTER TWO
LITERATURE REVIEW
2.1 Introduction
This chapter introduces the already existing literature reviewed from the library and
internet to provide a theoretical background for the study. It identifies the research issues
to be addressed through a conceptual framework and a detailed outline of the underlying
concepts and variables on the factors that affect transport infrastructure accounting.
2.2 Theoretical Foundation of the Study
This study depends on the three ideas of financial hypothesis. Monetary hypothesis
demands that the objective of any economy is to ideally allot its accessible assets, for
example, arrive, work, materials, gear crosswise over endless competing needs.
Defenders of this hypothesis contend that the rationale behind the hypothesis is straight-
forward in that if the general public confers assets to some set of activities while better
open doors lie in hold up, it is just harming its long-run economic success (Morisugi and
Hayashiyama, 1997).In terms of freely held common foundation and related basic
leadership, this rationale is reflected in three central (and reasonable) strategies for
monetary appraisal specifically money saving advantage examination, lifecycle costing
and financially savvy investigation.
Cost Benefit Analysis (CBA)
As indicated by the hypothesis, the reason for Cost Benefit Analysis is to look at the
immediate expenses of proposed foundation ventures, arrangements and additionally
programs against direct, estimated dollar-esteemed advantages (Wagenvoort and

9
Kappeler, 2010). In such a case, where different ventures are in examination, the one
posting the most astounding net present esteem (NPV, the distinction between estimated
discounted advantages and expenses over some pre-decided arranging skyline) is
typically recommended for execution (Kumar and Sankar, 2012).
Lifecycle Costing (LCC)
Life cycle costing is frequently used to look at the anticipated expenses of engineering
plan as well as administration choices over the normal administration life of the
infrastructure segments or frameworks being referred to (Christensen, 2005; Fabryckyand
Blanchard 1991). Like Cost Benefit Analysis, the strategy is near. The venture or choice
posting the lowest expected LCC (every now and again esteemed in yearly or present
worth terms) is typically recommended for usage.
As indicated by Wagenvoort and Kappeler (2010) LCC certainly assumes that variety in
client costs crosswise over considered alternatives are either: immaterial (in which case
the investigation can concentrate exclusively on organization and any purported outside
costs),or differ adequately to incorporate into the costing procedure yet don't warrant the
more careful and monetarily faultless bookkeeping of CBA (i.e., the experience of users
are reflected as costs as opposed to financial advantages).
Cost-effectiveness analysis (CEA)
Cost-effectiveness analysis is utilized where the interpretation of, for instance,
infrastructure execution is hard to mean some dollar-esteemed equivalent (e.g., client cost
or advantage gauges). For this situation, the adequacy per-dollar of alternative framework
10
outline or administration choices are contrasted with determines which may be best for
some pre-built up capacity. Some framework asset management frameworks (IAMS), for
instance, look for an upkeep plan that maximizes expected execution picks up (however
measured) against the treatment costs acquired (Lytton 1987).
Specialists in infrastructure improvement refer to that in any occasion, utilized fittingly
inside an open framework office, these financial apparatuses and their look inside formal
IAMS – help building managers recommend great approach, speculation, restoration and
upkeep projects to elected officials who thus then are in a position to use sound judgment
for society's benefit (Arnekudzi, Herabat, Wang and Lancaster, 2003). In this setting, it is
the chosen authority's obligation to settle on the choice with deference to the suitable
level of administration to be given. The net impact of this is the general public can be
sensibly certain that the foundation resources on which they depend are being very much
oversaw from a financial point of view and, along these lines, that their expense dollars
are being great spent.
2.3 Determinants of independent variables
2.3.1 Valuation and depreciation
There are four main determinants of depreciation namely asset cost, salvage value, useful
life and obsolescence. Each organization is free to adopt the most appropriate
depreciation method for its operations. The depreciation method should allocate asset
cost to accounting periods in a systematic and rational manner.

11
2.3.2 Proper financial reporting
The determinants of financial reporting are carelessness, lack of information,
misinterpreting data or dishonest employees. Whatever the cause, the results can range
from inconvenience to major problems. As a departmental head, one needs to be
cognizant of the potential problems and be sure that the accounting is managed correctly.
2.3.3 Maintenance, Repair, Operations (MRO)
MRO Exercises incorporate preventive support; substitution of parts, frameworks, or
segments; and different exercises expected to protect or keep up the benefit. Upkeep and
repairs, as recognized from capital changes, reject exercises coordinated towards growing
the limit of a benefit or generally updating it to serve needs not quite the same as, or
essentially more prominent than, its present utilize (Fogel, 2009).
2.4 Empirical review
2.4.1 Valuation and depreciation
Depreciation is a method of allocating the cost of a tangible asset over its useful life.
Businesses depreciate long-term assets for both tax and accounting purposes
(Wagenvoort and Kappeler, 2010).Looney (2013) adds that for accounting purposes,
depreciation indicates how much of an asset's value has been used up. For tax purposes,
businesses can deduct the cost of the tangible assets they purchase as business expenses;
however, businesses must depreciate these assets in accordance with governing rules
about how and when the deduction may be taken based on what the asset is and how long
it will last.

12
According to Kumar and Sankar (2012) devaluation cost is the intermittently distributed
cost of a benefit's unique buy esteem over the administration life of the advantage. At the
point when organizations put an altered resource in operations for use over different
years, they can't cost the benefit in one single period, yet should devalue the estimation of
the advantage after some time and charge related cost assignment to devaluation cost.
Utilizing devaluation cost helps organizations better match resource utilizes with the
advantages gave by a benefit (Cowe, 2004).
Monetary counselors urge that one noteworthy favorable position of devaluation cost is
that it helps organizations reasonably express the measure of cost brought about as a
consequence of utilizing a benefit amid a bookkeeping period to legitimately coordinate
with the income that the advantage utilize means to produce in a similar period
(Christensen, Sparks, and Kostuk, 2005). Without fittingly charging a benefit's buy cost
to devaluation cost, organizations may downplay or exaggerate add up to costs and in this
way misquote incomes, reporting deluding money related data.
Creates (2009) add that utilizing devaluation cost additionally helps organizations
effectively report resources at their net book esteem. Organizations at first record altered
resources at their unique buy costs. Nonetheless, Fogel (2009) takes note of that benefit
esteem decay after some time as the aftereffect of advantage uses that reasonable cause
an advantage's wear and tear. In this manner, organizations must change a benefit's
esteem to its the net outstanding quality. An advantage's net book esteem is the first buy
cost subtracted by the benefit's collected devaluation, the aggregate deterioration cost
from every single past period.

13
As indicated by Sparks (2007) depreciation cost gives an approach to recuperating the
buy cost of an advantage. Not at all like resource expensing by which organizations can
recoup the cost of a benefit instantly, utilizing resource deterioration, organizations
recuperate add up to resource cost over the valuable existence of the advantage through
occasional devaluation cost. Carlevaro (2011) refers to that devaluation cost is a non-
money charge against income, which permits organizations to set aside part of the income
as assets for future resource substitution. Without charges of devaluation cost, the
segment of income may have been improperly utilized for different purposes.
Different creators refer to that deterioration cost helps organizations produce impose
reserve funds (Braconier, Pisu and Bloch, 2013; Carlevaro, 2011; Fogel, 2009). Assess
rules permit deterioration cost be utilized as duty derivation against income in touching
base at assessable salary. The higher the devaluation cost, the lower the assessable pay
and, in this way, the more the duty funds. Actually, here and there organizations utilize
quickened devaluation to charge higher deterioration cost in specific periods when they
hope to have higher income to deliberately bring down assessable salary and accomplish
impose investment funds (Townley, 1998).
2.4.2 Proper financial reporting
Fogel (2009) cite that accounting rules and regulations exist to ensure that financial
statements are useful to their end users in their financial decision-making. For financial
statements to be useful, the information presented therein must be accurate, faithful to the
financial circumstances and be produced in time to help the decision-making process.
Poor ethics in accounting result not only in increased incidences of criminal activities, but

14
also hurt the business through harming its reputation and rendering their financial
statements untrustworthy and thus useless (Fabrycky and Blanchard, 1991).
Sparks (2007) notes that inaccurate financial reporting may be the result of carelessness,
lack of information, misinterpreting data or dishonest employees. Whatever the cause, the
results can range from inconvenience to major problems. As a departmental head, one
needs to be cognizant of the potential problems and be sure that the accounting is
managed correctly.
The bad numbers that are the result of inaccurate financial reporting lead to bad decision-
making (Carlevaro,2011). For many small businesses that are too small to hire a full-time
accountant, inaccurate reporting may be difficult to ferret out. The owner may accept the
reports on face value, which will distort his ability to track income and expenses as well
as to budget accurately. Miscalculating profit is detrimental whether the number is too
low or too high. If profit is reported too low, it will result in the company being
undervalued. If profit is reported too high, the consequence will be high tax liability
(Townley, 1998).
The quality of financial reporting affects stakeholder‟s relationship. Stakeholders in the
organization or company may be affected by inaccurate reporting, especially if they
uncover the inaccuracies. Faulty reporting will hurt the company's credibility with the
board of directors and investors. If the business is a non-profit organization, faulty
reporting may affect donations. Crafts (2009) advise that if one is planning to sell the
business, he may enlist the services of an appraiser. He is not an accountant and will

15
accept the reports at face value. The organization will then risk a buyer uncovering the
inaccuracies or worse, buying the business and discovering the flaws after the sale. An
outside independent auditor who will assure that generally accepted accounting principles
are followed can allay these woes.
However, whatever the cause for inaccuracy, Carlevaro (2011) cite that the organization
can take steps to correct the deficiencies. Frequently, bookkeeping in a small business is
handled by a family member or someone without accounting experience. Make sure that
those who keep the books have the training and expertise to fulfill the role. Establish
procedures for all the accounting activities. Design a transaction registers and journals to
make them easy to use and review. If the bookkeeping is done manually or with simple
spreadsheets, the organization can consider purchasing accounting software and should
not hesitate to hire an outside auditor if there are any concerns about the accuracy of your
financial reports (Crafts, 2009).
2.4.3 Maintenance, Repair, Operations (MRO)
Maintenance, repair, operations (MRO) items are supplies consumed in the production
process but which do not either become part of the end product or are not central to the
firm's output. MRO items include consumables (such as cleaning, laboratory, or office
supplies), industrial equipment (such as compressors, pumps, valves) and plant upkeep
supplies (such as gaskets, lubricants, repair tools), and computers, fixtures, furniture
among others (ESA, 2010).

16
MRO reporting empowers the legislature to be accountable to natives for the best
possible organization and stewardship of its benefits. In particular, MRO reporting helps
clients by giving a substance's reasonable gauge of MRO sums and the effectiveness of
benefit upkeep rehearses the elements utilize in satisfying their missions (Fritsch and
Prud'homme, 1997).
Upkeep and repairs are exercises coordinated toward keeping altered resources in an
acceptable condition. Activities incorporate preventive support; substitution of parts,
systems, or components; and different exercises expected to save or keep up the benefit.
Support and repairs, as recognized from capital changes, avoid exercises coordinated
towards expanding the limit of a benefit or generally updating it to serve needs not the
same as, or significantly more noteworthy than, its present utilize (Fogel, 2009).
Bookkeeping specialists refer to that sums for MRO might be measured utilizing the
accompanying however not constrained to: condition appraisal surveys, life-cycle cost
figures, or other techniques that are like the condition evaluation review or life-cycle
costing methods. Condition appraisal surveys are intermittent visual (i.e., physical)
examinations of property, plant and gear (PPE) to decide their present condition and
assessed cost to correct any lacks. Then again, life-cycle costing is a securing or
acquirement system which considers operating, maintenance, and different expenses
notwithstanding the procurement cost of advantages. Since it comes about in forecasts of
upkeep and repairs cost, these figures may serve as a premise against which to contrast
genuine support and repairs cost with touch base at a gauge of deferred support and
repairs (Kumar and Sankar, 2012).
17
Wagenvoort and Kappeler (2010) refer to that the administration ought to figure out
which strategies to apply and what condition principles are acceptable. Once decided,
condition principles, related appraisal techniques, and reporting arrangements ought to be
reliably connected unless administration decides that changes are important. In spite of
the fact that condition data is fundamental in creating MRO amounts, reporting of
condition data is not required. Changes to strategies or formats that administration
decides are vital ought to be joined by an explanation documenting the justification for
the change and any related effect on the MRO estimate(s).Looney (2013) add that to best
meet the objective of MRO reporting, correspondence with, and thought of, input from
experts in different trains, for example, designing, offices administration, finance,
budgeting and bookkeeping is vital.
As indicated by Morisugi and Hayashiyama (1997) MRO ought to be measured and
reported for promoted general PPE and stewardship PPE. MRO likewise might be
measured and reported for non-promoted or completely devalued general PPE. MRO
ought to incorporate supported upkeep and repairs (MR) that have been delayed for a
future period and also unfunded MR. MRO on idle and additionally abundance PPE
should be incorporated to the degree that it is required to keep up idle or overabundance
PPE inacceptable condition. For instance, latent PPE might be kept up or repaired either
to comply with existing laws and controls, or to save the estimation of PP&E pending
disposal.

18
Kumar and Sankar (2012) reasons that MRO reporting ought to give MRO starting and
closure parities for the reporting period and account data identified with MRO exercises.
Substances are required to present both subjective and quantitative information. A
synopsis of the element's MR approaches and brief portrayal of how they are applied;
method of measuring MRO, Policies for positioning and organizing MR exercises,
calculates the element considers deciding worthy condition principles, whether MRO
relates exclusively to promoted general PPE and non-promoted stewardship PPE or
additionally to sums identifying with non-promoted or completely devalued general PPE,
promoted general PPE, and non-promoted legacy resources and stewardship arrive for
which administration does not quantify or potentially report MRO and the reason for the
prohibition (Crafts, 2009)
2.5 Conceptual Framework
Table 2.1: Conceptual framework
Valuation and depreciation
Proper financial reporting
Dependent variables
Independent variable
Transport infrastructure
accounting
Maintenance, Repair, Operations
(MRO)

19
The conceptual framework highlights both the independent variables and the dependent
variables. The independent variables are Valuation and depreciation, Proper financial
reporting Maintenance, Repair, Operations (MRO). All the three variables play a key role
in transport infrastructure accounting and are being used in this study as the guides to the
study.
2.6 Summary of the Literature review
This chapter has reviewed existing literature on transport infrastructure accounting based
on Valuation and depreciation, Proper financial reporting Maintenance, Repair,
Operations (MRO). The literature review has established that valuation and depreciation
helps companies to fairly state the amount of expense incurred as a result of using an
asset during an accounting period to properly match with the revenue that the asset use
intends to generate in the same period and that without appropriately charging an asset‟s
purchase cost to depreciation expense, companies may understate or overstate total
expenses and thus misstate revenues, reporting misleading financial information.
Maintenance, repair, operations (MRO)reporting enables the government to be
accountable to citizens for the proper administration and stewardship of its assets and
assists users by providing an entity's realistic estimate of MRO amounts and the
effectiveness of asset maintenance practices the entities employ in fulfilling their
missions. Proper financial reporting is crucial for financial statements to be useful and the
information presented therein must be accurate, faithful to the financial circumstances
and be produced in time to help the decision-making process.

20
CHAPTER THREE
RESEARCH METHODOLOGY
3.1 Introduction
This chapter describes the methods that were used to carry out the research. It entails
research design, population, and the entire outline for the data collection, measurements
and methods of data analysis to be used.
3.2 Research design
The research applied a descriptive survey design which is usually used in the preliminary
and exploratory studies to allow researchers to gather information, summarize, present
and interpret it (Orondo, 2002). According to Mugenda and Mugenda (1999), the purpose
of descriptive research is to determine and report the way things are, attempting to
describe such things as behaviour, attitudes, values and characteristics. We can thus
conclude that, descriptive research intends to produce statistical information about
aspects thus making it the most suitable method for the study topic for it would allow for
unbiased research findings.
3.3 Study Population
Target population is as a universal set of the study of all members such as real
hypothetical set of people, events or objectives to which an investigator wishes to
generalize results (Kothari, 2008). In this case, the target population was Nairobi County
employees working in public works department. The department has a total of 486 staff
members inclusive of senior staff, middle level management and junior staff (GCN,
2016).

21
Table 3.1: Target population
Category Frequency Percentage
Senior staff 35 7.2
Middle level management 169 34.8
Junior staff 282 58
Total 486 100
Source: NCC HR, (2016).
3.4 Sample size and sampling technique
Sampling is the process of drawing a study sample from the study population. The main
purpose is to obtain a representative group which enables researcher get information
about a study population. The technique used therefore should ensure that it‟s the
representative of a population and not biased in any way. Ngechu (2004) emphasizes the
importance of selecting a representative sample by use of a sampling frame. From the
sampling frame, the required number of subjects, respondents, elements or firms is
selected in order to make a sample. Stratified random sampling technique was used to
select the sample.
According to Deming (1990) stratified random sampling technique produce estimates of
overall population parameters with greater precision and ensures a more representative
sample is derived from a relatively homogeneous population. Stratification aims to
reduce standard error by providing some control over variance. From each stratum the
study used simple random sampling to select 50 respondents; this will be 10% of the
entire population, According to Mugenda and Mugenda (1999), a representative sample

22
is one that represents at least 10% of the population of interest. Random sampling
frequently minimizes the sampling error in the population. This in turn increases the
precision of any estimation methods used (Cooper and Schindler, 2003).
Table 3.2: Sample size
Category Frequency Percentage Sample size
Senior staff 35 10 4
Middle level management 169 10 16
Junior staff 282 10 30
Total 486 10 50
Source: NCC HR, (2016).
3.5 Data Collection tools and techniques
The primary data collection method was the most suitable for this study and entailed the
use of questionnaires. This is due to its advantage of allowing the researcher to get first-
hand information from the respondents. In this case, the researcher self-administered the
questionnaires. The questionnaires had both open ended and closed ended questions to
capture the objectives of the research. Close-ended questions deal with numerical values
while open ended questions allow for explanation of facts. The data that was collected
was based on the three variables discussed in chapter two.
3.6 Data collection procedures
Before the actual data collection, the researcher carried out a pilot study to pre-test and
validate the questionnaire. According to Somekh, and Cathy (2005) validity is the degree
by which the sample of test items represents the content the test is designed to measure.
Content validity which is employed by this research is a measure of the degree to which

23
data collected using a particular instrument represents a specific domain or content of a
particular concept. Mugenda and Mugenda (1999) contend that the usual procedure in
assessing the content validity of a measure is to use a professional or expert in a
particular field.
To establish the validity of the research instruments the researcher sought the opinions of
experts in the field of study especially the lecturers in the School of Business. This
facilitated the necessary revision and modification of the research instrument thereby
enhancing validity and reliability. Reliability refers to the consistency of measurement
and is frequently assessed using the test–retest reliability method (Walliman, 2001).
Reliability is increased by including many similar items on a measure, by testing a
diverse sample of individuals and by using uniform testing procedures. The researcher
selected a pilot group of 10 individuals from the target population to test the reliability of
the research instrument. This was achieved by first stratifying the individuals according
to their level of employment. The researcher then administered the questionnaires to
selected employees through „drop and pick later‟ method.
3.7 Data analysis and presentation
This includes the process of packaging the collected information, putting it in order and
structuring main components in a way that the findings can be easily and effectively
communicated. After the distribution of the questionnaires, they were adequately checked
for clarifications and to ensure that all the questions have been answered. The data was
then be analyzed and the findings recorded by use of tables and figures. Responses were
analyzed in percentages. Percentages were calculated by getting the response divided by

24
the total number multiplied by a hundred. The computer package SPSS- Statistical
Package for Social Sciences was used as an aid.
3.8 Ethical considerations
Due to ethical considerations, the researcher sent out an initial contact letter alerting
respondents that they would participate in the study. Confidentiality of all participants
were assured at all levels of the research. Names of the respondents were not included in
the questionnaire. In addition, the respondents had the option of participating or declining
to the process.

25
CHAPTER FOUR
RESEARCH FINDINGS
4.1 Introduction
This chapter presents the findings and results of the study in the order of the research
objectives. The results are based on a response rate of 90% (n=50).
4.2.1 Response rate
The response rate was high at 90% (45 Staffs), only 10% (5 staffs) of the administered
questionnaires were returned unanswered or with errors. The majority of the 45
respondents were male at 63% (n=30) while the female respondents constituted 37%
(n=15) of the sample.
In terms of age, the 18-35 age group of respondents consisted of 22% (n=10) of the
respondents, the others were as follows; 36-45 (45%), 46-50 (22%), > 50 (11%). The 36-
45 age groups formed the largest proportion of the study population, with more than 40%
representation from the age categories in this group. Years of work at the Public works
department show that 44% of the employees had worked for over 5 years at public works
department. This was followed by those who had worked for a period between 3 and 5
years (40%), and 1-2years (9%). The least group of workers were those who had worked
for less than 1 year (7%).In terms of position in the organization, the middle level
management constituted 71% of the respondents. The others are junior staff and senior
staff at 22% and 7% of the sample respectively. On the respondents understanding on
transport infrastructure accounting, 22.2% of the respondents fully understand transport
infrastructure accounting and 44.4% of the respondents have partial understanding of on

26
transport infrastructure accounting 4.4% and 6.6% do not have any clue or are not sure
respectively.
4.3 Factors that affect transport infrastructure accounting
Table 4.1: Respondents perception on factors that affect transport infrastructure
accounting
Factors Strongly
disagree
Disagree Neither
agree nor
disagree
Agree Strongly
agree
Total Mean Rank
Valuation and
depreciation
0(0) 2(4.4) 3(6.6) 30(66.6) 10(22.2) 45(100) 4.06 3
Maintenance
and repairs
0(0) 5(11.1) 5(11.1) 25(55.5) 15(33.3) 45(100) 4.44 1
Proper
Financial
reporting
0(0) 0(0) 0(0) 40(88.8) 5(11.5) 45(100) 4.11 2
Values in parentheses ( ) are row percentages, while values outside parentheses are
frequencies.
Table 4.1 show that about 33% of the respondents strongly agreed that Maintenance and
repairs is a factor that affects transport infrastructure accounting. About 60% of the
respondents agreed that Valuation and depreciation are factors that affect transport
infrastructure accounting. None of the respondents disagreed that Proper Financial
reporting are factors that affect transport infrastructure accounting. Less than 4% of the
respondents disagreed that Valuation and depreciation are factors that affect transport
infrastructure accounting.

27
On ranking the factors on the basis of mean, the factors, in order of priority, were rated as
Maintenance and repairs, proper financial reporting, Valuation and depreciation.
4.4 Valuation and Depreciation
Table 4.2: Respondent’s perception on Valuation and Depreciation factors that
affect transport infrastructure accounting
Factors Strongly
disagree
Disagree Neither
agree nor
disagree
Agree Strongly
agree
Total Mean Rank
Correct
reporting of
assets
2(4.4) 3(6.6) 5(11.1) 30(66.6) 5(11.1) 45(100) 3.73 3
Cost
Recovery
0(0) 0(0) 2(4.4) 40(88.8) 3(6.6) 45(100) 4.02 1
Tax
Deduction
1(2.2) 2(4.4) 5(11.1) 30(66.6) 7(15.5) 45(100) 3.88 2
Values in parentheses ( ) are row percentages, while values outside parentheses are
frequencies.
Table 4.2 shows that 15.5% of the respondents strongly agreed that tax deduction is a
valuation and depreciation factors that affect transport infrastructure accounting. About
60% of the respondents agreed that correct reporting of assets and cost recovery are
valuation and depreciation factors that affect transport infrastructure accounting. About
6% of the respondents disagreed that correct reporting of assets are valuation and
depreciation factors that affect transport infrastructure accounting. None of the
respondents disagreed that cost recovery is valuation and depreciation factors that affect
transport infrastructure accounting. On ranking the factors on the basis of mean, the
factors, in order of priority, were rated as cost recovery, tax deduction and correct
reporting of assets.

28
4.4.1 Updating of department asset valuation and depreciation register
Table 4.3 shows that 67% of the respondents agree that department asset valuation and
depreciation register is updated regularly will 22% of the respondents are not sure.
Table 4.3 Updating of department asset valuation and depreciation register
Content Frequency Percentage
Yes 30 67
No 5 11
Not sure 10 22
Total 45 100
4.5 Maintenance and Repairs
Table 4.4: Respondent’s perception on maintenance and repairs factors that affect
transport infrastructure accounting
Factors Strongly
disagree
Disagree Neither
agree nor
disagree
Agree Strongly
agree
Total Mean Rank
Keeping
fixed
assets in an
acceptable
Condition
0(0) 1(2.2) 1(2.2) 40(88.8) 3(6.6) 45(100) 3.99 1
Improving
infrastruct
ure
reporting
1(2.2) 2(4.4) 4(8.8) 32(71.1) 6(13.3) 45(100) 3.78 3
Budgeting
and
decision
making
1(2.2) 2(4.4) 5(11.1) 30(66.6) 7(15.5) 45(100) 3.88 2
Values in parentheses ( ) are row percentages, while values outside parentheses are
frequencies.
29
Table 4.4 shows that 15.5% of the respondents strongly agreed that budgeting and
decision making is maintenance and repairs factors that affect transport infrastructure
accounting. About 70% of the respondents agreed that improving infrastructure reporting
and Keeping fixed assets in an acceptable condition are maintenance and repairs factors
that affect transport infrastructure accounting. Only 2.2% of the respondents disagreed
that budgeting and decision making is maintenance and repairs factors that affect
transport infrastructure accounting. On ranking the factors on the basis of mean, the
factors, in order of priority, were rated as keeping fixed assets in an acceptable condition,
budgeting and decision making, improving infrastructure reporting.
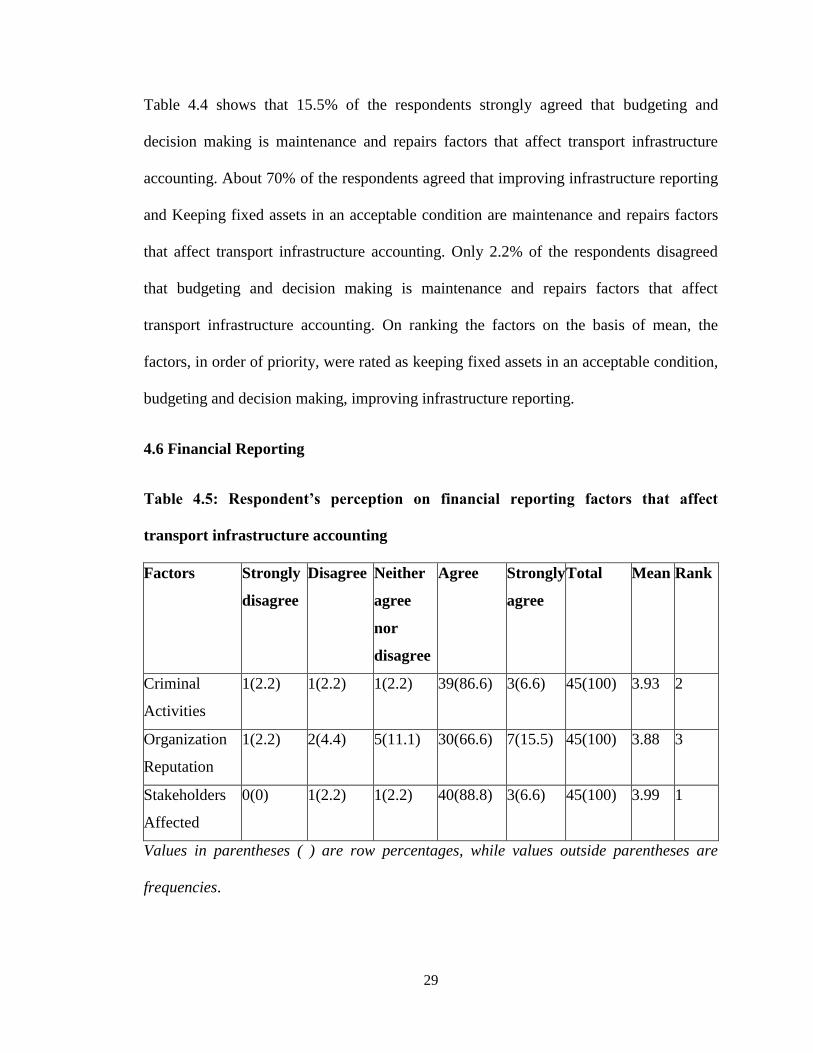
4.6 Financial Reporting
Table 4.5: Respondent’s perception on financial reporting factors that affect
transport infrastructure accounting
Factors Strongly
disagree
Disagree Neither
agree
nor
disagree
Agree Strongly
agree
Total Mean Rank
Criminal
Activities
1(2.2) 1(2.2) 1(2.2) 39(86.6) 3(6.6) 45(100) 3.93 2
Organization
Reputation
1(2.2) 2(4.4) 5(11.1) 30(66.6) 7(15.5) 45(100) 3.88 3
Stakeholders
Affected
0(0) 1(2.2) 1(2.2) 40(88.8) 3(6.6) 45(100) 3.99 1
Values in parentheses ( ) are row percentages, while values outside parentheses are
frequencies.
30
Table 4.5 shows that about 15% of the respondents strongly agreed that organization
reputation is financial reporting factor that affect transport infrastructure accounting.
About 60% of the respondents agreed that organization reputation, criminal activities and
stakeholders affected are financial reporting factors that affect transport infrastructure
accounting. Only 2.2% of the respondents disagreed that criminal activities and
organization reputation are financial reporting factors that affect transport infrastructure
accounting. About 11% of the respondents neither agreed nor disagreed that organization
reputation is a financial reporting factors that affect transport infrastructure accounting.
On ranking the factors on the basis of mean, the factors, in order of priority, were rated as
stakeholders affected, criminal activities and organization reputation.
31
CHAPTER FIVE
DISCUSSION, CONCLUSION AND RECOMMENDATIONS
5.1 Introduction
This chapter presents the summary of findings of the research, discusses the results,
draws conclusions and makes recommendations for transport infrastructure accounting.
5.2 Discussion
Significant findings that arose from the study were;
The factors that affect transport infrastructure accounting in order of priority were:
Maintenance and repairs, proper financial reporting, valuation and depreciation. The
questionnaire had provision for the respondents to add other factors. Of the factors added
by the respondents, they were all related to the above factors. For instance, the
respondents cited timely repairs and replacements, proper record keeping and
accountability in budgeting.
The valuation and depreciation roles that affect transport infrastructure accounting in
order of priority were: cost recovery, tax deduction and correct reporting of assets. The
questionnaire had provision for the respondents to add other roles. Of the roles added by
the respondents, they were all related to the above roles. For instance, the respondents
cited helping companies better match asset uses with the benefits provided by an asset.
The maintenance and repairs roles that affect transport infrastructure accounting in order
of priority were: keeping fixed assets in an acceptable condition, budgeting and decision
making, improving infrastructure reporting. The questionnaire had provision for the

32
respondents to add other roles. Of the roles added by the respondents, they were all
related to the above roles. For instance, the respondents cited proper administration and
stewardship of assets.
The financial reporting roles that affect transport infrastructure accounting in order of
priority were: stakeholders affected criminal activities and organization reputation. The
questionnaire had provision for the respondents to add other roles. Of the roles added by
the respondents, they were all related to the above factors. For instance, the respondents
cited hurting organizations credibility.
5.3 Conclusion
Transport infrastructure is a critical ingredient in economic development at all levels of
income. It supports personal well-being and economic growth. Transport infrastructure
plays a role as a capital input into production and wealth generation. Despite the huge
budgets that have been spend on transport infrastructure; most governments do not have
financial information about the transport infrastructure, its use and maintenance
especially at the local level. This lack of information can directly affect the financial
management of existing transport infrastructure systems and financial planning for new
systems.
From a financial management standpoint, information about operating costs and the
extent of maintenance requirements is crucial. Many governments and private institutions
have been unable to fully account for their transport infrastructure hence increasing the
cost or surpassing the allocated budget which in turn affects the overall financial
performance. The allocation of cost and depreciation to transport infrastructure by county

33
governments is dominated by financial issues and has little, if any, bearing on the
efficient and effective management of these assets.
This study has tested three key variables in that affect transport infrastructure accounting.
Hence, this study concludes that Maintenance and repairs, proper financial reporting,
valuation and depreciation affect transport infrastructure accounting.
5.3 Recommendation
Having established the factors that affect transport infrastructure accounting, the study
recommends that organizations should update their departmental asset valuation and
depreciation registers regularly for effective recording keeping and ideal asset valuation.
The study also recommends proper financial reporting by organizations to ensure the
availability of useful financial statements that are accurate, faithful to the financial
circumstances and can be produced in time to help the decision-making process.

34
REFERENCES
Arnekudzi, A., Herabat, P., Wang, S., Lancaster, C. (2003). Multipurpose asset
valuation for civil infrastructure. Transportation Research Record 1812: 211-
218.
Braconier, H., Pisu, M., Bloch, D. (2013), The Performance of Road Transport
Infrastructure and its Links to Policies, OECD Economics Department
Working Paper No. 1016.
Carlevaro, F.C. (2011), Costing improved water supply systems for developing
countries, Water Management, Proceedings of the Institution of Civil
Engineers, Volume 164, Issue WM3, March, pp. 123-134.
Christensen, N., Sparks, A. and Kostuk, J. (2005). A method-based survey of
lifecycle costing literature pertinent to infrastructure design and renewal.
Canadian Journal of Civil Engineering 32: 250-259.
CICA (2007). Guide to accounting for and reporting tangible capital assets.
Canadian Institute of Chartered Accountants.
Cowe, L. (2004). Analysis of asset valuation methods for civil infrastructure. Ph.D.
thesis. University of Waterloo, Waterloo, Ont.
Crafts, N. (2009), "Transport Infrastructure Investment: Implications for Growth and
Productivity", Oxford Review of Economic Policy, 25, pp. 327-343.
ESA (2010), Manual on Government Deficit and Debt, 3rd Edition, Eurostat
Fabrycky, W., Blanchard, S. (1991). Life-cycle cost and economic analysis. Prentice-
Hall, Inc.
Fogel, M. (2009), Railway and American Economic Growth, the Johns Hopkins
Press.
Fritsch, B., R. Prud‟homme (1997), “Measuring the contribution of Road
infrastructure to Economic Development in France”, in: E. Quinet and R.
Vickerman (eds.) (1997), The Econometrics of Major Transport
infrastructures, Macmillan, London.

35
Herz, R. (1998). Exploring rehabilitation needs and strategies for water distribution
networks. Journal of Water Supply: Research and Technology - Aqua 47(6):
275-283.
Irrgang, F., Maze, T. (1993). Status of Pavement Management Systems and
DataAnalysis Models at State Highway Agencies. Transportation Research
Record 1397: 1-6.
Kumar, A., Sankar, T. (2012), “Measurement and issues: capital formation in India‟s
transport sector”, unpublished working paper.
Looney, R. (2013), “The regional impact of infrastructure investment in
Mexico”, Regional Studies, 15
Morisugi, M., Hayashiyama, Y. (1997), “Post-Evaluation of the Japanese Railway
Network, 1875-1940”, in: Quinet, E. and R. Vickerman (eds.) (1997), The
Econometrics of Major Transport infrastructures, Macmillan, London.
NAMSG. (2006). New Zealand Infrastructure Valuation and Depreciation Guidelines
(Ed.2.0). National Asset Management Steering Group, New Zealand.
OECD (2009), Measuring Capital, OECD Manual, Second Edition, OECD Paris
Prud‟homme, R. (1996), “Assessing the role of Infrastructure in France by Means of
Regionally Estimated Production Functions”, in: Batten, D. and C. Karlsson
Sparks, A. (2007). Tangible capital asset valuation for PS 3150
(presentation).Presentation made at Preparing for PS 3150 and Beyond
workshop, April 20, Vancouver B C. Centre for Infrastructure Management,
British Columbia Institute of Technology.
Townley, C. (1998). Principles of cost-benefit analysis in a Canadian
context.Prentice-Hall Canada Inc.
Wagenvoort R., Kappeler, C. (2010), ”Infrastructure finance in Europe: Composition,
evolution and crisis impact”, EIB Papers, Vol. 15, No. 1, pp. 16-39.

36
APPENDIX 1: QUESTIONNAIRE
FACTORS AFFECTING TRANSPORT INFRASTRUCTURE ACCOUNTING IN
COUNTY GOVERNMENTS
A CASE STUDY OF NAIROBI COUNTY
This research is meant for academic purpose. You‟re kindly requested to provide answers
to these questions honestly and precisely as possible. Responses will be treated with
utmost confidentiality. Please tick [√] appropriate or fill in the required information on
the spaces provided.
SECTION A: DEMOGRAPHIC INFORMATION
1. Gender of the respondent
[ ] Male
[ ] Female
2. Age in years of respondent
[ ] 18-35
[ ] 36-45
[ ] 46-50
[ ] Above 50
3. Years worked at public works department
[ ] Below 1 year
[ ] Between 1- 2 years
[ ] Between 3 - 5 years
[ ] Over 5years
4.What is your position in the organisation?
[ ] Senior staff
[ ] Middle level management
[ ] Junior staff

37
SECTION B: TRANSPORT INFRASTRUCTURE ACCOUNTING
1. To what extent do you understand transport infrastructure accounting? Please rank
between 1-5 (5 being the highest).
Not at all Small Extent Not Sure Some Extent Large extent
1 2 3 4 5
2. To what extent do you think the following factors that affect transport infrastructure
accounting? Please rank between 1-5 (5 being the highest priority)
1
Strongly
Agree
2
Disagree
3
Neither agree
nor disagree
4
Agree
5
Strongly
Agree
Valuation and
depreciation
Maintenance and
repairs
Proper Financial
reporting
3. In your opinion what other factors would you add to the above?
................................................................................................................................................
................................................................................................................................................
................................................................................................................................................
.......................................................................................................................

38
SECTION C: VALUATION AND DEPRECIATION
4. To what extent do you think the following are roles of valuation and depreciation in
transport infrastructure accounting? Please rank between 1-5 (5 being the highest
priority)
1
Strongly
Agree
2
Disagree
3
Neither agree
nor disagree
4
Agree
5
Strongly
Agree
Correct reporting
of assets
Cost Recovery
Tax Deduction
5. In your opinion what other roles would you add to the above?
..........................................................................................................................................
..........................................................................................................................................
..........................................................................................................................................
.........................................................................................................................................
6. Is the department asset valuation and depreciation register updated?
[ ] Yes
[ ] No
[ ] Not sure
39
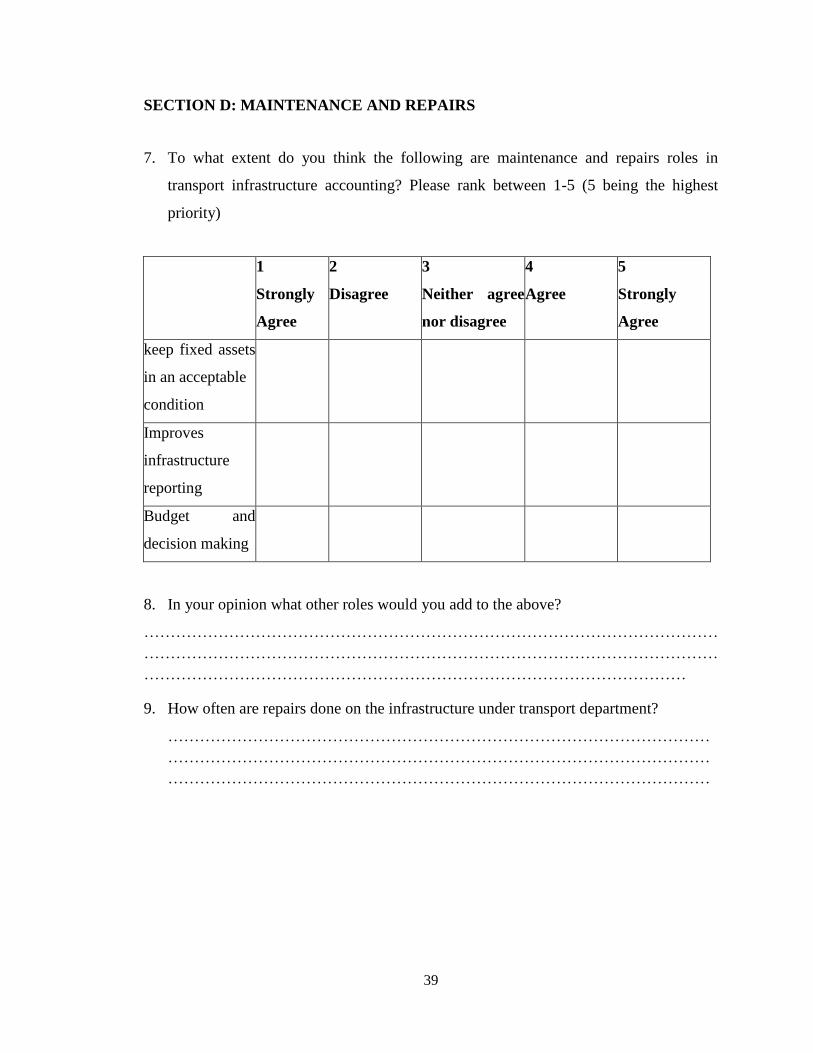
SECTION D: MAINTENANCE AND REPAIRS
7. To what extent do you think the following are maintenance and repairs roles in
transport infrastructure accounting? Please rank between 1-5 (5 being the highest
priority)
1
Strongly
Agree
2
Disagree
3
Neither agree
nor disagree
4
Agree
5
Strongly
Agree
keep fixed assets
in an acceptable
condition
Improves
infrastructure
reporting
Budget and
decision making
8. In your opinion what other roles would you add to the above?
………………………………………………………………………………………………
………………………………………………………………………………………………
…………………………………………………………………………………………
9. How often are repairs done on the infrastructure under transport department?
…………………………………………………………………………………………
…………………………………………………………………………………………
…………………………………………………………………………………………
40
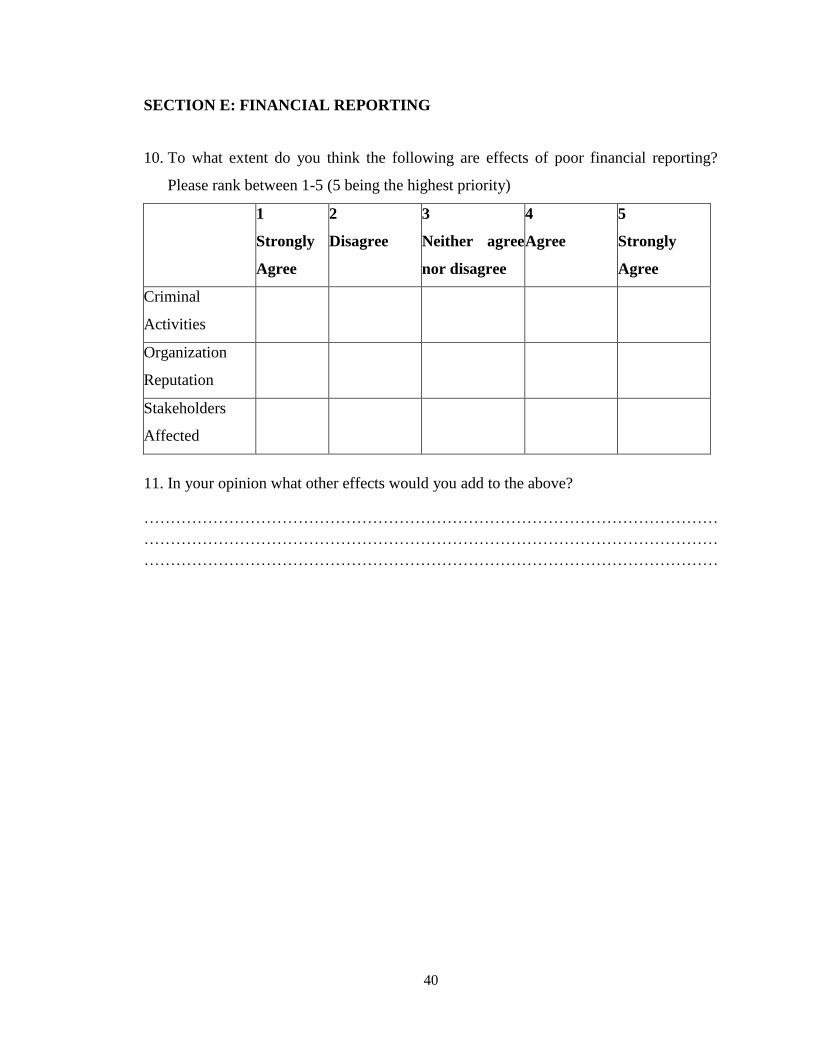
SECTION E: FINANCIAL REPORTING
10. To what extent do you think the following are effects of poor financial reporting?
Please rank between 1-5 (5 being the highest priority)
1
Strongly
Agree
2
Disagree
3
Neither agree
nor disagree
4
Agree
5
Strongly
Agree
Criminal
Activities
Organization
Reputation
Stakeholders
Affected
11. In your opinion what other effects would you add to the above?
………………………………………………………………………………………………
………………………………………………………………………………………………
………………………………………………………………………………………………