Embed Size (px)
Citation preview
Man In India, 95 (3) : 605-615 © Serials Publications
Address for communication: Samant Shant Priya, Associate Professor and HOD (MBA), SinhgadInstitute of Business Administration and Computer Application (SIBACA), Lonavala, Pune – 410401,Maharashtra – India, E-mail: [email protected], Anup Mayank, IBM India Pvt Ltd., Senior StaffSoftware Engineer, E-mail: [email protected], Kamal Panda, 3dPLM Software SolutionsLtd., Software Engineer, E-mail: [email protected], Rutuja Jadhav, Infosys Limited, Senior SystemEngineer, E-mail: [email protected] and Samir Patil, IBM India Pvt Ltd., IT Specialist,E-mail: [email protected]
FACTORS AFFECTING WORK LIFE BALANCE OFIT INDUSTRY PROFESSIONALS IN PUNE
Samant Shant Priya, Anup Mayank, Kamal Panda, Rutuja Jadhav andSamir Patil
This study explores the Work Life Balance of IT Employees in Pune, Maharashtra, India. A self-developed questionnaire was distributed by students in this group to their colleagues in theorganization where they are currently working. These questions were posted online using GoogleForms. Questions were raised on the three premises. (1)What are the inner traits of a person?Does he/she has positive attitude (2) How supportive is respondents family environment? (3)Howcooperative is the organization where respondent is working. Analysis of data shows that Age isa factor in life balance, whereas education and gender doesn’t play a major role.
Introduction
Ever since the industrial revolution, importance of working in an organization hasbeen growing. In the beginning days work was more manual in nature. There werefactory workers, typists etc. Then came the Information Technology revolution.With the advent of information technology, business processes changed drastically.Instead of searching for information in large file cabinets manually, it comes to auser on his/her computer, mobile phone etc travelling via network connection. Tomake it happen there are several information technology vendors who developsoftware programs and hardware design. Workers in these companies are wellpaid for their skill. But they are constantly pressured to deliver on tight deadlinesand work long hours. Many a times their work hours don’t fall to the normal 8AM-5PM schedule as they need to collaborate with team-members across the globe.Thus we find that work is intruding in the so called personal life. This study aimsto find out how IT company employees are working on maintaining a “Work LifeBalance” and what are the hindrances to this.
Review of Literature
Work life balance has been a fascinating topic for researchers and social scientists.In her famous work [Caproni, 1997] tries to find out if seeking balance is reallyneeded? Author argues that traditional view of maintaining work life balance is in

606 MAN IN INDIA
fact counterproductive and limits one’s ability to live a fulfilling and meaningfulfile. She has experimented with the ideas proposed by previous authors in her ownlife and based on her experience this article has been written. She experimentedwith several options of being efficient and has found that many of those experimentswere indeed fruitful. But she felt that extreme efficiency has negative consequencesof not being able to make new friends and explore new things. She argues thatliving a goal oriented life has negative impact and in fact is preventing a personfrom living meaningful life. She points that life if often unpredictable and makingdetailed plans are of not much use. People will have to deal with uncertainties.Conclusively she says that finding “Balance” is unachievable task and if we try toachieve that we will find ourselves frustrated. On the other hand “Imbalance” isnatural state and is not a problem to be solved.
The study by [Haar et al. 2014] investigates about the effect of Work LifeBalance on individual results across various cultures. The sample of 1,416employees was used which was from seven different populations like Malaysian,Chinese, New Zealand, European, Spanish, French and Italian. It was found in theanalysis that the Work Life Balance has positive impact on Job and Life Satisfactionwhereas there was negative impact on anxiety and depression. There was morepositive impact of Work Life Balance on Job and Life Satisfaction on the individualsin Individualistic cultures as compared to the individuals in Collectivistic cultures.High Work Life Balance was associated with more Job and life Satisfaction andnegatively associated with anxiety and depression in the gender egalitarian cultures.
Work by [Tuasig 2001] studies the effect of the alternate schedule of work onthe perceived work life imbalance which they call it as “time bind”. Time Bindoccurs when there is imbalance which is perceived due to lack of the time availableto devote the family demands and the work itself. It has been observed that inorder to strike a balance between work and family life people often work in thealternate schedules i.e night shifts or add working hours, part time etc. With theincreasing number of working women the alternate schedule is preferred by themin order to make the work life balance. Mostly it was not by choice but as requiredby the nature of the job the alternate work schedule was followed. But the effectsof such alternate working schedules are negative on the family and health of theemployee. Working nonstandard hours increased the family-work conflict andreduced the martial satisfaction, martial happiness and family satisfaction as well.Only alternate work schedule was not having positive impact on the family orwork life but it was observed that when the employee had some control on thework schedule they follow then it proved to be positive for the family and worksatisfaction. Thus when the alternate work schedule were voluntarily taken theyhad positive impact and when forced it resulted to be negative on work life balance.
Study by [S. Bhatnagar et al. 2015] have focused on the indian IT sector inPune. Work Life Balance is percievedin various terms like ‘Work Family Stability’,
FACTORS AFFECTING WORK LIFE BALANCE OF IN INDUSTRY... 607
‘Work Family Interface” and “Work Family Balance”. Their aim of study is tofind out whether work life balance is same across male and female. They haveselected responses from 8 different IT organizations working in different domainsin Pune area. Using ANOVA analysis they found that Gender doesn’t play a rolein work life imbalance. strain factors like feeling of physically exhausted,irritation; Time constraints like missing family functions due to workresponsibilities and Role Ambiguity factor like receiving assignments out ofemployee expertise and capability are statistically significant to predict the WLBin IT sector. In several other studies researchers have tried to measure balance ina geographical context [Amanda Reily, 2014] for Irish workforce and [Xiao Y,2012] for China.
Research Objectives and Problem Formulation
Finding balance is a very subjective discussion. As we have seen in previous sectionthat many researchers don’t advocate searching for balance. In fact we should bein search for a more fulfilling life. As any behavioral scientist will say that innerpeace depends on 3 factors1) Personal attitude
A person who is not affected by things not in his control will have a betterpeace. Further a person who values both work and personal needs will have abetter balance.
2) Family Support
If your family understands the value of work you are doing, then they willsupport you in going an extra mile.
3) Organizational Support
Organizations who value the importance of well-being of employee and familylife are successful and most respected. In such organizations people tend tostay longer and contribute. Employees of such organization will say that theyhave a better work life balance.
Research Design Methodology
Research was conducted via the mode of online questionnaire. Questions wereframed in 2 categories.1) Classification Questions
Questions in this category were of type Gender, Education Level, Is Married,Does have children etc.
2) Likert scale psychometric analysis
These questions probed responders to gauze their personality traits, familysupport and organization support.
608 MAN IN INDIA
Sample Size Calculation
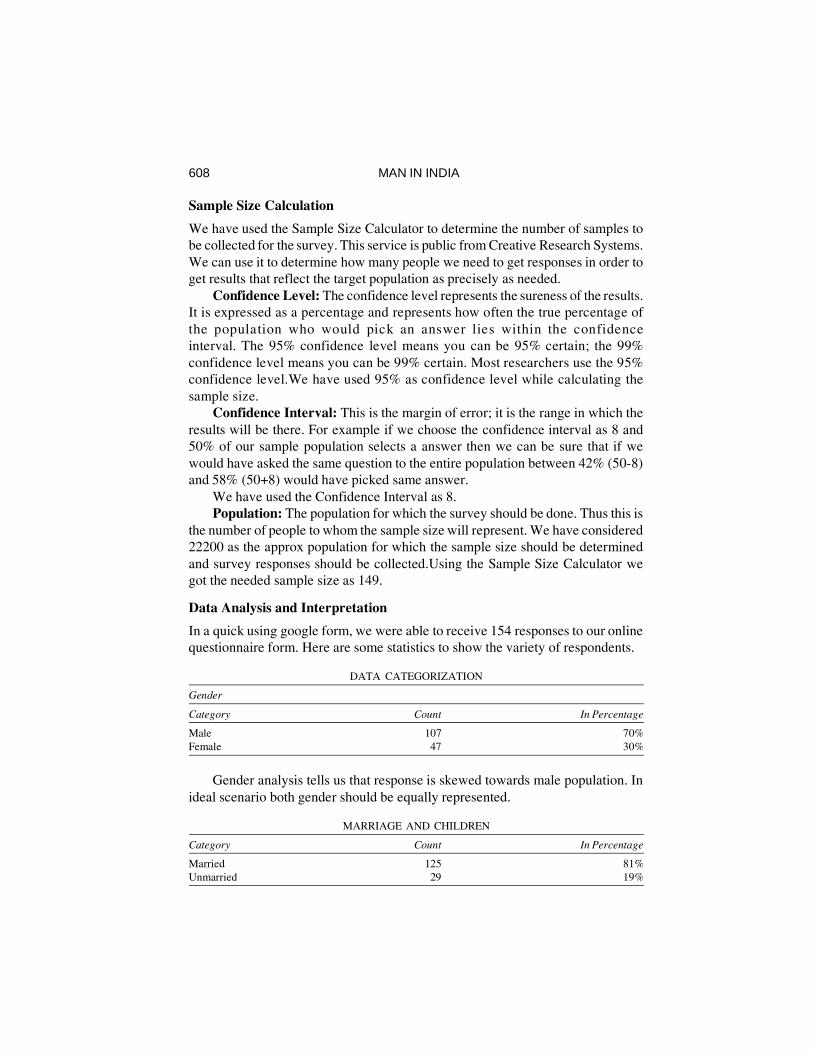
We have used the Sample Size Calculator to determine the number of samples tobe collected for the survey. This service is public from Creative Research Systems.We can use it to determine how many people we need to get responses in order toget results that reflect the target population as precisely as needed.
Confidence Level: The confidence level represents the sureness of the results.It is expressed as a percentage and represents how often the true percentage ofthe population who would pick an answer lies within the confidenceinterval. The 95% confidence level means you can be 95% certain; the 99%confidence level means you can be 99% certain. Most researchers use the 95%confidence level.We have used 95% as confidence level while calculating thesample size.
Confidence Interval: This is the margin of error; it is the range in which theresults will be there. For example if we choose the confidence interval as 8 and50% of our sample population selects a answer then we can be sure that if wewould have asked the same question to the entire population between 42% (50-8)and 58% (50+8) would have picked same answer.
We have used the Confidence Interval as 8.Population: The population for which the survey should be done. Thus this is
the number of people to whom the sample size will represent. We have considered22200 as the approx population for which the sample size should be determinedand survey responses should be collected.Using the Sample Size Calculator wegot the needed sample size as 149.
Data Analysis and Interpretation
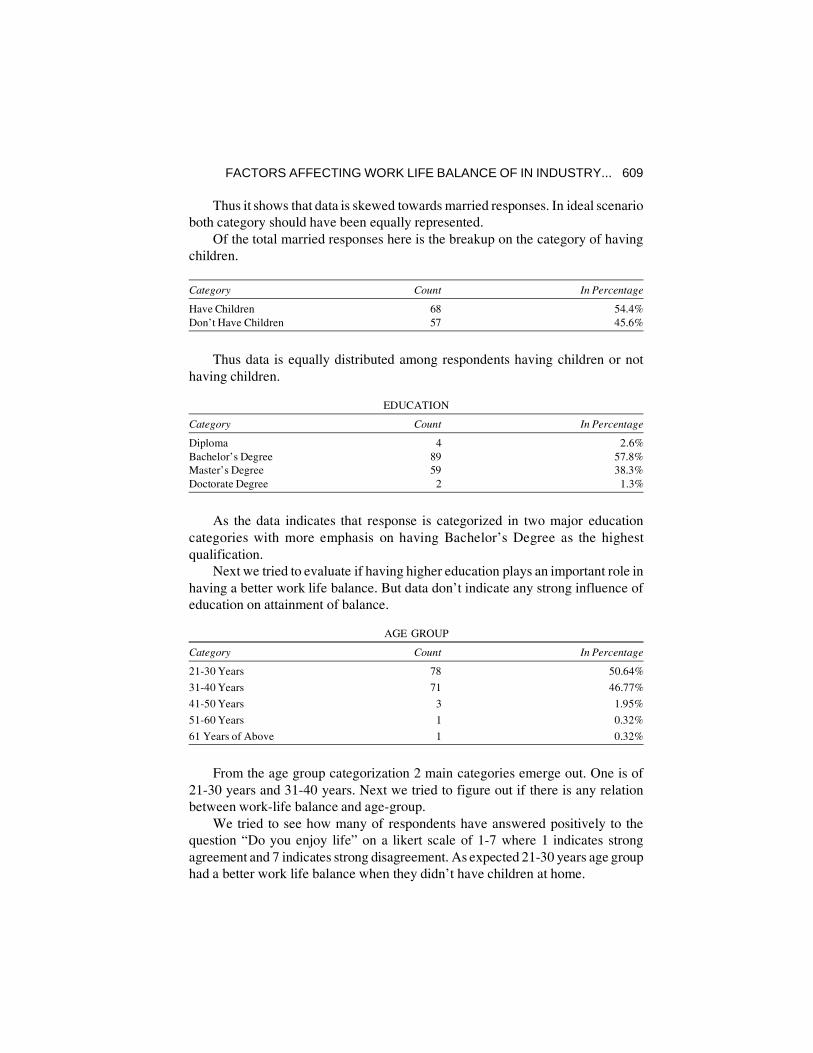
In a quick using google form, we were able to receive 154 responses to our onlinequestionnaire form. Here are some statistics to show the variety of respondents.
DATA CATEGORIZATION
Gender
Category Count In Percentage
Male 107 70%Female 47 30%
Gender analysis tells us that response is skewed towards male population. Inideal scenario both gender should be equally represented.
MARRIAGE AND CHILDREN
Category Count In Percentage
Married 125 81%Unmarried 29 19%
FACTORS AFFECTING WORK LIFE BALANCE OF IN INDUSTRY... 609
Thus it shows that data is skewed towards married responses. In ideal scenarioboth category should have been equally represented.
Of the total married responses here is the breakup on the category of havingchildren.
Category Count In Percentage
Have Children 68 54.4%Don’t Have Children 57 45.6%
Thus data is equally distributed among respondents having children or nothaving children.
EDUCATION
Category Count In Percentage
Diploma 4 2.6%Bachelor’s Degree 89 57.8%Master’s Degree 59 38.3%Doctorate Degree 2 1.3%
As the data indicates that response is categorized in two major educationcategories with more emphasis on having Bachelor’s Degree as the highestqualification.
Next we tried to evaluate if having higher education plays an important role inhaving a better work life balance. But data don’t indicate any strong influence ofeducation on attainment of balance.
AGE GROUP
Category Count In Percentage
21-30 Years 78 50.64%
31-40 Years 71 46.77%
41-50 Years 3 1.95%
51-60 Years 1 0.32%
61 Years of Above 1 0.32%
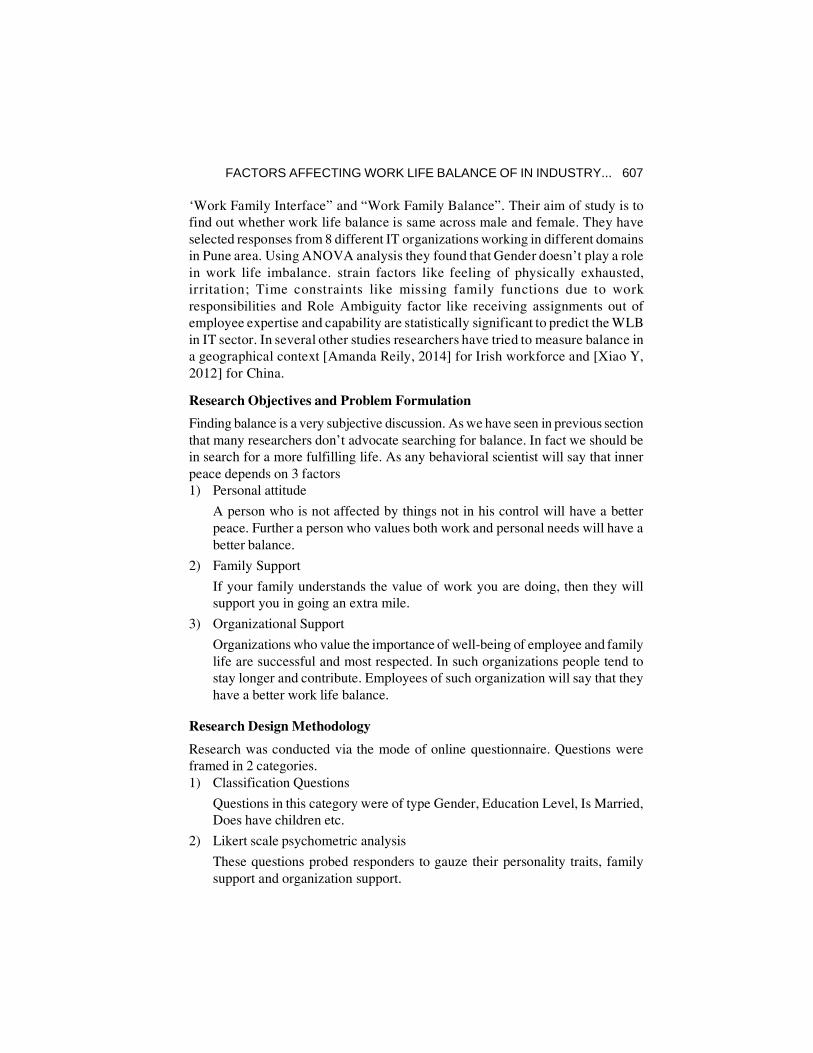
From the age group categorization 2 main categories emerge out. One is of21-30 years and 31-40 years. Next we tried to figure out if there is any relationbetween work-life balance and age-group.
We tried to see how many of respondents have answered positively to thequestion “Do you enjoy life” on a likert scale of 1-7 where 1 indicates strongagreement and 7 indicates strong disagreement. As expected 21-30 years age grouphad a better work life balance when they didn’t have children at home.
610 MAN IN INDIA
As from the data shown above it clearly indicates that people belonging in 21-30 Years of age group definitely have more balance in comparison to 31-40 yearsof age group.
Reliability Analysis
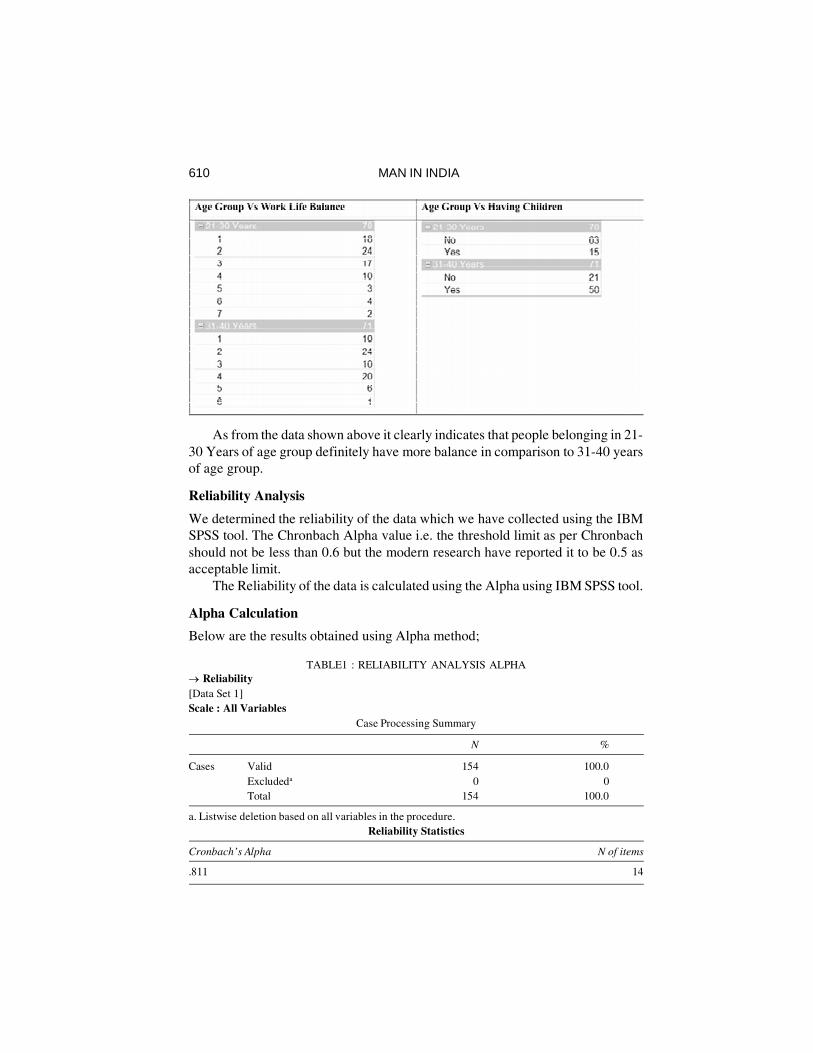
We determined the reliability of the data which we have collected using the IBMSPSS tool. The Chronbach Alpha value i.e. the threshold limit as per Chronbachshould not be less than 0.6 but the modern research have reported it to be 0.5 asacceptable limit.
The Reliability of the data is calculated using the Alpha using IBM SPSS tool.
Alpha Calculation
Below are the results obtained using Alpha method;
TABLE1 : RELIABILITY ANALYSIS ALPHA Reliability
[Data Set 1]Scale : All Variables
Case Processing Summary
N %
Cases Valid 154 100.0Excludeda 0 0Total 154 100.0
a. Listwise deletion based on all variables in the procedure.Reliability Statistics
Cronbach’s Alpha N of items
.811 14
FACTORS AFFECTING WORK LIFE BALANCE OF IN INDUSTRY... 611
Observations
The value of Alpha comes out to be 0.811 which is greater than the Chronbachthreshold limit of 0.6, the data used is reliable.
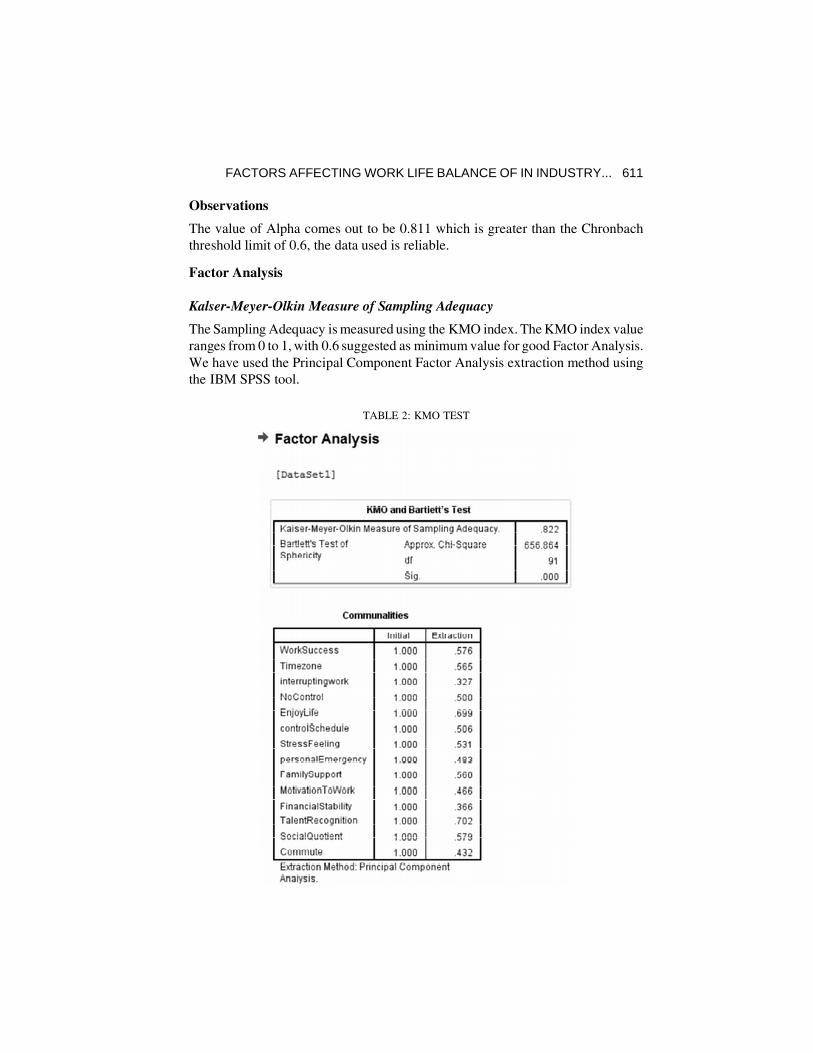
Factor Analysis
Kalser-Meyer-Olkin Measure of Sampling Adequacy
The Sampling Adequacy is measured using the KMO index. The KMO index valueranges from 0 to 1, with 0.6 suggested as minimum value for good Factor Analysis.We have used the Principal Component Factor Analysis extraction method usingthe IBM SPSS tool.
TABLE 2: KMO TEST
612 MAN IN INDIA
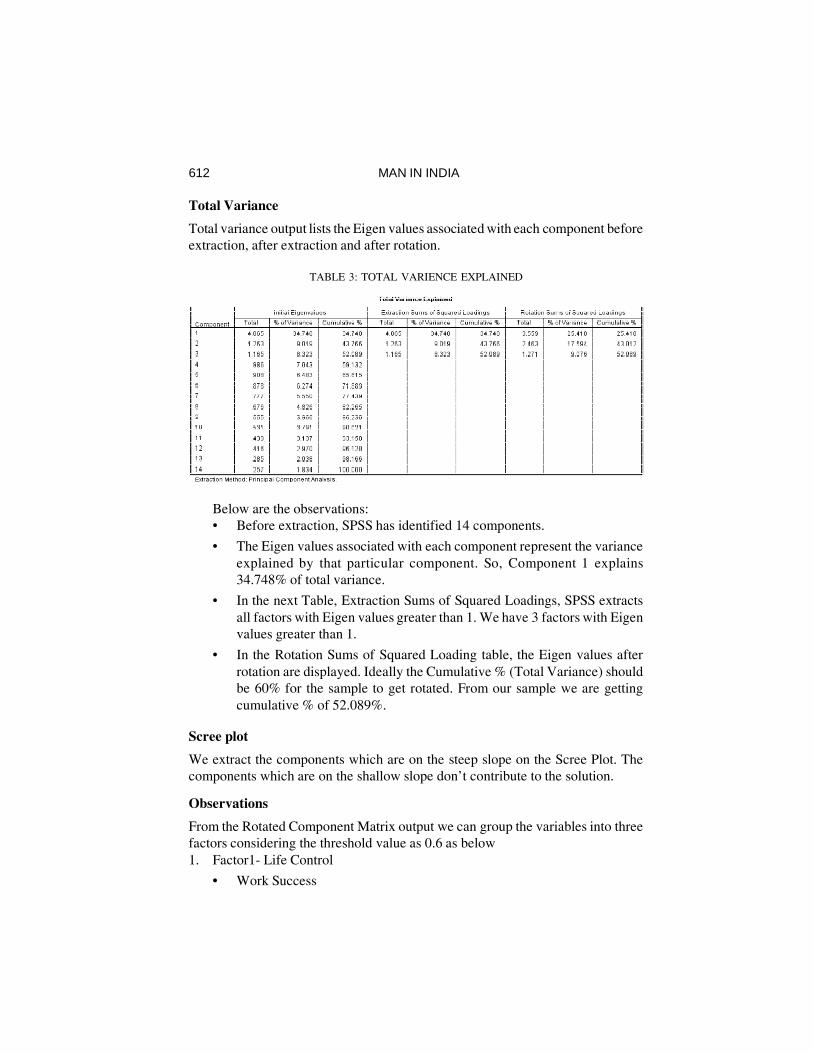
Total Variance
Total variance output lists the Eigen values associated with each component beforeextraction, after extraction and after rotation.
TABLE 3: TOTAL VARIENCE EXPLAINED
Below are the observations:• Before extraction, SPSS has identified 14 components.
• The Eigen values associated with each component represent the varianceexplained by that particular component. So, Component 1 explains34.748% of total variance.
• In the next Table, Extraction Sums of Squared Loadings, SPSS extractsall factors with Eigen values greater than 1. We have 3 factors with Eigenvalues greater than 1.
• In the Rotation Sums of Squared Loading table, the Eigen values afterrotation are displayed. Ideally the Cumulative % (Total Variance) shouldbe 60% for the sample to get rotated. From our sample we are gettingcumulative % of 52.089%.
Scree plot
We extract the components which are on the steep slope on the Scree Plot. Thecomponents which are on the shallow slope don’t contribute to the solution.
Observations
From the Rotated Component Matrix output we can group the variables into threefactors considering the threshold value as 0.6 as below1. Factor1- Life Control
• Work Success
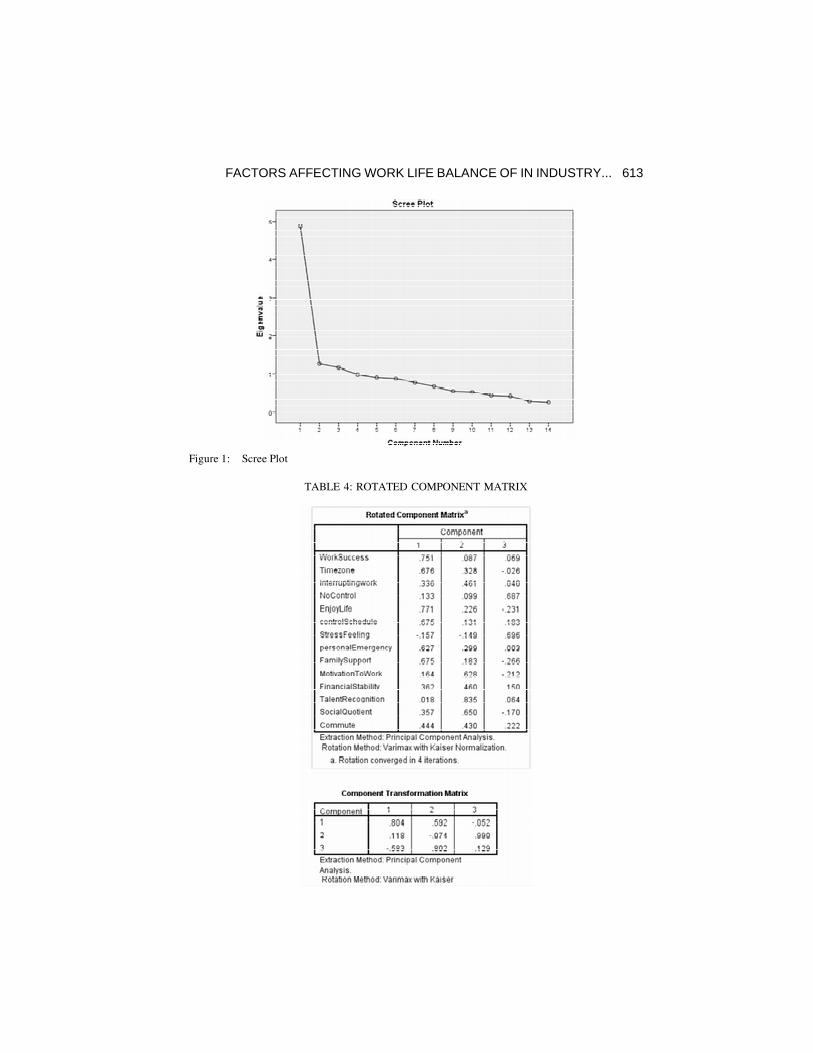
FACTORS AFFECTING WORK LIFE BALANCE OF IN INDUSTRY... 613
TABLE 4: ROTATED COMPONENT MATRIX
Figure 1: Scree Plot

614 MAN IN INDIA
• Time Zone
• Control Schedule
• Personal Emergency
• Family Support
2. Factor2- Life Motivation
• Motivation To Work
• Talent Recognition
• Social Quotient
3. Factor3- Life Stress
• Stress Feeling
• No Control
References
Albertsen, K., Garde, A. H., Nabe-Nielsen, K., Hansen, Å. M., Lund, H., & Hvid, H. (2014).Work-life balance among shift workers: results from an intervention study about self-rostering. International Archives of Occupational and Environmental Health, 87(3), 265-274.
Bhatnagar, S., & Sanadhya, P. (2015). An Analysis of Work-life Balance among the Male andFemale it Professionals in Pune (Maharashtra). Abhinav-International Monthly RefereedJournal of Research In Management & Technology (Online ISSN 2320-0073), 4(1), 50-58.
Caproni, P. (1997). Work/Life Balance.
Chong, M. K., Whittle, J., Rashid, U., Ang, C. S., Whiting, R., Roby, H., ...& Symon, G. (2014).Methods for monitoring work-life balance in a digital world.
Crompton, R., & Lyonette, C. (2006). Work-life ‘balance’in Europe. ActaSociologica, 49(4),379-393.
Guest, D. E. (2002). Perspectives on the study of work-life balance. Social Science Information,41(2), 255-279.
Haar, J. M., Russo, M., Suñe, A., &Ollier-Malaterre, A. (2014). Outcomes of work–life balanceon job satisfaction, life satisfaction and mental health: A study across seven cultures. Journalof Vocational Behavior, 85(3), 361-373.
Rantanen, J., Kinnunen, U., Mauno, S., &Tillemann, K. (2011). Introducing theoretical approachesto work-life balance and testing a new typology among professionals. In Creating Balance?(pp. 27-46). Springer Berlin Heidelberg.
Reilly, A. (2014). The impact of stress, coping and life satisfaction on work-life balance in theIrish workplace.
Smithson, J., &Stokoe, E. H. (2005). Discourses of work–life balance: negotiating‘genderblind’terms in organizations. Gender, Work & Organization, 12(2), 147-168.
Tausig, M., & Fenwick, R. (2001). Unbinding time: Alternate work schedules and work-lifebalance. Journal of Family and Economic Issues, 22(2), 101-119.
FACTORS AFFECTING WORK LIFE BALANCE OF IN INDUSTRY... 615
Thomas, K. J. (2013). Compelled to Be Connected: an Ethnographic Exploration of OrganizationalCulture, Work-life Balance, and the Use of Mobile Workplace Technologies.
White, M., Hill, S., McGovern, P., Mills, C., &Smeaton, D. (2003). ‘High performance’Management Practices, Working Hours and Work–Life Balance. British Journal of IndustrialRelations, 41(2), 175-195.
Williams, P., Long, W., & Morey, P. (2014). Anytime Email and Work-Life Balance: AnExploration into the Views of Adventist Schools Australia Employees. TEACH Journal ofChristian Education, 8(2), 8.
Xiao, Y., & Cooke, F. L. (2012). Work–life balance in China? Social policy, employer strategyand individual coping mechanisms. Asia Pacific Journal of Human Resources, 50(1), 6-22.