Embed Size (px)
Citation preview
RESEARCH Open Access
Factors associated with death in confirmedcases of COVID-19 in the state of Rio deJaneiroMarcella Cini Oliveira1* , Tatiana de Araujo Eleuterio2,3 , Allan Bruno de Andrade Corrêa4,Lucas Dalsenter Romano da Silva5 , Renata Coelho Rodrigues1 , Bruna Andrade de Oliveira1 ,Marlos Melo Martins6 , Carlos Eduardo Raymundo2 and Roberto de Andrade Medronho2
Abstract
Background: COVID-19 can occur asymptomatically, as influenza-like illness, or as more severe forms, whichcharacterize severe acute respiratory syndrome (SARS). Its mortality rate is higher in individuals over 80 years of ageand in people with comorbidities, so these constitute the risk group for severe forms of the disease. We analyzedthe factors associated with death in confirmed cases of COVID-19 in the state of Rio de Janeiro. This cross-sectionalstudy evaluated the association between individual demographic, clinical, and epidemiological variables and theoutcome (death) using data from the Unified Health System information systems.
Methods: We used the extreme boosting gradient (XGBoost) model to analyze the data, which uses decision treesweighted by the estimation difficulty. To evaluate the relevance of each independent variable, we used the SHapleyAdditive exPlanations (SHAP) metric. From the probabilities generated by the XGBoost model, we transformed thedata to the logarithm of odds to estimate the odds ratio for each independent variable.
Results: This study showed that older individuals of black race/skin color with heart disease or diabetes who haddyspnea or fever were more likely to die.
Conclusions: The early identification of patients who may progress to a more severe form of the disease can helpimprove the clinical management of patients with COVID-19 and is thus essential to reduce the lethality of thedisease.
Keywords: COVID-19, SARS-CoV-2, XGBoost, Machine learning, Pandemic, Coronavirus infection, Coronavirus death
BackgroundIn December 2019, cases of pneumonia of unknowncause occurred in Wuhan, Hubei Province, China. OnJanuary 7, 2020, a new beta-coronavirus called severeacute respiratory syndrome coronavirus 2 (SARS-CoV-2)was identified [1–3]. Like severe acute respiratory syn-drome coronavirus and Middle East respiratory
syndrome coronavirus, SARS-CoV-2 causes a lower re-spiratory infection called coronavirus disease 2019(COVID-19). The World Health Organization (WHO)declared the disease a public health emergency of inter-national concern on January 30, 2020. On February 3,2020, Brazil announced the disease as a public healthemergency of national concern [4], and on February 25,2020, the country confirmed its first case [5].On June 14, 2021, the world had 175,686,814 con-
firmed cases and 3,803,592 deaths, and Brazil had 17,452,612 confirmed cases and 488,228 deaths [6].
© The Author(s). 2021, corrected publication 2021. Open Access This article is licensed under a Creative Commons Attribution4.0 International License, which permits use, sharing, adaptation, distribution and reproduction in any medium or format, aslong as you give appropriate credit to the original author(s) and the source, provide a link to the Creative Commons licence,and indicate if changes were made. The images or other third party material in this article are included in the article's CreativeCommons licence, unless indicated otherwise in a credit line to the material. If material is not included in the article's CreativeCommons licence and your intended use is not permitted by statutory regulation or exceeds the permitted use, you will needto obtain permission directly from the copyright holder. To view a copy of this licence, visit http://creativecommons.org/licenses/by/4.0/. The Creative Commons Public Domain Dedication waiver (http://creativecommons.org/publicdomain/zero/1.0/) applies to the data made available in this article, unless otherwise stated in a credit line to the data.
* Correspondence: [email protected] de Medicina, Universidade Federal do Rio de Janeiro, Rio deJaneiro, BrasilFull list of author information is available at the end of the article
Cini Oliveira et al. BMC Infectious Diseases (2021) 21:687 https://doi.org/10.1186/s12879-021-06384-1
COVID-19 can occur asymptomatically, as influenza-likeillness, or as more severe forms, which characterize se-vere acute respiratory syndrome (SARS). The most com-mon clinical manifestations include fever, dry cough,diarrhea, vomiting, and muscle pain or fatigue [7, 8].The average incubation period is 5.2 days [9]. Transmis-sion can occur by droplets and aerosols or by contactwith contaminated objects [10].Its mortality rate is higher in individuals over 80 years
of age and in people with comorbidities, so these consti-tute the risk group for severe forms of the disease [11].The gold standard for laboratory confirmation of SARS-CoV-2 infection is reverse transcription-polymerasechain reaction (RT-PCR). The performance of mass RT-PCR testing, contact tracing, and isolation of positive in-dividuals is essential to control the spread of the virus[12–15].This study aims to analyze the factors associated with
death in confirmed cases of COVID-19 in the state ofRio de Janeiro and considers the importance of definingthese factors, the objective of several studies in the lit-erature, for better case management [16–21].
MethodsDesignThe design was a cross-sectional study evaluating the as-sociation between individual demographic, clinical, andepidemiological predictor variables and the outcome(death) among confirmed cases of COVID-19 in thestate of Rio de Janeiro using data gathered from the Uni-fied Health System (SUS) information systems.
Data collectionWe gathered the confirmed influenza-like illness casescaused by COVID-19 from the e-SUS NOTIFICA sys-tem of the Ministry of Health. We obtained the con-firmed SARS cases by COVID-19 from the FluEpidemiological Surveillance Information System(SIVEP-Gripe) of the Ministry of Health. We linkedthese two databases. The consistency analysis removedany duplicates from the resulting database. Next, welinked this database with the Mortality Information Sys-tem database of the Ministry of Health. The study cov-ered the period from March 5 (the first confirmed casein the state of Rio de Janeiro) to September 15, 2020.During this period, the state of Rio de Janeiro confirmed243,509 cases of COVID-19, of which 178,231 (73.2%)were of influenza-like illness (ILI) and 65,278 (26.8%)were of SARS. All cases included in this study met theILI and SARS criteria defined by the Ministry of Health[22].The individual predictor variables selected covered
demographic, clinical, and epidemiological characteris-tics (Table 1).
The immunodeficiency/immunosuppression, consid-ered as a risk factor/ comorbidity both in the notificationand investigation of ILI and SARS cases, is defined asany cause of suppression or deficiency of the immunesystem associated with medications (corticosteroids,chemotherapy, TNF-alpha inhibitors) or pathologies(neoplasms, HIV/AIDS, among others).
Data analysisWe used Microsoft Excel 365 software to handle thedatabase, while we performed the statistical analyseswith the software R × 64 4.0.0 through RStudio Desktopand Python 3.8.5.In the descriptive analysis of the data, we categorized
the quantitative predictor variable age according to agegroups (in years): 0 to 9, 10 to 19, 20 to 29, 30 to 39, 40to 49, 50 to 59, 60 to 69, 70 to 79, and 80 years or older.For the modeling, we did not categorize patient age.The bivariate descriptive analysis used bar graphs, pie
charts, or box plots for the numerical predictor variable(age) and contingency tables for categorical predictorvariables. We used Pearson’s chi-squared test to analyzecategorical predictor variables and the Wilcoxon test forthe numerical predictor variables, both with a level ofsignificance of 5%.We checked the database for missing data. We kept
variables considered epidemiologically relevant but witha high percentage of missing data in the analysis,
Table 1 Individual variables selected
Demographic Age
Sex
Race/skin color, self-reported
Municipality of residence
Clinical Fever
Cough
Sneezing
Runny nose
Sore throat
Dyspnea
Loss of smell
Loss of taste
Headache
Muscle pain
Diarrhea
Epidemiological Chronic respiratory disease
Chronic kidney disease
Diabetes
Immunodeficiency/immunosuppression
Heart disease
Cini Oliveira et al. BMC Infectious Diseases (2021) 21:687 Page 2 of 16
creating a category named “missing” for each predictorvariable. They were “kidney diseases”, “immunodefi-ciency/immunosuppression”, “diabetes”, “heart disease”,“dyspnea”, “cough”, “fever”, “headache”, “sneezing”, “ody-nophagia”, “muscle pain”, “diarrhea”, “loss of smell”,“loss of taste”, and “runny nose”.Due to a large number of categories of the predictor
variable “municipality of residence” (91 municipalities),we grouped the residences into regions defined by thestate government of Rio de Janeiro [23]. The exceptionwas the city of Rio de Janeiro, which has more than one-third of the state’s population and more than half of thedeaths, so we analyzed it as an individual category, called“Metropolitan Region I - capital”.Then, through the evaluation with several machine
learning algorithms, we applied an Extreme BoostingGradient (XGBoost), as it showed the best perform-ance for the dataset. To meet the assumption of bal-anced data for a good performance of machinelearning models, we balanced the predicted variable(outcome) using the synthetic minority oversamplingtechnique (SMOTE) [24] and edited nearest neighbor(ENN) [25] techniques. The XGBoost model uses de-cision trees weighted by the estimation difficulty [26].Compared to machine learning models in general, theadvantages of this model are the better generalizationof the results, the possibility of visualizing all decisiontrees, and the reduction of the bias and variance of asingle tree.To evaluate the relevance of each predictor variable,
we used the SHapley Additive exPlanations (SHAP)metric [27], which can take negative or positive values,and the closer it is to 0, the less the predictor variableinfluences the predicted variable. The results show themean of the modules of the importance of each pre-dictor variable.
Also, we used sensitivity, specificity, accuracy, positivepredictive value, negative predictive value, Youden’sindex, receiver operating characteristic (ROC) curves,and Matthews’ correlation coefficient (MCC) to evaluatethe goodness of fit [28].From the probabilities generated by the XGBoost
model, we transformed the data to the logarithm ofodds, where odds is the ratio between the probability ofdeath and non-death attributed to the categories of eachpredictor variable for each individual. We used the loga-rithm of odds to estimate the odds ratio, according tothe formula below:
Odds ratioi ORið Þ ¼ emean log oddsintð Þð Þ
emean log oddsrefð Þð Þ
Where:
int ¼ Category of interest of the predictor variable
ref ¼ Category of reference of the predictor variable
For the numerical variable age, we used the categoriesof interest described earlier in this section to obtain thesummarized results.We calculated the confidence interval according to
Wayne W. LaMorte [29] and estimated the total numberof individuals by category and outcome using the follow-ing formula:
95%confidence interval ¼ e log ORið Þ� 1;96�SE log ORið Þð Þ½ �ð Þ
Where:
SE log ORið Þð Þ ¼ffiffiffiffiffiffiffiffiffiffiffiffiffiffiffiffiffiffiffiffiffiffiffiffiffiffiffiffiffiffiffiffiffiffiffiffiffiffiffiffiffiffiffiffiffiffiffiffiffiffiffiffiffiffiffiffiffiffiffiffiffiffiffiffiffiffiffiffiffiffiffiffiffiffiffiffiffiffiffiffiffiffiffiffiffiffiffiffiffiffiffiffiffiffiffiffiffiffiffiffiffiffiffiffiffiffiffiffiffiffiffiffiffi
1pint � nint
þ 11−pintð Þ � nint
þ 1pref � nref
þ 11−prefð Þ � nref
s
p ¼ estimated probability of death for the category
Table 2 Distribution of incidence, mortality, and lethality by age group
Age groupa Deaths Cases Populationb Incidencec Mortalityc Lethality
0 to 9 years 60 5105 2,224,713 229.47 2.70 1.18
10 to 19 years 34 7478 2,193,282 340.95 1.55 0.45
20 to 29 years 210 30,426 2,638,726 1153.06 7.96 0.69
30 to 39 years 603 53,654 2,692,631 1992.62 22.39 1.12
40 to 49 years 1400 51,913 2,476,855 2095.92 56.52 2.70
50 to 59 years 2526 40,729 2,146,886 1897.12 117.66 6.20
60 to 69 years 4154 27,034 1,645,437 1642.97 252.46 15.37
70 to 79 years 4425 15,273 888,202 1719.54 498.20 28.97
80 years and older 4622 10,812 459,457 2353.21 1005.97 42.75
Total 18,034 242,424 17,366,189 1395.95 103.85 7.44
Note: confirmed cases of COVID-19, state of Rio de Janeiro, March–September 2020a Cases with available age informationb Population estimated by the IBGE for 2020c per 100,000 inhabitants
Cini Oliveira et al. BMC Infectious Diseases (2021) 21:687 Page 3 of 16
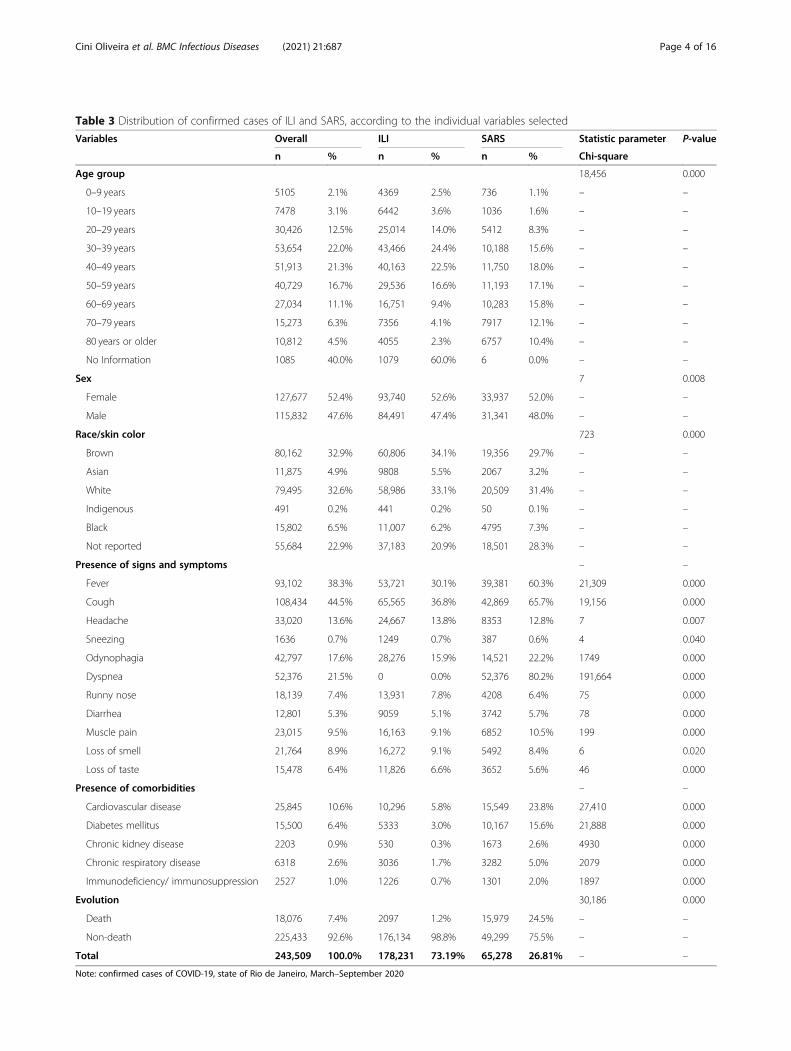
Table 3 Distribution of confirmed cases of ILI and SARS, according to the individual variables selected
Variables Overall ILI SARS Statistic parameter P-value
n % n % n % Chi-square
Age group 18,456 0.000
0–9 years 5105 2.1% 4369 2.5% 736 1.1% – –
10–19 years 7478 3.1% 6442 3.6% 1036 1.6% – –
20–29 years 30,426 12.5% 25,014 14.0% 5412 8.3% – –
30–39 years 53,654 22.0% 43,466 24.4% 10,188 15.6% – –
40–49 years 51,913 21.3% 40,163 22.5% 11,750 18.0% – –
50–59 years 40,729 16.7% 29,536 16.6% 11,193 17.1% – –
60–69 years 27,034 11.1% 16,751 9.4% 10,283 15.8% – –
70–79 years 15,273 6.3% 7356 4.1% 7917 12.1% – –
80 years or older 10,812 4.5% 4055 2.3% 6757 10.4% – –
No Information 1085 40.0% 1079 60.0% 6 0.0% – –
Sex 7 0.008
Female 127,677 52.4% 93,740 52.6% 33,937 52.0% – –
Male 115,832 47.6% 84,491 47.4% 31,341 48.0% – –
Race/skin color 723 0.000
Brown 80,162 32.9% 60,806 34.1% 19,356 29.7% – –
Asian 11,875 4.9% 9808 5.5% 2067 3.2% – –
White 79,495 32.6% 58,986 33.1% 20,509 31.4% – –
Indigenous 491 0.2% 441 0.2% 50 0.1% – –
Black 15,802 6.5% 11,007 6.2% 4795 7.3% – –
Not reported 55,684 22.9% 37,183 20.9% 18,501 28.3% – –
Presence of signs and symptoms – –
Fever 93,102 38.3% 53,721 30.1% 39,381 60.3% 21,309 0.000
Cough 108,434 44.5% 65,565 36.8% 42,869 65.7% 19,156 0.000
Headache 33,020 13.6% 24,667 13.8% 8353 12.8% 7 0.007
Sneezing 1636 0.7% 1249 0.7% 387 0.6% 4 0.040
Odynophagia 42,797 17.6% 28,276 15.9% 14,521 22.2% 1749 0.000
Dyspnea 52,376 21.5% 0 0.0% 52,376 80.2% 191,664 0.000
Runny nose 18,139 7.4% 13,931 7.8% 4208 6.4% 75 0.000
Diarrhea 12,801 5.3% 9059 5.1% 3742 5.7% 78 0.000
Muscle pain 23,015 9.5% 16,163 9.1% 6852 10.5% 199 0.000
Loss of smell 21,764 8.9% 16,272 9.1% 5492 8.4% 6 0.020
Loss of taste 15,478 6.4% 11,826 6.6% 3652 5.6% 46 0.000
Presence of comorbidities – –
Cardiovascular disease 25,845 10.6% 10,296 5.8% 15,549 23.8% 27,410 0.000
Diabetes mellitus 15,500 6.4% 5333 3.0% 10,167 15.6% 21,888 0.000
Chronic kidney disease 2203 0.9% 530 0.3% 1673 2.6% 4930 0.000
Chronic respiratory disease 6318 2.6% 3036 1.7% 3282 5.0% 2079 0.000
Immunodeficiency/ immunosuppression 2527 1.0% 1226 0.7% 1301 2.0% 1897 0.000
Evolution 30,186 0.000
Death 18,076 7.4% 2097 1.2% 15,979 24.5% – –
Non-death 225,433 92.6% 176,134 98.8% 49,299 75.5% – –
Total 243,509 100.0% 178,231 73.19% 65,278 26.81% – –
Note: confirmed cases of COVID-19, state of Rio de Janeiro, March–September 2020
Cini Oliveira et al. BMC Infectious Diseases (2021) 21:687 Page 4 of 16
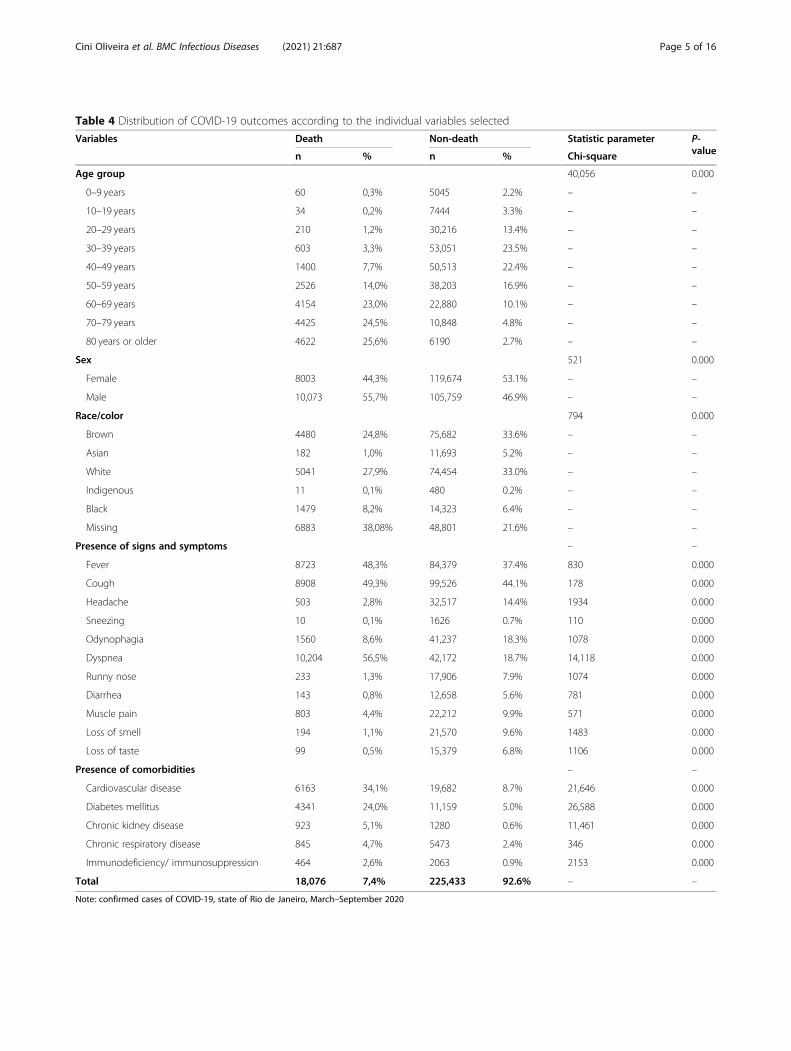
Table 4 Distribution of COVID-19 outcomes according to the individual variables selected
Variables Death Non-death Statistic parameter P-valuen % n % Chi-square
Age group 40,056 0.000
0–9 years 60 0,3% 5045 2.2% – –
10–19 years 34 0,2% 7444 3.3% – –
20–29 years 210 1,2% 30,216 13.4% – –
30–39 years 603 3,3% 53,051 23.5% – –
40–49 years 1400 7,7% 50,513 22.4% – –
50–59 years 2526 14,0% 38,203 16.9% – –
60–69 years 4154 23,0% 22,880 10.1% – –
70–79 years 4425 24,5% 10,848 4.8% – –
80 years or older 4622 25,6% 6190 2.7% – –
Sex 521 0.000
Female 8003 44,3% 119,674 53.1% – –
Male 10,073 55,7% 105,759 46.9% – –
Race/color 794 0.000
Brown 4480 24,8% 75,682 33.6% – –
Asian 182 1,0% 11,693 5.2% – –
White 5041 27,9% 74,454 33.0% – –
Indigenous 11 0,1% 480 0.2% – –
Black 1479 8,2% 14,323 6.4% – –
Missing 6883 38,08% 48,801 21.6% – –
Presence of signs and symptoms – –
Fever 8723 48,3% 84,379 37.4% 830 0.000
Cough 8908 49,3% 99,526 44.1% 178 0.000
Headache 503 2,8% 32,517 14.4% 1934 0.000
Sneezing 10 0,1% 1626 0.7% 110 0.000
Odynophagia 1560 8,6% 41,237 18.3% 1078 0.000
Dyspnea 10,204 56,5% 42,172 18.7% 14,118 0.000
Runny nose 233 1,3% 17,906 7.9% 1074 0.000
Diarrhea 143 0,8% 12,658 5.6% 781 0.000
Muscle pain 803 4,4% 22,212 9.9% 571 0.000
Loss of smell 194 1,1% 21,570 9.6% 1483 0.000
Loss of taste 99 0,5% 15,379 6.8% 1106 0.000
Presence of comorbidities – –
Cardiovascular disease 6163 34,1% 19,682 8.7% 21,646 0.000
Diabetes mellitus 4341 24,0% 11,159 5.0% 26,588 0.000
Chronic kidney disease 923 5,1% 1280 0.6% 11,461 0.000
Chronic respiratory disease 845 4,7% 5473 2.4% 346 0.000
Immunodeficiency/ immunosuppression 464 2,6% 2063 0.9% 2153 0.000
Total 18,076 7,4% 225,433 92.6% – –
Note: confirmed cases of COVID-19, state of Rio de Janeiro, March–September 2020
Cini Oliveira et al. BMC Infectious Diseases (2021) 21:687 Page 5 of 16
n ¼ number of individuals in the category
The authors used the odds ratio confidence interval tocalculate its p-value, according to the formula present inAltman [30] for proportions. The significance level con-sidered was 5%.
ResultsBetween March 10 and September 15, 2020, the state of Riode Janeiro reported 243,509 confirmed cases of COVID-19,of which 37.3% were residents of the municipality of Rio deJaneiro. Of the total number of cases, 178,231 (73.2%) wereclassified as ILI, and 65,278 (26.8%) were classified as SARS.
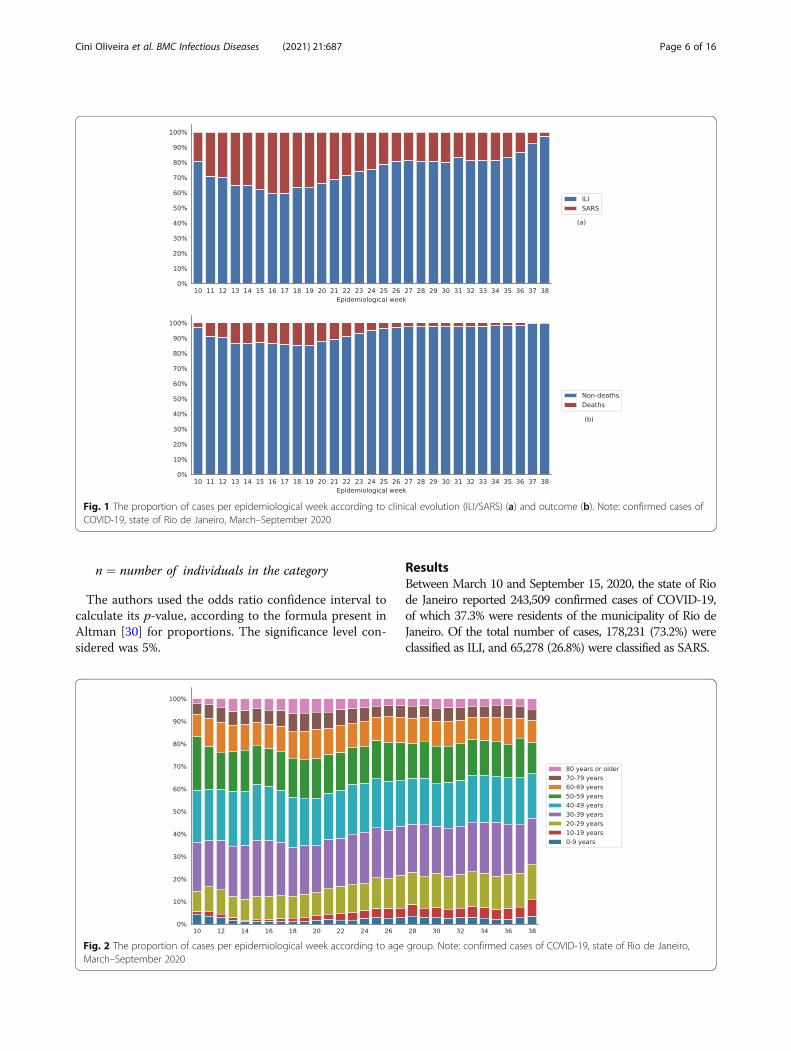
Fig. 1 The proportion of cases per epidemiological week according to clinical evolution (ILI/SARS) (a) and outcome (b). Note: confirmed cases ofCOVID-19, state of Rio de Janeiro, March–September 2020
Fig. 2 The proportion of cases per epidemiological week according to age group. Note: confirmed cases of COVID-19, state of Rio de Janeiro,March–September 2020
Cini Oliveira et al. BMC Infectious Diseases (2021) 21:687 Page 6 of 16
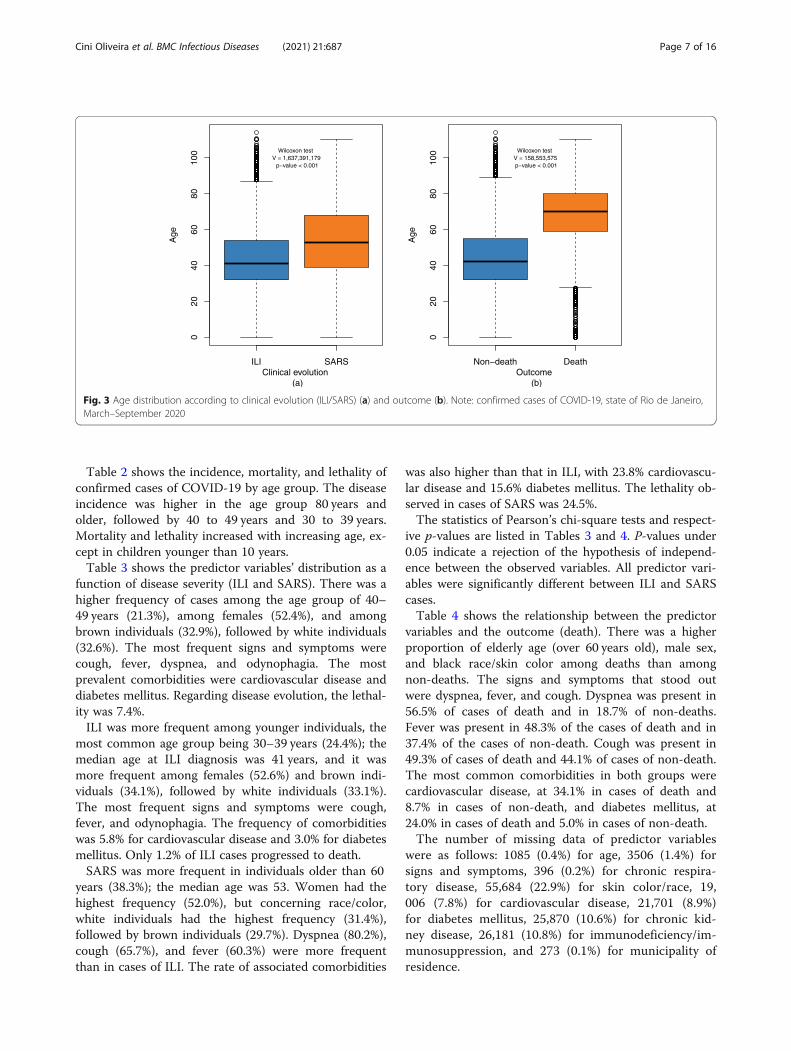
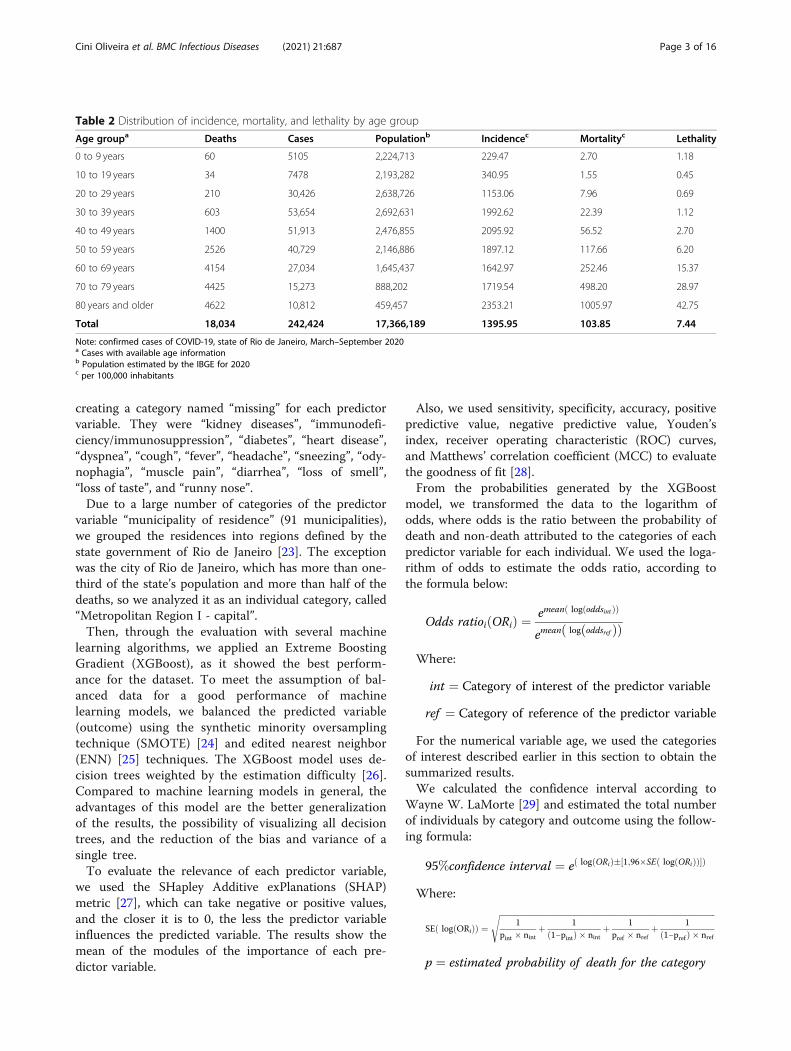
Table 2 shows the incidence, mortality, and lethality ofconfirmed cases of COVID-19 by age group. The diseaseincidence was higher in the age group 80 years andolder, followed by 40 to 49 years and 30 to 39 years.Mortality and lethality increased with increasing age, ex-cept in children younger than 10 years.Table 3 shows the predictor variables’ distribution as a
function of disease severity (ILI and SARS). There was ahigher frequency of cases among the age group of 40–49 years (21.3%), among females (52.4%), and amongbrown individuals (32.9%), followed by white individuals(32.6%). The most frequent signs and symptoms werecough, fever, dyspnea, and odynophagia. The mostprevalent comorbidities were cardiovascular disease anddiabetes mellitus. Regarding disease evolution, the lethal-ity was 7.4%.ILI was more frequent among younger individuals, the
most common age group being 30–39 years (24.4%); themedian age at ILI diagnosis was 41 years, and it wasmore frequent among females (52.6%) and brown indi-viduals (34.1%), followed by white individuals (33.1%).The most frequent signs and symptoms were cough,fever, and odynophagia. The frequency of comorbiditieswas 5.8% for cardiovascular disease and 3.0% for diabetesmellitus. Only 1.2% of ILI cases progressed to death.SARS was more frequent in individuals older than 60
years (38.3%); the median age was 53. Women had thehighest frequency (52.0%), but concerning race/color,white individuals had the highest frequency (31.4%),followed by brown individuals (29.7%). Dyspnea (80.2%),cough (65.7%), and fever (60.3%) were more frequentthan in cases of ILI. The rate of associated comorbidities
was also higher than that in ILI, with 23.8% cardiovascu-lar disease and 15.6% diabetes mellitus. The lethality ob-served in cases of SARS was 24.5%.The statistics of Pearson’s chi-square tests and respect-
ive p-values are listed in Tables 3 and 4. P-values under0.05 indicate a rejection of the hypothesis of independ-ence between the observed variables. All predictor vari-ables were significantly different between ILI and SARScases.Table 4 shows the relationship between the predictor
variables and the outcome (death). There was a higherproportion of elderly age (over 60 years old), male sex,and black race/skin color among deaths than amongnon-deaths. The signs and symptoms that stood outwere dyspnea, fever, and cough. Dyspnea was present in56.5% of cases of death and in 18.7% of non-deaths.Fever was present in 48.3% of the cases of death and in37.4% of the cases of non-death. Cough was present in49.3% of cases of death and 44.1% of cases of non-death.The most common comorbidities in both groups werecardiovascular disease, at 34.1% in cases of death and8.7% in cases of non-death, and diabetes mellitus, at24.0% in cases of death and 5.0% in cases of non-death.The number of missing data of predictor variables
were as follows: 1085 (0.4%) for age, 3506 (1.4%) forsigns and symptoms, 396 (0.2%) for chronic respira-tory disease, 55,684 (22.9%) for skin color/race, 19,006 (7.8%) for cardiovascular disease, 21,701 (8.9%)for diabetes mellitus, 25,870 (10.6%) for chronic kid-ney disease, 26,181 (10.8%) for immunodeficiency/im-munosuppression, and 273 (0.1%) for municipality ofresidence.
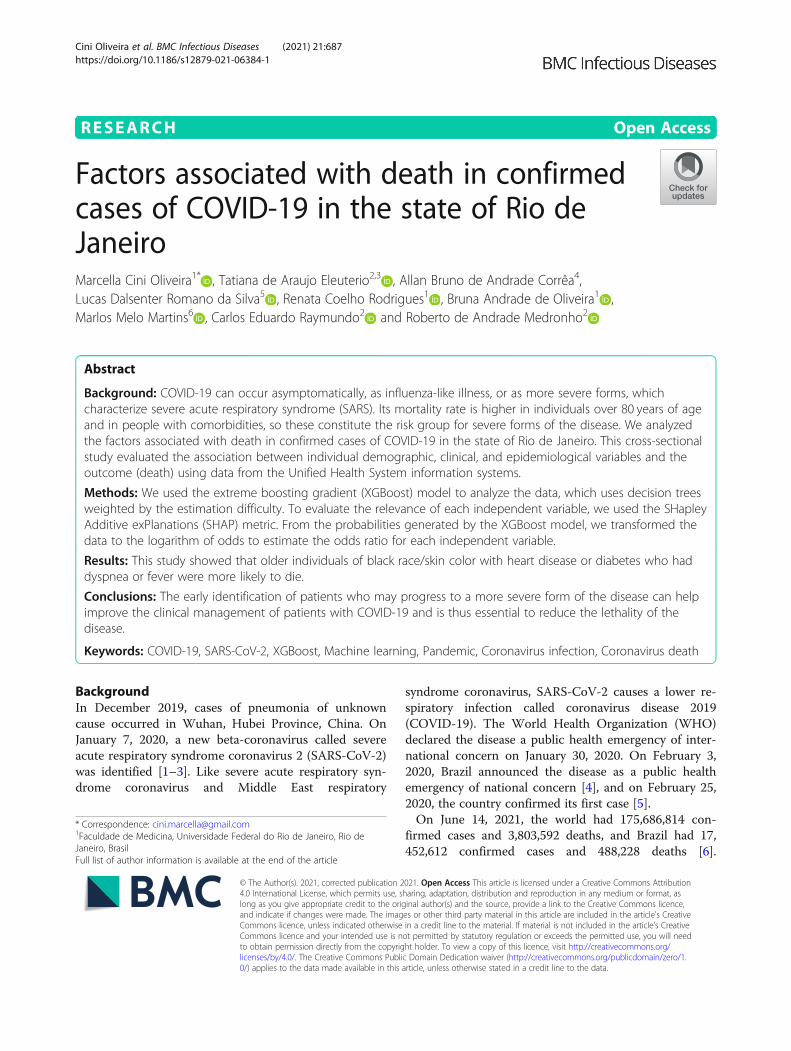
Fig. 3 Age distribution according to clinical evolution (ILI/SARS) (a) and outcome (b). Note: confirmed cases of COVID-19, state of Rio de Janeiro,March–September 2020
Cini Oliveira et al. BMC Infectious Diseases (2021) 21:687 Page 7 of 16
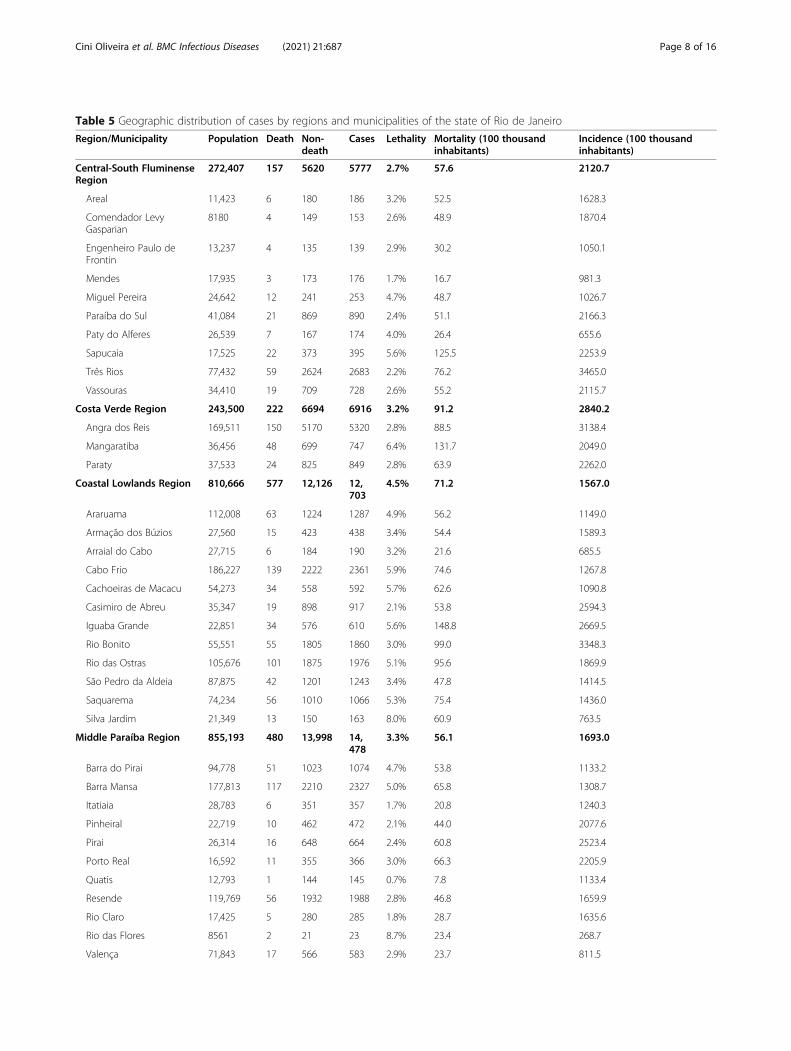
Table 5 Geographic distribution of cases by regions and municipalities of the state of Rio de Janeiro
Region/Municipality Population Death Non-death
Cases Lethality Mortality (100 thousandinhabitants)
Incidence (100 thousandinhabitants)
Central-South FluminenseRegion
272,407 157 5620 5777 2.7% 57.6 2120.7
Areal 11,423 6 180 186 3.2% 52.5 1628.3
Comendador LevyGasparian
8180 4 149 153 2.6% 48.9 1870.4
Engenheiro Paulo deFrontin
13,237 4 135 139 2.9% 30.2 1050.1
Mendes 17,935 3 173 176 1.7% 16.7 981.3
Miguel Pereira 24,642 12 241 253 4.7% 48.7 1026.7
Paraíba do Sul 41,084 21 869 890 2.4% 51.1 2166.3
Paty do Alferes 26,539 7 167 174 4.0% 26.4 655.6
Sapucaia 17,525 22 373 395 5.6% 125.5 2253.9
Três Rios 77,432 59 2624 2683 2.2% 76.2 3465.0
Vassouras 34,410 19 709 728 2.6% 55.2 2115.7
Costa Verde Region 243,500 222 6694 6916 3.2% 91.2 2840.2
Angra dos Reis 169,511 150 5170 5320 2.8% 88.5 3138.4
Mangaratiba 36,456 48 699 747 6.4% 131.7 2049.0
Paraty 37,533 24 825 849 2.8% 63.9 2262.0
Coastal Lowlands Region 810,666 577 12,126 12,703
4.5% 71.2 1567.0
Araruama 112,008 63 1224 1287 4.9% 56.2 1149.0
Armação dos Búzios 27,560 15 423 438 3.4% 54.4 1589.3
Arraial do Cabo 27,715 6 184 190 3.2% 21.6 685.5
Cabo Frio 186,227 139 2222 2361 5.9% 74.6 1267.8
Cachoeiras de Macacu 54,273 34 558 592 5.7% 62.6 1090.8
Casimiro de Abreu 35,347 19 898 917 2.1% 53.8 2594.3
Iguaba Grande 22,851 34 576 610 5.6% 148.8 2669.5
Rio Bonito 55,551 55 1805 1860 3.0% 99.0 3348.3
Rio das Ostras 105,676 101 1875 1976 5.1% 95.6 1869.9
São Pedro da Aldeia 87,875 42 1201 1243 3.4% 47.8 1414.5
Saquarema 74,234 56 1010 1066 5.3% 75.4 1436.0
Silva Jardim 21,349 13 150 163 8.0% 60.9 763.5
Middle Paraíba Region 855,193 480 13,998 14,478
3.3% 56.1 1693.0
Barra do Pirai 94,778 51 1023 1074 4.7% 53.8 1133.2
Barra Mansa 177,813 117 2210 2327 5.0% 65.8 1308.7
Itatiaia 28,783 6 351 357 1.7% 20.8 1240.3
Pinheiral 22,719 10 462 472 2.1% 44.0 2077.6
Pirai 26,314 16 648 664 2.4% 60.8 2523.4
Porto Real 16,592 11 355 366 3.0% 66.3 2205.9
Quatis 12,793 1 144 145 0.7% 7.8 1133.4
Resende 119,769 56 1932 1988 2.8% 46.8 1659.9
Rio Claro 17,425 5 280 285 1.8% 28.7 1635.6
Rio das Flores 8561 2 21 23 8.7% 23.4 268.7
Valença 71,843 17 566 583 2.9% 23.7 811.5
Cini Oliveira et al. BMC Infectious Diseases (2021) 21:687 Page 8 of 16
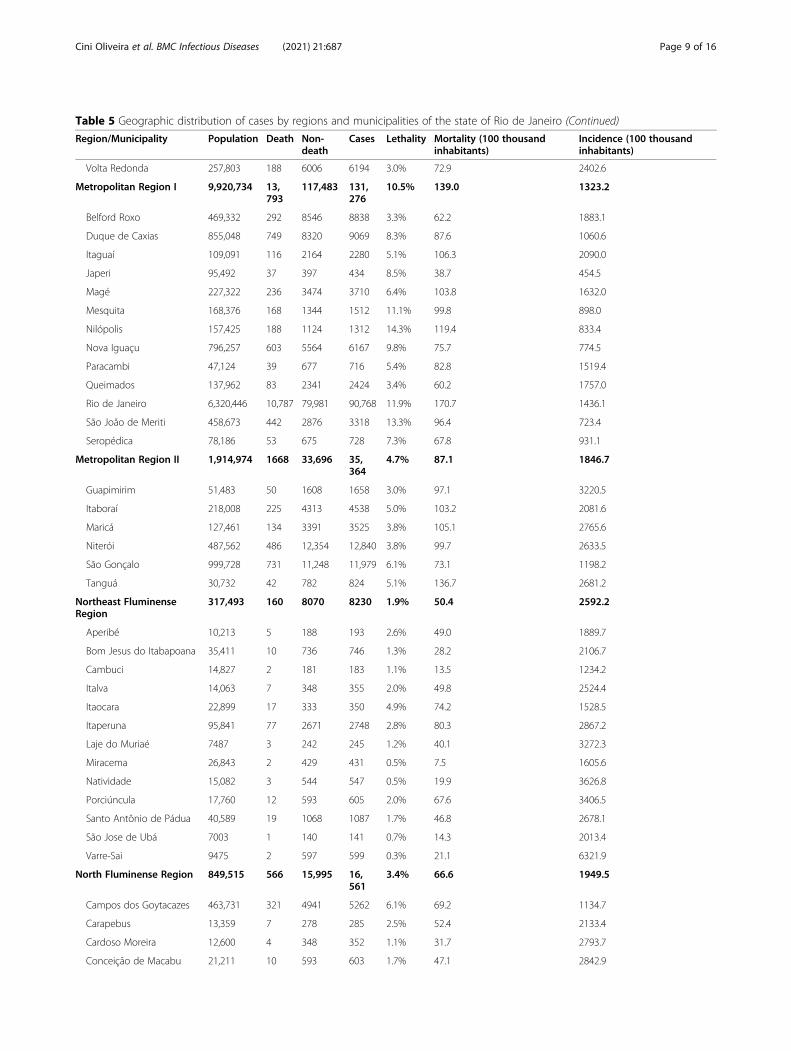
Table 5 Geographic distribution of cases by regions and municipalities of the state of Rio de Janeiro (Continued)
Region/Municipality Population Death Non-death
Cases Lethality Mortality (100 thousandinhabitants)
Incidence (100 thousandinhabitants)
Volta Redonda 257,803 188 6006 6194 3.0% 72.9 2402.6
Metropolitan Region I 9,920,734 13,793
117,483 131,276
10.5% 139.0 1323.2
Belford Roxo 469,332 292 8546 8838 3.3% 62.2 1883.1
Duque de Caxias 855,048 749 8320 9069 8.3% 87.6 1060.6
Itaguaí 109,091 116 2164 2280 5.1% 106.3 2090.0
Japeri 95,492 37 397 434 8.5% 38.7 454.5
Magé 227,322 236 3474 3710 6.4% 103.8 1632.0
Mesquita 168,376 168 1344 1512 11.1% 99.8 898.0
Nilópolis 157,425 188 1124 1312 14.3% 119.4 833.4
Nova Iguaçu 796,257 603 5564 6167 9.8% 75.7 774.5
Paracambi 47,124 39 677 716 5.4% 82.8 1519.4
Queimados 137,962 83 2341 2424 3.4% 60.2 1757.0
Rio de Janeiro 6,320,446 10,787 79,981 90,768 11.9% 170.7 1436.1
São João de Meriti 458,673 442 2876 3318 13.3% 96.4 723.4
Seropédica 78,186 53 675 728 7.3% 67.8 931.1
Metropolitan Region II 1,914,974 1668 33,696 35,364
4.7% 87.1 1846.7
Guapimirim 51,483 50 1608 1658 3.0% 97.1 3220.5
Itaboraí 218,008 225 4313 4538 5.0% 103.2 2081.6
Maricá 127,461 134 3391 3525 3.8% 105.1 2765.6
Niterói 487,562 486 12,354 12,840 3.8% 99.7 2633.5
São Gonçalo 999,728 731 11,248 11,979 6.1% 73.1 1198.2
Tanguá 30,732 42 782 824 5.1% 136.7 2681.2
Northeast FluminenseRegion
317,493 160 8070 8230 1.9% 50.4 2592.2
Aperibé 10,213 5 188 193 2.6% 49.0 1889.7
Bom Jesus do Itabapoana 35,411 10 736 746 1.3% 28.2 2106.7
Cambuci 14,827 2 181 183 1.1% 13.5 1234.2
Italva 14,063 7 348 355 2.0% 49.8 2524.4
Itaocara 22,899 17 333 350 4.9% 74.2 1528.5
Itaperuna 95,841 77 2671 2748 2.8% 80.3 2867.2
Laje do Muriaé 7487 3 242 245 1.2% 40.1 3272.3
Miracema 26,843 2 429 431 0.5% 7.5 1605.6
Natividade 15,082 3 544 547 0.5% 19.9 3626.8
Porciúncula 17,760 12 593 605 2.0% 67.6 3406.5
Santo Antônio de Pádua 40,589 19 1068 1087 1.7% 46.8 2678.1
São Jose de Ubá 7003 1 140 141 0.7% 14.3 2013.4
Varre-Sai 9475 2 597 599 0.3% 21.1 6321.9
North Fluminense Region 849,515 566 15,995 16,561
3.4% 66.6 1949.5
Campos dos Goytacazes 463,731 321 4941 5262 6.1% 69.2 1134.7
Carapebus 13,359 7 278 285 2.5% 52.4 2133.4
Cardoso Moreira 12,600 4 348 352 1.1% 31.7 2793.7
Conceição de Macabu 21,211 10 593 603 1.7% 47.1 2842.9
Cini Oliveira et al. BMC Infectious Diseases (2021) 21:687 Page 9 of 16
There was a statistically significant association be-tween the outcome and the predictor variables listed inTable 4.The historical case series per epidemiological week
showed a proportional increase in cases of ILI relative tothose of SARS starting from epidemiological week 19(Fig. 1a). Figure 1b shows a proportional increase indeaths compared to non-deaths between the 13th and20th epidemiological weeks, with a maximum of 2465deaths (14.7%) in week 18. After that, the death percent-age dropped.Concomitantly, there was a progressive increase in
cases in younger age groups throughout the study period(Fig. 2).Figure 3 illustrates the comparison of the age distribu-
tion according to clinical evolution - ILI vs. SARS (a)and death vs. non-death (b). ILI was more frequent inyounger individuals and SARS in older individuals. Thecomparison between the age groups of individuals ac-cording to the outcome showed a higher concentration
of elderly individuals in the group that progressed todeath. In both cases, there was a statistically significantdifference.The geographical distribution of confirmed cases and
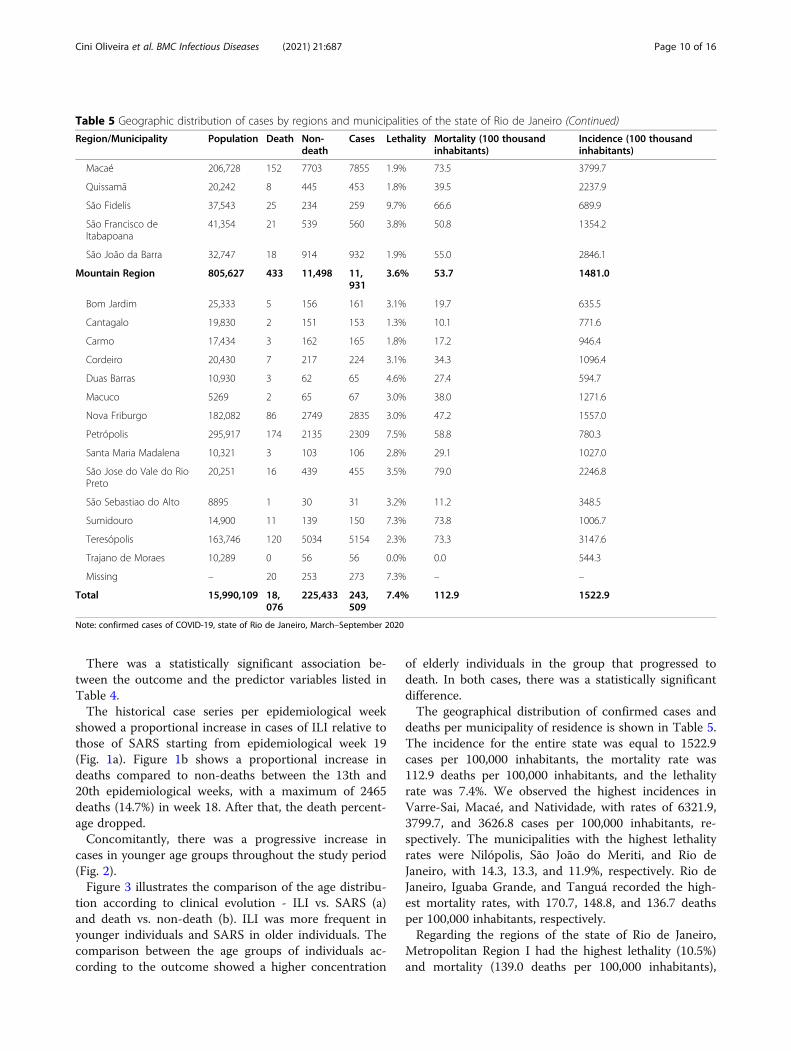
deaths per municipality of residence is shown in Table 5.The incidence for the entire state was equal to 1522.9cases per 100,000 inhabitants, the mortality rate was112.9 deaths per 100,000 inhabitants, and the lethalityrate was 7.4%. We observed the highest incidences inVarre-Sai, Macaé, and Natividade, with rates of 6321.9,3799.7, and 3626.8 cases per 100,000 inhabitants, re-spectively. The municipalities with the highest lethalityrates were Nilópolis, São João do Meriti, and Rio deJaneiro, with 14.3, 13.3, and 11.9%, respectively. Rio deJaneiro, Iguaba Grande, and Tanguá recorded the high-est mortality rates, with 170.7, 148.8, and 136.7 deathsper 100,000 inhabitants, respectively.Regarding the regions of the state of Rio de Janeiro,
Metropolitan Region I had the highest lethality (10.5%)and mortality (139.0 deaths per 100,000 inhabitants),
Table 5 Geographic distribution of cases by regions and municipalities of the state of Rio de Janeiro (Continued)
Region/Municipality Population Death Non-death
Cases Lethality Mortality (100 thousandinhabitants)
Incidence (100 thousandinhabitants)
Macaé 206,728 152 7703 7855 1.9% 73.5 3799.7
Quissamã 20,242 8 445 453 1.8% 39.5 2237.9
São Fidelis 37,543 25 234 259 9.7% 66.6 689.9
São Francisco deItabapoana
41,354 21 539 560 3.8% 50.8 1354.2
São João da Barra 32,747 18 914 932 1.9% 55.0 2846.1
Mountain Region 805,627 433 11,498 11,931
3.6% 53.7 1481.0
Bom Jardim 25,333 5 156 161 3.1% 19.7 635.5
Cantagalo 19,830 2 151 153 1.3% 10.1 771.6
Carmo 17,434 3 162 165 1.8% 17.2 946.4
Cordeiro 20,430 7 217 224 3.1% 34.3 1096.4
Duas Barras 10,930 3 62 65 4.6% 27.4 594.7
Macuco 5269 2 65 67 3.0% 38.0 1271.6
Nova Friburgo 182,082 86 2749 2835 3.0% 47.2 1557.0
Petrópolis 295,917 174 2135 2309 7.5% 58.8 780.3
Santa Maria Madalena 10,321 3 103 106 2.8% 29.1 1027.0
São Jose do Vale do RioPreto
20,251 16 439 455 3.5% 79.0 2246.8
São Sebastiao do Alto 8895 1 30 31 3.2% 11.2 348.5
Sumidouro 14,900 11 139 150 7.3% 73.8 1006.7
Teresópolis 163,746 120 5034 5154 2.3% 73.3 3147.6
Trajano de Moraes 10,289 0 56 56 0.0% 0.0 544.3
Missing – 20 253 273 7.3% – –
Total 15,990,109 18,076
225,433 243,509
7.4% 112.9 1522.9
Note: confirmed cases of COVID-19, state of Rio de Janeiro, March–September 2020
Cini Oliveira et al. BMC Infectious Diseases (2021) 21:687 Page 10 of 16
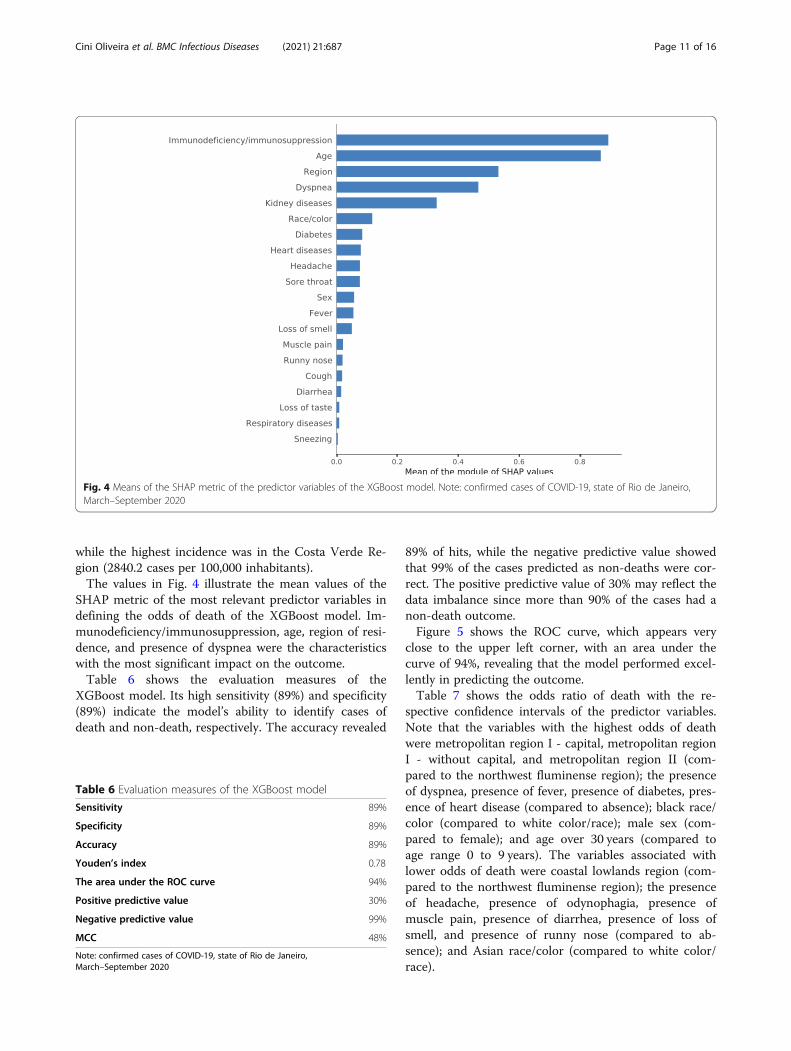
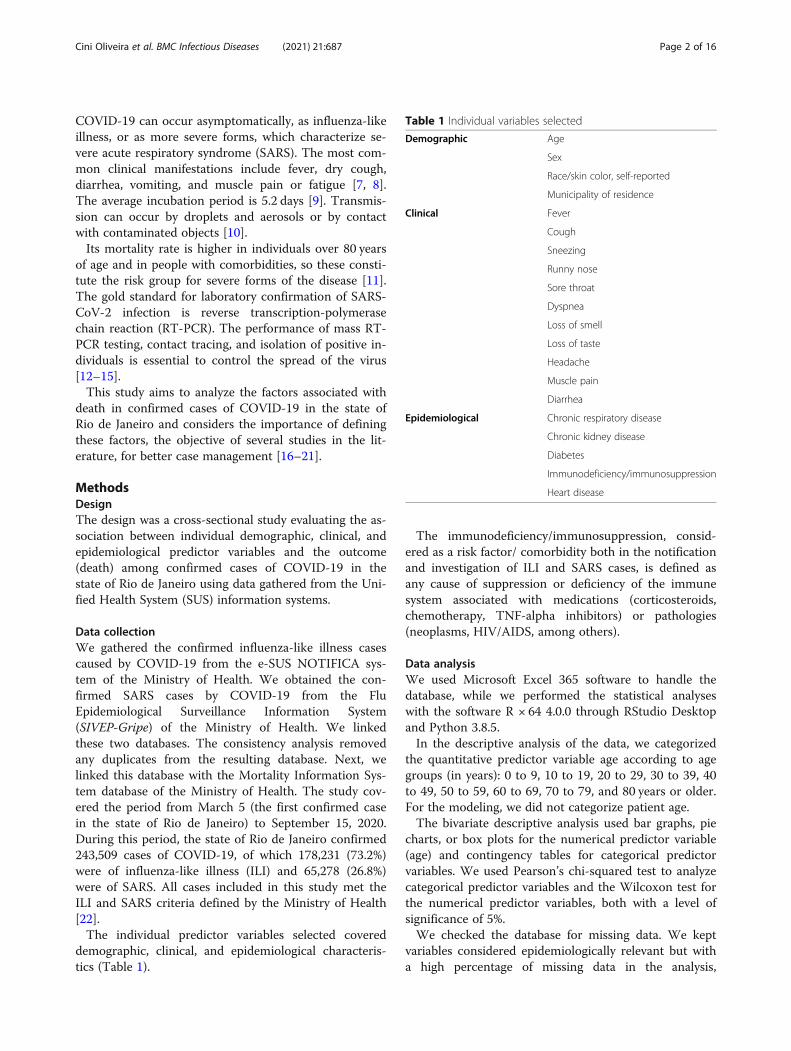
while the highest incidence was in the Costa Verde Re-gion (2840.2 cases per 100,000 inhabitants).The values in Fig. 4 illustrate the mean values of the
SHAP metric of the most relevant predictor variables indefining the odds of death of the XGBoost model. Im-munodeficiency/immunosuppression, age, region of resi-dence, and presence of dyspnea were the characteristicswith the most significant impact on the outcome.Table 6 shows the evaluation measures of the
XGBoost model. Its high sensitivity (89%) and specificity(89%) indicate the model’s ability to identify cases ofdeath and non-death, respectively. The accuracy revealed
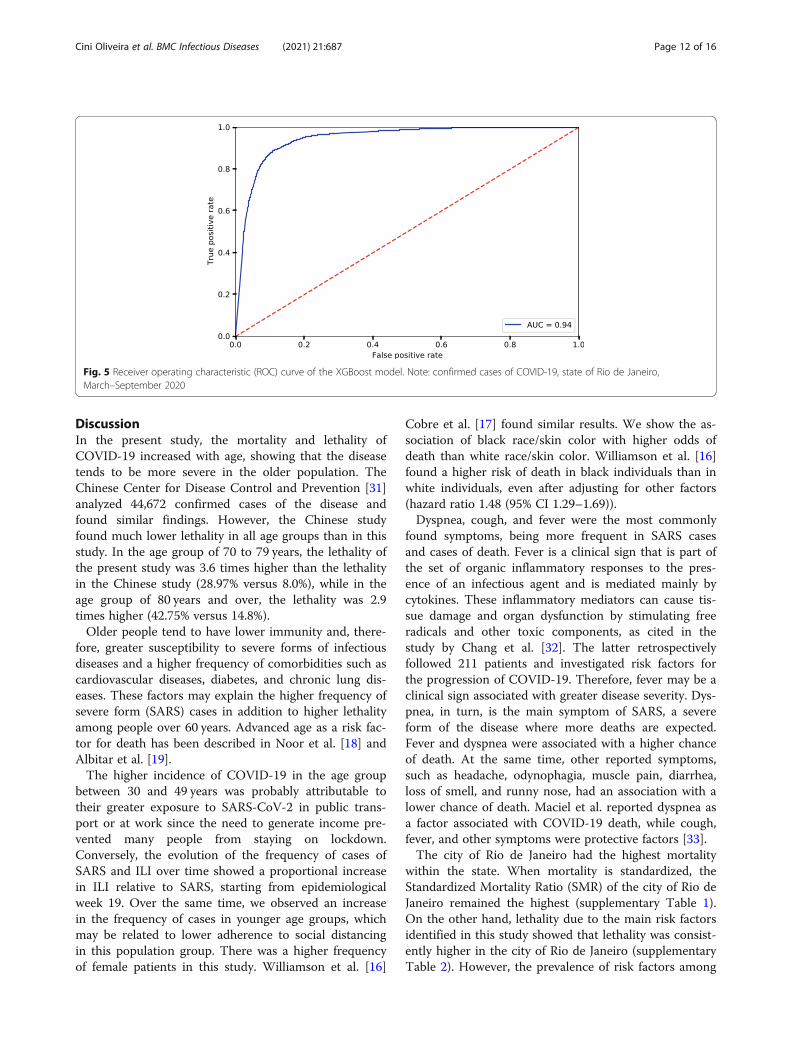
89% of hits, while the negative predictive value showedthat 99% of the cases predicted as non-deaths were cor-rect. The positive predictive value of 30% may reflect thedata imbalance since more than 90% of the cases had anon-death outcome.Figure 5 shows the ROC curve, which appears very
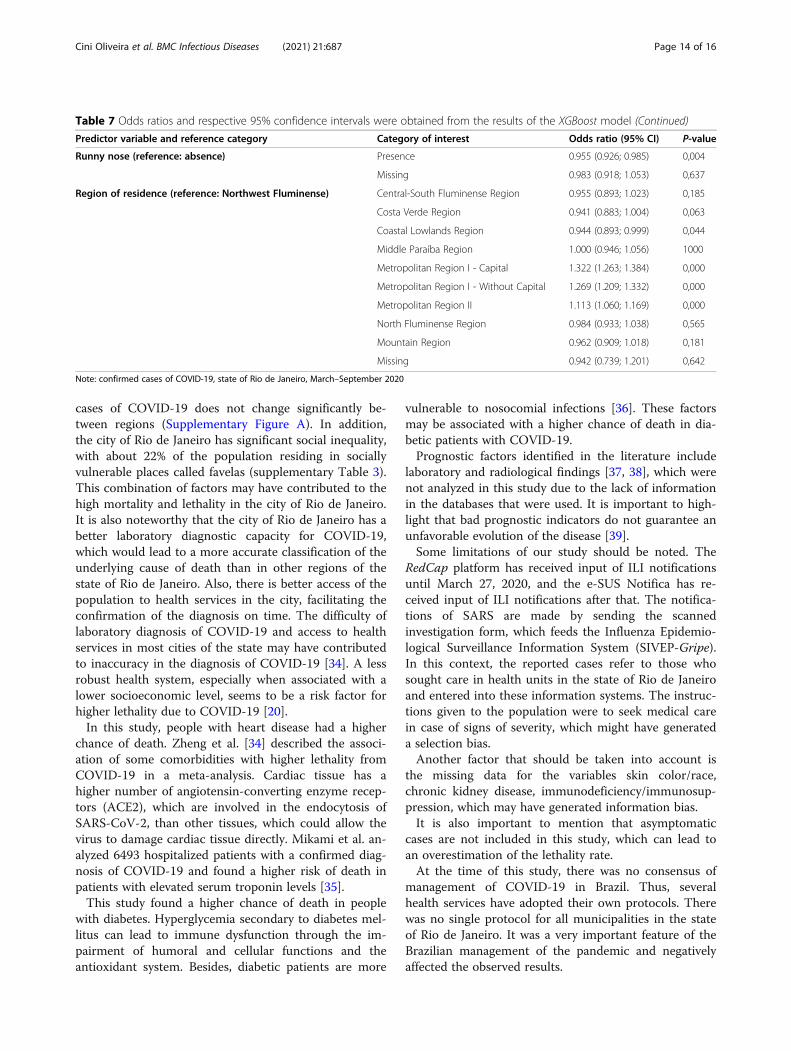
close to the upper left corner, with an area under thecurve of 94%, revealing that the model performed excel-lently in predicting the outcome.Table 7 shows the odds ratio of death with the re-
spective confidence intervals of the predictor variables.Note that the variables with the highest odds of deathwere metropolitan region I - capital, metropolitan regionI - without capital, and metropolitan region II (com-pared to the northwest fluminense region); the presenceof dyspnea, presence of fever, presence of diabetes, pres-ence of heart disease (compared to absence); black race/color (compared to white color/race); male sex (com-pared to female); and age over 30 years (compared toage range 0 to 9 years). The variables associated withlower odds of death were coastal lowlands region (com-pared to the northwest fluminense region); the presenceof headache, presence of odynophagia, presence ofmuscle pain, presence of diarrhea, presence of loss ofsmell, and presence of runny nose (compared to ab-sence); and Asian race/color (compared to white color/race).
Fig. 4 Means of the SHAP metric of the predictor variables of the XGBoost model. Note: confirmed cases of COVID-19, state of Rio de Janeiro,March–September 2020
Table 6 Evaluation measures of the XGBoost model
Sensitivity 89%
Specificity 89%
Accuracy 89%
Youden’s index 0.78
The area under the ROC curve 94%
Positive predictive value 30%
Negative predictive value 99%
MCC 48%
Note: confirmed cases of COVID-19, state of Rio de Janeiro,March–September 2020
Cini Oliveira et al. BMC Infectious Diseases (2021) 21:687 Page 11 of 16
DiscussionIn the present study, the mortality and lethality ofCOVID-19 increased with age, showing that the diseasetends to be more severe in the older population. TheChinese Center for Disease Control and Prevention [31]analyzed 44,672 confirmed cases of the disease andfound similar findings. However, the Chinese studyfound much lower lethality in all age groups than in thisstudy. In the age group of 70 to 79 years, the lethality ofthe present study was 3.6 times higher than the lethalityin the Chinese study (28.97% versus 8.0%), while in theage group of 80 years and over, the lethality was 2.9times higher (42.75% versus 14.8%).Older people tend to have lower immunity and, there-
fore, greater susceptibility to severe forms of infectiousdiseases and a higher frequency of comorbidities such ascardiovascular diseases, diabetes, and chronic lung dis-eases. These factors may explain the higher frequency ofsevere form (SARS) cases in addition to higher lethalityamong people over 60 years. Advanced age as a risk fac-tor for death has been described in Noor et al. [18] andAlbitar et al. [19].The higher incidence of COVID-19 in the age group
between 30 and 49 years was probably attributable totheir greater exposure to SARS-CoV-2 in public trans-port or at work since the need to generate income pre-vented many people from staying on lockdown.Conversely, the evolution of the frequency of cases ofSARS and ILI over time showed a proportional increasein ILI relative to SARS, starting from epidemiologicalweek 19. Over the same time, we observed an increasein the frequency of cases in younger age groups, whichmay be related to lower adherence to social distancingin this population group. There was a higher frequencyof female patients in this study. Williamson et al. [16]
Cobre et al. [17] found similar results. We show the as-sociation of black race/skin color with higher odds ofdeath than white race/skin color. Williamson et al. [16]found a higher risk of death in black individuals than inwhite individuals, even after adjusting for other factors(hazard ratio 1.48 (95% CI 1.29–1.69)).Dyspnea, cough, and fever were the most commonly
found symptoms, being more frequent in SARS casesand cases of death. Fever is a clinical sign that is part ofthe set of organic inflammatory responses to the pres-ence of an infectious agent and is mediated mainly bycytokines. These inflammatory mediators can cause tis-sue damage and organ dysfunction by stimulating freeradicals and other toxic components, as cited in thestudy by Chang et al. [32]. The latter retrospectivelyfollowed 211 patients and investigated risk factors forthe progression of COVID-19. Therefore, fever may be aclinical sign associated with greater disease severity. Dys-pnea, in turn, is the main symptom of SARS, a severeform of the disease where more deaths are expected.Fever and dyspnea were associated with a higher chanceof death. At the same time, other reported symptoms,such as headache, odynophagia, muscle pain, diarrhea,loss of smell, and runny nose, had an association with alower chance of death. Maciel et al. reported dyspnea asa factor associated with COVID-19 death, while cough,fever, and other symptoms were protective factors [33].The city of Rio de Janeiro had the highest mortality
within the state. When mortality is standardized, theStandardized Mortality Ratio (SMR) of the city of Rio deJaneiro remained the highest (supplementary Table 1).On the other hand, lethality due to the main risk factorsidentified in this study showed that lethality was consist-ently higher in the city of Rio de Janeiro (supplementaryTable 2). However, the prevalence of risk factors among
Fig. 5 Receiver operating characteristic (ROC) curve of the XGBoost model. Note: confirmed cases of COVID-19, state of Rio de Janeiro,March–September 2020
Cini Oliveira et al. BMC Infectious Diseases (2021) 21:687 Page 12 of 16
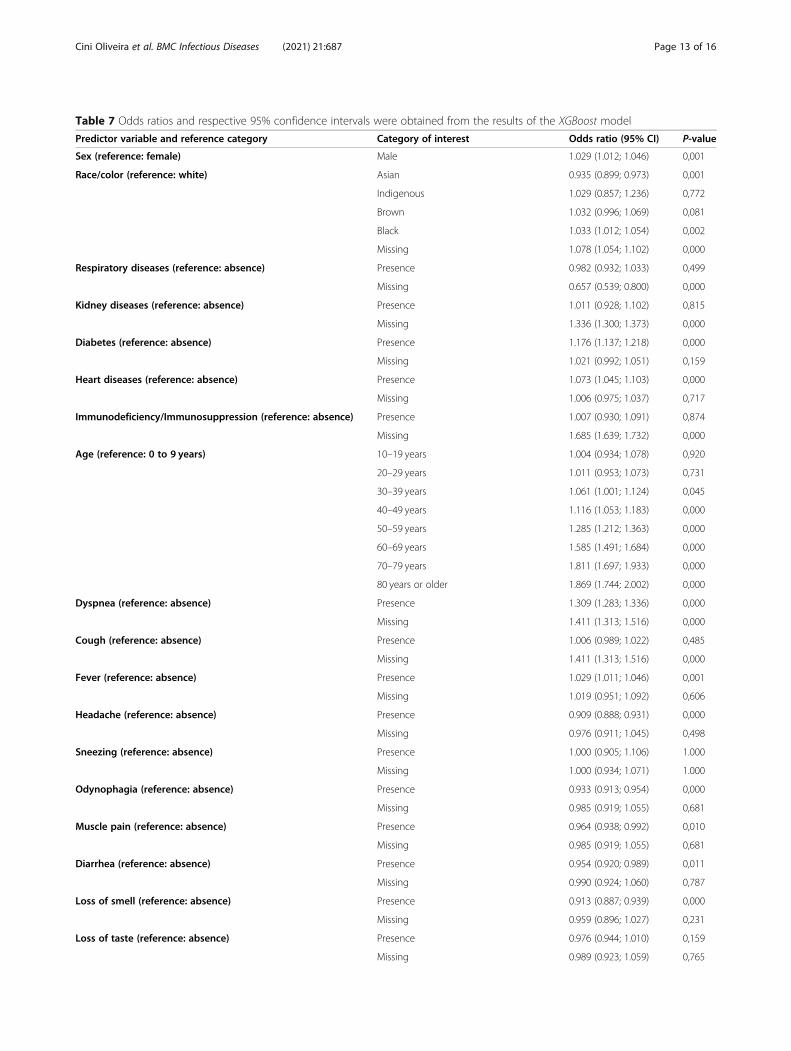
Table 7 Odds ratios and respective 95% confidence intervals were obtained from the results of the XGBoost model
Predictor variable and reference category Category of interest Odds ratio (95% CI) P-value
Sex (reference: female) Male 1.029 (1.012; 1.046) 0,001
Race/color (reference: white) Asian 0.935 (0.899; 0.973) 0,001
Indigenous 1.029 (0.857; 1.236) 0,772
Brown 1.032 (0.996; 1.069) 0,081
Black 1.033 (1.012; 1.054) 0,002
Missing 1.078 (1.054; 1.102) 0,000
Respiratory diseases (reference: absence) Presence 0.982 (0.932; 1.033) 0,499
Missing 0.657 (0.539; 0.800) 0,000
Kidney diseases (reference: absence) Presence 1.011 (0.928; 1.102) 0,815
Missing 1.336 (1.300; 1.373) 0,000
Diabetes (reference: absence) Presence 1.176 (1.137; 1.218) 0,000
Missing 1.021 (0.992; 1.051) 0,159
Heart diseases (reference: absence) Presence 1.073 (1.045; 1.103) 0,000
Missing 1.006 (0.975; 1.037) 0,717
Immunodeficiency/Immunosuppression (reference: absence) Presence 1.007 (0.930; 1.091) 0,874
Missing 1.685 (1.639; 1.732) 0,000
Age (reference: 0 to 9 years) 10–19 years 1.004 (0.934; 1.078) 0,920
20–29 years 1.011 (0.953; 1.073) 0,731
30–39 years 1.061 (1.001; 1.124) 0,045
40–49 years 1.116 (1.053; 1.183) 0,000
50–59 years 1.285 (1.212; 1.363) 0,000
60–69 years 1.585 (1.491; 1.684) 0,000
70–79 years 1.811 (1.697; 1.933) 0,000
80 years or older 1.869 (1.744; 2.002) 0,000
Dyspnea (reference: absence) Presence 1.309 (1.283; 1.336) 0,000
Missing 1.411 (1.313; 1.516) 0,000
Cough (reference: absence) Presence 1.006 (0.989; 1.022) 0,485
Missing 1.411 (1.313; 1.516) 0,000
Fever (reference: absence) Presence 1.029 (1.011; 1.046) 0,001
Missing 1.019 (0.951; 1.092) 0,606
Headache (reference: absence) Presence 0.909 (0.888; 0.931) 0,000
Missing 0.976 (0.911; 1.045) 0,498
Sneezing (reference: absence) Presence 1.000 (0.905; 1.106) 1.000
Missing 1.000 (0.934; 1.071) 1.000
Odynophagia (reference: absence) Presence 0.933 (0.913; 0.954) 0,000
Missing 0.985 (0.919; 1.055) 0,681
Muscle pain (reference: absence) Presence 0.964 (0.938; 0.992) 0,010
Missing 0.985 (0.919; 1.055) 0,681
Diarrhea (reference: absence) Presence 0.954 (0.920; 0.989) 0,011
Missing 0.990 (0.924; 1.060) 0,787
Loss of smell (reference: absence) Presence 0.913 (0.887; 0.939) 0,000
Missing 0.959 (0.896; 1.027) 0,231
Loss of taste (reference: absence) Presence 0.976 (0.944; 1.010) 0,159
Missing 0.989 (0.923; 1.059) 0,765
Cini Oliveira et al. BMC Infectious Diseases (2021) 21:687 Page 13 of 16
cases of COVID-19 does not change significantly be-tween regions (Supplementary Figure A). In addition,the city of Rio de Janeiro has significant social inequality,with about 22% of the population residing in sociallyvulnerable places called favelas (supplementary Table 3).This combination of factors may have contributed to thehigh mortality and lethality in the city of Rio de Janeiro.It is also noteworthy that the city of Rio de Janeiro has abetter laboratory diagnostic capacity for COVID-19,which would lead to a more accurate classification of theunderlying cause of death than in other regions of thestate of Rio de Janeiro. Also, there is better access of thepopulation to health services in the city, facilitating theconfirmation of the diagnosis on time. The difficulty oflaboratory diagnosis of COVID-19 and access to healthservices in most cities of the state may have contributedto inaccuracy in the diagnosis of COVID-19 [34]. A lessrobust health system, especially when associated with alower socioeconomic level, seems to be a risk factor forhigher lethality due to COVID-19 [20].In this study, people with heart disease had a higher
chance of death. Zheng et al. [34] described the associ-ation of some comorbidities with higher lethality fromCOVID-19 in a meta-analysis. Cardiac tissue has ahigher number of angiotensin-converting enzyme recep-tors (ACE2), which are involved in the endocytosis ofSARS-CoV-2, than other tissues, which could allow thevirus to damage cardiac tissue directly. Mikami et al. an-alyzed 6493 hospitalized patients with a confirmed diag-nosis of COVID-19 and found a higher risk of death inpatients with elevated serum troponin levels [35].This study found a higher chance of death in people
with diabetes. Hyperglycemia secondary to diabetes mel-litus can lead to immune dysfunction through the im-pairment of humoral and cellular functions and theantioxidant system. Besides, diabetic patients are more
vulnerable to nosocomial infections [36]. These factorsmay be associated with a higher chance of death in dia-betic patients with COVID-19.Prognostic factors identified in the literature include
laboratory and radiological findings [37, 38], which werenot analyzed in this study due to the lack of informationin the databases that were used. It is important to high-light that bad prognostic indicators do not guarantee anunfavorable evolution of the disease [39].Some limitations of our study should be noted. The
RedCap platform has received input of ILI notificationsuntil March 27, 2020, and the e-SUS Notifica has re-ceived input of ILI notifications after that. The notifica-tions of SARS are made by sending the scannedinvestigation form, which feeds the Influenza Epidemio-logical Surveillance Information System (SIVEP-Gripe).In this context, the reported cases refer to those whosought care in health units in the state of Rio de Janeiroand entered into these information systems. The instruc-tions given to the population were to seek medical carein case of signs of severity, which might have generateda selection bias.Another factor that should be taken into account is
the missing data for the variables skin color/race,chronic kidney disease, immunodeficiency/immunosup-pression, which may have generated information bias.It is also important to mention that asymptomatic
cases are not included in this study, which can lead toan overestimation of the lethality rate.At the time of this study, there was no consensus of
management of COVID-19 in Brazil. Thus, severalhealth services have adopted their own protocols. Therewas no single protocol for all municipalities in the stateof Rio de Janeiro. It was a very important feature of theBrazilian management of the pandemic and negativelyaffected the observed results.
Table 7 Odds ratios and respective 95% confidence intervals were obtained from the results of the XGBoost model (Continued)
Predictor variable and reference category Category of interest Odds ratio (95% CI) P-value
Runny nose (reference: absence) Presence 0.955 (0.926; 0.985) 0,004
Missing 0.983 (0.918; 1.053) 0,637
Region of residence (reference: Northwest Fluminense) Central-South Fluminense Region 0.955 (0.893; 1.023) 0,185
Costa Verde Region 0.941 (0.883; 1.004) 0,063
Coastal Lowlands Region 0.944 (0.893; 0.999) 0,044
Middle Paraíba Region 1.000 (0.946; 1.056) 1000
Metropolitan Region I - Capital 1.322 (1.263; 1.384) 0,000
Metropolitan Region I - Without Capital 1.269 (1.209; 1.332) 0,000
Metropolitan Region II 1.113 (1.060; 1.169) 0,000
North Fluminense Region 0.984 (0.933; 1.038) 0,565
Mountain Region 0.962 (0.909; 1.018) 0,181
Missing 0.942 (0.739; 1.201) 0,642
Note: confirmed cases of COVID-19, state of Rio de Janeiro, March–September 2020
Cini Oliveira et al. BMC Infectious Diseases (2021) 21:687 Page 14 of 16
The authors recognize the importance of risk factorssuch as smoking, chronic hepatic disease, and cancer inthe analysis of COVID-19, but they were not present inthe available databases.
ConclusionsCOVID-19 is a disease that can evolve into severe formsleading to death, especially in certain population groups.This study showed that older individuals of black race/skin color with heart disease or diabetes who had dys-pnea or fever were more likely to die. The present studyaimed to contribute to the early identification ofCOVID-19 patients who may progress to a more severeform of the disease, improve the clinical management ofpatients with COVID-19, and reduce the disease’slethality.
AbbreviationsACE2: Angiotensin-converting enzyme receptors; COVID-19: Coronavirusdisease 2019; ENN: Edited nearest neighbor; XGBoost: Extreme gradientboosting; ILI: Influenza-like illness; MCC: Matthews’ correlation coefficient;ROC: Receiver operating characteristic; RT-PCR: Reverse transcriptionpolymerase chain reaction; SARS: Severe acute respiratory syndrome; SARS-CoV-2: Severe acute respiratory syndrome coronavirus 2; SHAP: SHapleyAdditive exPlanations; SIVEP-Gripe: Flu Epidemiological SurveillanceInformation System; SMOTE: Synthetic minority oversampling technique;SMR: Standardized Mortality Ratio; SUS: Unified Health System; WHO: WorldHealth Organization
Supplementary InformationThe online version contains supplementary material available at https://doi.org/10.1186/s12879-021-06384-1.
Additional file 1.
AcknowledgementsNot Applicable.
Authors’ contributionsM.C.O. contributed to conceptualization, data curation, formal analysis,investigation, methodology, project administration, software, supervision,visualization, and writing – original draft, writing – review & editing, and wasa major contributor in writing the manuscript. T.A.E. contributed toconceptualization, data curation, formal analysis, investigation, methodology,software, supervision, visualization, and writing – original draft, writing –review & editing. A.B.A.C. contributed to conceptualization, data curation,formal analysis, investigation, methodology, software, visualization, andwriting – original draft, writing – review & editing. L.D.R.S. contributed toconceptualization, data curation, formal analysis, investigation, visualization,and writing – original draft, writing – review & editing. R.C.R. contributedconceptualization, formal analysis, investigation, visualization, and writing –original draft, writing – review & editing. B.A.O. contributed toconceptualization, formal analysis, investigation, visualization, and writing –original draft, writing – review & editing. M.M.M. contributed toconceptualization, formal analysis, investigation, writing – review & editing.C.E.R. contributed to data curation, software. R.A.M. contributed toconceptualization, formal analysis, investigation, project administration,supervision, visualization, and writing – original draft, writing – review &editing. All authors read and approved the final manuscript.
FundingThe National Council for Scientific and Technological Development (CNPq)and the Federal University of Rio de Janeiro (UFRJ) are responsible forgranting the Scientific Initiation scholarship to co-author Marcella Cini
Oliveira, through the Institutional Program for Scientific Initiation Scholarships(PIBIC).The Institute of Epidemiology and Collective Health of the Federal Universityof Rio de Janeiro (IESC-UFRJ) and the DS / CAPES - 2019 Program areresponsible for granting the doctoral scholarship to co-author Lucas Dalsen-ter Romano da Silva.Research Support Foundation of the State of Rio de Janeiro (FAPERJ) isresponsible for acquiring the funds for translation and publication of themanuscript.
Availability of data and materialsThe databases and materials used in this manuscript may be made availableupon request from interested researchers. To that end, please contact thecorresponding author, Marcella Cini Oliveira, through the e-mail [email protected].
Declarations
Ethics approval and consent to participateThis study is a cross-sectional study from a database that contains informa-tion that does not allow for individual identification. Therefore, an ethicscommittee did not need approval as cited in CONEP/Brazil, Brazilian commit-tee responsible for ethical evaluation in clinical research. The attached docu-ment in “Related Files” supports this statement.
Competing interestsThe authors declare that they have no competing interests.
Author details1Faculdade de Medicina, Universidade Federal do Rio de Janeiro, Rio deJaneiro, Brasil. 2Instituto de Estudos em Saúde Pública / Faculdade deMedicina, Universidade Federal do Rio de Janeiro, Rio de Janeiro, Brasil.3Faculdade de Enfermagem, Universidade do Estado do Rio de Janeiro, Riode Janeiro, Brasil. 4Instituto de Física, Universidade Federal do Rio de Janeiro,Rio de Janeiro, Brasil. 5Departamento de Medicina Preventiva, Instituto deEstudos em Saúde Pública / Faculdade de Medicina, Universidade Federal doRio de Janeiro, Rio de Janeiro, Brasil. 6Department of Child Neurology,Martagão Gesteira Institute of Childcare and Pediatrics, Federal University ofRio de Janeiro, Rio de Janeiro, Brazil.
Received: 17 April 2021 Accepted: 17 June 2021
References1. Yang X, Yu Y, Xu J, Shu H, Xia J, Liu H, et al. Clinical course and outcomes of
critically ill patients with SARS-CoV-2 pneumonia in Wuhan, China: a single-centered, retrospective, observational study. Lancet Respir Med. 2020;8(5):475–81 Available from: https://doi.org/10.1016/S2213-2600(20)30079-5.
2. Chen N, Zhou M, Dong X, Qu J, Gong F, Han Y, et al. Epidemiological andclinical characteristics of 99 cases of 2019 novel coronavirus pneumonia inWuhan, China: a descriptive study. Lancet. 2020;395(10223):507–13 Availablefrom: https://doi.org/10.1016/S0140-6736(20)30211-7.
3. Wang D, Hu B, Hu C, Zhu F, Liu X, Zhang J, et al. Clinical characteristics of138 hospitalized patients with 2019 novel coronavirus-infected pneumoniain Wuhan, China. JAMA. 2020;323(11):1061–9. https://doi.org/10.1001/jama.2020.1585.
4. Croda J, de Oliveira WK, Frutuoso RL, Mandetta LH, Baia-Da-silva DC, Brito-Sousa JD, et al. Covid-19 in Brazil: advantages of a socialized unified healthsystem and preparation to contain cases. Rev Soc Bras Med Trop. 2020;53(April):2–7.
5. de Jesus JG, Sacchi C, da Silva Candido D, Claro IM, Sales FCS, Manuli ER,et al. Importation and early local transmission of covid-19 in Brazil, 2020.Rev Inst Med Trop Sao Paulo. 2020;62(April):1–5.
6. WHO. WHO Coronavirus Disease (COVID-19) Dashboard [Internet]. 2021.[cited 2021 Mar 2]. Available from: https://covid19.who.int/?gclid=EAIaIQobChMI54-s182f6wIVkYSRCh23mgziEAAYASAAEgK5U_D_BwE
7. Huang C, Wang Y, Li X, Ren L, Zhao J, Hu Y, et al. Clinical features ofpatients infected with 2019 novel coronavirus in Wuhan, China. Lancet(London, England). 2020;395(10223):497–506.
8. Sohrabi C, Alsafi Z, O'Neill N, Khan M, Kerwan A, Al-Jabir A, et al. WorldHealth Organization declares global emergency: a review of the 2019 novel
Cini Oliveira et al. BMC Infectious Diseases (2021) 21:687 Page 15 of 16
coronavirus (COVID-19). Int J Surg. 2020;76(February):71–6 Available from:https://doi.org/10.1016/j.ijsu.2020.02.034.
9. Li Q, Guan X, Wu P, Wang X, Zhou L, Tong Y, et al. Early transmissiondynamics in Wuhan, China, of novel coronavirus–infected pneumonia. NEngl J Med. 2020;382(13):1199–207. https://doi.org/10.1056/NEJMoa2001316.
10. Adhikari SP, Meng S, Wu Y, Mao Y, Ye R, Wang Q, et al. A scoping review of2019 Novel Coronavirus during the early outbreak period: Epidemiology,causes, clinical manifestation and diagnosis, prevention and control; 2020. p.1–12.
11. Varghese GM, John R, Manesh A, Karthik R, Abraham OC. Clinicalmanagement of COVID-19. J Dent Educ. 2012;76(11):401–10 Available from:http://www.ncbi.nlm.nih.gov/pubmed/23144490.
12. ECDC. An overview of the rapid test situation for COVID-19 diagnosis in theEU / EEA. Eur Cent Dis Prev Control. Technical report. 2020;319:1–3.
13. Tang Y, Schmitz JE, Persing DH, Stratton CW. Laboratory diagnosis ofCOVID-19: current issues and challenges. J Clin Microbiol. 2020;58(6):1–9.
14. Bruno R, Mondelli M, Brunetti E, Di Matteo A, Seminari E, Maiocchi L, et al.Performance of VivaDiag COVID-19 IgM/IgG rapid test is inadequate fordiagnosis of COVID-19 in acute patients referring to emergency roomdepartment. J Med Virol. 2020;92(10):1724–7.
15. Long QX, Liu BZ, Deng HJ, Wu GC, Deng K, Chen YK, et al. Antibodyresponses to SARS-CoV-2 in patients with COVID-19. Nat Med. 2020;26(6):845–8. https://doi.org/10.1038/s41591-020-0897-1.
16. Williamson EJ, Walker AJ, Bhaskaran K, Bacon S, Bates C, Morton CE, et al.Factors associated with COVID-19-related death using OpenSAFELY. Nature.2020;584(7821):430–6 Available from: https://doi.org/10.1038/s41586-020-2521-4.
17. de Fátima Cobre A, Böger B, Fachi MM, de Oliveira Vilhena R, Domingos EL,Tonin FS, et al. Risk factors associated with delay in diagnosis and mortalityin patients with covid-19 in the city of Rio de Janeiro, Brazil. Ciên SaúdeColet. 2020;25:4131–40.
18. Noor FM, Islam MM. Prevalence and associated risk factors of mortalityamong COVID-19 patients: a meta-analysis. J Community Health. 2020;45(6):1270–82 Available from: https://doi.org/10.1007/s10900-020-00920-x.
19. Albitar O, Ballouze R, Ooi JP, Ghadzi SMS. Risk factors for mortality of COVID-19 patients. medRxiv. 2020;166:108293.
20. Mohammed M, Muhammad S, Mohammed FZ, Mustapha S, Sha'aban A,Sani NY, et al. Risk factors associated with mortality among patients withnovel coronavirus disease (COVID-19) in Africa. J Racial Ethn Heal Disparities.2020:6–11. Avaiable from: https://doi.org/10.1007/s40615-020-00888-3.
21. Escosteguy CC, de Araujo Eleuterio T, Pereira AGL, Marques MRVE, BrandãoAD, Batista JPM. COVID-19: a cross-sectional study of suspected casesadmitted to a federal hospital in Rio de Janeiro, Brazil, and factorsassociated with hospital death. Epidemiol Serv Saúde. 2021;30(1):e2020750Available from: https://doi.org/10.1590/s1679-49742021000100023.
22. Rio de Janeiro. State Health Department. Coronavirus disease (COVID-19),updated information from the technical note - SVS/SES-RJ number 2020/01(fourth update). Technical Note SVS/SES-RJ [Internet]. 2020. Available from:http://patydoalferes.rj.gov.br/wp-content/uploads/2020/08/9-ATUALIZACAO.pdf.
23. CEPERJ. Regions of the state of Rio de Janeiro [Internet]. [cited 2021 Mar11]. Available from: http://www.ceperj.rj.gov.br/Conteudo.asp?ident=81.
24. Mansourifar H, Shi W. Deep synthetic minority over-sampling technique.arXiv. 2020;16:321–57.
25. Wilson DL. Asymptotic properties of nearest neighbor rules using editeddata. IEEE Trans Syst Man Cybern. 1972;2(3):408–21.
26. Chen T, Guestrin C. XGBoost: a scalable tree boosting system. J AssocPhysicians India. 1994;42(8):665.
27. Štrumbelj E, Kononenko I. Explaining prediction models and individualpredictions with feature contributions. Knowl Inf Syst. 2014;41(3):647–65.https://doi.org/10.1007/s10115-013-0679-x.
28. Matthews BW. Comparison of the predicted and observed secondarystructure of T4 phage lysozyme. BBA Protein Struct. 1975;405(2):442–51.https://doi.org/10.1016/0005-2795(75)90109-9.
29. Wayne W. LaMorte. Confidence Interval for an Odds Ratio [Internet].Comparing Frequencies. 2018 [cited 2021 Mar 11]. p. 8. Available from:https://sphweb.bumc.bu.edu/otlt/MPH-Modules/PH717-QuantCore/PH717_ComparingFrequencies/PH717_ComparingFrequencies8.html#headingtaglink_1.
30. Altman DG, Bland JM. How to obtain the P value from a confidenceinterval. BMJ. 2011;343:d2304 Available from: https://doi.org/10.1136/bmj.d2304.
31. Novel Coronavirus Pneumonia Emergency Response Epidemiology Team.The epidemiological characteristics of an outbreak of 2019 novelcoronavirus diseases (COVID-19) in China. Chinese Cent Dis Control PrevWkly. 2020;41(2):145–51 Available from: https://doi.org/10.3760/cma.j.issn.0254-6450.2020.02.003.
32. Chang MC, Park YK, Kim BO, Park D. Risk factors for disease progression inCOVID-19 patients. BMC Infect Dis. 2020;20(1):4–9.
33. Leonor Maciel E, Jabor P, Etereldes Goncalves J, Tristão-Sá R. Rita de CássiaDuarte L, reis-Santos B, et al. factors associated with COVID-19 hospitaldeaths in Espirito Santo, Brazil, 2020. Epidemiol Serv Saúde. 2020;29(4):1–11.
34. Zheng Z, Peng F, Xu B, Zhao J, Liu H, Peng J. Risk factors of critical & mortalCOVID-19 cases: A systematic literature review and meta-analysis. 2020;(January).
35. Mikami T, Miyashita H, Yamada T, Harrington M, Steinberg D, Dunn A, et al.Risk factors for mortality in patients with COVID-19 in new York City. J GenIntern Med. 2021;36(1):17–26. https://doi.org/10.1007/s11606-020-05983-z.
36. Klonoff DC, Umpierrez GE. Letter to the editor: COVID-19 in patients withdiabetes: risk factors that increase morbidity. Metabolism. 2020;108:154224Available from: https://doi.org/10.1016/j.metabol.2020.154224.
37. Izcovich A, Ragusa MA, Tortosa F, Lavena Marzio MA, Agnoletti C, BengoleaA, et al. Prognostic factors for severity and mortality in patients infectedwith COVID-19: A systematic review. PLoS One. 2020;15(11):e0241955.https://doi.org/10.1371/journal.pone.0241955 PMID: 33201896; PMCID:PMC7671522.
38. Arcari L., Luciani M., Cacciotti L., Musumeci MB, Spuntarelli V, Pistella E, et al.Incidência e determinantes da elevação da troponina de alta sensibilidade edos peptídeos natriuréticos na admissão em pacientes com pneumoniaCOVID-19 hospitalizados. Intern Emerg Med. 2020;15(8):1467–76.https://doi.org/10.1007/s11739-020-02498-7.
39 Bentivegna E, Luciani M, Spuntarelli V, Speranza ML, Guerritore L,Sentimentale A, et al. Caso Extremamente Grave de Pneumonia COVID-19Recuperada Apesar dos Maus Indicadores de Prognóstico: um RelatórioDidático. SN Compr Clin Med. 2020:1–4. https://doi.org/10.1007/s42399-020-00383-0 Epub ahead of print. PMID: 32838153; PMCI D: PMC7324074.
Publisher’s NoteSpringer Nature remains neutral with regard to jurisdictional claims inpublished maps and institutional affiliations.
Cini Oliveira et al. BMC Infectious Diseases (2021) 21:687 Page 16 of 16