Embed Size (px)
Citation preview
i
FACTORS ASSOCIATED WITH TURNOVER AMONG NURSES IN PUBLIC
HEALTH FACILITIES IN KHOMAS REGION OF NAMIBIA
A RESEARCH THESIS SUBMITTED IN FULFILMENT
OF THE REQUIREMENTS FOR THE DEGREE OF
MASTER OF NURSING SCIENCE
OF
THE UNIVERSITY OF NAMIBIA
BY
EUSEBIA S. SHAVA
200838687
November 2017
Main supervisor: Dr Hans Justus Amukugo
Co- supervisor: Dr Louise Pretorius
ii
DECLARATION
I, EUSEBIA S. SHAVA, hereby declare that “Factors associated with turnover
among nurses in public health facilities in Khomas Region of Namibia”, is a true
reflection of my own work, and that all the sources used have been acknowledged in
the text and the reference list. The version of this work is an original work, and has
not previously been submitted or in part for the degree at any other university.
This thesis may not be produced, stored in any retrieval system or transmitted in any
form or by means, whether mechanical, electronic, photocopying, recording or
otherwise, without the expressed permission from the author, or the University of
Namibia on his behalf.
I, EUSEBIA S. SHAVA hereby grant the University of Namibia the right to produce
this thesis in its entirely or parts thereof, in any format, which the University of
Namibia may deem fit, for any person or institution requiring it for study and
research, provided that the University of Namibia shall waive this right if the whole
thesis has been or is being published in a manner that is not approved by the
University of Namibia.
EUSEBIA S. SHAVA_________________ Date: ___________________
iii
ABSTRACT
The Khomas Region of Namibia has witnessed the exodus of skilled nurses and this
has impacted on health care performance. The purpose of this study was to determine
the factors associated with staff turnover of nurses within the public health facilities;
determine the demographic factors that contribute to turnover of nurses in the public
health facilities; determine the factors that are associated with turnover of nurses in
the public health facilities, describe the opinions of the respondents regarding
turnover and analyse and to analyse the association of demographic data and
variables of each associated factor within Khomas Region of Namibia. A mixed
method (triangulation) of both quantitative and qualitative approaches was used
against a target population of 597 nursing staff. The stratified random sampling
method was used in selecting the participants. Data analysis used was SPSS for the
quantitative and Atlas.ti for the qualitative.
Findings revealed poor working conditions; unsatisfactory salary (.79 commonality),
insufficient time for training (.75 commonality), lack of chance for promotion (.80)
and lack of managers’encouraging participation (.80). Further outcomes indicated
that nepotism, favoritism, delayed overtime payments, lack of team work, unskilled
supervisors, including lack of career development, were the main factors leading to
nursing turnover. An inherent limitation of the study was its cross-sectional nature
thus the findings may not necessarily be reflective for all causes of nurse turnover in
public health facilities in Namibia.
The following recommendations were made; the government should review nurses’
remuneration scales to correspond with those of the private sector. An exit interview
system should be implemented to determine possible causes of nurse turnover, there
is need to strengthen orientation and training of new employees to clarify what is
expected of them.

iv
DEDICATION
This study is dedicated to my loving husband who identified my potential many
years ago and helped me climb all ladders that has led to all my success. I could not
have been where I am now without his support and love. May the good Lord bless
him abundantly.
v
ACKNOWLEDGEMENTS
I would like to thank the Almighty God for giving me the strength and
courage to continue with my studies.
My supervisor Dr. Hans Justus Amukugo, for his continued and
immeasurable support throughout the challenging time of the study. Without
his support, encouragement and guidance, this thesis would not have
materialised.
I would also like to express my gratitude to my co- supervisor Dr L.
Pretorius, who have been there from the beginning of this study and never
gave up on me. Her guidance, encouragement love and support have greatly
contributed to the success of this study.
The University of Namibia for approving my study proposal.
The Ministry of Health and Social Services for granting me the permission to
conduct the study.
The hospital management of all private hospitals in Windhoek for allowing
me to conduct this study in their health facilities. Thank you for the immense
support you offered me during the study.
All registered and Enrolled nurses from who supported me during the study,
despite their hectic daily schedules. Your co-operation has made this study to
be a success.
My husband Musah Shava for all the financial costs incurred and my children
for all their support and patience during my study.
My cousin Martha Dimiti and my friend Theodora Chiguvare for their
unconditional love and support throughout my study.
vi
TABLE OF CONTENTS
CHAPTER 1 ............................................................................................................... 1
INTRODUCTION AND BACKGROUND TO THE STUDY ............................... 1
1.1. INTRODUCTION ......................................................................................... 1
1.2. BACKGROUND TO THE PROBLEM ........................................................ 2
1.3. PROBLEM STATEMENT ........................................................................... 4
1.4. PURPOSE OF THE STUDY ........................................................................ 6
1.5. OBJECTIVES OF THE STUDY .................................................................. 6
1.6. SIGNIFICANCE OF THE STUDY .............................................................. 6
1.7. LIMITATIONS ............................................................................................. 6
1.8. DELIMITATIONS ........................................................................................ 7
1.9. PARADIGMATIC PERSPECTIVES ........................................................... 7
1.9.1 Meta- theoretical assumptions ....................................................................... 8
1.9.1.1 Ontological assumption ............................................................................. 8
1.9.1.2 Epistemology assumption .......................................................................... 8
1.9.1.3 Axiology assumption ................................................................................. 9
1.9.1.4 Methodological assumption ....................................................................... 9
1.9.1.5 Rhetorical assumption.............................................................................. 10
1.9.2 Theoretical research as a basis for the study ............................................... 11
1.9.2.1 Traditional turnover model ...................................................................... 11
1.9.2.2 Herzberg motivational model .................................................................. 12
1.9.2.3 Conceptual framework ............................................................................. 13
1.10. DEFINITION OF CONCEPTS ................................................................... 14
1.10.1 Factors ......................................................................................................... 14
1.10.2 Turnover ...................................................................................................... 15
1.10.3 Nurses .......................................................................................................... 15
1.10.4 Public health facilities ................................................................................. 15
1.11. OUTLINE OF CHAPTERS ........................................................................ 16
1.12. SUMMARY ................................................................................................ 16
CHAPTER 2 ............................................................................................................. 18
LITERATURE REVIEW ........................................................................................ 18
2.1. INTRODUCTION ....................................................................................... 18
2.2. GENERAL BACKGROUND OF TURNOVER ........................................ 18
2.3. TURNOVER AMONG NURSES ............................................................... 19
vii
2.4. THEORETICAL AND CONCEPTUAL FRAMEWORK ......................... 20
2.4.1 Herzberg motivational model ...................................................................... 20
2.4.2 Traditional model ........................................................................................ 21
2.5. FACTORS ASSOCIATED WITH STAFF TURNOVER .......................... 22
2.5.1 Demographic factors ................................................................................... 23
2.5.1.1 Marital status............................................................................................ 24
2.5.1.2 Educational qualification ......................................................................... 24
2.5.1.3 Age ........................................................................................................... 24
2.5.1.4 Gender ...................................................................................................... 25
2.5.2 Employee promotion practices .................................................................... 25
2.5.3 Reward or compensation practices .............................................................. 26
2.5.4 Staff training and development practices .................................................... 28
2.5.5 Work environment ....................................................................................... 29
2.5.6 Other factors ................................................................................................ 29
2.6. EFFECTS OF TURNOVER ....................................................................... 30
2.6.1 Individual employee and family .................................................................. 31
2.6.2 Organisation ................................................................................................ 32
2.7. STRATEGIES TO OVERCOME TURNOVER ........................................ 32
2.5.2 Performance incentives ............................................................................... 33
2.5.3 Performance feedback ................................................................................. 33
2.5.4 Sharing knowledge ...................................................................................... 33
2.8. SUMMARY ................................................................................................ 35
CHAPTER 3 ............................................................................................................. 36
RESEARCH DESIGN AND METHOD ................................................................ 36
3.1. INTRODUCTION ....................................................................................... 36
3.2. RESEARCH DESIGN ................................................................................ 36
3.2.1 Mixed method design .................................................................................. 36
3.2.2 Explorative design ....................................................................................... 38
3.2.3 Descriptive design ....................................................................................... 38
3.2.4 Analytical design ......................................................................................... 39
3.3. RESEARCH CONTEXT ............................................................................ 39
3.4. POPULATION ............................................................................................ 40
3.4.1 Sample and sampling ................................................................................... 40
3.5. DATA COLLECTION ................................................................................ 41
3.5.1 Research instrument .................................................................................... 41
viii
3.5.2 Procedure for data collection ..................................................................... 43
3.5.3 Preparation of the research field .................................................................. 43
3.5.4 Pilot study .................................................................................................... 44
3.5.5 Validity of the instrument ............................................................................ 44
3.5.5.1 Content validity........................................................................................ 44
3.5.5.2 Face validity ............................................................................................. 45
3.5.5.3 Construct validity ..................................................................................... 46
3.5.6 Reliability of the instrument ........................................................................ 46
3.6. DATA MANAGENENT ............................................................................. 47
3.7. DATA ANALYSIS ..................................................................................... 48
3.7.1 Quantitative data analysis ............................................................................ 48
3.7.2 Qualitative data Analysis ............................................................................. 49
3.8. ETHICAL CONSIDERATIONS ................................................................ 49
3.8.1 Permission to conduct the research ............................................................. 49
3.8.2 Principles of respect of persons ................................................................... 50
3.8.3 Principle of beneficence .............................................................................. 50
3.8.4 Fair treatment/justice ................................................................................... 50
3.9. SUMMARY ................................................................................................ 50
CHAPTER 4 ............................................................................................................. 52
DATA ANALYSIS AND PRESENTATION OF FINDINGS .............................. 52
4.1. INTRODUCTION ....................................................................................... 52
4.2. OVERVIEW OF THE DATA COLLECTION AND ANALYSIS
PROCESS .................................................................................................................. 52
4.3. RESPONSE RATE ...................................................................................... 53
4.4. RESULTS FOR EACH OBJECTIVE ......................................................... 53
4.4.1 Objective 1 .................................................................................................. 53
4.4.2 Objective 2 .................................................................................................. 57
4.4.3 Objective 3 .................................................................................................. 73
4.4.4 Objective 4 .................................................................................................. 83
4.4.4.1 The analysis of the association of demographic factors .......................... 83
4.5. SUMMARY ................................................................................................ 93
CHAPTER 5 ............................................................................................................. 95
DISCUSSIONS, CONCLUSIONS, LIMITATIONS, RECOMMENDATIONS
AND CONTRIBUTIONS OF THE STUDY ......................................................... 95
5.1. INTRODUCTION ....................................................................................... 95
5.2. DISCUSSIONS ........................................................................................... 95
ix
5.2.1 Demographic factors (objective 1) .............................................................. 95
5.2.2 Associated factors (objective 2) .................................................................. 98
5.2.3 Opinions of the respondents (objective 3) ................................................. 101
5.2.4 Associations of the demographic data and correlations/ relationships of
variables of each associated factors (objective 4) ........................................ 105
5.3. CONCLUSIONS ....................................................................................... 109
5.4. LIMITATIONS ......................................................................................... 110
5.5. RECOMMENDATIONS .......................................................................... 111
5.5.1 Management .............................................................................................. 111
5.5.2 Education ................................................................................................... 112
5.5.3 Further research ......................................................................................... 113
5.6. CONTRIBUTIONS OF THE STUDY ...................................................... 114
5.7. SUMMARY .............................................................................................. 114

x
LIST OF ABREVIATIONS
MoHSS: Ministry of Health and Social Services
R/N: Registered nurse
BBC: British Broadcasting Corporation
E/N: Enrolled nurse
UNAM: University of Namibia
SPSS: Statistical package of social scientists
WHO: World Health Organisation
SA: South Africa
HRM: Human Resources Manager
xi
LIST OF TABLES
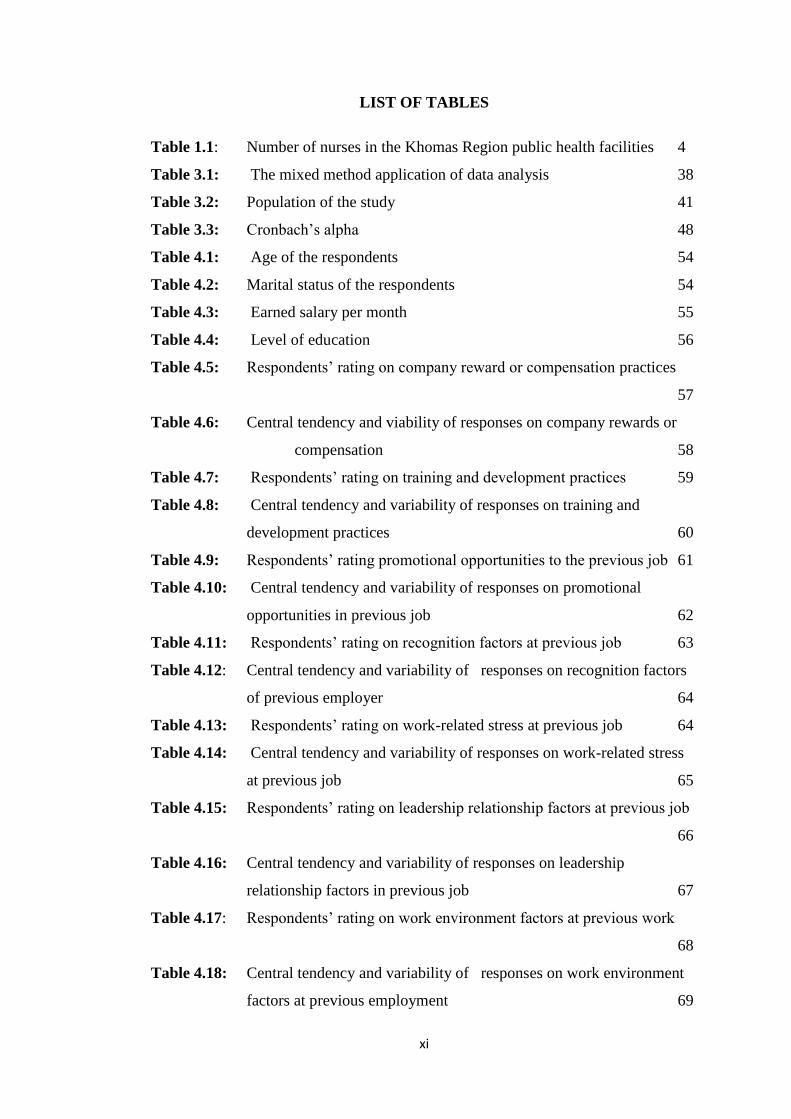
Table 1.1: Number of nurses in the Khomas Region public health facilities 4
Table 3.1: The mixed method application of data analysis 38
Table 3.2: Population of the study 41
Table 3.3: Cronbach’s alpha 48
Table 4.1: Age of the respondents 54
Table 4.2: Marital status of the respondents 54
Table 4.3: Earned salary per month 55
Table 4.4: Level of education 56
Table 4.5: Respondents’ rating on company reward or compensation practices
57
Table 4.6: Central tendency and viability of responses on company rewards or
compensation 58
Table 4.7: Respondents’ rating on training and development practices 59
Table 4.8: Central tendency and variability of responses on training and
development practices 60
Table 4.9: Respondents’ rating promotional opportunities to the previous job 61
Table 4.10: Central tendency and variability of responses on promotional
opportunities in previous job 62
Table 4.11: Respondents’ rating on recognition factors at previous job 63
Table 4.12: Central tendency and variability of responses on recognition factors
of previous employer 64
Table 4.13: Respondents’ rating on work-related stress at previous job 64
Table 4.14: Central tendency and variability of responses on work-related stress
at previous job 65
Table 4.15: Respondents’ rating on leadership relationship factors at previous job
66
Table 4.16: Central tendency and variability of responses on leadership
relationship factors in previous job 67
Table 4.17: Respondents’ rating on work environment factors at previous work
68
Table 4.18: Central tendency and variability of responses on work environment
factors at previous employment 69
xii
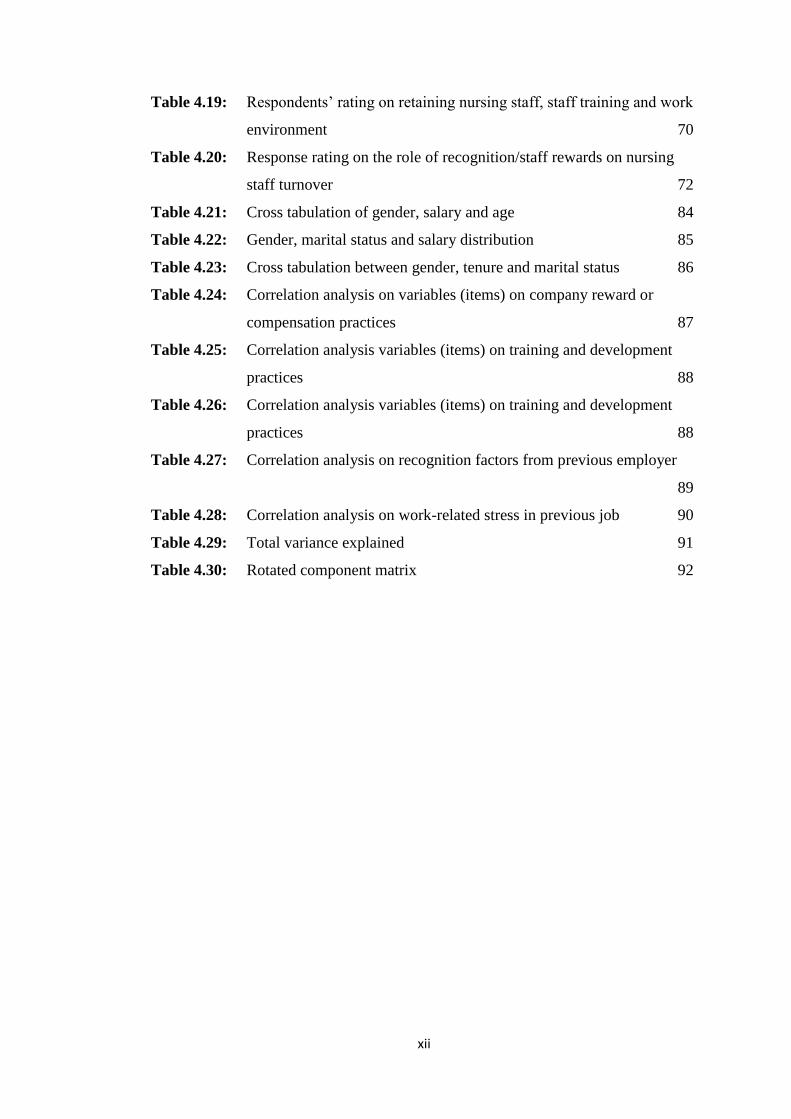
Table 4.19: Respondents’ rating on retaining nursing staff, staff training and work
environment 70
Table 4.20: Response rating on the role of recognition/staff rewards on nursing
staff turnover 72
Table 4.21: Cross tabulation of gender, salary and age 84
Table 4.22: Gender, marital status and salary distribution 85
Table 4.23: Cross tabulation between gender, tenure and marital status 86
Table 4.24: Correlation analysis on variables (items) on company reward or
compensation practices 87
Table 4.25: Correlation analysis variables (items) on training and development
practices 88
Table 4.26: Correlation analysis variables (items) on training and development
practices 88
Table 4.27: Correlation analysis on recognition factors from previous employer
89
Table 4.28: Correlation analysis on work-related stress in previous job 90
Table 4.29: Total variance explained 91
Table 4.30: Rotated component matrix 92
xiii
LIST OF FIGURES
Figure 1.1: The traditional turnover model 12
Figure 1.2: Herzberg hygiene and motivation factors. 14
Figure 1.3: Diagrammatical representation of conceptual framework 15
Figure4.1: Number of years worked in the position 56
Figure 4.2: Comments associated to primary document 74
Figure 4.3: Quotes on overtime 76
Figure 4.4: Quotes on promotion on merit 77
Figure 4.5: Quotes on recognition and reward practices 78
Figure 4.6: Quotes on skilled managers 80
Figure 4.7: Quotes on untaxed overtime 82
1
CHAPTER 1
INTRODUCTION AND BACKGROUND TO THE STUDY
1.1. INTRODUCTION
Turnover of nurses has become a critical concern globally because it erodes and
cripples the effective operations of health systems (Stanz & Greyling, 2010; Simon,
2014; World Health Organisation, 2006). Despite its centrality to a country’s nursing
shortages, scholars have given little focus on turnover among nurses (Meier &
Hicklin, 2007; Selden & Moynihan, 2000). The case of Namibia nursing staff
turnover is no exception. Nursing staff turnover remains a financial concern to public
as well as private institutions, and it has an impact on staff morale and working
practices.
Further, staff turnover could also have detrimental effects on patient care. In a
practical sense, nursing turnover has impacted on stakeholders’ welfare, which
includes reduced quality of patient care, increased contingent staff costs, and loss of
patients (Huston & Marquis, 2003). However, staff shortages caused by nurse
turnover are associated with significant decreases in the overall quality of patient
care, increases in the length of patient stays in hospital, and greater numbers of
hospital-acquired patient illnesses and conditions that do not qualify for
medicare/medical aid reimbursement. Studies have examined the reasons why nurses
leave their jobs, but these have often produced conflicting findings and have
frequently relied upon findings from bivariate correlation or multiple regression
techniques (Benedict, Josiah, Ogungbenle, & Akpeti, 2012).
2
The health of a community is a major concern for any government. The staff
complement of health care workers goes a long way in determining the quality of
service that any health institution can deliver. Jones (as cited in Dasgupta &
Agarwal, 2014), defines nurse turnover as the process by which nurses leave or
transfer within a public health care system. It is generally viewed as the movement of
staff out of an organisation (Hunt, 2009). According to Dasgupta and Agarwal
(2014), although the definition of turnover varies according to different literature,
employee turnover is defined as the ratio of the number of workers that need to be
replaced in a given period of time, to the average number of workers.
Although the issue of high nurse turnover has been a topic of research in various
countries, there is little literature on the challenge in Namibia, especially in the
Khomas Region’s public health care system. Haoses-Gorases, Jonas and Kapaama
(2014) focused on the problem of high nurse turnover in Namibia in terms of how it
affects the whole country, and its concomitant effects on service delivery.
This chapter presents the introduction of the study, background to the problem and
the significance of the study. The aims, objectives, problem statements, research
questions, and assumptions underpinning the study, are also presented. The structure
of the study is included in this chapter.
1.2. BACKGROUND TO THE PROBLEM
There are two public hospitals: in the Khomas region of Namibia namely Katutura
State Hospital and Windhoek Central Hospital. In addition, during the study period
2010 to 2015 there were eight state functioning clinics in the Khomas Region:
Khomasdal, Wanaheda, Okuryangava, Robert Mugabe, Hakahana, Otjomuise,
3
Donkerhoek, Grootaub, and the Katutura Health Centre. In all of these health
facilities, high nurse turnover has been a major concern.
Retention of nursing staff is important for successful health care operations.
According to Das and Baruah (2013), staff retention is a key factor for the success of
an organisation. The health of a community is of essence for any government; the
staff complement of health care workers largely determines the quality of service that
a health institution can deliver. Nurse workforce in sub-Saharan Africa is a crucial
component of its health workforce. Blaauw (2014) reported that in terms of intending
to leave their current job, only 18.8% of health workers in Tanzania, and 26.5% in
Malawi, indicated that they were actively seeking employment elsewhere, compared
to 41.4% in South Africa. These statistics indicate the magnitude of this challenge
Namibia is no exception as it is experiencing a high turnover of nurses who move
from public health facilities to the private health care sector. The gap left by the
departure of the nurses creates a vacuum that normally would not be immediately
filled. This has a negative impact on service delivery in public health facilities.
According to the Ministry of Health and Social Services (MoHSS), the 2008 Health
and Social Services System Review Report indicated that the public sector has 2.0
health workers per 100 000 population, which is below the World Health
Organisation (WHO) benchmark of staff (nurse) to patient ratio of 2.5 per 100 000
patients (Namibia, 2014), Also according to Namibian auditor-general (2009), the
percentage of vacant posts indicates high turnover of nurses, which stood at 15%and
18%, respectively compared to optimum turnover rate which is 5-10% per annum
(Booyens, 2004). Compared to some countries in the region, from 2004 to 2009 there
were 155 484 nurses practising in South Africa at a rate of 437 nurses per 100 000 of
4
the population, which compares favourably with the WHO minimum of 200:100 000
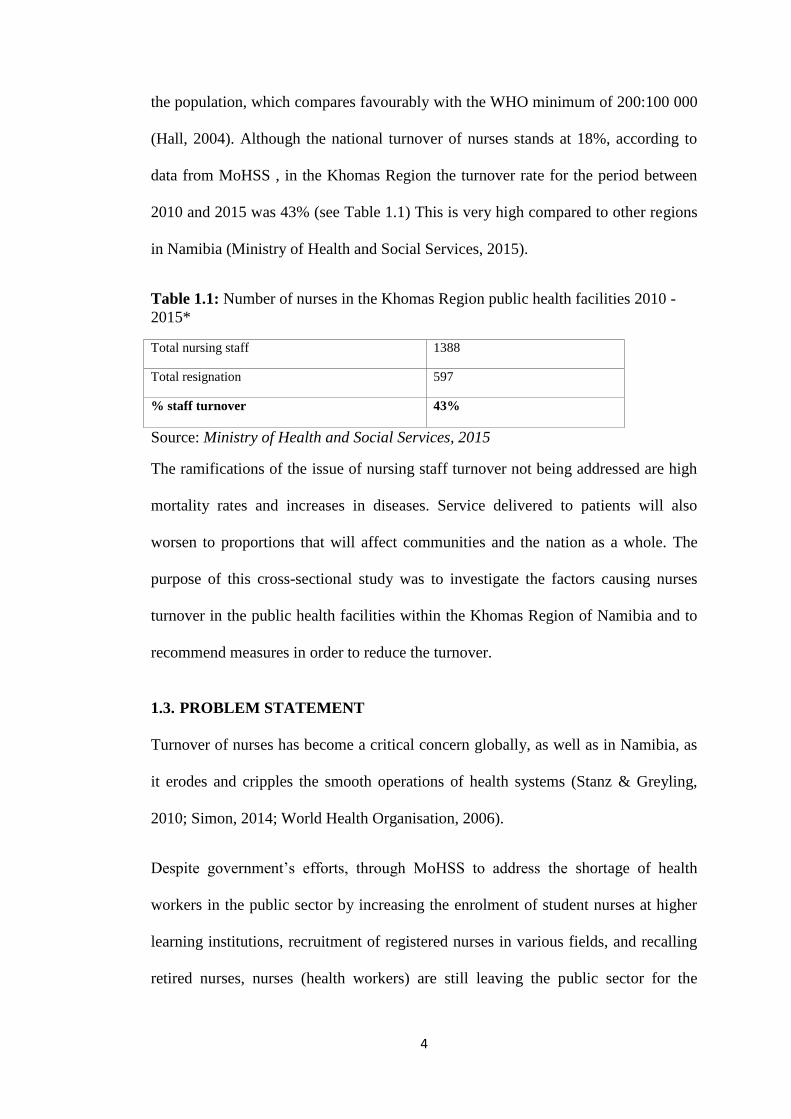
(Hall, 2004). Although the national turnover of nurses stands at 18%, according to
data from MoHSS , in the Khomas Region the turnover rate for the period between
2010 and 2015 was 43% (see Table 1.1) This is very high compared to other regions
in Namibia (Ministry of Health and Social Services, 2015).
Table 1.1: Number of nurses in the Khomas Region public health facilities 2010 -
2015*
Total nursing staff 1388
Total resignation 597
% staff turnover 43%
Source: Ministry of Health and Social Services, 2015
The ramifications of the issue of nursing staff turnover not being addressed are high
mortality rates and increases in diseases. Service delivered to patients will also
worsen to proportions that will affect communities and the nation as a whole. The
purpose of this cross-sectional study was to investigate the factors causing nurses
turnover in the public health facilities within the Khomas Region of Namibia and to
recommend measures in order to reduce the turnover.
1.3. PROBLEM STATEMENT
Turnover of nurses has become a critical concern globally, as well as in Namibia, as
it erodes and cripples the smooth operations of health systems (Stanz & Greyling,
2010; Simon, 2014; World Health Organisation, 2006).
Despite government’s efforts, through MoHSS to address the shortage of health
workers in the public sector by increasing the enrolment of student nurses at higher
learning institutions, recruitment of registered nurses in various fields, and recalling
retired nurses, nurses (health workers) are still leaving the public sector for the
5
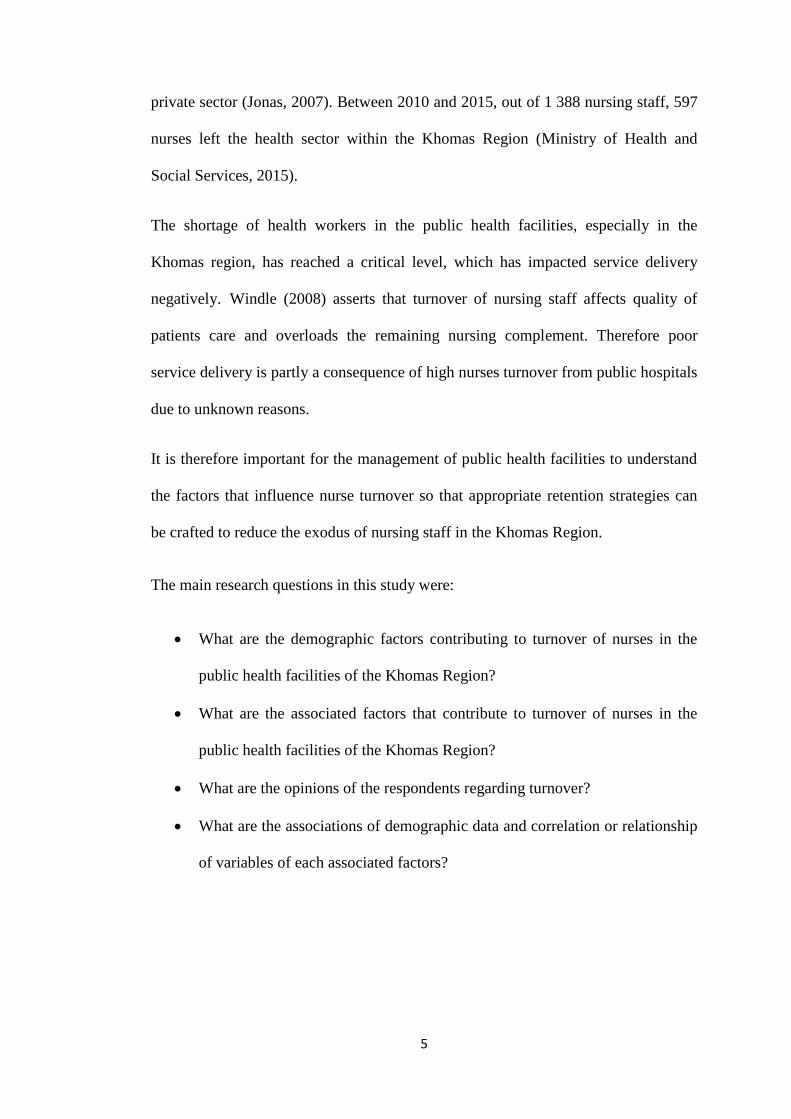
private sector (Jonas, 2007). Between 2010 and 2015, out of 1 388 nursing staff, 597
nurses left the health sector within the Khomas Region (Ministry of Health and
Social Services, 2015).
The shortage of health workers in the public health facilities, especially in the
Khomas region, has reached a critical level, which has impacted service delivery
negatively. Windle (2008) asserts that turnover of nursing staff affects quality of
patients care and overloads the remaining nursing complement. Therefore poor
service delivery is partly a consequence of high nurses turnover from public hospitals
due to unknown reasons.
It is therefore important for the management of public health facilities to understand
the factors that influence nurse turnover so that appropriate retention strategies can
be crafted to reduce the exodus of nursing staff in the Khomas Region.
The main research questions in this study were:
What are the demographic factors contributing to turnover of nurses in the
public health facilities of the Khomas Region?
What are the associated factors that contribute to turnover of nurses in the
public health facilities of the Khomas Region?
What are the opinions of the respondents regarding turnover?
What are the associations of demographic data and correlation or relationship
of variables of each associated factors?
6
1.4. PURPOSE OF THE STUDY
The aim of this study was to determine the factors associated with turnover among
nurses in public health facilities in the Khomas Region of Namibia.
1.5. OBJECTIVES OF THE STUDY
There were four objectives in this study to:
Determine the demographic factors that contribute to turnover of nurses in the
public health facilities in the Khomas Region.
Determine the associated factors that contribute to turnover of nurses in the
public health facilities in the Khomas Region.
Describe opinions of the respondents regarding turnover.
Analyse the association of demographic data and the correlation/relationship
of variables of each associated factor.
1.6. SIGNIFICANCE OF THE STUDY
The study could provide useful information on the factors that public health
management should address to curb the exodus of nurses from the sector. The
findings of this study could inform and assist policy-makers and healthcare centre
management on improvement initiatives, as well as form a basis for future
assessments to retain nursing staff. In addition, it contributes to the body of
knowledge and literature relating to nurse turnover, especially in public health
facilities of the Khomas Region. The study could also provide a base line for other
researchers relating to the turnover of nurses.
1.7. LIMITATIONS
Time was a major limiting factor due to workload for some nurses to participate in
the study citing other commitments. Obtaining a sample size representative of the
7
population in question was therefore difficult. The researcher had to extend time by
an extra two weeks to enable respondents to complete the questionnaire when it was
convenient. Another limitation was reaching respondents because most of them had
moved out of the region under study. To overcome this, researcher employed
triangulation of data collection methods. Apart from sourcing information of nurses
who had resigned from the public health facilities human resources department, the
researcher also obtained information from the Nurses Council of Namibia.
1.8. DELIMITATIONS
This study focused on nursing staff turnover within the Khomas Region only. The
findings of the study therefore cannot be generalised to other regions within
Namibia.
1.9. PARADIGMATIC PERSPECTIVES
Henning, Van Ransburg and Smith (2004) define a paradigm as a theory or
hypothesis. The former is a framework within which theories are built, that
essentially influences how one sees the world, determines one’s perspective, and
shapes one’s understanding of how things are connected. A research paradigm is a
set of beliefs, under which a research is based. Paradigm perspectives influence the
way a research is designed, how data are to be collected and analysed, and how the
research results are presented and disseminated. Since paradigms represent belief
systems that guide a researcher, this study employed the perspectives of the
respondents to help share the understanding of how factors affecting turnover are
shaped. Considered in this study were meta-theoretical assumptions, theoretical
assumptions as a basis for the study, and definition of concepts.
8
2.5.1 Meta- theoretical assumptions
The meta-theoretical assumptions for this study were ontological, epistemological,
axiological, methodological, and rhetorical. Each is described below.
1.9.1.1 Ontological assumption
This philosophy relates to different perspectives from which the nature of the world
can be seen by an individual, which in normative emphasises that social phenomenon
is different from other factors (Bryman as cited in Rahmawati, 2008). Ontology is a
system of beliefs that reflects an interpretation on an individual about what
constitutes an act. This has been the basis for the selection of the mixed research
method in order to able to bring in the positivism and interpretivist. In this study the
researcher used a structured closed and opened-ended questionnaire to obtain
quantitative and qualitative data (see Chapter 3 Table 3.1).
1.9.1.2 Epistemology assumption
Epistemology relates to how knowledge can be recognized, developed or
acknowledged (Mkansi & Acheampong, 2012). This philosophy considers
alternative ways of approaching research (Khin & Heng 2012). Epistemology may be
objective or subjective. The former recognises the outside world, which is
hypothetical and impartial, while the latter being subjective suggests that the outside
world is in the realm of clarifications from reflection (Eriksson & Kovalainen, 2008).
Through the use of epistemology the researcher was able to verify concepts
quantitatively by measuring a large sample, as well as qualitatively by use of in-
depth broad questions. This allowed for generation of valid findings to approximate
reality as closely as possible. The researcher tried to obtain the truth by relying on
9
the accounts of the respondents, and respected the views of the respondents as valid
data (Tshilongamulenzhe, 2012). Epistemology relates to how things can be known;
how truth or facts, if they do exist, can be discovered and disclosed. Through the
generalisation of findings from the questionnaires, it was revealed by both
quantitative and qualitative approaches that low salaries in former places of
employment in public facilities, is responsible for turnover for the majority of the
respondents.
1.9.1.3 Axiology assumption
Axiology has to do with values. For the pragmatic worldview, values play a
significant role in the interpretation of the results according to Wagner et al. (2012).
It primarily refers to the aims of a research and tries to clarify if one is trying to
explain or predict the world, or seeking to understand it. Since this study used a
mixed approach, axiology was employed as to how values play a crucial role in
interpreting results; the researcher also adopted both objective and subjective points
of view (Dudovskiy, 2016). In this study as the researcher tried to understand nurses’
turnover in the Khomas Region, this was undertaken in a value-free objective way
and subjectively through the use of quantitative research. Both objective and
subjective points of view were adopted by means of a mixed method during data
analysis and interpretations of the results for part 1 and 2 (quantitative analysis), and
part 3 (qualitative data analysis) as illustrated in Annexure F. This was done to
prevent possible bias and errors.
1.9.1.4 Methodological assumption
Methodological assumption focuses on analysis of the methods used for gaining the
data (Cohen, Manion & Morrison, 2012). In normative paradigms, a quantitative
10
scientific method is used to observe objects. It uses a mathematical calculation to
generalise findings and to test theory. In contrast, an interpretive paradigm uses
observation and fieldwork notes to investigate an object. An interpretive paradigm
tends to use qualitative methods for observation. As a result, the findings can be open
to many interpretations. On the other hand, methodology in critical theory tends to
use both quantitative and qualitative approaches. It uses a quantitative approach to
control the social setting when doing actions, and a qualitative approach to observe
the changes that happened after the actions are given.
This study relied on people as its unit of analysis. A mixed research method
incorporating both qualitative and quantitative analyses of contrasts and concepts
was used as described in methodological assumption (Tshilongamulenzhe, 2012). As
stated above a three part closed and open-ended questionnaire was used as the
research tool. The open-ended qualitative data were analysed (see. Table 3.1).
1.9.1.5 Rhetorical assumption
Rhetorical assumption refers to the persuasive language of research (Gone, 2009).
According to Peterson (2014), in quantitative research the language is formal while
in qualitative research it is less informal. In the study this meant using rhetorical
assumption that increased the reliability and validity of results because issues that
cannot be addressed with questionnaires can be addressed with qualitative data
collection and vice versa. In this study the researcher applied rhetorical approaches to
explore and describe the qualitative research results for part 3 since the respondents
were given opportunity to express their opinions regarding turnover (see Annexure F
Part 3).
11
1.9.2 Theoretical research as a basis for the study
In this study, the researcher used two theories: the traditional turnover model, and
Herzberg motivational model. These, as well as a conceptual framework, are
described below.
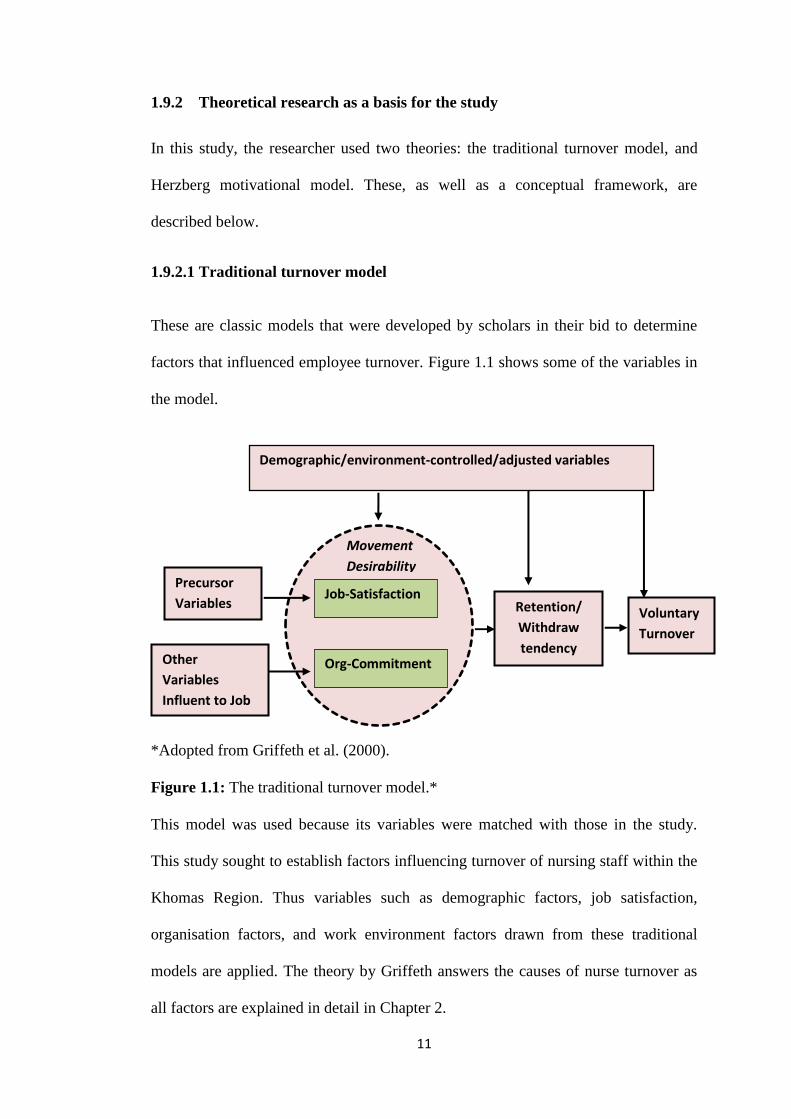
1.9.2.1 Traditional turnover model
These are classic models that were developed by scholars in their bid to determine
factors that influenced employee turnover. Figure 1.1 shows some of the variables in
the model.
*Adopted from Griffeth et al. (2000).
Figure 1.1: The traditional turnover model.*
This model was used because its variables were matched with those in the study.
This study sought to establish factors influencing turnover of nursing staff within the
Khomas Region. Thus variables such as demographic factors, job satisfaction,
organisation factors, and work environment factors drawn from these traditional
models are applied. The theory by Griffeth answers the causes of nurse turnover as
all factors are explained in detail in Chapter 2.
Demographic/environment-controlled/adjusted variables
Precursor
Variables
Other
Variables
Influent to Job
attitude
Retention/
Withdraw
tendency
Voluntary
Turnover
Movement
Desirability
Job-Satisfaction
Org-Commitment
12
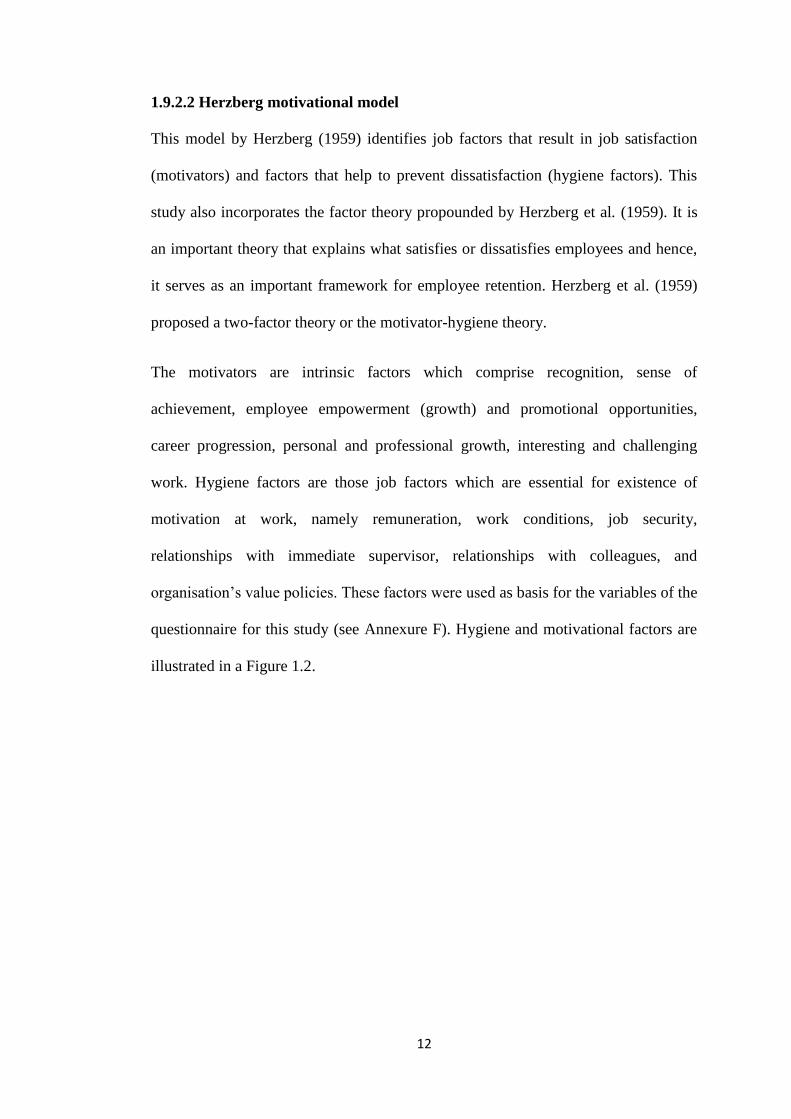
1.9.2.2 Herzberg motivational model
This model by Herzberg (1959) identifies job factors that result in job satisfaction
(motivators) and factors that help to prevent dissatisfaction (hygiene factors). This
study also incorporates the factor theory propounded by Herzberg et al. (1959). It is
an important theory that explains what satisfies or dissatisfies employees and hence,
it serves as an important framework for employee retention. Herzberg et al. (1959)
proposed a two-factor theory or the motivator-hygiene theory.
The motivators are intrinsic factors which comprise recognition, sense of
achievement, employee empowerment (growth) and promotional opportunities,
career progression, personal and professional growth, interesting and challenging
work. Hygiene factors are those job factors which are essential for existence of
motivation at work, namely remuneration, work conditions, job security,
relationships with immediate supervisor, relationships with colleagues, and
organisation’s value policies. These factors were used as basis for the variables of the
questionnaire for this study (see Annexure F). Hygiene and motivational factors are
illustrated in a Figure 1.2.
13
Figure 2.2: Herzberg hygiene and motivation factors.
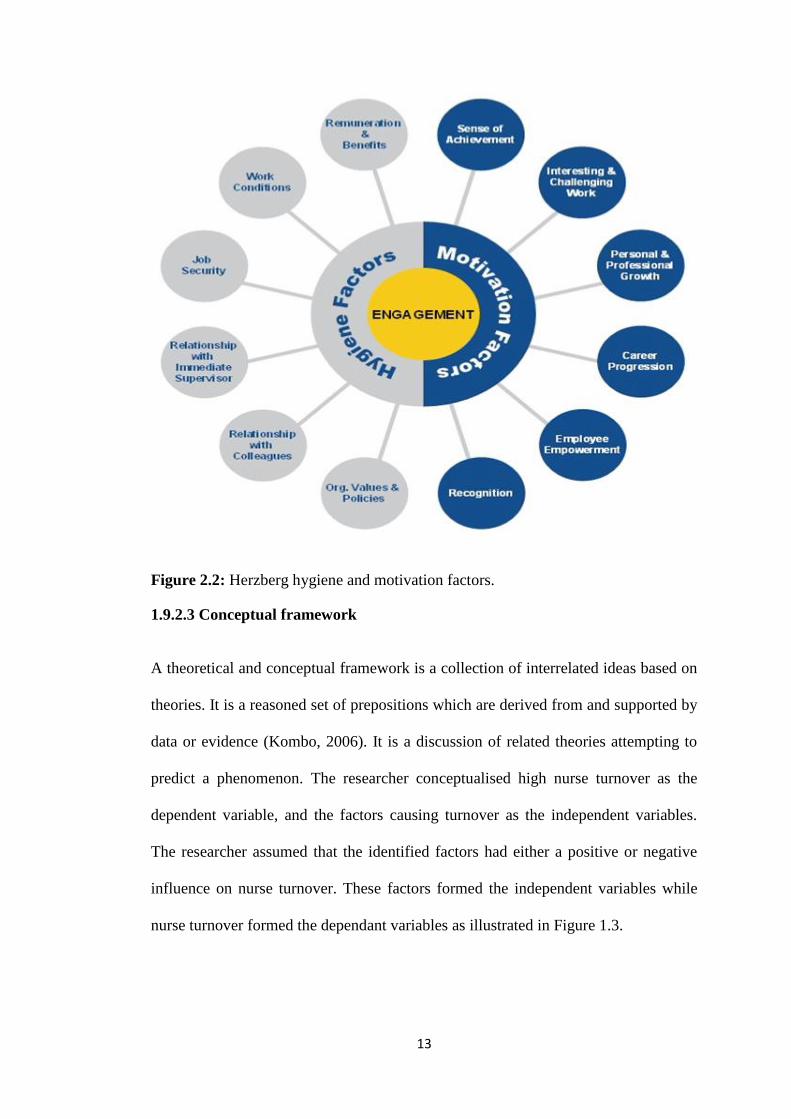
1.9.2.3 Conceptual framework
A theoretical and conceptual framework is a collection of interrelated ideas based on
theories. It is a reasoned set of prepositions which are derived from and supported by
data or evidence (Kombo, 2006). It is a discussion of related theories attempting to
predict a phenomenon. The researcher conceptualised high nurse turnover as the
dependent variable, and the factors causing turnover as the independent variables.
The researcher assumed that the identified factors had either a positive or negative
influence on nurse turnover. These factors formed the independent variables while
nurse turnover formed the dependant variables as illustrated in Figure 1.3.
14
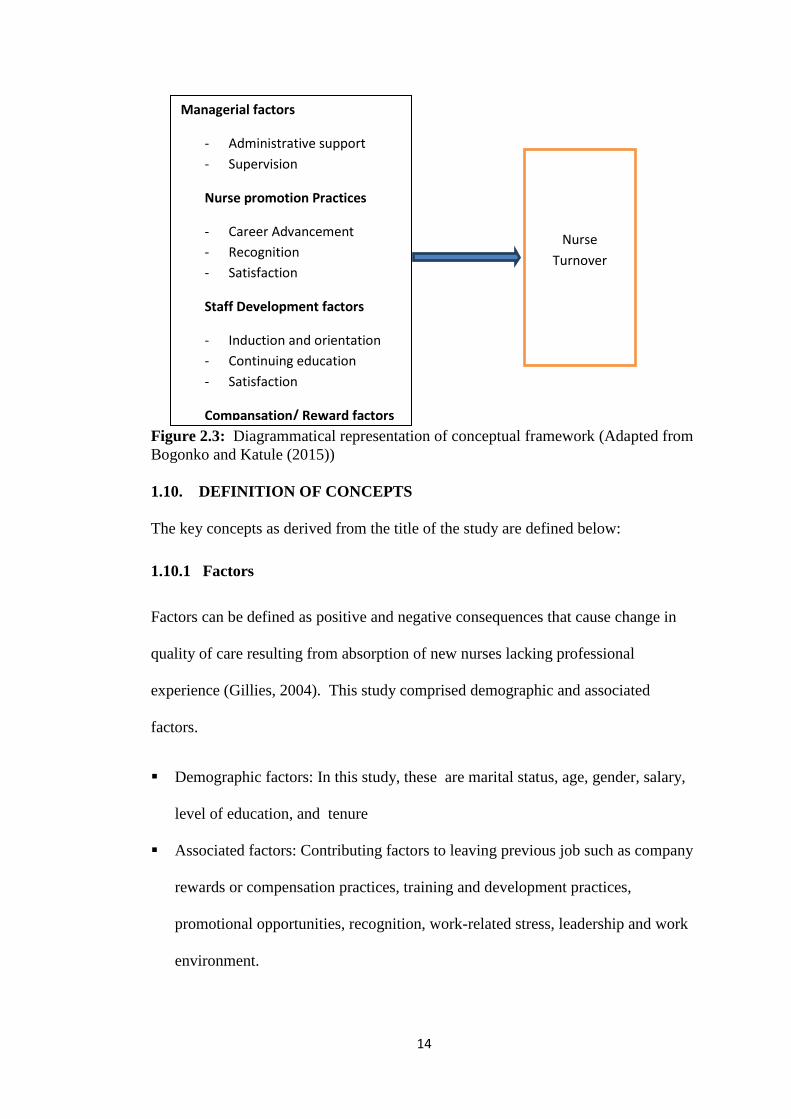
Figure 2.3: Diagrammatical representation of conceptual framework (Adapted from
Bogonko and Katule (2015))
1.10. DEFINITION OF CONCEPTS
The key concepts as derived from the title of the study are defined below:
1.10.1 Factors
Factors can be defined as positive and negative consequences that cause change in
quality of care resulting from absorption of new nurses lacking professional
experience (Gillies, 2004). This study comprised demographic and associated
factors.
Demographic factors: In this study, these are marital status, age, gender, salary,
level of education, and tenure
Associated factors: Contributing factors to leaving previous job such as company
rewards or compensation practices, training and development practices,
promotional opportunities, recognition, work-related stress, leadership and work
environment.
Managerial factors
- Administrative support
- Supervision
Nurse promotion Practices
- Career Advancement
- Recognition
- Satisfaction
Staff Development factors
- Induction and orientation
- Continuing education
- Satisfaction
Compansation/ Reward factors
Nurse
Turnover
15
1.10.2 Turnover
Turnover is the movement of personnel from one unit to another within or between
organisations such as hospitals and community health centres or between a public
and private hospital (Carmeli, 2003). In this study, turnover was defined as the
frequent movement of nurses from public health facilities of the Khomas region.
1.10.3 Nurses
According to International Council of Nurses, a nurse plays an integral part in the
health care system, encompasses the promotion of health, prevent illness, and care
for physically ill, mentally ill and disabled people of all ages, in health care and other
community settings. In this study, nurse refers to registered and enrolled, nurses who
had resigned from the public health facilities in the Khomas region. These nurses are
all licenced to practice by the Nursing Council of Namibia.
1.10.4 Public health facilities
Public health facilities are an organised system of health centres run by the national
government to serve the community. Public health facilities are committed to
maintain, protect and improve the health and wellbeing of citizens (Hayes, 2006). In
this study, public health facilities refer to Katutura State Hospital, Windhoek Central
Hospital, eight clinics namely, Khomasdal, Wanaheda, Okuryangava, Robert
Mugabe, Hakahana, Otjomuise, Donkerhoek, Grootaub, and Katutura Health Centre
in the Khomas Region.
16
1.11. OUTLINE OF CHAPTERS
The study report us composed of five chapters, as outlined below.
Chapter 1: This chapter focuses on the introduction and background to the study
which introduces the topic under study. It provides the background and research
problem statement that justifies the study as well as the significance, limitations and
delimitations of the study.
Chapter 2: This chapter reviews the literature, which is later linked to the
research problem, and the research instrument. The purpose of this chapter is to draw
upon any previous research in the same subject and to analyse its conclusions, and
identify research gaps.
Chapter 3: This chapter presents the research methodology used in the study.
This includes definition of the target group, sample design, data collection, validity
and reliability and ethical considerations.
Chapter 4: This chapter describes the procedure of data collection, data analysis,
and the research findings.
Chapter 5: This chapter presents the discussion of the findings, conclusion,
limitations, recommendations, and contribution to the body of knowledge of the
study. It summarises the research findings and links them to different literature to
answer the research objectives. Recommendations are made, based on the research
findings.
1.12. SUMMARY
This chapter introduced the research topic and the background of the research
problem. In addition the chapter highlighted the problem that motivated the
researcher to investigate the factors that influenced nursing turnover within the

17
public health facilities. Research questions and research objectives were articulated.
The chapter also highlighted the significance of the study and limitations
encountered by the researcher. Finally, important terms of the research were defined.
The following chapter presents review of relevant literature within the context of the
study.
18
CHAPTER 2
LITERATURE REVIEW
2.1. INTRODUCTION
This chapter covers the literature pertaining to nursing staff turnover. According to
Mugenda and Mugenda (cited in Bogonko & Kathure, 2015), the purpose of
literature review is to help a researcher to demonstrates a researcher’s familiarity
with the existing body of knowledge and to avoid unnecessary and unintentional
duplication of work. In addition it forms a basis within which research findings are to
be interpreted. This chapter reviews literature related to the study and the models on
turnover. It discusses types of turnover among nurses, Hertzberg’s theory, factors
associated with turnover, job satisfaction, organisational commitment, effects of staff
turnover, and strategies to reduce staff turnover. A comparative study on turnover in
nursing is also discussed. The review linked to the study objectives such as to:
To determine the demographic factors that contributes to turnover of nurses
in the public health facilities in the Khomas Region.
To determine the associated factors that contributes to turnover of nurses in
the public health facilities in the Khomas Region.
To describe opinions of the respondents regarding turnover.
To analyse the association of demographic data and correlation/relationship
of variables of each associated factor.
2.2. GENERAL BACKGROUND OF TURNOVER
Many authors have defined the term turnover in different ways. Mathis and Jackson
(2007) define staff turnover as employees who retire, who are laid off, who resign or
are discharged. Mohamad (2006) defines turnover as an employee’s own intention or
19
probability that he or she has a conscious and deliberate intent/desire to permanently
leave an organisation at some point in the near future. Baumann (2010) defines it as
the quantity of a population that leaves an organisation within a specific period.
According to Carmeli (2003) turnover is the cessation of membership by an
individual who received a monetary compensation from an organisation. These
respective definitions, although different, centre on an individual who terminates his
or her services with the organisation. The researcher found the definition advanced
by Carmeli (2003) to be appropriate for this study since the focus is on nurses who
have delinked with the public health facilities they worked for.
2.3. TURNOVER AMONG NURSES
Turnover among nurses is a complex problem requiring a multi-faceted solution
(Brewer, Kovner, Greene, Tukov-Shuser, & Djukic, 2012). The potential cost to a
health care system due to turnover among nurses has ramifications, which includes
temporary staffing, training, recruitment, and hiring (O’Brian-Pallas, Murphy,
Shamian, Li & Hayes, 2010). If hospital staffing levels are unstable, there is a
resultant reduction in unit capacity, which may in turn negatively influence the
quality of care that is provided (O’Brian-Pallas et al., 2010).
Interest in staffing and potential turnover is not a new phenomenon. The causal
model of turnover, developed by Price and Mueller (1981), mapped how the
determinants of opportunity, routinisation, participation, instrumental
communication, integration, pay, distributive justice, promotional opportunity,
professionalism, general training, and kinship relate to produce turnover. With
continued research on the causal model, they found that intent to stay was significant
in explaining variation in turnover among the participants (Price & Mueller, 1981).
20
Significant direct effects include intent to stay, opportunity, and general training.
Significant indirect effects include job satisfaction, routinisation, participation, and
instrumental communication, pay, promotional opportunity, and kinship
responsibility, amount of time worked, age, and length of service (Price & Mueller,
1981).
2.4. THEORETICAL AND CONCEPTUAL FRAMEWORK
Theoretical and conceptual framework is a collection of interrelated ideas based on
theories. It is a reasoned set of prepositions that are derived from and supported by
data or evidence (Kombo, 2006). It is a discussion of related theories attempting to
predict a phenomenon. The researcher conceptualised high nurse turnover as the
dependent variable and the factors causing turnover as the independent variables.
The researcher assumed that the identified factors had either a positive or negative
influence on nurse turnover. These factors were used to form the independent
variables while nurse turnover formed the dependant variables.
The study considered two frameworks of factor theories by which cover employee
turnover retention and a traditional model by that looks at the causes of employees’
turnover. These frameworks helped to analyse different situations where much of the
literature is on nurse turnover in public institutions.
2.4.1 Herzberg motivational model
This is a motivational model by Herzberg(1959) that identifies job factors that result
in job satisfaction (motivators), and factors that help to prevent dissatisfaction
(hygiene factors). The motivators are intrinsic factors and are part of job content
administered by an employee, such as recognition, promotional opportunities and
21
responsibility. Hygiene factors involve issues such as pay, benefits, status, job
security and working conditions.
The factor theory propounded by Hezberg et al. (1959); explains what satisfies or
dissatisfies employees thus serves as an important framework for employee retention.
Herzberg et al. (1959) proposed a two-factor theory or the motivator-hygiene theory.
According to this theory, there are some job factors that result in satisfaction while
other job factors prevent dissatisfaction. Hezberg (1959) identified pay or salary
structure as hygiene factor that has to be appropriate and reasonable.
2.4.2 Traditional model
Griffeth and Hom (2001) describe different types of employee turnover. Turnover
can be categorized as involuntary or voluntary (Gillies, 2004; Hayes et al., 2006;
Mara, 2010). Involuntary turnover, according to Griffeth and Hom (2001), refers to
employer-initiated job terminations: dismissals or layoffs, for example. According to
Mathis and Jackson (2007), staff turnover includes “employees who retire and
employees who are laid off, who quit or who are discharged. It also includes those
who are boarded or die”. This definition is very wide thus for the purpose of this
study there is a need for specificity to align the type of turnover in this study. For
Griffeth and Hom (2001) employer-initiated job termination is involuntary turnover
that could be dismissals or layoffs. For example, such turnover is initiated by an
employer and could be contributed to poor job performance, misconduct, incapacity
or retirement. Allen (2000) makes a distinction between staff turnover and is of the
opinion that involuntary turnover generally occurs for reasons which are independent
of the concerned employee: when organisations incur losses or unavoidable
expenses, and perceive the need to cut costs, re-structure or downsize, for example.
22
Voluntary turnover on the other hand refers to an employee’s chosen exit from an
organisation. Voluntary turnover is prompted and executed not by an individual and
not by an employer. Allen (2000) states that voluntary turnover represents a worker’s
poor chosen exit from an organisation, for example, retirement at an employer’s
request, or due to remuneration due including job dissatisfaction. McCooey and
Dawn (2010) contend that it is best to focus on voluntary separations when
addressing turnover from an organisation.
According to Khoele (2014), voluntary turnover can also be classified as functional
or dysfunctional. According to Khoele (2014), the former “is favourable for the
organisation, for example, when a poor performer resigns” but the latter “is
detrimental to the organisation for example a departure of a productive worker.”
Griffeth and Hom (2001) also refer to dysfunctional turnover as being “the type of
resignations that disadvantage employers.” Abelson (1987), as cited by Griffeth and
Hom (2001), provided more clarity on dysfunctional turnover that dysfunctional exits
can further be devided into avoidable and unavoidable quits. Griffeth and Hom
(2001) contend that unavoidable turnover refers to leaving an organisation due to
uncontrollable circumstances such as family relocations or disabilities. Turnover is
avoidable when an organisation has the ability to retain staff but fails to have control
satisfying their job or career needs (Griffeth & Hom, 2001). Examples of avoidable
turnover might include poor pay scales or lack of opportunities to advance.
2.5. FACTORS ASSOCIATED WITH STAFF TURNOVER
There have been a myriad of studies conducted on factors that affect staff turnover.
In view of an emotional element involved in one individual or another, there had
been no specific reasons cited for leaving an organisation. Nursing turnover can be
23
seen to have both positive and negative consequences. Studies have shown such
negative outcomes as: diminished quality of care resulting from the absorption of
new nurses lacking professional experience; increased costs and economic losses for
the healthcare system (training and absorption costs); staff burnout; and decreased
job satisfaction.
The occurrence of high turnover can be understood vis-à-vis several indirectly
related factors. These are mainly organisational characteristics such as work
overload, management and leadership characteristics, relationship with physicians,
decision-making ability, empowerment and autonomy. The World Health
Organisation’s report on Evidence and information for policy health service
provision indicates that there are several determinants associated with turnover:
socio-psychological factors such as gender, having young children, transition due to
spousal job relocation, improvement in quality of life, professional factors (a desire
to learn and advance in the nursing profession) and economic factors (higher salary
and improved working conditions and other benefits, amongst others).
The next session present detailed explanation of the factors associated with staff
turnover.
2.5.1 Demographic factors
Law Dictionary (n.d.) defines demographic factors as characteristics assigned to age,
sex, education, income, marital status, job, religion, birth rate, death rate, family size,
and marriage. In studies undertaken in the United States (US) at different times, the
national turnover rate for hospital nurses was 12% in 1996, 15% in 1999, and 26.2%
in 2000. In the study done specifically in north central West Virginia, job satisfaction
24
significantly correlated with context, structure, and attitude variables even though
age was not correlated with job satisfaction.
2.5.1.1 Marital status
In a study conducted in Kuwait to assess nurse job satisfaction they found a
significant positive relationship between job satisfaction and marital status.
2.5.1.2 Educational qualification
A high level of education qualification shows an inverse relationship with job
satisfaction (Cowin, 2002). Therefore, other studies indicated younger nurses with
less work experience, lower professional titles, and lower working positions
experienced lower levels of emotional exhaustion that are positively related to job
satisfaction and negatively to intention to turnover. However, Buchan (2004) holds a
different point of view, that registered nurses (RNs) with more years of experience
had the highest job satisfaction, lowest burnout, and were less likely to leave.
2.5.1.3 Age
Age of a worker was also considered as one of the influencing factor for staff
turnover. In a study done in China, for 20 to 30-year-old nurses, work satisfaction
and job stress were the significant predictors of anticipated turnover. For the 31to 40-
year-old nurses, work satisfaction was predictive of anticipated turnover and for the
41to 50-year-old nurses, work satisfaction and group cohesion were predictive of
anticipated turnover (Wang, Tao, Ellenbecker & Liu, 2012). A study done in Jordan
revealed that nurses who were 51 years or older were not significant predictors of
turnover whereas younger nurses (21 to 35-year olds) were more likely to leave than
older nurses (aged over 35 years old) (Mohammed 2017). This finding is in line with
previous studies conducted in Ethiopia, China, and (SA) (Engeda, Birhanu & Alene,
25
2014, Wang, Tao, Ellenbecker & Liu, 2012, Delobelle, Rawlinson, Ntuli, Malatsi,
Decock & Depoorter, 2011). One possible explanation for this finding might be that
older nurses have more of a desire for stability as they approach their retirement
because the prospect of a retirement income is important to improving their quality
of life. Also nurses over 35 years of age are more likely to have a family and
therefore job stability is important.
2.5.1.4 Gender
A study conducted by Oulton (2006), indicated that nursing is one of the numerous
professions in which females comprises the clear majority of workers and that gender
difference is as a factor for job satisfaction and nurse turnover. The study highlighted
that more male than female nurses cited better salaries as their reasons for leaving
their place of employment. On the other hand 32.6% of female nurses and 63.6% of
male nurses found their current position more rewarding professionally. The findings
of a study conducted in (SA) were that female nurses were generally more satisfied
with resources than their male colleagues, but no statistically significant and overall
gender differences in intention to leave were noted (Rambur, Mclntosh, Palumbo &
Reinier, 2003).
2.5.2 Employee promotion practices
Limited opportunities for internal promotion and career advancement have been
reported to impact employees’ attitudes and behaviours (Price, 2001, Samad, 2006).
Promotional chances refer to the degree of potential upward occupational mobility
within an organisation. Rewards exhibited higher job affection, displayed greater
organisational commitment, and experienced lower turnover intentions (Aryee et al.,
2001; Khatri et al., 2001; Samad, 2006). Abeysekera (2007) found that besides
promotion opportunities, the evaluation criteria used in the promotion and reward
26
system also had significant effects on employees’ turnover intentions. Employee
promotional chances typically foster an employee’s behavioural commitment by
encouraging internal careers, thereby guaranteeing job security and other favourable
future rewards such as improved income, power and status to the employees.
Sullivan and Decker (2005) found that today’s nurses want to have challenging
careers that offer opportunities for growth and advancement. Yin and Yang’s (2002)
meta-analysis reported that the strongest organisational factors related to nurse
turnover intentions, were lack of internal promotion and career advancement
opportunity.
Armstrong (2005) further adds that dissatisfaction with career prospects is a major
cause of employee turnover. Organisations that provide formal career development
activities and match them to needs of the employees at various stages of their careers
reduce the likelihood that productivity will decrease as a result of obsolescence or
that job frustrations will create reduced satisfaction and hence intention to quit
(turnover). Regular performance appraisals are very important as these allow for the
development of career paths which are sensitive to nurses’ performance levels and
abilities. The three main purposes of performance appraisals are salary awards,
identification of training needs to enable the employees and organisations to achieve
their objectives, and to aid individuals’ career development strategies (Ball, 2004).
2.5.3 Reward or compensation practices
Compensation, according to Milkovitch et al. (2005), refers to "all forms of financial
returns and tangible services and benefits employees receive as part of an
employment relationship." The phrase financial return refers to an individual's base
salary, as well as short and long-term incentives. Tangible services and benefits refer
27
to, for example, insurance, paid vacation and sick days, pension plans, and employee
discounts. Some of the reward factors that influence turnover are described in the
ensuing discussion.
Compensation experts Richard et al.(2003) note that pay and benefits are extremely
important to both new and existing employees. The compensation received from
work is a major reason that most people seek employment. Compensation not only
provides a means of sustenance and allows people to satisfy their materialistic and
recreational needs, it also serves their ego or self-esteem needs. Consequently,
Taylor (2010) found that if a firm's compensation system is viewed as inadequate,
top applicants may reject that company's employment offers, and current employees
may choose to leave that organisation leading to turnover. If employees perceive that
their efforts will be accurately appraised, and if they further perceive that the rewards
they value are closely linked to their evaluations, an organisation would have
optimised the motivational properties from its evaluation and reward procedures and
policies. Rewards are likely to lead to high employee performance and satisfaction
when they are perceived as being equitable by employees, tied to performance, and
to the needs of an individual.
Pay dissatisfaction has been found to significantly predict absenteeism and turnover
(Mohamad, 2006). Mohamad research shows that employees’ perception of human
resource management (HRM) practices on inequitable compensation level can
predict organisational turnover. Workers with higher paying jobs are more likely to
stay than those with lower paying jobs. Hinkin et al. (2000) reported that one of the
main reasons cited by hotel employees for leaving their jobs was low and inequitable
pay.
28
2.5.4 Staff training and development practices
Training and development, according to John et al. (1994), is a systematic process of
altering employees’ behaviour to further an organisation’s goals. Development is the
acquisition of knowledge and skills that may be used in the present or future.
Training programmes can affect work behaviour in two ways. The most obvious is
by directly improving the skills necessary for an employee to successfully complete
his or her job. An increase in ability improves an employee’s potential to perform at
higher level. Of course, whether that potential becomes realised is largely an issue of
motivation.
A second benefit from training is that it increases an employee’s self-efficacy,
namely a person’s expectation that he or she can successfully execute the behaviours
required to produce an outcome. For employees, those work behaviour tasks and
their outcome is effective job performance. Employees with high self-efficacy have
strong expectations about their abilities to perform successfully in new situations.
They are confident and expect to be successful. Training, then, is a means to
positively affect self-efficacy.
For nurses to be able to take charge of institutions in their work environment,
ongoing training and development should be available (Strachota et al., 2003).
Nurses expect their work environment to supply them with adequate opportunities
and equipment to provide patient care of a high standard. Dissatisfactions at work
could increase nurse turnover rates (Mrrayan, 2005). However, Dunn, Trivedi,
Kampert and Clark (2005) reported that an Australian study did not find a
relationship between nurses’ levels of satisfaction and their levels of education.
29
2.5.5 Work environment
A safe and happy workplace makes employees feel good about being there. Each one
is given importance and provided the security that gives them the motivation and
incentive to stay. Positive perceptions of workplace relationships (supervisor and co-
workers support) may help reduce work-related stress, increase job satisfaction and
motivation, enhance commitment, improve performance, and reduce employees’
turnover intentions (Lum et al., 2002). Employees do not like the feeling of being in
the dark about what is happening in a company where they are employed. Employees
motivated and develop enthusiasm only when management opens up to them and
discusses company policies, sales clients, contracts, goals and objectives. This
encourages participative management. Being open about everything that is company
related will help in building trust and motivating employees.
2.5.6 Other factors
Other factors considered in this study are position held, recognition, work-related
stress and leadership relationships. Hayajneh et al. (2009), in his study on Malaysian
government doctors found that recognition for achievement and career advancement
were negatively and significantly related to turnover intention. Rambur et al. (2005),
indicated that lack of recognition for different skills and competency levels in the
work environment, neither by compensation nor in role differentiation, was a
disincentive for nurses turnover Sullivan and Decker (1997), found that participants
needed more recognition to satisfy their needs for reputation, prestige and respect
from others, which could lead to increased self-esteem. A safe and happy workplace
makes employees feel good about being there. Each one is given importance and
provided the security that gives them the motivation and incentive to stay. Therefore
30
positive perceptions of workplace relationships between supervisor and co-workers
support may help reduce work-related stress, increase job satisfaction and
motivation, enhance commitment, improve performance, and reduce employees’
turnover intentions (Laphalala, 2006).
Job satisfaction is an area that has been extensively researched and published
(Smerek & Peterson 2007; Cole & Cole ,2005; Torkabadi & Kheirkhah ,2013).
However, despite a plethora of research in this area the findings have been
inconsistent. The more accurately public sector managers understand what motivates
their employees, the more effective strategies can be crafted to curb staff turnover.
There are a number of definitions to job satisfaction. Price (2001) defines it as the
effective orientation that an employee has towards his or her work. Chen (2008)
defines job satisfaction as pertaining to feelings, attitudes and preferences of
individuals regarding work. Job satisfaction pertaining to the nursing fraternity
consists of a multidimensional constructs that have personal fulfilment in one’s job
(Broome, & Nash, 2001). Therefore, it becomes paramount to understand job
satisfaction in the context of the health care sector in order to curtail nursing
turnover, especially in the Khomas Region of Namibia which is experiencing a high
turnover rate.
2.6. EFFECTS OF TURNOVER
According to McGovern and Miller (2008), “high employee turnover rates affect
customers, other employees, management, and employers. While it’s not feasible to
think that an organisation will never lose an employee, keeping turnover to a
minimum is in organisations best interests.” Phillips et al. (2009) in their advise on
31
the “negative impact of staff turnover on the organisation”, provided the following
impacts from staff turnover.
High financial cost – the author provided that talent departure has a huge
financial costs to the organisation both direct and indirect costs.
Exit problems and issues – the author advised that some individuals find the
need to involve the legal system, leaving the organisation with the challenge of
dealing with an even bigger problem. Even employees who leave voluntarily
can cost the organisation time and money.
Productivity losses and workflow interruptions – this is a concern that a person
who exits abruptly and cause a productivity gap. This void not only causes a
void for the specific job performed by the departing employee, but others on
the same team and within the flow of work. This is also confirmed by Mathis
and Jackson (2007) who assert that employees have to work extra hours to
compensate for the work of those that have resigned.
2.6.1 Individual employee and family
Administrative support is vital in keeping staff motivated to stay in an organisation.
This type of support pertains to personal development and family matters. For
example, some nursing personnel may have to relocate to other districts of the
country due to marriage or family relocations. The hospital or clinic management
should facilitate the ease of such transfers where necessary. Pardey (2007) contends
that lack of administrative support precipitates the quit intentions of an employee.
Netswera, Rankhumisi and Mavundla (2005) emphasise that nursing staff, who
relocate should be assisted in order to maintain a balance between family issues and
work. The author adds that such a support system tends to curb turnover intentions.
32
This statement is further supported by Mohamad (2006), who states that individuals
who have a high administrative support are likely to continue working for the same
organisation for a long period of time as they feel wanted and respected. Pardey
(2007) states that lack of social support from management increases turnover
intentions of nurses.
2.6.2 Organisation
Turnover tends to put a strain on organisational performance and productivity (Noe,
Hllenbeck, Gerhart & Wright, 2006). Organisations that experience turnover either
benefit from it or suffer costs as a result of it. These costs are as a consequence of
various factors that influence employee turnover. If the factors are identified, they
tend to reduce the ramifications of turnover in terms of costs and disruptions in the
workplace (Maharaj & Anderson, 2010). Employee turnover puts a strain on an
organisation’s scarce resources. Morell et al. (2004) identified direct and indirect
costs of voluntary turnover as replacement, recruitment and selection, temporary
staff, management time, morale, pressure on remaining staff, costs of learning,
product or service quality, organisational memory, and the loss of social capital.
These costs are also confirmed by Dess and Shaw (2001), and Morell et al. (2004).
2.7. STRATEGIES TO OVERCOME TURNOVER
The strategies organisations use to engage their workers depend not only on their
business strategies but also on the size and complexity of the organisations and their
workforce (Branham 2012). According to Kaye and Jordan-Evans (2014), an
important strategy for engaging and retaining talented employees is having
discussions with all employees who must be retained.
33
2.5.2 Performance incentives
Every good performance is appreciated in the form of a pat on the back, bonuses or
giving some other compensation for a job well done. Organisations that struggle to
keep up the attrition rate are mostly those that think employees are just doing their
job. Even if it is an employee’s job, completion in an appreciable manner calls for
an incentive, and this goes a long way in boosting staff morale and reducing
turnover. These incentives can be implemented at an individual as well as team level.
It has been seen that this works wonders in getting the best out of employees and
reduces turnover intentions. It is important to keep in mind that these bonuses should
not be given without a reason, unless it is a commitment for annual bonuses or some
such thing
2.5.3 Performance feedback
This is one of the methods being followed by many organisations. Feedback is not
only taken from a boss, but also from other seniors and subordinates. Previously,
appreciation was only sought from an immediate boss or management, but
organisations now understand the importance of collecting performance feedback
from several quarters. The opinion of everyone matters, especially for someone who
is in a leadership role at any level. Each person in the team is responsible for giving
constructive feedback. This kind of system helps in identifying people who can
perform well as leaders at higher levels in an organisation. Even senior level
managers can use this system to their advantage, as a tool to improve themselves.
2.5.4 Sharing knowledge
Knowledge sharing is a significant strategy that helps in the betterment of employees
and their work. Keep all knowledgeable information in central databases that can be
34
accessed by each and every employee. For example, if an employee is sent on some
training, the knowledge acquired by that employee can be stored in these databases
for others to learn from it. Even innovative ideas that management deems fit for
employees to see, can be stored here for all to see.
Reducing employee turnover requires time and a well thought out strategy. This is
about creating a conducive and engaging working environment that influences
employees to enjoy their jobs, reignite their purposes through initiatives such as
training and development. This is done by compiling a plan of action, and investing
in resources such as time and leadership that cares about the people (Smith 2007).
Maslow’s hierarchy of needs, and Herzberg’s intrinsic factors (motivators),
formulated employee motivation strategies, associated with job satisfaction and
recognition to retain valuable staff (Swanepoel, Erasmus & Schenk, 2008). Nel et al.(
2004), emphasised reinforcement of commitment on the job for staff retention by
nurturing positive attitude so that employees can identify themselves with an
organisation.
Staff training and development was also indicated as an enhancement of employee
self-esteem and encouragement of teamwork (Sadri, Sadri & Nayak, 2011). Robbins,
(2004), pointed out that employee exit interviews must be conducted to establish why
employees are leaving and determine the reasons for them leaving. The need for
employee retention policy was also mentioned by Scott (2013), as a strategy
associated with the development of necessary steps to keep current workers satisfied
with their roles.
35
2.8. SUMMARY
Various studies, especially in developed countries, have been done on
nurse/employee turnover. From the literature review limited studies have been done
in Namibia relating to factors that cause nursing turnover. In particular, none has
been done in public hospitals in the Khomas Region. Many factors that cause nursing
turnover have been linked to limited career advancement, low salaries, lack of
management support, work overload /stress, undervaluing of nurses’ services, limited
numbers of nurses in the market, and availability of opportunities locally and
beyond. Steps to curb nurse turnover especially in the government health facilities
may be impossible because of attractions by greener pastures. While these studies on
nurse turnover concentrated on foreign countries it was deemed worth while to test
some of variables in public hospitals in the Khomas Region in this study. The gap to
be filled in this study is to identify the factors causing high nursing turnover in
publics hospitals in the Khomas Region of Namibia..
36
CHAPTER 3
RESEARCH DESIGN AND METHOD
3.1. INTRODUCTION
Chapter 2 dealt with the literature on research conducted by other researchers on this
topic. This chapter presents the research methodology that was employed in this
study. It builds on the introduction and provides assurance that appropriate
procedures were followed. The chapter is organised around the research design and
method that includes, study population, and sampling. Also presented is a detailed
description of the data collection instrument methods of data collection as well as
validity and reliability as well as the ethical considerations. The methods used for
data analysis are also explained.
3.2. RESEARCH DESIGN
According to Grove, Burns and Gray (2013), research design is an overall research
approach or the strategy taken. McDaniel and Gates (2006) define research design as
a plan for addressing research objectives. Both definitions include a plan or strategy
required to address the objectives of a study. This study employed an exploratory,
descriptive and analytical designs of a mixed methods of quantitative and qualitative
approach.
3.2.1 Mixed method design
This study used a mixed method approach, which involves collecting both
quantitative and qualitative data and integrating them. The researcher based the
inquiry on the assumption that collecting diverse types of data best provides a more
complete understanding of a research problem than either quantitative or qualitative
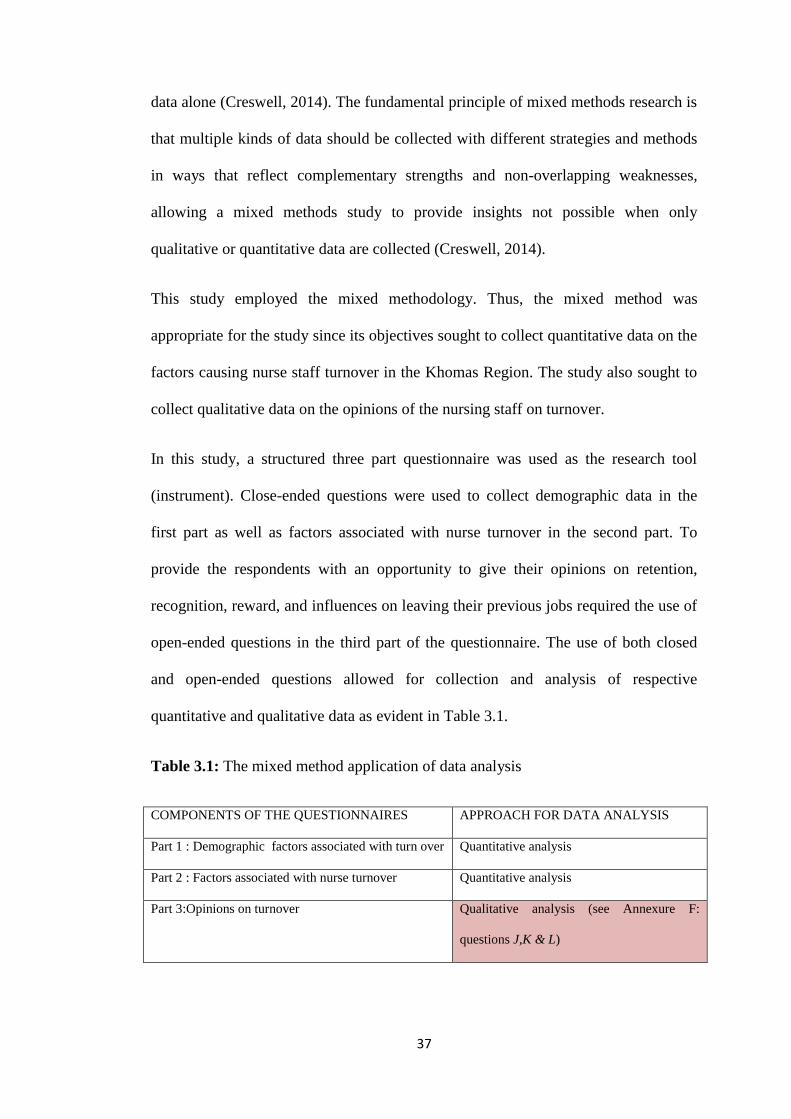
37
data alone (Creswell, 2014). The fundamental principle of mixed methods research is
that multiple kinds of data should be collected with different strategies and methods
in ways that reflect complementary strengths and non-overlapping weaknesses,
allowing a mixed methods study to provide insights not possible when only
qualitative or quantitative data are collected (Creswell, 2014).
This study employed the mixed methodology. Thus, the mixed method was
appropriate for the study since its objectives sought to collect quantitative data on the
factors causing nurse staff turnover in the Khomas Region. The study also sought to
collect qualitative data on the opinions of the nursing staff on turnover.
In this study, a structured three part questionnaire was used as the research tool
(instrument). Close-ended questions were used to collect demographic data in the
first part as well as factors associated with nurse turnover in the second part. To
provide the respondents with an opportunity to give their opinions on retention,
recognition, reward, and influences on leaving their previous jobs required the use of
open-ended questions in the third part of the questionnaire. The use of both closed
and open-ended questions allowed for collection and analysis of respective
quantitative and qualitative data as evident in Table 3.1.
Table 3.1: The mixed method application of data analysis
COMPONENTS OF THE QUESTIONNAIRES APPROACH FOR DATA ANALYSIS
Part 1 : Demographic factors associated with turn over Quantitative analysis
Part 2 : Factors associated with nurse turnover Quantitative analysis
Part 3:Opinions on turnover Qualitative analysis (see Annexure F:
questions J,K & L)
38
3.2.2 Explorative design
Exploratory design is defined as research to gain new insights, discover new ideas,
and for increasing knowledge of a phenomenon (Burns & Groove, 2013). According
to Sekeran and Bougie (2011), exploratory research is normally undertaken when not
much is known about a phenomenon or where there is lack of information about a
situation. This study attempted to explore the factors associated with turnover among
nurses in the public health facilities of the Khomas Region as information in this
regard is limited. The researcher used exploratory design to lay the groundwork for
future studies or to determine whether the outcome might be explained by existing
theory. The use of exploratory design allowed the researcher to capture the variables
for the development of the questionnaire.
3.2.3 Descriptive design
Descriptive research design can be quantitative or qualitative. It involves collection
of information that can be presented numerically or as individual interpretations
(Burns & Groove, 2000). Its advantage is that it allows a researcher to employ
multiple approaches for data collection and analysis. Descriptive research design
involves gathering data that describes events and organises data in the form of visual
aids such as graphs and charts to aid a reader in understanding distribution. It helps a
researcher to present discrete and categorical variables like mean and standard
deviation. It also helps to manage large volumes of data. In this study the data
described were demographic and associated factors pertaining to turnover in the
public health facilities in the Khomas Region. Qualitative data that depicted the in-
depth narrative descriptions were easily organised into patterns that emerged during
analysis (see Part 3 in Annexure F).
39
3.2.4 Analytical design
An analytical design is the use of an appropriate process to break a problem down
into elements necessary to solve it. The knowledge obtained is independent of an
observer. This design is interested in the cause and effect relationship and
correlations in phenomena (Austin et al., 1999).
The researcher chose analytical research design to determine assumptions and to
estimate statistical-based factors contributing to nurse turnover. This helped to
understand the relationship between variables such as age and salary. In this study
analytical design was utilised in objective four, namely, to analyse the association of
demographic data and the correlation/relationship of variables of each associated
factor (De Vos et al., 2011).
3.3. RESEARCH CONTEXT
The study was conducted in private health facilities and other sectors which nurses
moved to, leaving public health facilities in the Khomas region. According to
McCormack et al (2002) context in the health fraternity looks at issues like the
environment, culture, and leadership. This study was also carried out in line with
these common characteristics while analysing the causes of nurse turnover in the
Khomas Region. The environment or setting in which this research took place was
the nurses who had moved from public health facilities to private hospitals and other
sectors. This gave the environment its specific boundaries and structures that shaped
the environment for practice. Research context in this study involved quality
improvement and practice development in order to bring about change in the practice
which is linked to culture. Manley (2000) defines culture as ‘the way things are done
here.’ He further argues that it is the culture at individual, team and organisational
levels that creates the context of practice. Culture is not something an organisation
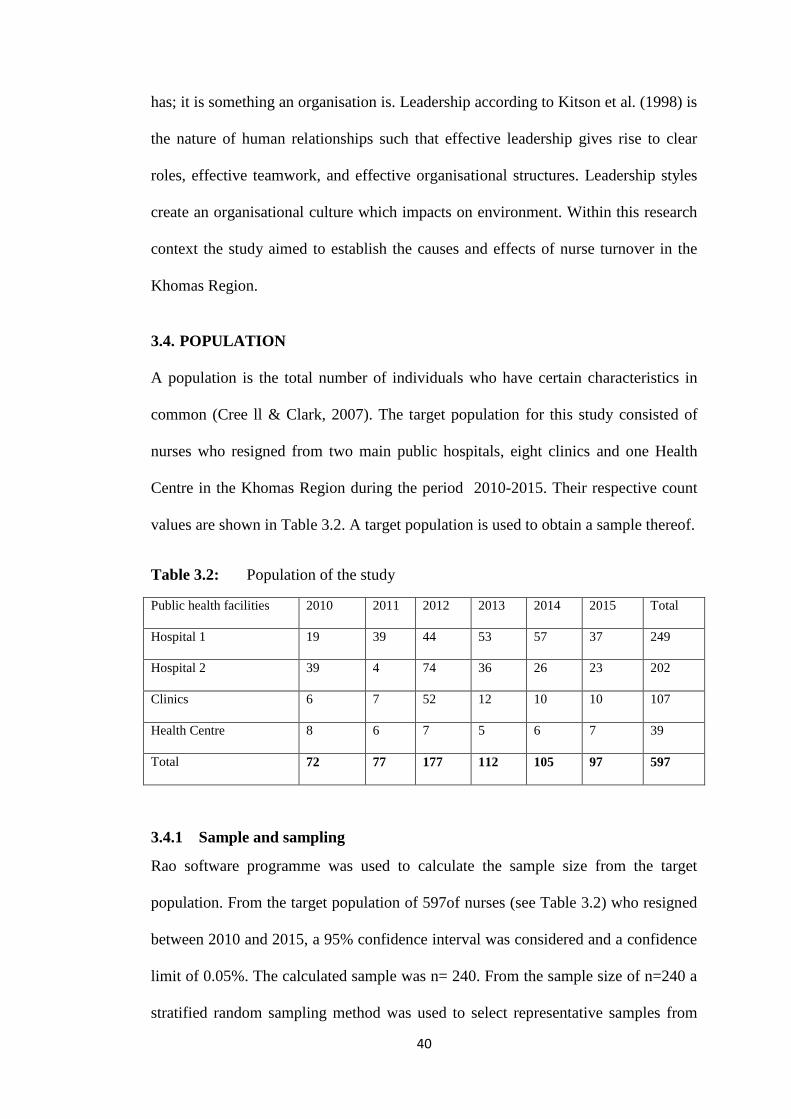
40
has; it is something an organisation is. Leadership according to Kitson et al. (1998) is
the nature of human relationships such that effective leadership gives rise to clear
roles, effective teamwork, and effective organisational structures. Leadership styles
create an organisational culture which impacts on environment. Within this research
context the study aimed to establish the causes and effects of nurse turnover in the
Khomas Region.
3.4. POPULATION
A population is the total number of individuals who have certain characteristics in
common (Cree ll & Clark, 2007). The target population for this study consisted of
nurses who resigned from two main public hospitals, eight clinics and one Health
Centre in the Khomas Region during the period 2010-2015. Their respective count
values are shown in Table 3.2. A target population is used to obtain a sample thereof.
Table 3.2: Population of the study
Public health facilities 2010 2011 2012 2013 2014 2015 Total
Hospital 1 19 39 44 53 57 37 249
Hospital 2 39 4 74 36 26 23 202
Clinics 6 7 52 12 10 10 107
Health Centre 8 6 7 5 6 7 39
Total 72 77 177 112 105 97 597
3.4.1 Sample and sampling
Rao software programme was used to calculate the sample size from the target
population. From the target population of 597of nurses (see Table 3.2) who resigned
between 2010 and 2015, a 95% confidence interval was considered and a confidence
limit of 0.05%. The calculated sample was n= 240. From the sample size of n=240 a
stratified random sampling method was used to select representative samples from
41
the public health facilities in Table 3.2.This sampling technique divides a population
of study into non-overlapping strata, by using ratio of strata to population. The
calculation for respondents samples were as follows: Hospital 1 n=100 (41.8%),
Hospital 2 n= 81 (33.8%), clinics n= 43 (17.9%), and health centre n= 16 (6.5%) to
obtain n=240 respondents. The desired number of elements was selected randomly
from each stratum.
3.5. DATA COLLECTION
Data was collected in private health facilities and other sectors where nurses
migrated to leaving public health facilities in the Khomas region. The researcher
contacted potential participants using information gathered from the Ministry of
Health and Social Services (MoHSS). The researcher distributed questionnaires to
potential participants in the selected sample size from the target population. Data
collection included research instruments and procedure for data collection.
3.5.1 Research instrument
A questionnaire was used as the research tool to gather data for this study using
closed-ended questions and open ended questions. The research tool included closed
and open-ended questions that compromised three parts.
42
Demographic factors: This part of the questionnaire asked questions on
demographics of the respondents, namely gender, age, marital status, salary earned
per month, level of education, and tenure (see Annexure F) to gauge the
representativeness.
Part 2: Associated factors with turnover: This part of the questionnaire comprised
seven close-ended questions on factors contributing to nurses’ leaving one job for
another. The questions covered company rewards or compensation practices,
training and development practices, promotional opportunities, recognition,
work-related stress, leadership relationships, and work environment; a five-point
Likert scale was used (1 = strongly agree; 2 = agree; 3 = neutral; 4 =
disagree; 5 = strongly disagree). The respondents were also asked to rank
factors related to retention of nursing staff and work environment from the most
important to the least ones on a scale of 1 (most important) to 10 (least important).
Respondents were requested to answer YES or NO on the effect of recognition
and staff reward on nurse turnover (see Annexure F).
Part 3: Opinions of the respondents on turnover: The respondents were asked
three open-ended questions to obtain their perceptions and opinions on the
factors that contribute to high nurse turnover in public healthcare facilities in the
Khomas Region. Opinions were on what can the public health facilities do to
retain nursing staff and whether or not recognition/reward practices influences
staff turnover. Respondents were also given an opportunity to mention other
factors that could have influenced them to leave the public health facilities. The
questions sought to ascertain the situations, settings and relationships that existed in
the public healthcare facilities in the Khomas Region.
43
3.5.2 Procedure for data collection
The procedure to contact potential participants, as explained in 3.5, was followed. A
self-administered questionnaire was used for data collection as described under 3.5.1
and 3.5.1.3. Questionnaires were distributed at potential participants’ current work
places during working hours and, at their homes after working hours and weekends.
Those who had moved outside the study region were mailed the questionnaire. All
were asked to complete the questionnaire within a week of receiving it. Collection of
data spanned 60 days since potential participants were not confined to a single study
site.
3.5.3 Preparation of the research field
The researcher obtained a letter of authorisation and introduction from the University
of Namibia (see Annexure A). The researcher then wrote a letter to MoHSS seeking
permission to carry out the study in the region. An approval letter was provided by
the Permanent Secretary Ministry of Health and Social Services (MoHSS) see
Annexure B. Letters were written to private hospitals requesting permission to carry
out the study within their hospital surroundings; permission was granted by the
Roman Catholic Hospital (see Annexure C). Two hundred and forty (240)
questionnaires and consent forms were printed according to the researcher’s
calculated sample size. The researcher first informed the potential participants about
the purpose of the research and sought their informed consent on whether they
wanted to participate in the study or not. Distribution of these documents to potential
participants was carried out as explained in section 3.5.2. To allow time to complete
the questionnaire, all of those who were handed or mailed the questionnaire were
given a week to complete it during their spare time after working hours.
44
3.5.4 Pilot study
A pilot study is a small-scale study conducted prior to a main study. It involves a
limited number of participants from the population at hand (Brink et al., 2016). In
this study, a pilot study was conducted as a mini-version of the full study. It was
done to pre-test the research questionnaire. The process was done by including a few
individuals who met the inclusion criteria but who were not part of the main study
sample. Ten nurses, who met the inclusion criteria but not included in the main study
sample, were selected at the one of the private hospitals to participate in the pilot
study. The purpose of the study was explained and questionnaires were administered
to the participants read and understand in the researcher’s presence. The participants
found all of the questions clear and precise. No challenges, gaps or flaws in
completing the questionnaire thus no adjustments were made to the research tool
after the pilot study. The main study did not include data collected during the pilot
study.
3.5.5 Validity of the instrument
Cooper et al. (2011) define validity as the extent to which a test measures what is
meant to be measured. To ensure validity of a series of informed decisions the
research questions, the purpose of the research, and theoretical paradigms, were used
in this research. For the purpose of validity for this study: content, face and construct
validity were applied.
3.5.5.1 Content validity
Content validity refers to how well an instrument represents all the components of
the variables to be measured (Brink, Van der Walt & Ransburg, 2016). This study
focused on measuring the factors that influence nurse turnover. One of the variables
45
to be measured was ‘contributing factors to leaving the job and accepting the new
job’.
The content or the variables of the questionnaire (see Annexure F) were extracted
from recent articles pertaining to turnover of nurses. The questionnaire was approved
by the researcher’s academic supervisor who is an expert in health services. It was
also approved by the University of Namibia and MoHSS (see Annexure B and C).
The questionnaire was also tested as described in 3.5.4. The variables for Part 2 were
tested with Cronbach’s coefficient alpha in terms of clarity of the items and whether
the research tool measured the essential aspects of the relevant variables.
3.5.5.2 Face validity
Face validity refers to how well a research design offers a process that will facilitate
data acquisition within a research agenda (Healy & Perry, 2000). In other words, it
measures what it is supposed to measure. This study used face validity to ensure
readability and clarity of content as suggested by Brink et al. (2016). The
methodological paradigm in this research is congruent with the research paradigms
and aligns to the research aim and questions (see page 5). The research methodology,
research design, and methods, are linked to provide answers to the research
questions. Therefore, the research design followed in this research is to the point and
corresponds with all other elements, thereby ensuring high face validity. The
questionnaire had both structured and semi-structured questions which ensured
consistency in the provided data.
46
3.5.5.3 Construct validity
According to Polit and Beck (2008), construct validity measures the relationship
between an instrument and related theory. A measure has construct validity if the set
of items constituting it faithfully represents the set of aspects of a theoretical
construct measured, and does not contain items which represent aspects not included
in a theoretical construct. (Emory & Cooper, 1991). Babbie (2005) further defines
construct validity as the degree to which a measure relates to other variables as
expected within a system of theoretical relationships. The structural aspects of
validity are concerned with the degree to which a scoring structure conforms to the
dimensional structure of a construct.
The study was based on two theories: the traditional theory by Griffeth et al. (2000)
and the factor theory propounded by Herzberg et al. (1959). These theories look at
employee retention and its causes. The research instrument and its findings were
supported with the theories’ assumptions. In this study, construct validity was useful
in measuring variables concerning the feelings and satisfaction of respondents. The
study involved factors such as performance incentives and feedback. Construct
validity was thus useful in measuring the relationship of these variables.
3.5.6 Reliability of the instrument
Reliability of the instrument refers to the degree to which a measurement technique
can be depended upon to secure consistent results upon repeated application (Weiner,
1985). Cronbach coefficient alpha was conducted to test the questionnaire items for
internal consistency. Cronbach’s coefficient alpha is a measure used to test the
reliability of items in a questionnaire. Alpha estimates the degree of interrelatedness
among a set of items and variance among the items, and a widely advocated level of
adequacy for coefficient alpha is at least 0.7. A Cronbach alpha of .60 is acceptable
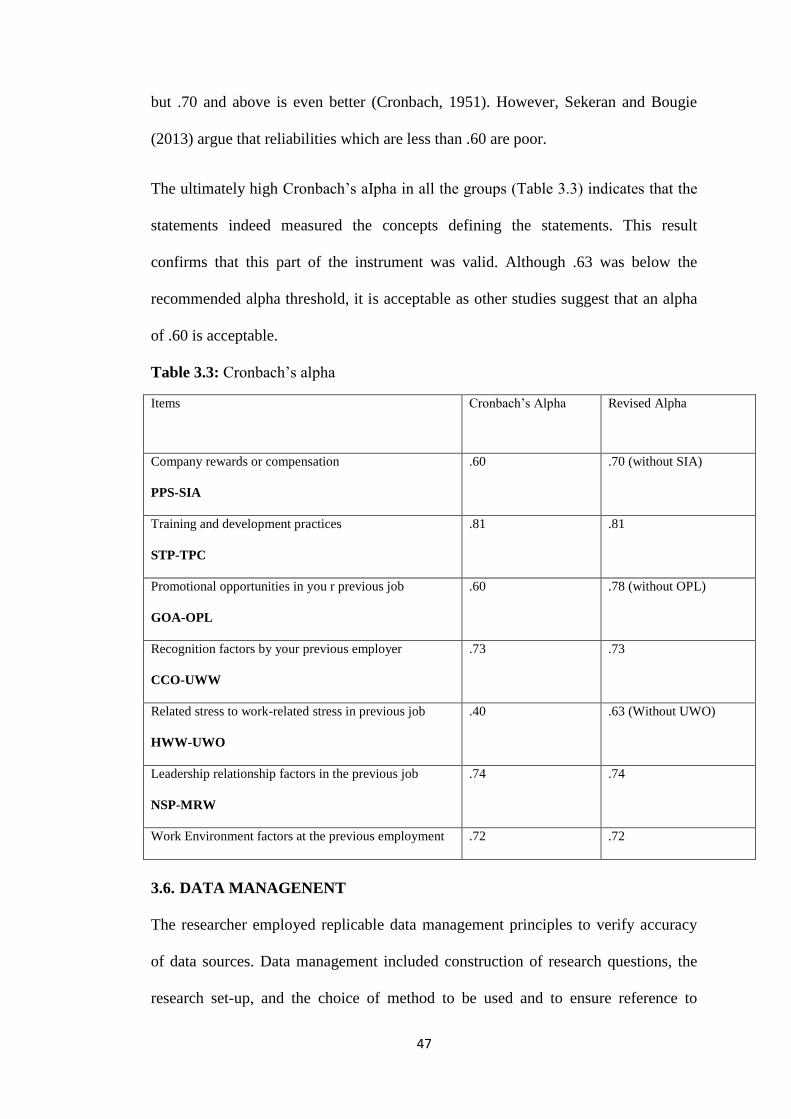
47
but .70 and above is even better (Cronbach, 1951). However, Sekeran and Bougie
(2013) argue that reliabilities which are less than .60 are poor.
The ultimately high Cronbach’s aIpha in all the groups (Table 3.3) indicates that the
statements indeed measured the concepts defining the statements. This result
confirms that this part of the instrument was valid. Although .63 was below the
recommended alpha threshold, it is acceptable as other studies suggest that an alpha
of .60 is acceptable.
Table 3.3: Cronbach’s alpha
Items Cronbach’s Alpha Revised Alpha
Company rewards or compensation
PPS-SIA
.60 .70 (without SIA)
Training and development practices
STP-TPC
.81 .81
Promotional opportunities in you r previous job
GOA-OPL
.60 .78 (without OPL)
Recognition factors by your previous employer
CCO-UWW
.73 .73
Related stress to work-related stress in previous job
HWW-UWO
.40 .63 (Without UWO)
Leadership relationship factors in the previous job
NSP-MRW
.74 .74
Work Environment factors at the previous employment .72 .72
3.6. DATA MANAGENENT
The researcher employed replicable data management principles to verify accuracy
of data sources. Data management included construction of research questions, the
research set-up, and the choice of method to be used and to ensure reference to
48
sources studied was accurately documented. The quality of data collection, data
input, data storage and data processing were guarded closely. All steps taken were
properly reported and the execution was properly monitored. Raw research data were
archived in such a way that they can be retrieved at a minimum expense in terms of
time and effort.
3.7. DATA ANALYSIS
Gayet et al. (2009) define data analysis as ordering and organising raw data to extract
useful information. In this study, the data were quantitatively and qualitatively
analysed as described.
3.7.1 Quantitative data analysis
In Parts 1 and 2, a preliminary cleaning and formatting of the data was the first step
in data preparation. This included renaming of variables such as limiting the number
of characters to fit the specified nomenclature of SPSS. Data were thereafter
exported to SPSS for diagnostic and reliability analyses. All cases with 50% or more
missing entries were discarded and the data re-ordered appropriately. The collected
data were analysed and synthesised using Statistical Package of Social Science
(SPSS) software, which is designed to analyse quantitative data. Statistical processes
with SPSS derived descriptive correlations, covariance and factor analyses. This
entailed the following analysis steps:
Part 1 - demographic data: gender, age, marital status, salary per month, level of
education and tenure in terms of frequency, frequency table, percentage and
association.
Part 2 - associated factors that contribute leaving previous job: company rewards or
compensation practices, training and development studies, promotional
49
opportunities, recognition factors, work-related stress, leadership relations factors
and work environment factors in terms of frequency, frequency table, percentage and
association.
3.7.2 Qualitative data Analysis
The qualitative data collected in Part 3 were transcibed verbatim in a MS Word
document and then by grouping the verbatin responses/ statements to questions J, K
and L.(Annexure F). After the grouping of each question, the verbatim
responses/statements were assigned to ATLAS ti, which is a software designed for
qualitative analysis. The quotations were then coded by selecting the meaning from
each verbatim statement/response.The second stage of analysis was to merge similar
codes into higher or super codes to reduce and combine the most important aspects
of the coding (Silver & Lewins, 2014). Networks were then produced for
interpretation purposes (Friese, 2014).
3.8. ETHICAL CONSIDERATIONS
Bogonko and Kathure (2015) define ethics as a branch of philosophy that deals with
one’s conduct and serves as guide to one’s behaviour. All ethical considerations
pertaining to avoidance of harm to the respondents, informed consent,
confidentiality, and authorisation to undertake the study were observed in this study.
3.8.1 Permission to conduct the research
The researcher obtained a letter of authorisation and introduction from the Ethics
Letters were written to various private hospitals seeking permission to contact nurses
Committee of University of Namibia (Annexure A). Permission to conduct research
was granted by MoHSS (Annexure C). who left the public health sectors (Annexure
D).
50
3.8.2 Principles of respect of persons
Respondents were only included in the study when they had signed the consent form.
They were informed they could withdraw from the study at any point or choose not
to answer some questions with no penalty.
3.8.3 Principle of beneficence
The questionnaire was carefully structured in a manner to avoid psychological stress
to respondents. It was reviewed by the respective ethics committees of the University
of Namibia and MoHSS. The researcher used pseudonyms to protect the identity of
the respondents and to ensure they came to no harm.
3.8.4 Fair treatment/justice
In this study, the principle of justice was ensured such that every potential participant
had an equal opportunity to be selected from the target population for the reasons
directly related to the research purpose and not because they were easily available or
could be manipulated.
3.9. SUMMARY
This chapter presented the research methodology employed in this study. The
research methodology and rationale for selecting data were discussed. A description
of the research design and method was presented. A target population and sampling
strategy used were explained followed by a description of the data collection
instrument and how it was constructed. A pilot study as well as the data analysis
methods was described including a detailed explanation on coding of the data.

51
Validity, reliability, and ethical considerations were also presented. The next chapter
presents the analysis of data and their findings.
52
CHAPTER 4
DATA ANALYSIS AND PRESENTATION OF FINDINGS
4.1. INTRODUCTION
This chapter presents a detailed analysis conducted on collected questionnaire data.
Descriptive statistics and demographic variables are provided first to give
background information. A detailed analysis is further employed to explain the data
in different ways in order to answer the research objectives and consequently the
research question.
4.2. OVERVIEW OF THE DATA COLLECTION AND ANALYSIS PROCESS
The questionnaire was used to collect the raw data. As described in 3.5.1.2, a five-
point Likert scale was used in some quantitative questions with codes 1 to 5, with 1
being strongly agree and 5 being strongly disagree were applied. The validity and
reliability of the research instrument (tool) were confirmed as discussed in Chapter 3
(see 3.5.4 to 3.5.5.4). Correlation results laid the foundation for further analysis,
which was ultimately used to answer the research questions. A factor analysis was
conducted to classify turnover factors and to investigate if the statement groups could
be retained in the Namibian context.
The final portion of this section provides the results of content analysis, code
occurrence, and frequency measures that were yielded by the qualitative data. The
qualitative section also provided an explanation of the central themes that emerged
during qualitative analysis. This chapter concluded with a summary of the results.
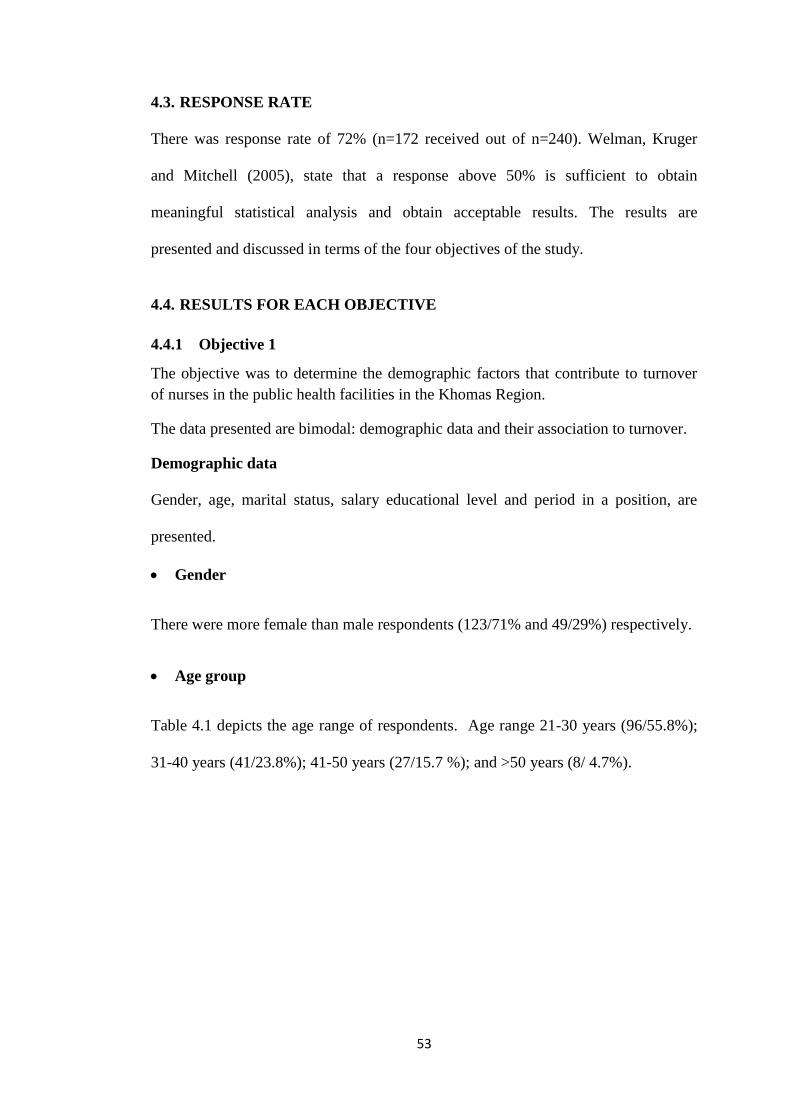
53
4.3. RESPONSE RATE
There was response rate of 72% (n=172 received out of n=240). Welman, Kruger
and Mitchell (2005), state that a response above 50% is sufficient to obtain
meaningful statistical analysis and obtain acceptable results. The results are
presented and discussed in terms of the four objectives of the study.
4.4. RESULTS FOR EACH OBJECTIVE
4.4.1 Objective 1
The objective was to determine the demographic factors that contribute to turnover
of nurses in the public health facilities in the Khomas Region.
The data presented are bimodal: demographic data and their association to turnover.
Demographic data
Gender, age, marital status, salary educational level and period in a position, are
presented.
Gender
There were more female than male respondents (123/71% and 49/29%) respectively.
Age group
Table 4.1 depicts the age range of respondents. Age range 21-30 years (96/55.8%);
31-40 years (41/23.8%); 41-50 years (27/15.7 %); and >50 years (8/ 4.7%).
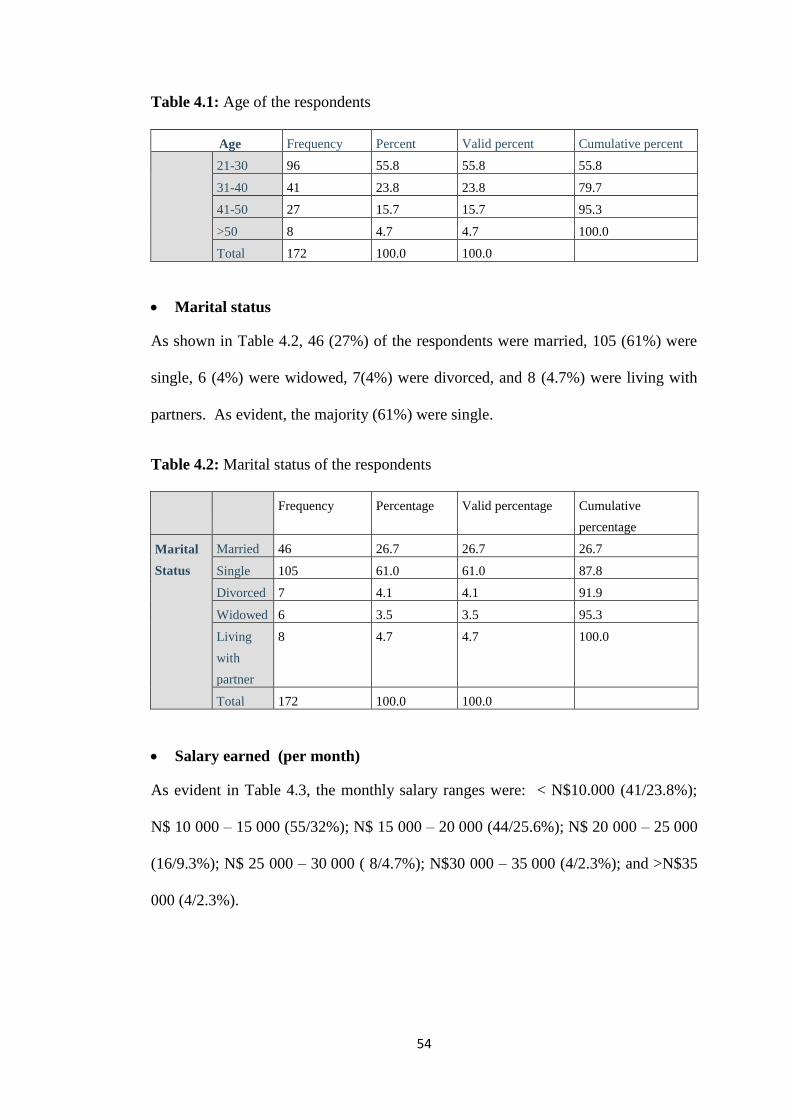
54
Table 4.1: Age of the respondents
Age Frequency Percent Valid percent Cumulative percent
21-30 96 55.8 55.8 55.8
31-40 41 23.8 23.8 79.7
41-50 27 15.7 15.7 95.3
>50 8 4.7 4.7 100.0
Total 172 100.0 100.0
Marital status
As shown in Table 4.2, 46 (27%) of the respondents were married, 105 (61%) were
single, 6 (4%) were widowed, 7(4%) were divorced, and 8 (4.7%) were living with
partners. As evident, the majority (61%) were single.
Table 4.2: Marital status of the respondents
Frequency Percentage Valid percentage Cumulative
percentage
Marital
Status
Married 46 26.7 26.7 26.7
Single 105 61.0 61.0 87.8
Divorced 7 4.1 4.1 91.9
Widowed 6 3.5 3.5 95.3
Living
with
partner
8 4.7 4.7 100.0
Total 172 100.0 100.0
Salary earned (per month)
As evident in Table 4.3, the monthly salary ranges were: < N$10.000 (41/23.8%);
N$ 10 000 – 15 000 (55/32%); N$ 15 000 – 20 000 (44/25.6%); N$ 20 000 – 25 000
(16/9.3%); N$ 25 000 – 30 000 ( 8/4.7%); N$30 000 – 35 000 (4/2.3%); and >N$35
000 (4/2.3%).
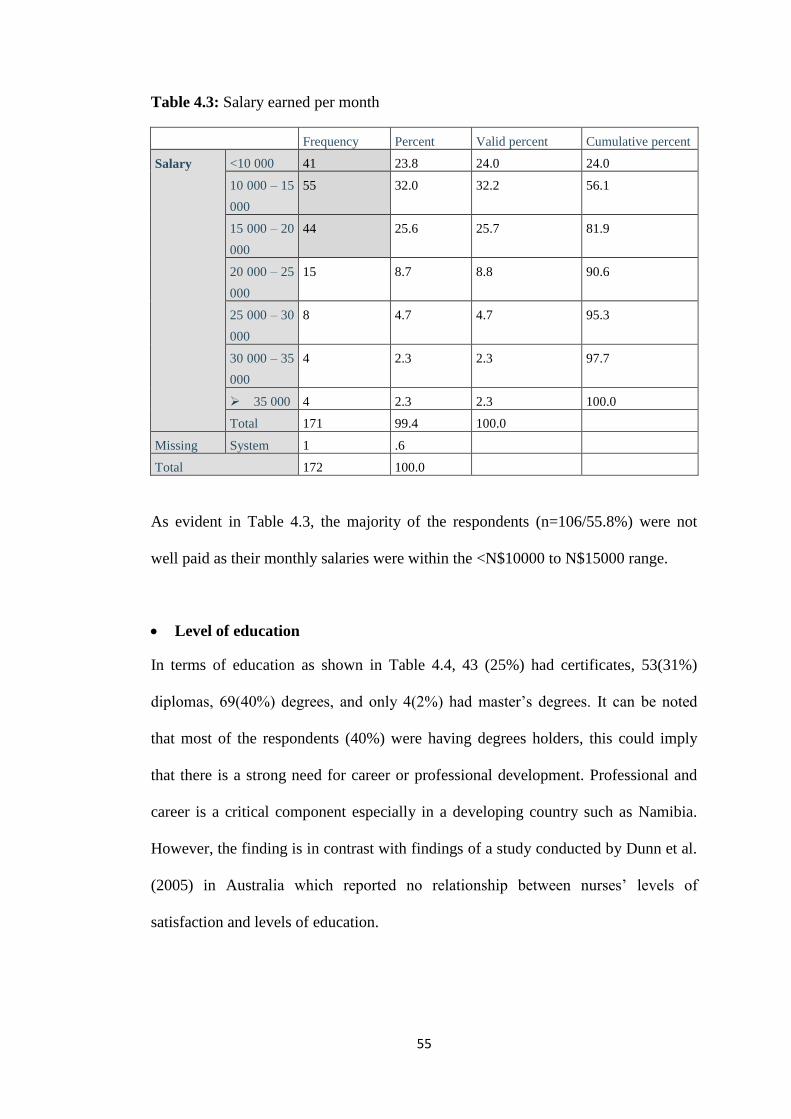
55
Table 4.3: Salary earned per month
Frequency Percent Valid percent Cumulative percent
Salary <10 000 41 23.8 24.0 24.0
10 000 – 15
000
55 32.0 32.2 56.1
15 000 – 20
000
44 25.6 25.7 81.9
20 000 – 25
000
15 8.7 8.8 90.6
25 000 – 30
000
8 4.7 4.7 95.3
30 000 – 35
000
4 2.3 2.3 97.7
35 000 4 2.3 2.3 100.0
Total 171 99.4 100.0
Missing System 1 .6
Total 172 100.0
As evident in Table 4.3, the majority of the respondents (n=106/55.8%) were not
well paid as their monthly salaries were within the <N$10000 to N$15000 range.
Level of education
In terms of education as shown in Table 4.4, 43 (25%) had certificates, 53(31%)
diplomas, 69(40%) degrees, and only 4(2%) had master’s degrees. It can be noted
that most of the respondents (40%) were having degrees holders, this could imply
that there is a strong need for career or professional development. Professional and
career is a critical component especially in a developing country such as Namibia.
However, the finding is in contrast with findings of a study conducted by Dunn et al.
(2005) in Australia which reported no relationship between nurses’ levels of
satisfaction and levels of education.
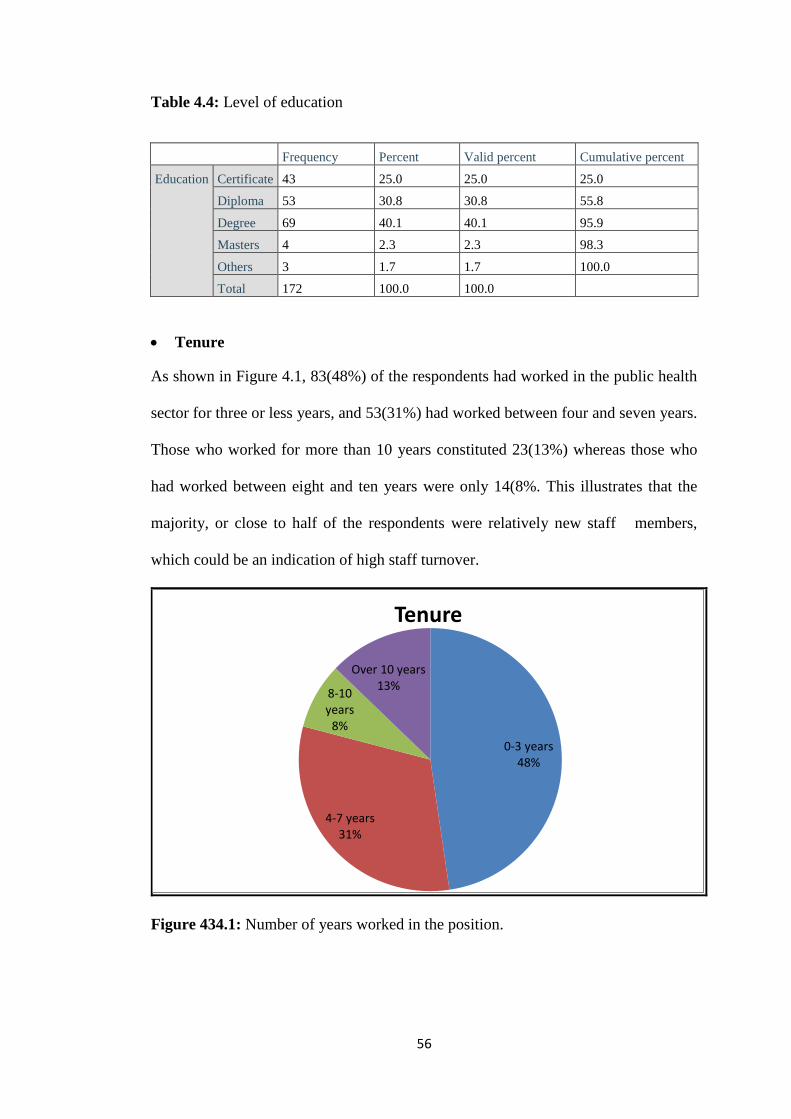
56
Table 4.4: Level of education
Frequency Percent Valid percent Cumulative percent
Education Certificate 43 25.0 25.0 25.0
Diploma 53 30.8 30.8 55.8
Degree 69 40.1 40.1 95.9
Masters 4 2.3 2.3 98.3
Others 3 1.7 1.7 100.0
Total 172 100.0 100.0
Tenure
As shown in Figure 4.1, 83(48%) of the respondents had worked in the public health
sector for three or less years, and 53(31%) had worked between four and seven years.
Those who worked for more than 10 years constituted 23(13%) whereas those who
had worked between eight and ten years were only 14(8%. This illustrates that the
majority, or close to half of the respondents were relatively new staff members,
which could be an indication of high staff turnover.
Figure 434.1: Number of years worked in the position.
0-3 years 48%
4-7 years 31%
8-10 years
8%
Over 10 years 13%
Tenure
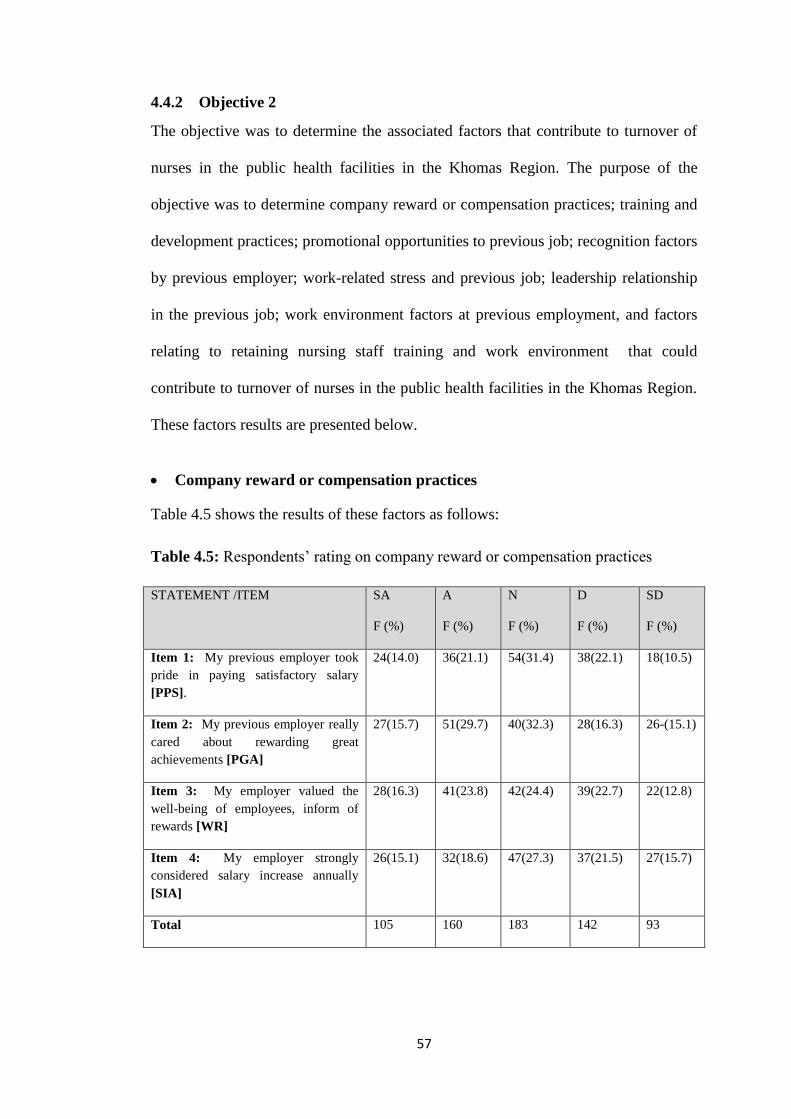
57
4.4.2 Objective 2
The objective was to determine the associated factors that contribute to turnover of
nurses in the public health facilities in the Khomas Region. The purpose of the
objective was to determine company reward or compensation practices; training and
development practices; promotional opportunities to previous job; recognition factors
by previous employer; work-related stress and previous job; leadership relationship
in the previous job; work environment factors at previous employment, and factors
relating to retaining nursing staff training and work environment that could
contribute to turnover of nurses in the public health facilities in the Khomas Region.
These factors results are presented below.
Company reward or compensation practices
Table 4.5 shows the results of these factors as follows:
Table 4.5: Respondents’ rating on company reward or compensation practices
STATEMENT /ITEM SA
F (%)
A
F (%)
N
F (%)
D
F (%)
SD
F (%)
Item 1: My previous employer took
pride in paying satisfactory salary
[PPS].
24(14.0) 36(21.1) 54(31.4) 38(22.1) 18(10.5)
Item 2: My previous employer really
cared about rewarding great
achievements [PGA]
27(15.7) 51(29.7) 40(32.3) 28(16.3) 26-(15.1)
Item 3: My employer valued the
well-being of employees, inform of
rewards [WR]
28(16.3) 41(23.8) 42(24.4) 39(22.7) 22(12.8)
Item 4: My employer strongly
considered salary increase annually
[SIA]
26(15.1) 32(18.6) 47(27.3) 37(21.5) 27(15.7)
Total 105 160 183 142 93
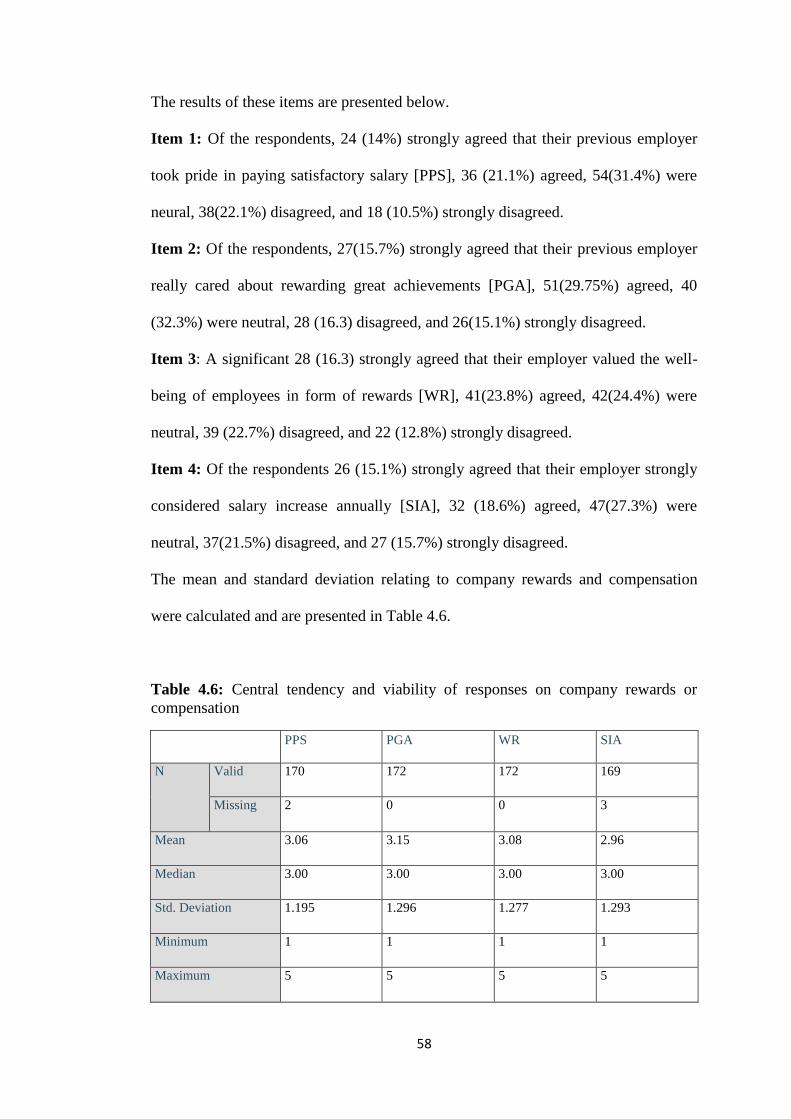
58
The results of these items are presented below.
Item 1: Of the respondents, 24 (14%) strongly agreed that their previous employer
took pride in paying satisfactory salary [PPS], 36 (21.1%) agreed, 54(31.4%) were
neural, 38(22.1%) disagreed, and 18 (10.5%) strongly disagreed.
Item 2: Of the respondents, 27(15.7%) strongly agreed that their previous employer
really cared about rewarding great achievements [PGA], 51(29.75%) agreed, 40
(32.3%) were neutral, 28 (16.3) disagreed, and 26(15.1%) strongly disagreed.
Item 3: A significant 28 (16.3) strongly agreed that their employer valued the well-
being of employees in form of rewards [WR], 41(23.8%) agreed, 42(24.4%) were
neutral, 39 (22.7%) disagreed, and 22 (12.8%) strongly disagreed.
Item 4: Of the respondents 26 (15.1%) strongly agreed that their employer strongly
considered salary increase annually [SIA], 32 (18.6%) agreed, 47(27.3%) were
neutral, 37(21.5%) disagreed, and 27 (15.7%) strongly disagreed.
The mean and standard deviation relating to company rewards and compensation
were calculated and are presented in Table 4.6.
Table 4.6: Central tendency and viability of responses on company rewards or
compensation
PPS PGA WR SIA
N Valid 170 172 172 169
Missing 2 0 0 3
Mean 3.06 3.15 3.08 2.96
Median 3.00 3.00 3.00 3.00
Std. Deviation 1.195 1.296 1.277 1.293
Minimum 1 1 1 1
Maximum 5 5 5 5
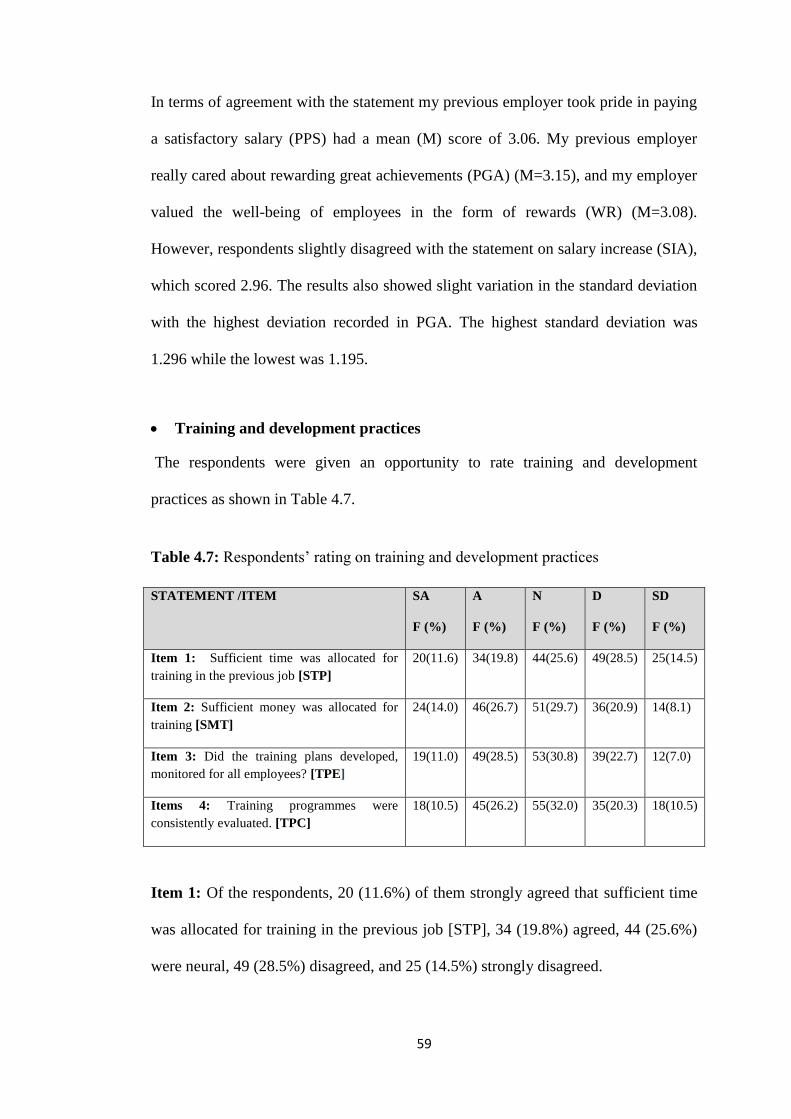
59
In terms of agreement with the statement my previous employer took pride in paying
a satisfactory salary (PPS) had a mean (M) score of 3.06. My previous employer
really cared about rewarding great achievements (PGA) (M=3.15), and my employer
valued the well-being of employees in the form of rewards (WR) (M=3.08).
However, respondents slightly disagreed with the statement on salary increase (SIA),
which scored 2.96. The results also showed slight variation in the standard deviation
with the highest deviation recorded in PGA. The highest standard deviation was
1.296 while the lowest was 1.195.
Training and development practices
The respondents were given an opportunity to rate training and development
practices as shown in Table 4.7.
Table 4.7: Respondents’ rating on training and development practices
STATEMENT /ITEM SA
F (%)
A
F (%)
N
F (%)
D
F (%)
SD
F (%)
Item 1: Sufficient time was allocated for
training in the previous job [STP]
20(11.6) 34(19.8) 44(25.6) 49(28.5) 25(14.5)
Item 2: Sufficient money was allocated for
training [SMT]
24(14.0) 46(26.7) 51(29.7) 36(20.9) 14(8.1)
Item 3: Did the training plans developed,
monitored for all employees? [TPE]
19(11.0) 49(28.5) 53(30.8) 39(22.7) 12(7.0)
Items 4: Training programmes were
consistently evaluated. [TPC]
18(10.5) 45(26.2) 55(32.0) 35(20.3) 18(10.5)
Item 1: Of the respondents, 20 (11.6%) of them strongly agreed that sufficient time
was allocated for training in the previous job [STP], 34 (19.8%) agreed, 44 (25.6%)
were neural, 49 (28.5%) disagreed, and 25 (14.5%) strongly disagreed.
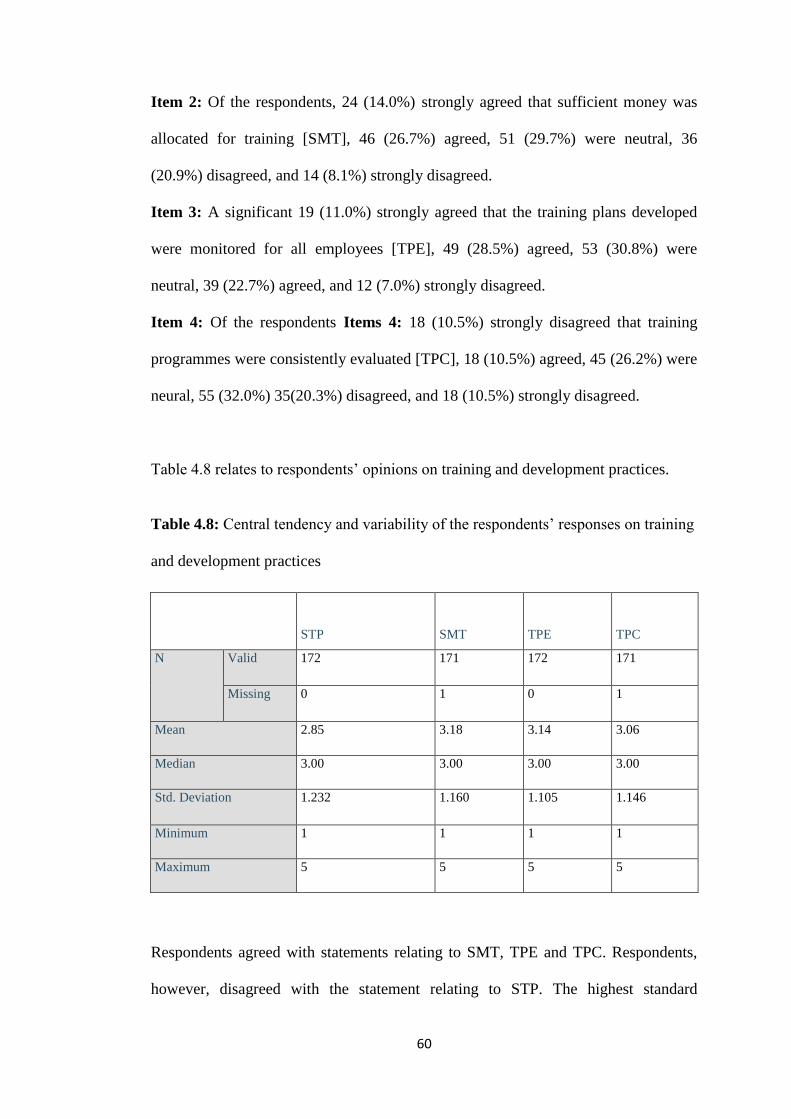
60
Item 2: Of the respondents, 24 (14.0%) strongly agreed that sufficient money was
allocated for training [SMT], 46 (26.7%) agreed, 51 (29.7%) were neutral, 36
(20.9%) disagreed, and 14 (8.1%) strongly disagreed.
Item 3: A significant 19 (11.0%) strongly agreed that the training plans developed
were monitored for all employees [TPE], 49 (28.5%) agreed, 53 (30.8%) were
neutral, 39 (22.7%) agreed, and 12 (7.0%) strongly disagreed.
Item 4: Of the respondents Items 4: 18 (10.5%) strongly disagreed that training
programmes were consistently evaluated [TPC], 18 (10.5%) agreed, 45 (26.2%) were
neural, 55 (32.0%) 35(20.3%) disagreed, and 18 (10.5%) strongly disagreed.
Table 4.8 relates to respondents’ opinions on training and development practices.
Table 4.8: Central tendency and variability of the respondents’ responses on training
and development practices
STP SMT TPE TPC
N Valid 172 171 172 171
Missing 0 1 0 1
Mean 2.85 3.18 3.14 3.06
Median 3.00 3.00 3.00 3.00
Std. Deviation 1.232 1.160 1.105 1.146
Minimum 1 1 1 1
Maximum 5 5 5 5
Respondents agreed with statements relating to SMT, TPE and TPC. Respondents,
however, disagreed with the statement relating to STP. The highest standard
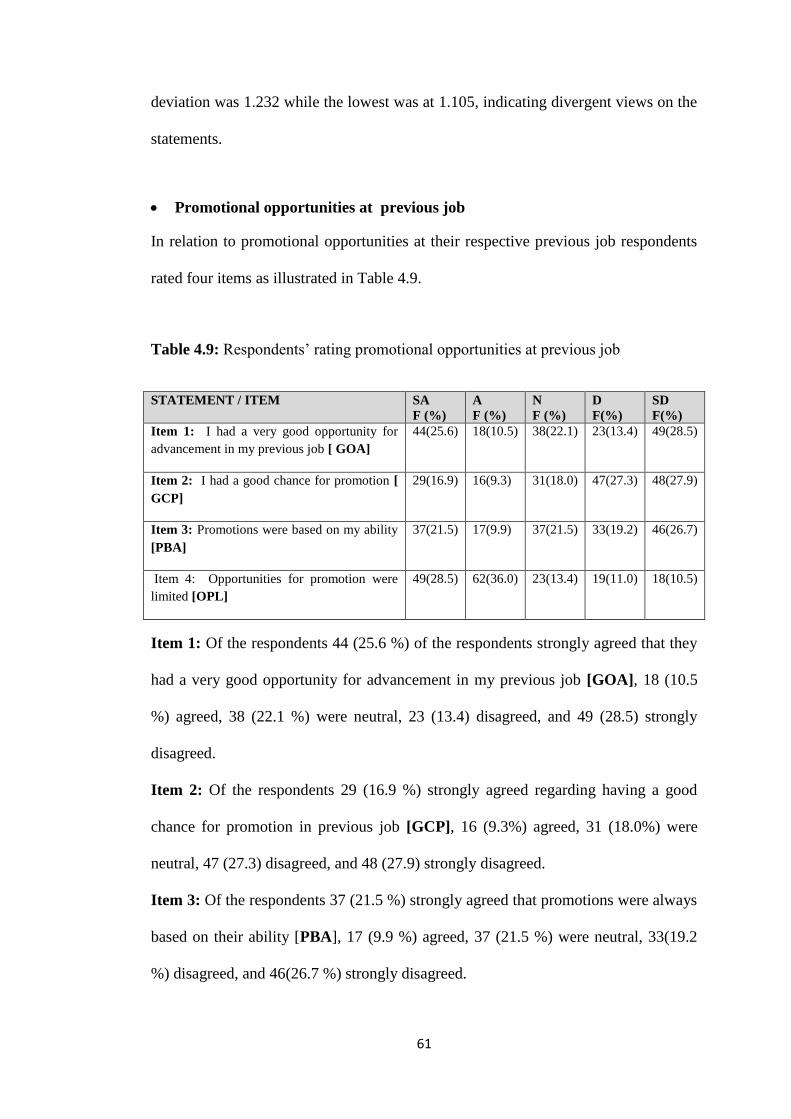
61
deviation was 1.232 while the lowest was at 1.105, indicating divergent views on the
statements.
Promotional opportunities at previous job
In relation to promotional opportunities at their respective previous job respondents
rated four items as illustrated in Table 4.9.
Table 4.9: Respondents’ rating promotional opportunities at previous job
STATEMENT / ITEM SA
F (%)
A
F (%)
N
F (%)
D
F(%)
SD
F(%)
Item 1: I had a very good opportunity for
advancement in my previous job [ GOA]
44(25.6) 18(10.5) 38(22.1) 23(13.4) 49(28.5)
Item 2: I had a good chance for promotion [
GCP]
29(16.9) 16(9.3) 31(18.0) 47(27.3) 48(27.9)
Item 3: Promotions were based on my ability
[PBA]
37(21.5) 17(9.9) 37(21.5) 33(19.2) 46(26.7)
Item 4: Opportunities for promotion were
limited [OPL]
49(28.5) 62(36.0) 23(13.4) 19(11.0) 18(10.5)
Item 1: Of the respondents 44 (25.6 %) of the respondents strongly agreed that they
had a very good opportunity for advancement in my previous job [GOA], 18 (10.5
%) agreed, 38 (22.1 %) were neutral, 23 (13.4) disagreed, and 49 (28.5) strongly
disagreed.
Item 2: Of the respondents 29 (16.9 %) strongly agreed regarding having a good
chance for promotion in previous job [GCP], 16 (9.3%) agreed, 31 (18.0%) were
neutral, 47 (27.3) disagreed, and 48 (27.9) strongly disagreed.
Item 3: Of the respondents 37 (21.5 %) strongly agreed that promotions were always
based on their ability [PBA], 17 (9.9 %) agreed, 37 (21.5 %) were neutral, 33(19.2
%) disagreed, and 46(26.7 %) strongly disagreed.
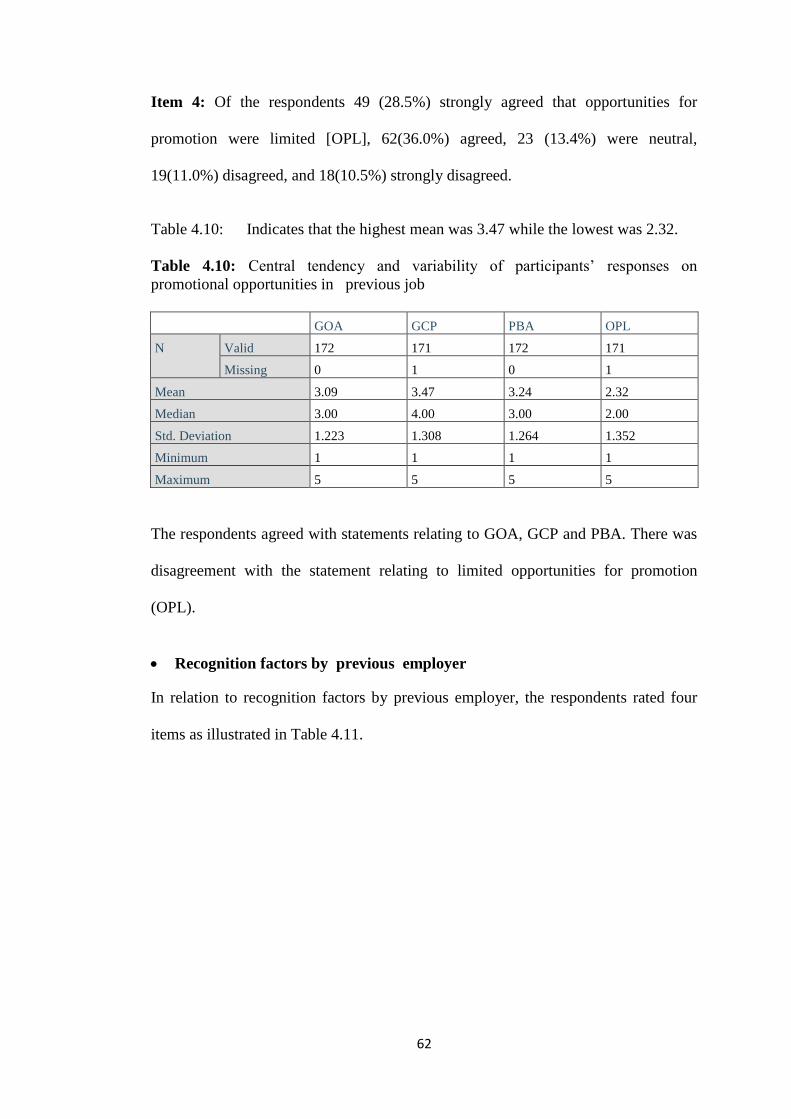
62
Item 4: Of the respondents 49 (28.5%) strongly agreed that opportunities for
promotion were limited [OPL], 62(36.0%) agreed, 23 (13.4%) were neutral,
19(11.0%) disagreed, and 18(10.5%) strongly disagreed.
Table 4.10: Indicates that the highest mean was 3.47 while the lowest was 2.32.
Table 4.10: Central tendency and variability of participants’ responses on
promotional opportunities in previous job
GOA GCP PBA OPL
N Valid 172 171 172 171
Missing 0 1 0 1
Mean 3.09 3.47 3.24 2.32
Median 3.00 4.00 3.00 2.00
Std. Deviation 1.223 1.308 1.264 1.352
Minimum 1 1 1 1
Maximum 5 5 5 5
The respondents agreed with statements relating to GOA, GCP and PBA. There was
disagreement with the statement relating to limited opportunities for promotion
(OPL).
Recognition factors by previous employer
In relation to recognition factors by previous employer, the respondents rated four
items as illustrated in Table 4.11.
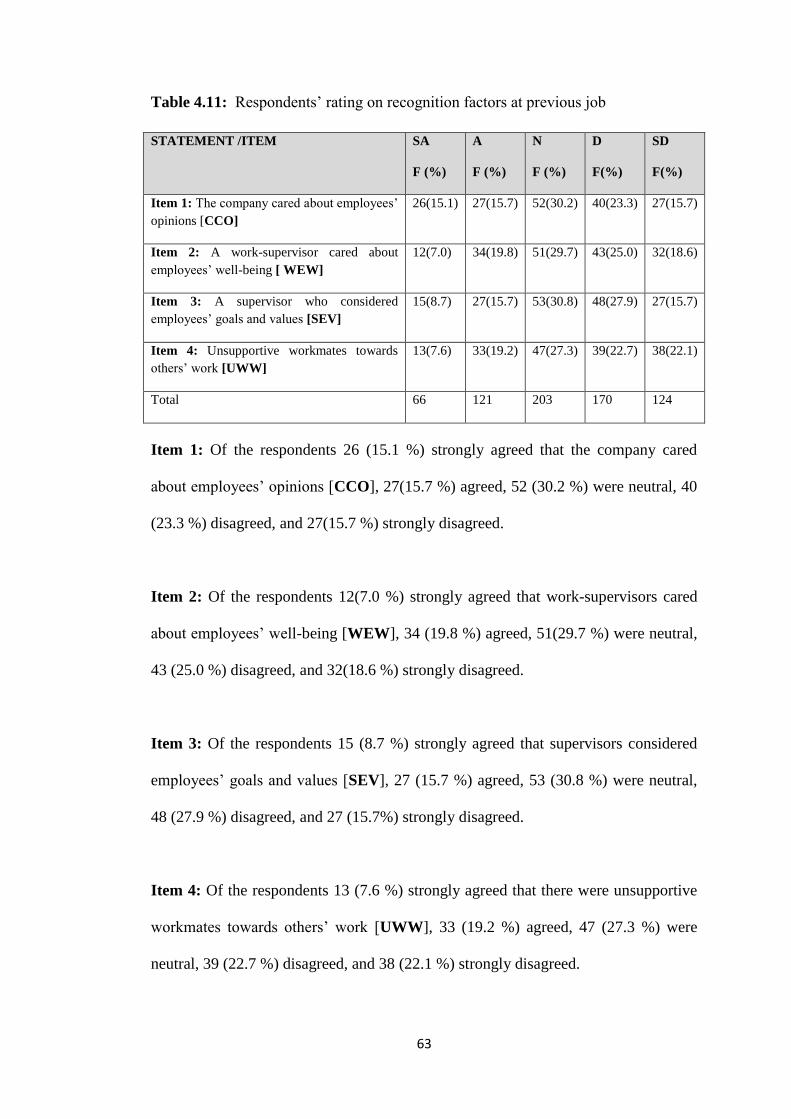
63
Table 4.11: Respondents’ rating on recognition factors at previous job
STATEMENT /ITEM SA
F (%)
A
F (%)
N
F (%)
D
F(%)
SD
F(%)
Item 1: The company cared about employees’
opinions [CCO]
26(15.1) 27(15.7) 52(30.2) 40(23.3) 27(15.7)
Item 2: A work-supervisor cared about
employees’ well-being [ WEW]
12(7.0) 34(19.8) 51(29.7) 43(25.0) 32(18.6)
Item 3: A supervisor who considered
employees’ goals and values [SEV]
15(8.7) 27(15.7) 53(30.8) 48(27.9) 27(15.7)
Item 4: Unsupportive workmates towards
others’ work [UWW]
13(7.6) 33(19.2) 47(27.3) 39(22.7) 38(22.1)
Total 66 121 203 170 124
Item 1: Of the respondents 26 (15.1 %) strongly agreed that the company cared
about employees’ opinions [CCO], 27(15.7 %) agreed, 52 (30.2 %) were neutral, 40
(23.3 %) disagreed, and 27(15.7 %) strongly disagreed.
Item 2: Of the respondents 12(7.0 %) strongly agreed that work-supervisors cared
about employees’ well-being [WEW], 34 (19.8 %) agreed, 51(29.7 %) were neutral,
43 (25.0 %) disagreed, and 32(18.6 %) strongly disagreed.
Item 3: Of the respondents 15 (8.7 %) strongly agreed that supervisors considered
employees’ goals and values [SEV], 27 (15.7 %) agreed, 53 (30.8 %) were neutral,
48 (27.9 %) disagreed, and 27 (15.7%) strongly disagreed.
Item 4: Of the respondents 13 (7.6 %) strongly agreed that there were unsupportive
workmates towards others’ work [UWW], 33 (19.2 %) agreed, 47 (27.3 %) were
neutral, 39 (22.7 %) disagreed, and 38 (22.1 %) strongly disagreed.
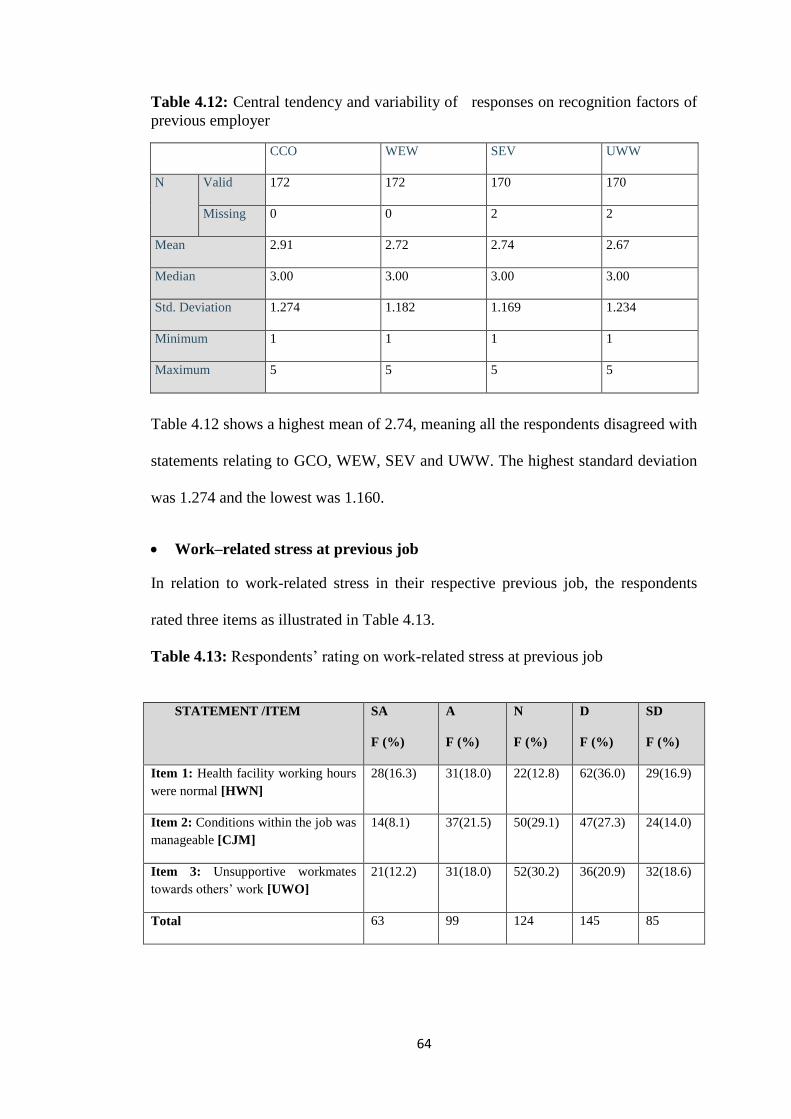
64
Table 4.12: Central tendency and variability of responses on recognition factors of
previous employer
CCO WEW SEV UWW
N Valid 172 172 170 170
Missing 0 0 2 2
Mean 2.91 2.72 2.74 2.67
Median 3.00 3.00 3.00 3.00
Std. Deviation 1.274 1.182 1.169 1.234
Minimum 1 1 1 1
Maximum 5 5 5 5
Table 4.12 shows a highest mean of 2.74, meaning all the respondents disagreed with
statements relating to GCO, WEW, SEV and UWW. The highest standard deviation
was 1.274 and the lowest was 1.160.
Work–related stress at previous job
In relation to work-related stress in their respective previous job, the respondents
rated three items as illustrated in Table 4.13.
Table 4.13: Respondents’ rating on work-related stress at previous job
STATEMENT /ITEM SA
F (%)
A
F (%)
N
F (%)
D
F (%)
SD
F (%)
Item 1: Health facility working hours
were normal [HWN]
28(16.3) 31(18.0) 22(12.8) 62(36.0) 29(16.9)
Item 2: Conditions within the job was
manageable [CJM]
14(8.1) 37(21.5) 50(29.1) 47(27.3) 24(14.0)
Item 3: Unsupportive workmates
towards others’ work [UWO]
21(12.2) 31(18.0) 52(30.2) 36(20.9) 32(18.6)
Total 63 99 124 145 85
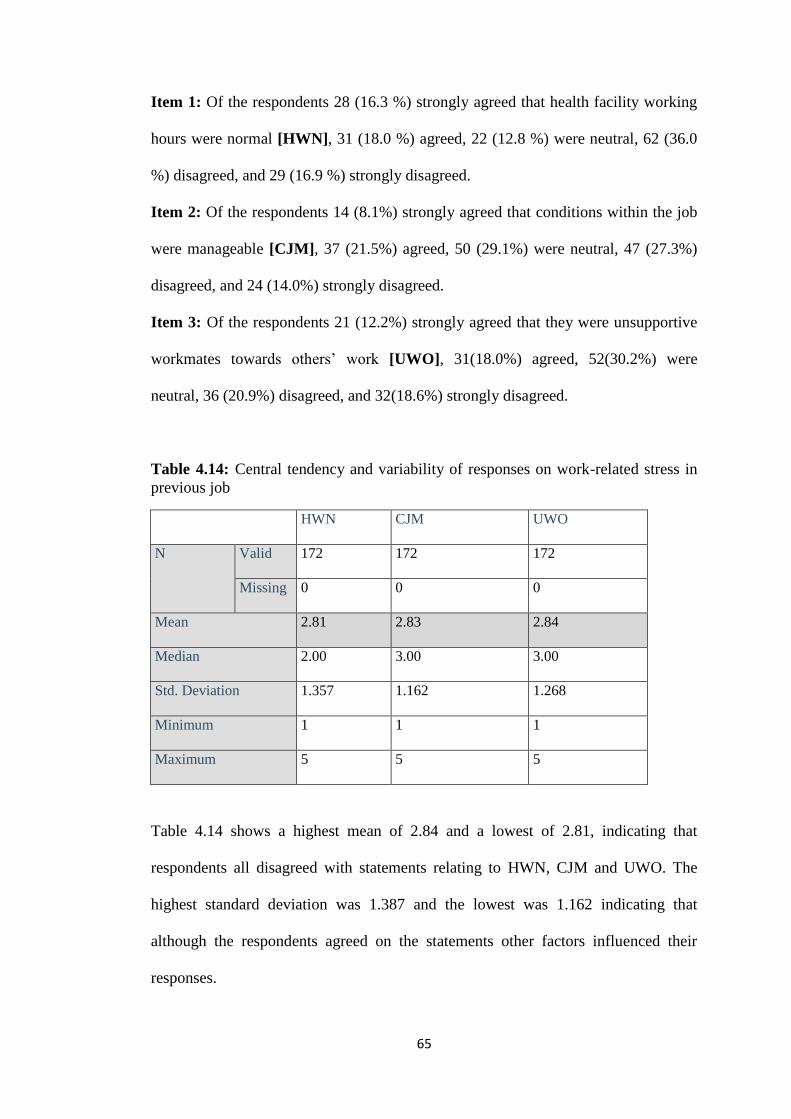
65
Item 1: Of the respondents 28 (16.3 %) strongly agreed that health facility working
hours were normal [HWN], 31 (18.0 %) agreed, 22 (12.8 %) were neutral, 62 (36.0
%) disagreed, and 29 (16.9 %) strongly disagreed.
Item 2: Of the respondents 14 (8.1%) strongly agreed that conditions within the job
were manageable [CJM], 37 (21.5%) agreed, 50 (29.1%) were neutral, 47 (27.3%)
disagreed, and 24 (14.0%) strongly disagreed.
Item 3: Of the respondents 21 (12.2%) strongly agreed that they were unsupportive
workmates towards others’ work [UWO], 31(18.0%) agreed, 52(30.2%) were
neutral, 36 (20.9%) disagreed, and 32(18.6%) strongly disagreed.
Table 4.14: Central tendency and variability of responses on work-related stress in
previous job
HWN CJM UWO
N Valid 172 172 172
Missing 0 0 0
Mean 2.81 2.83 2.84
Median 2.00 3.00 3.00
Std. Deviation 1.357 1.162 1.268
Minimum 1 1 1
Maximum 5 5 5
Table 4.14 shows a highest mean of 2.84 and a lowest of 2.81, indicating that
respondents all disagreed with statements relating to HWN, CJM and UWO. The
highest standard deviation was 1.387 and the lowest was 1.162 indicating that
although the respondents agreed on the statements other factors influenced their
responses.
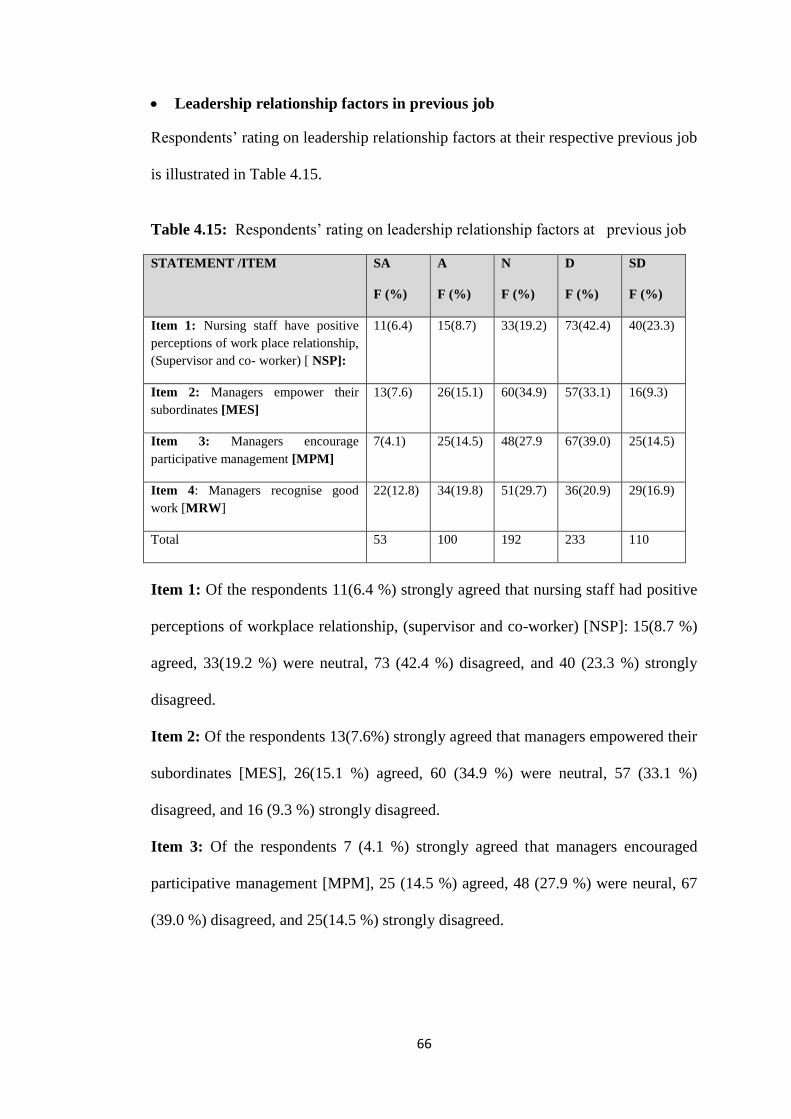
66
Leadership relationship factors in previous job
Respondents’ rating on leadership relationship factors at their respective previous job
is illustrated in Table 4.15.
Table 4.15: Respondents’ rating on leadership relationship factors at previous job
STATEMENT /ITEM SA
F (%)
A
F (%)
N
F (%)
D
F (%)
SD
F (%)
Item 1: Nursing staff have positive
perceptions of work place relationship,
(Supervisor and co- worker) [ NSP]:
11(6.4) 15(8.7) 33(19.2) 73(42.4) 40(23.3)
Item 2: Managers empower their
subordinates [MES]
13(7.6) 26(15.1) 60(34.9) 57(33.1) 16(9.3)
Item 3: Managers encourage
participative management [MPM]
7(4.1) 25(14.5) 48(27.9 67(39.0) 25(14.5)
Item 4: Managers recognise good
work [MRW]
22(12.8) 34(19.8) 51(29.7) 36(20.9) 29(16.9)
Total 53 100 192 233 110
Item 1: Of the respondents 11(6.4 %) strongly agreed that nursing staff had positive
perceptions of workplace relationship, (supervisor and co-worker) [NSP]: 15(8.7 %)
agreed, 33(19.2 %) were neutral, 73 (42.4 %) disagreed, and 40 (23.3 %) strongly
disagreed.
Item 2: Of the respondents 13(7.6%) strongly agreed that managers empowered their
subordinates [MES], 26(15.1 %) agreed, 60 (34.9 %) were neutral, 57 (33.1 %)
disagreed, and 16 (9.3 %) strongly disagreed.
Item 3: Of the respondents 7 (4.1 %) strongly agreed that managers encouraged
participative management [MPM], 25 (14.5 %) agreed, 48 (27.9 %) were neural, 67
(39.0 %) disagreed, and 25(14.5 %) strongly disagreed.
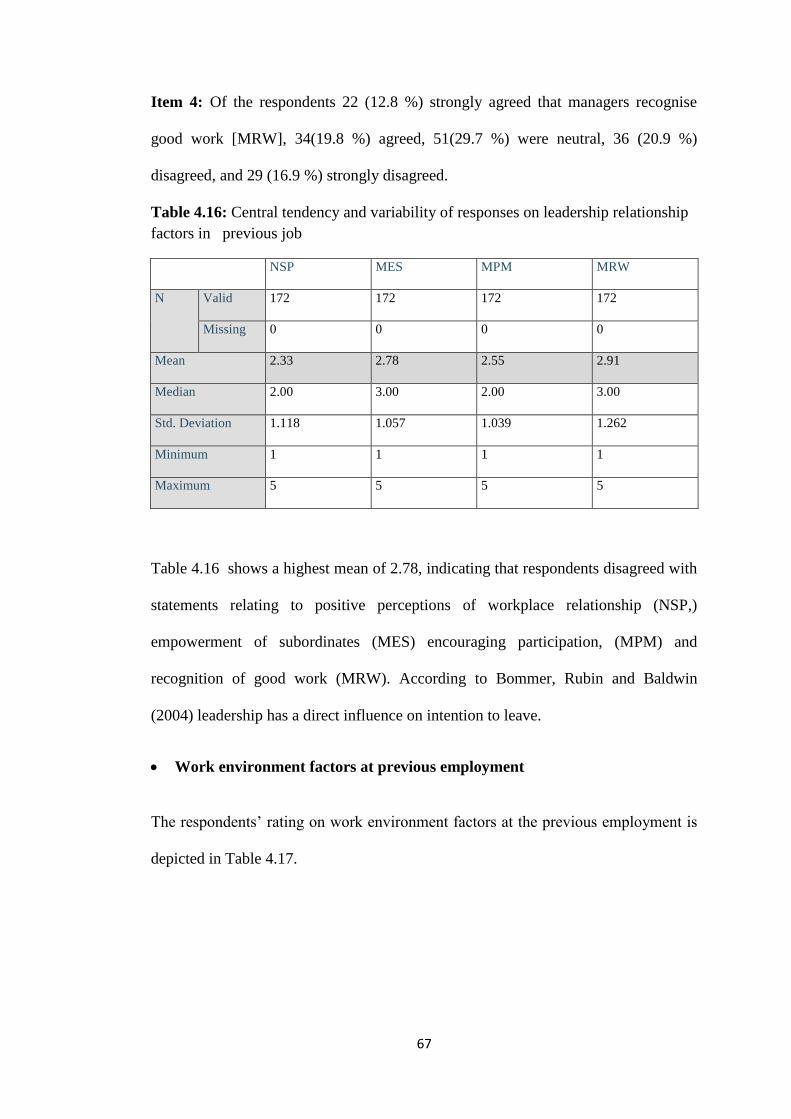
67
Item 4: Of the respondents 22 (12.8 %) strongly agreed that managers recognise
good work [MRW], 34(19.8 %) agreed, 51(29.7 %) were neutral, 36 (20.9 %)
disagreed, and 29 (16.9 %) strongly disagreed.
Table 4.16: Central tendency and variability of responses on leadership relationship
factors in previous job
NSP MES MPM MRW
N Valid 172 172 172 172
Missing 0 0 0 0
Mean 2.33 2.78 2.55 2.91
Median 2.00 3.00 2.00 3.00
Std. Deviation 1.118 1.057 1.039 1.262
Minimum 1 1 1 1
Maximum 5 5 5 5
Table 4.16 shows a highest mean of 2.78, indicating that respondents disagreed with
statements relating to positive perceptions of workplace relationship (NSP,)
empowerment of subordinates (MES) encouraging participation, (MPM) and
recognition of good work (MRW). According to Bommer, Rubin and Baldwin
(2004) leadership has a direct influence on intention to leave.
Work environment factors at previous employment
The respondents’ rating on work environment factors at the previous employment is
depicted in Table 4.17.
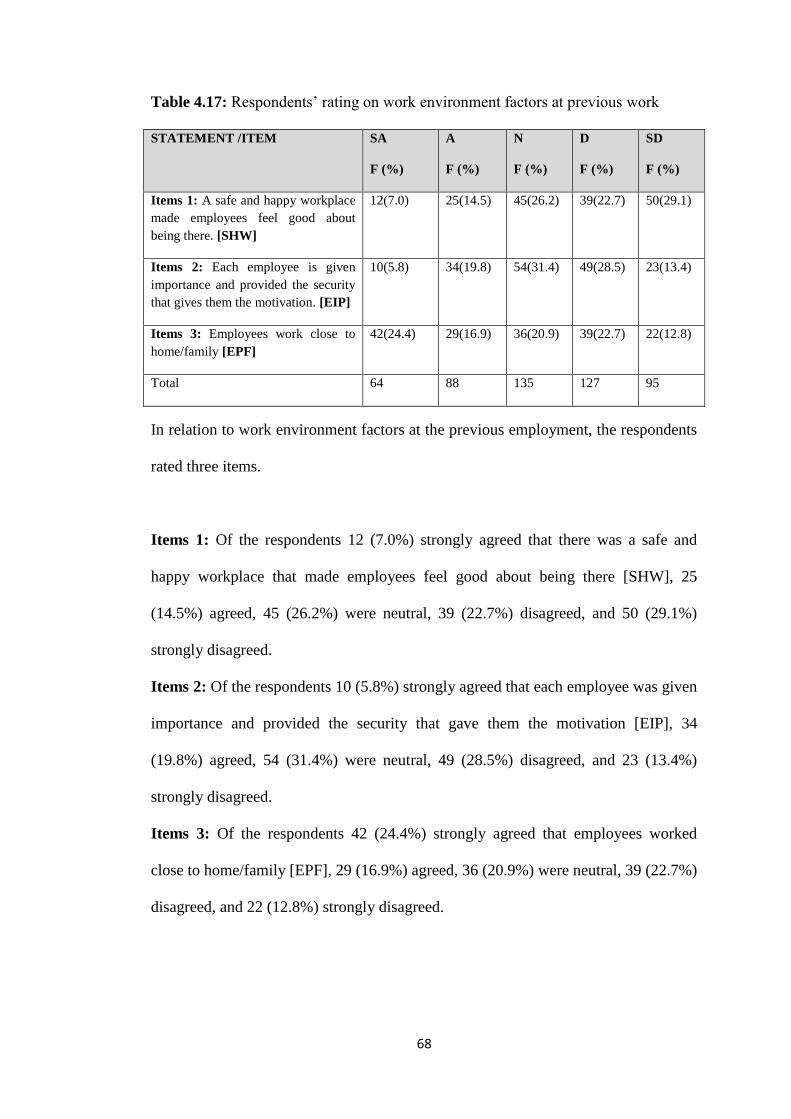
68
Table 4.17: Respondents’ rating on work environment factors at previous work
STATEMENT /ITEM SA
F (%)
A
F (%)
N
F (%)
D
F (%)
SD
F (%)
Items 1: A safe and happy workplace
made employees feel good about
being there. [SHW]
12(7.0) 25(14.5) 45(26.2) 39(22.7) 50(29.1)
Items 2: Each employee is given
importance and provided the security
that gives them the motivation. [EIP]
10(5.8) 34(19.8) 54(31.4) 49(28.5) 23(13.4)
Items 3: Employees work close to
home/family [EPF]
42(24.4) 29(16.9) 36(20.9) 39(22.7) 22(12.8)
Total 64 88 135 127 95
In relation to work environment factors at the previous employment, the respondents
rated three items.
Items 1: Of the respondents 12 (7.0%) strongly agreed that there was a safe and
happy workplace that made employees feel good about being there [SHW], 25
(14.5%) agreed, 45 (26.2%) were neutral, 39 (22.7%) disagreed, and 50 (29.1%)
strongly disagreed.
Items 2: Of the respondents 10 (5.8%) strongly agreed that each employee was given
importance and provided the security that gave them the motivation [EIP], 34
(19.8%) agreed, 54 (31.4%) were neutral, 49 (28.5%) disagreed, and 23 (13.4%)
strongly disagreed.
Items 3: Of the respondents 42 (24.4%) strongly agreed that employees worked
close to home/family [EPF], 29 (16.9%) agreed, 36 (20.9%) were neutral, 39 (22.7%)
disagreed, and 22 (12.8%) strongly disagreed.
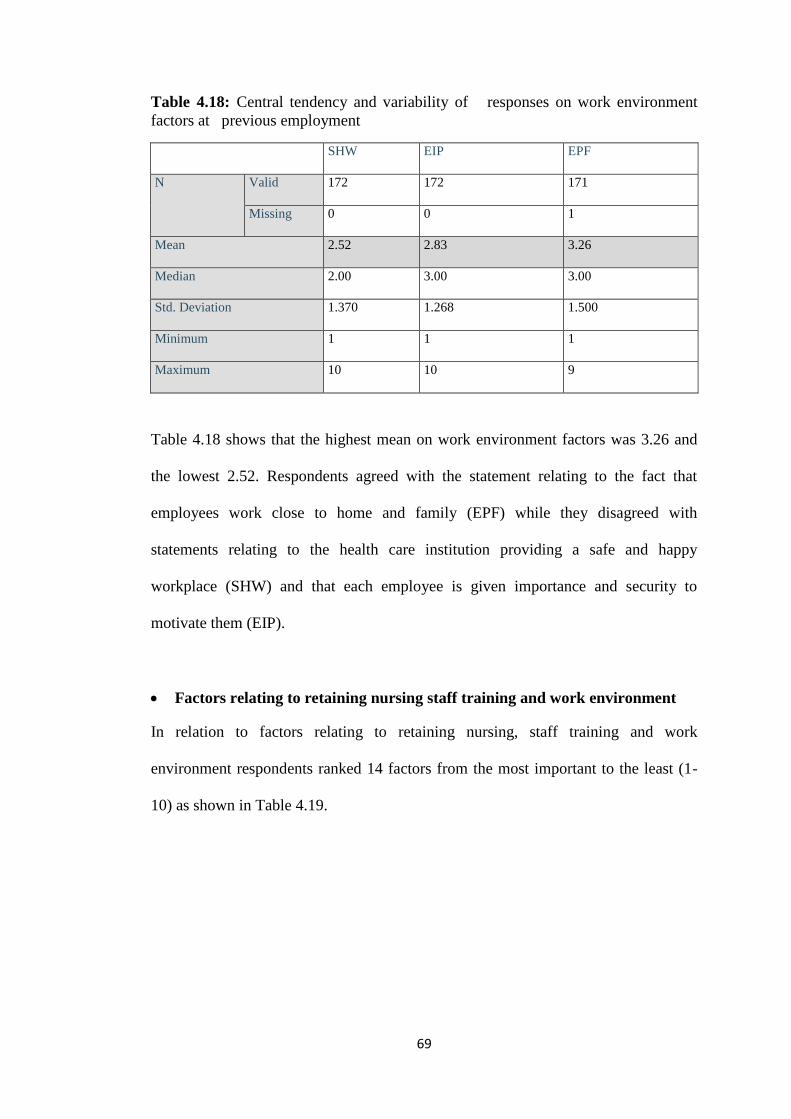
69
Table 4.18: Central tendency and variability of responses on work environment
factors at previous employment
SHW EIP EPF
N Valid 172 172 171
Missing 0 0 1
Mean 2.52 2.83 3.26
Median 2.00 3.00 3.00
Std. Deviation 1.370 1.268 1.500
Minimum 1 1 1
Maximum 10 10 9
Table 4.18 shows that the highest mean on work environment factors was 3.26 and
the lowest 2.52. Respondents agreed with the statement relating to the fact that
employees work close to home and family (EPF) while they disagreed with
statements relating to the health care institution providing a safe and happy
workplace (SHW) and that each employee is given importance and security to
motivate them (EIP).
Factors relating to retaining nursing staff training and work environment
In relation to factors relating to retaining nursing, staff training and work
environment respondents ranked 14 factors from the most important to the least (1-
10) as shown in Table 4.19.
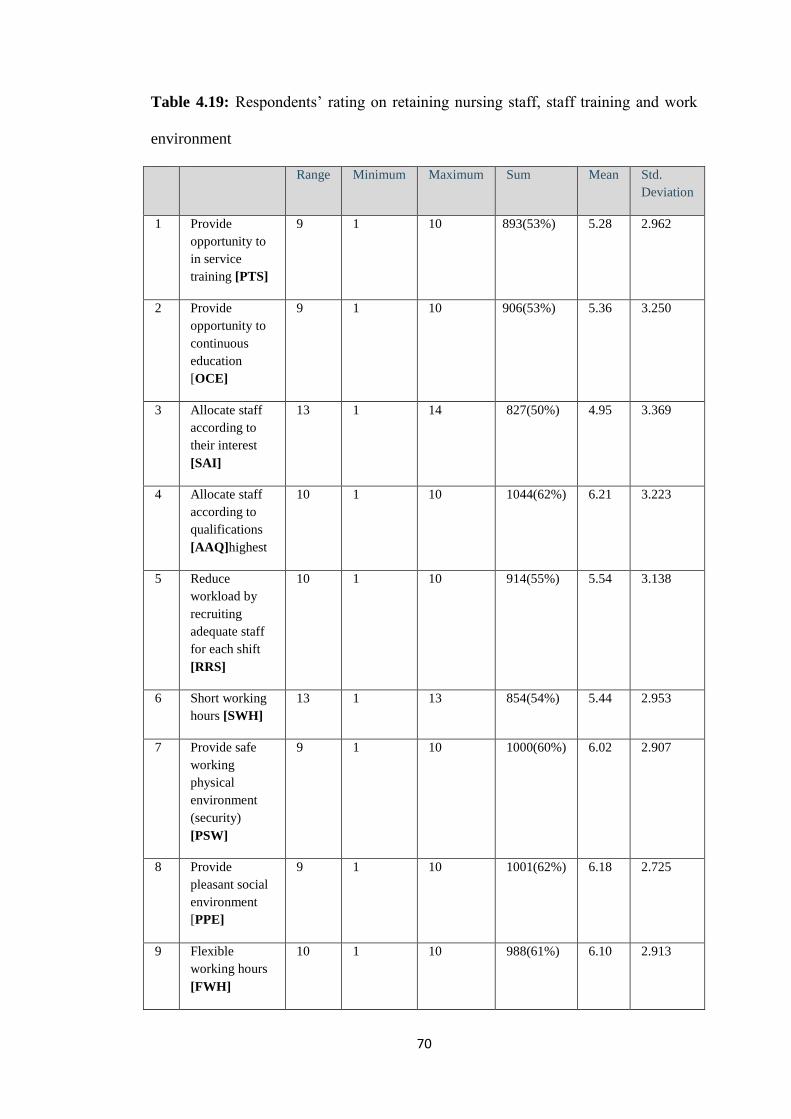
70
Table 4.19: Respondents’ rating on retaining nursing staff, staff training and work
environment
Range Minimum Maximum Sum Mean Std.
Deviation
1 Provide
opportunity to
in service
training [PTS]
9 1 10 893(53%) 5.28 2.962
2 Provide
opportunity to
continuous
education
[OCE]
9 1 10 906(53%) 5.36 3.250
3 Allocate staff
according to
their interest
[SAI]
13 1 14 827(50%) 4.95 3.369
4 Allocate staff
according to
qualifications
[AAQ]highest
10 1 10 1044(62%) 6.21 3.223
5 Reduce
workload by
recruiting
adequate staff
for each shift
[RRS]
10 1 10 914(55%) 5.54 3.138
6 Short working
hours [SWH]
13 1 13 854(54%) 5.44 2.953
7 Provide safe
working
physical
environment
(security)
[PSW]
9 1 10 1000(60%) 6.02 2.907
8 Provide
pleasant social
environment
[PPE]
9 1 10 1001(62%) 6.18 2.725
9 Flexible
working hours
[FWH]
10 1 10 988(61%) 6.10 2.913
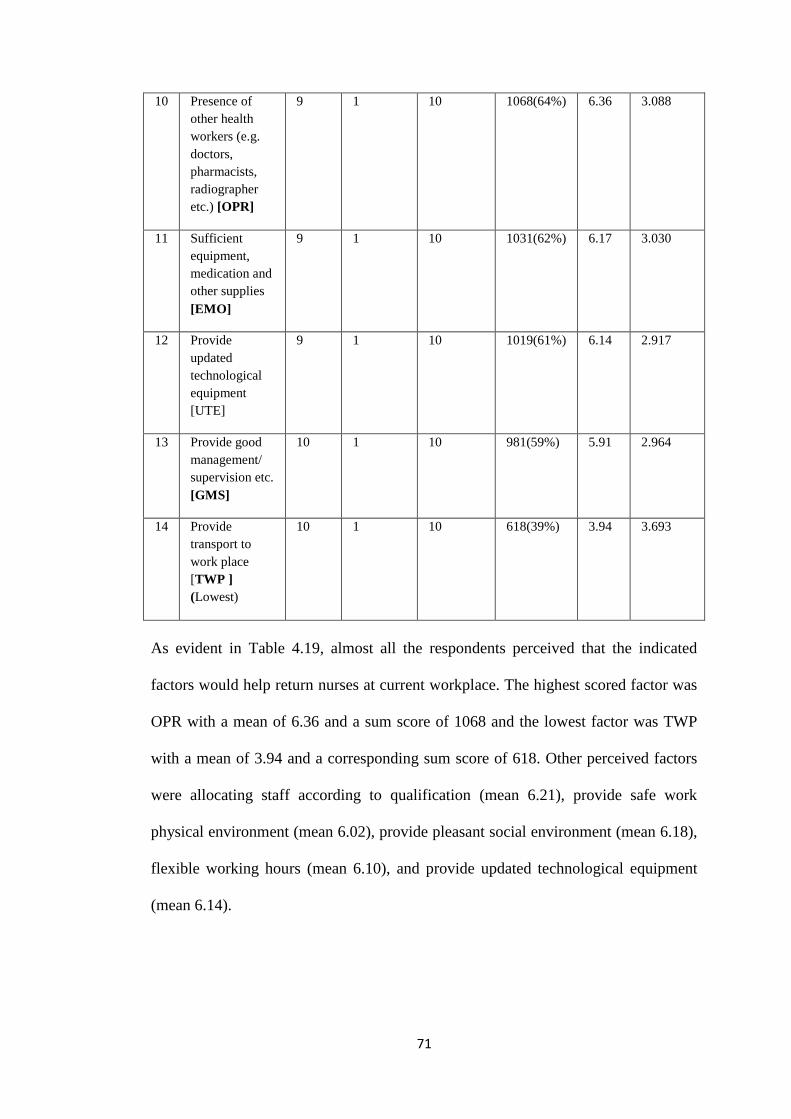
71
10 Presence of
other health
workers (e.g.
doctors,
pharmacists,
radiographer
etc.) [OPR]
9 1 10 1068(64%) 6.36 3.088
11 Sufficient
equipment,
medication and
other supplies
[EMO]
9 1 10 1031(62%) 6.17 3.030
12 Provide
updated
technological
equipment
[UTE]
9 1 10 1019(61%) 6.14 2.917
13 Provide good
management/
supervision etc.
[GMS]
10 1 10 981(59%) 5.91 2.964
14 Provide
transport to
work place
[TWP ]
(Lowest)
10 1 10 618(39%) 3.94 3.693
As evident in Table 4.19, almost all the respondents perceived that the indicated
factors would help return nurses at current workplace. The highest scored factor was
OPR with a mean of 6.36 and a sum score of 1068 and the lowest factor was TWP
with a mean of 3.94 and a corresponding sum score of 618. Other perceived factors
were allocating staff according to qualification (mean 6.21), provide safe work
physical environment (mean 6.02), provide pleasant social environment (mean 6.18),
flexible working hours (mean 6.10), and provide updated technological equipment
(mean 6.14).
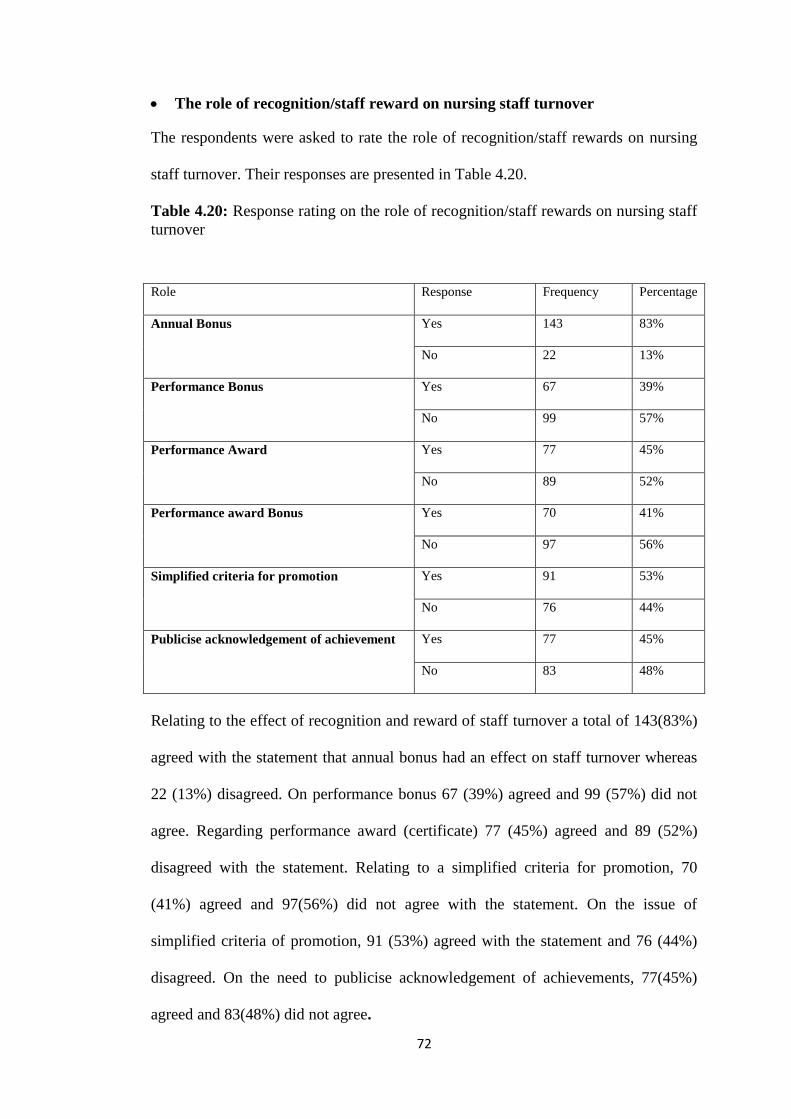
72
The role of recognition/staff reward on nursing staff turnover
The respondents were asked to rate the role of recognition/staff rewards on nursing
staff turnover. Their responses are presented in Table 4.20.
Table 4.20: Response rating on the role of recognition/staff rewards on nursing staff
turnover
Role Response Frequency Percentage
Annual Bonus Yes 143 83%
No 22 13%
Performance Bonus Yes 67 39%
No 99 57%
Performance Award Yes 77 45%
No 89 52%
Performance award Bonus Yes 70 41%
No 97 56%
Simplified criteria for promotion Yes 91 53%
No 76 44%
Publicise acknowledgement of achievement Yes 77 45%
No 83 48%
Relating to the effect of recognition and reward of staff turnover a total of 143(83%)
agreed with the statement that annual bonus had an effect on staff turnover whereas
22 (13%) disagreed. On performance bonus 67 (39%) agreed and 99 (57%) did not
agree. Regarding performance award (certificate) 77 (45%) agreed and 89 (52%)
disagreed with the statement. Relating to a simplified criteria for promotion, 70
(41%) agreed and 97(56%) did not agree with the statement. On the issue of
simplified criteria of promotion, 91 (53%) agreed with the statement and 76 (44%)
disagreed. On the need to publicise acknowledgement of achievements, 77(45%)
agreed and 83(48%) did not agree.
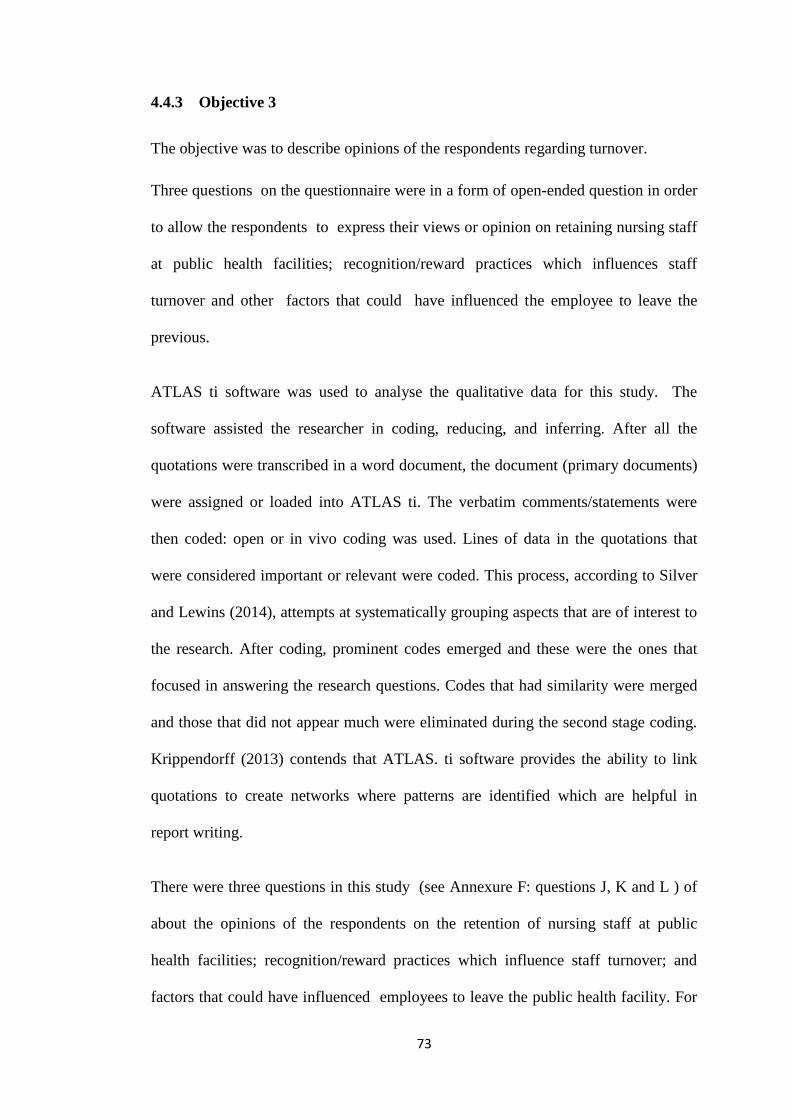
73
4.4.3 Objective 3
The objective was to describe opinions of the respondents regarding turnover.
Three questions on the questionnaire were in a form of open-ended question in order
to allow the respondents to express their views or opinion on retaining nursing staff
at public health facilities; recognition/reward practices which influences staff
turnover and other factors that could have influenced the employee to leave the
previous.
ATLAS ti software was used to analyse the qualitative data for this study. The
software assisted the researcher in coding, reducing, and inferring. After all the
quotations were transcribed in a word document, the document (primary documents)
were assigned or loaded into ATLAS ti. The verbatim comments/statements were
then coded: open or in vivo coding was used. Lines of data in the quotations that
were considered important or relevant were coded. This process, according to Silver
and Lewins (2014), attempts at systematically grouping aspects that are of interest to
the research. After coding, prominent codes emerged and these were the ones that
focused in answering the research questions. Codes that had similarity were merged
and those that did not appear much were eliminated during the second stage coding.
Krippendorff (2013) contends that ATLAS. ti software provides the ability to link
quotations to create networks where patterns are identified which are helpful in
report writing.
There were three questions in this study (see Annexure F: questions J, K and L ) of
about the opinions of the respondents on the retention of nursing staff at public
health facilities; recognition/reward practices which influence staff turnover; and
factors that could have influenced employees to leave the public health facility. For
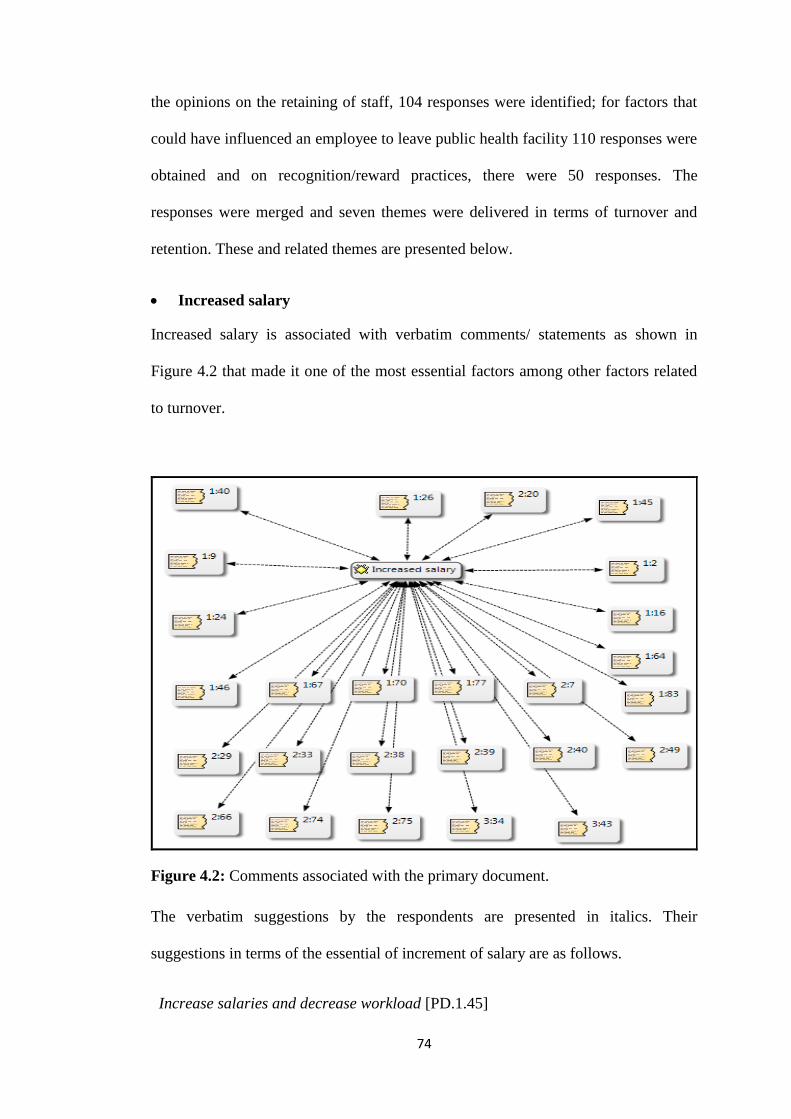
74
the opinions on the retaining of staff, 104 responses were identified; for factors that
could have influenced an employee to leave public health facility 110 responses were
obtained and on recognition/reward practices, there were 50 responses. The
responses were merged and seven themes were delivered in terms of turnover and
retention. These and related themes are presented below.
Increased salary
Increased salary is associated with verbatim comments/ statements as shown in
Figure 4.2 that made it one of the most essential factors among other factors related
to turnover.
Figure 4.2: Comments associated with the primary document.
The verbatim suggestions by the respondents are presented in italics. Their
suggestions in terms of the essential of increment of salary are as follows.
Increase salaries and decrease workload [PD.1.45]
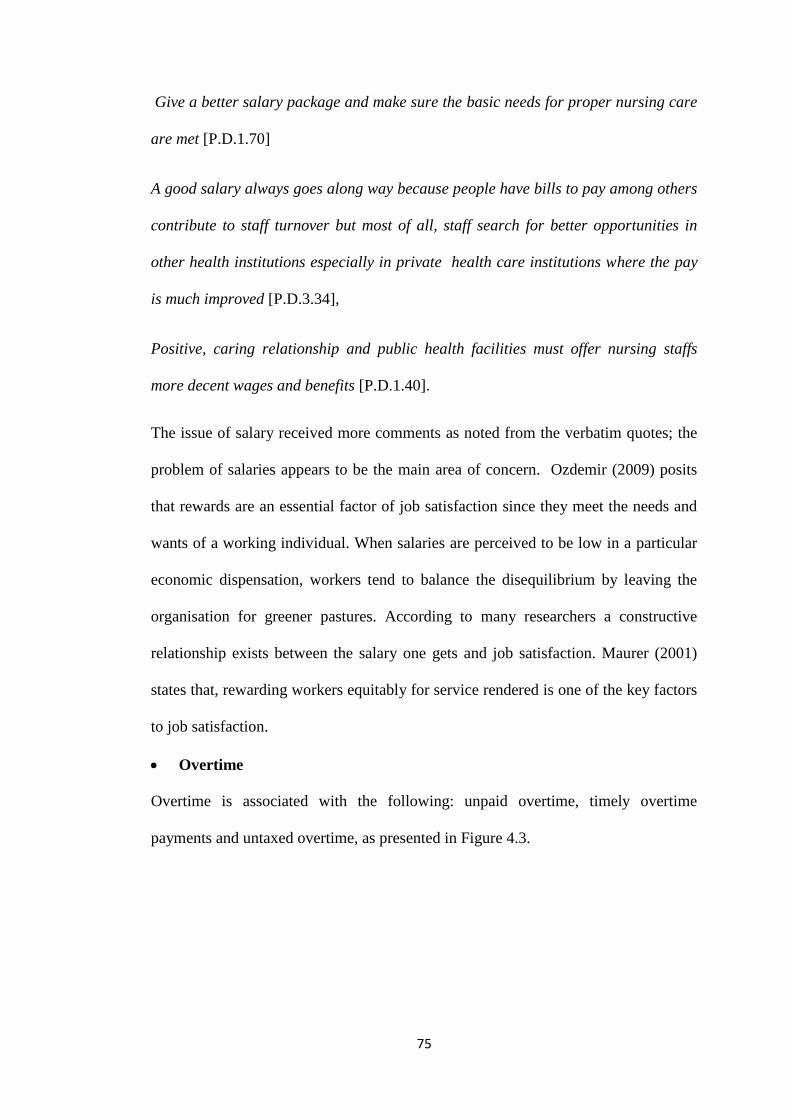
75
Give a better salary package and make sure the basic needs for proper nursing care
are met [P.D.1.70]
A good salary always goes along way because people have bills to pay among others
contribute to staff turnover but most of all, staff search for better opportunities in
other health institutions especially in private health care institutions where the pay
is much improved [P.D.3.34],
Positive, caring relationship and public health facilities must offer nursing staffs
more decent wages and benefits [P.D.1.40].
The issue of salary received more comments as noted from the verbatim quotes; the
problem of salaries appears to be the main area of concern. Ozdemir (2009) posits
that rewards are an essential factor of job satisfaction since they meet the needs and
wants of a working individual. When salaries are perceived to be low in a particular
economic dispensation, workers tend to balance the disequilibrium by leaving the
organisation for greener pastures. According to many researchers a constructive
relationship exists between the salary one gets and job satisfaction. Maurer (2001)
states that, rewarding workers equitably for service rendered is one of the key factors
to job satisfaction.
Overtime
Overtime is associated with the following: unpaid overtime, timely overtime
payments and untaxed overtime, as presented in Figure 4.3.
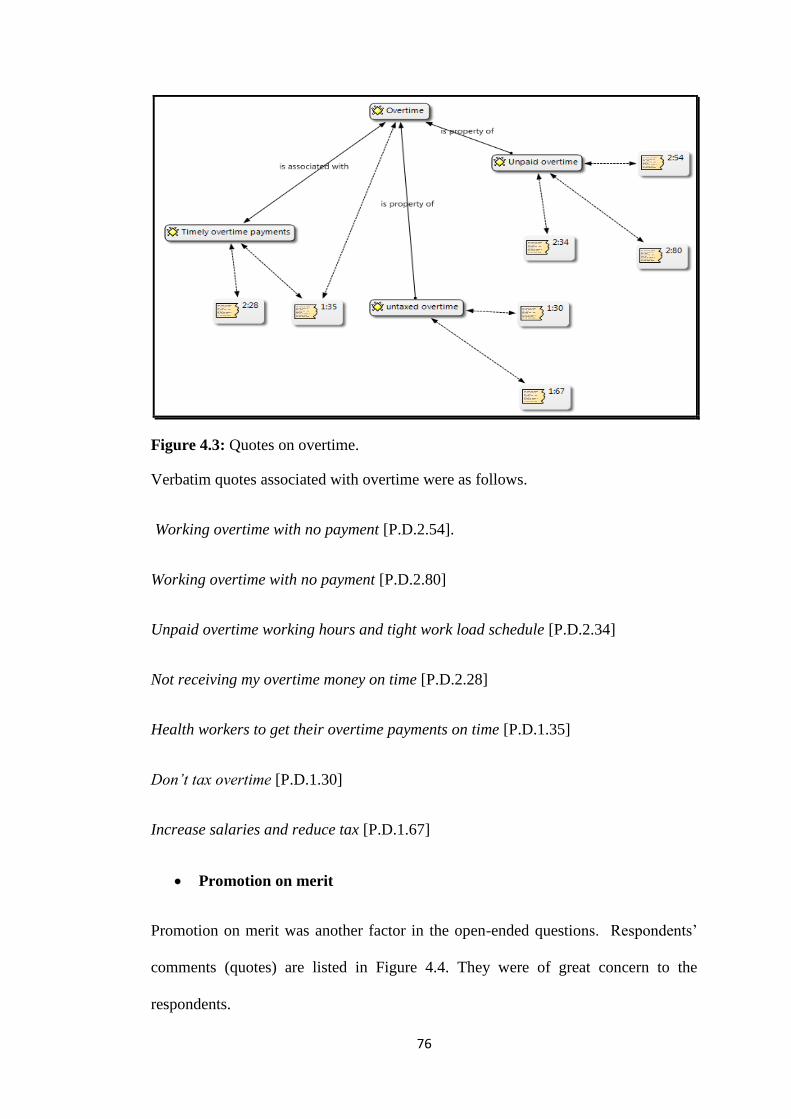
76
Figure 4.3: Quotes on overtime.
Verbatim quotes associated with overtime were as follows.
Working overtime with no payment [P.D.2.54].
Working overtime with no payment [P.D.2.80]
Unpaid overtime working hours and tight work load schedule [P.D.2.34]
Not receiving my overtime money on time [P.D.2.28]
Health workers to get their overtime payments on time [P.D.1.35]
Don’t tax overtime [P.D.1.30]
Increase salaries and reduce tax [P.D.1.67]
Promotion on merit
Promotion on merit was another factor in the open-ended questions. Respondents’
comments (quotes) are listed in Figure 4.4. They were of great concern to the
respondents.
77
Figure 4.4: Quotes on promotion on merit.
These are some quotes associated with promotion to be awarded on merit and not
based on favouritism.
Introduce a promotion system [P.D.1.62]
Promote old staffs according to experience but not according to qualification
[P.D.1.22]
Promote old staff according to their experience [P.D.1.75]
The government should interview candidates for promotion to avoid favouritism
[P.D.1.13]
Fair interviews for promotion [P.D.1.55]
Provide flexible working hours and promotions must be based on merit and
experience [P.D.1.56]
Promotion should be given to those who deserve it, no favouritism [P.D.1.91]
Favouritism as promotion is given to those who do not deserve it [P.D.2.21]
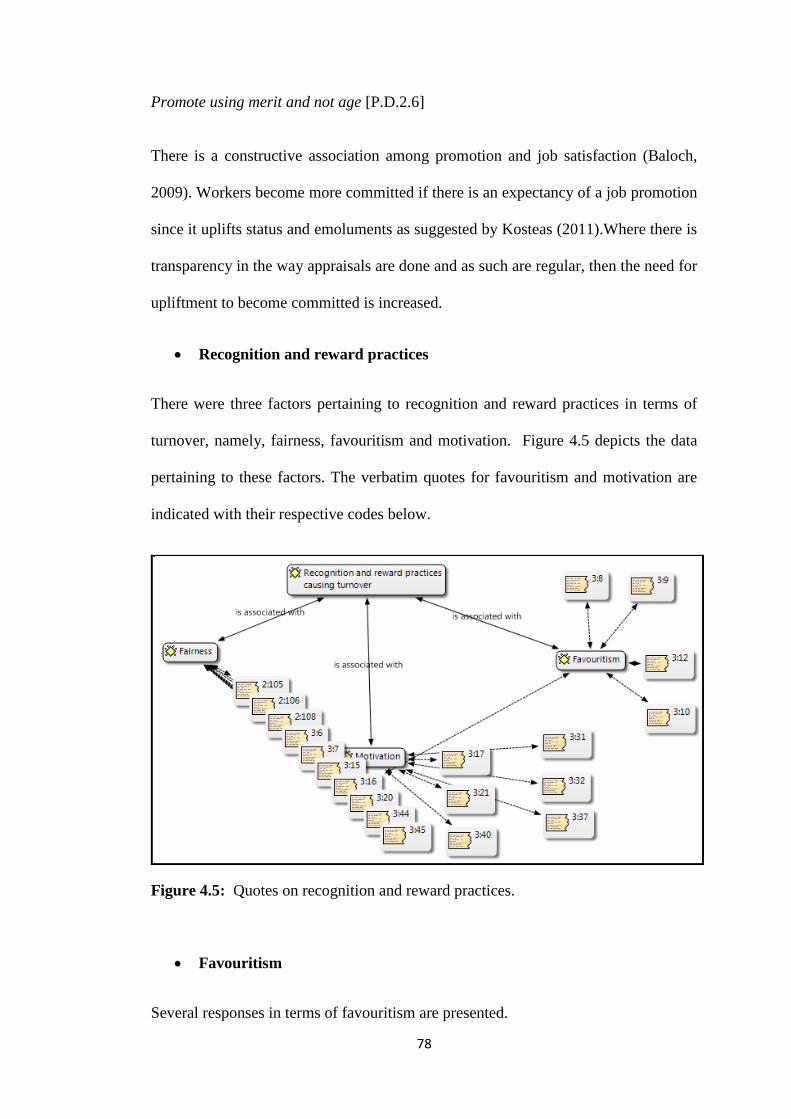
78
Promote using merit and not age [P.D.2.6]
There is a constructive association among promotion and job satisfaction (Baloch,
2009). Workers become more committed if there is an expectancy of a job promotion
since it uplifts status and emoluments as suggested by Kosteas (2011).Where there is
transparency in the way appraisals are done and as such are regular, then the need for
upliftment to become committed is increased.
Recognition and reward practices
There were three factors pertaining to recognition and reward practices in terms of
turnover, namely, fairness, favouritism and motivation. Figure 4.5 depicts the data
pertaining to these factors. The verbatim quotes for favouritism and motivation are
indicated with their respective codes below.
Figure 4.5: Quotes on recognition and reward practices.
Favouritism
Several responses in terms of favouritism are presented.
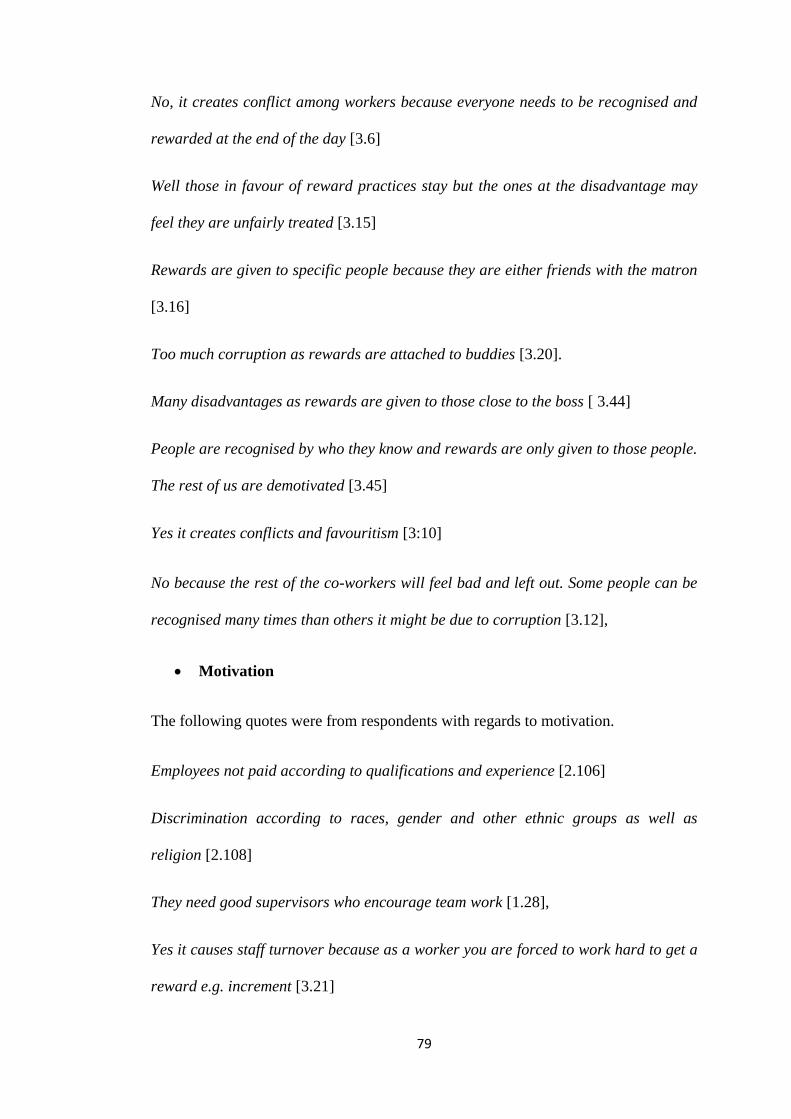
79
No, it creates conflict among workers because everyone needs to be recognised and
rewarded at the end of the day [3.6]
Well those in favour of reward practices stay but the ones at the disadvantage may
feel they are unfairly treated [3.15]
Rewards are given to specific people because they are either friends with the matron
[3.16]
Too much corruption as rewards are attached to buddies [3.20].
Many disadvantages as rewards are given to those close to the boss [ 3.44]
People are recognised by who they know and rewards are only given to those people.
The rest of us are demotivated [3.45]
Yes it creates conflicts and favouritism [3:10]
No because the rest of the co-workers will feel bad and left out. Some people can be
recognised many times than others it might be due to corruption [3.12],
Motivation
The following quotes were from respondents with regards to motivation.
Employees not paid according to qualifications and experience [2.106]
Discrimination according to races, gender and other ethnic groups as well as
religion [2.108]
They need good supervisors who encourage team work [1.28],
Yes it causes staff turnover because as a worker you are forced to work hard to get a
reward e.g. increment [3.21]
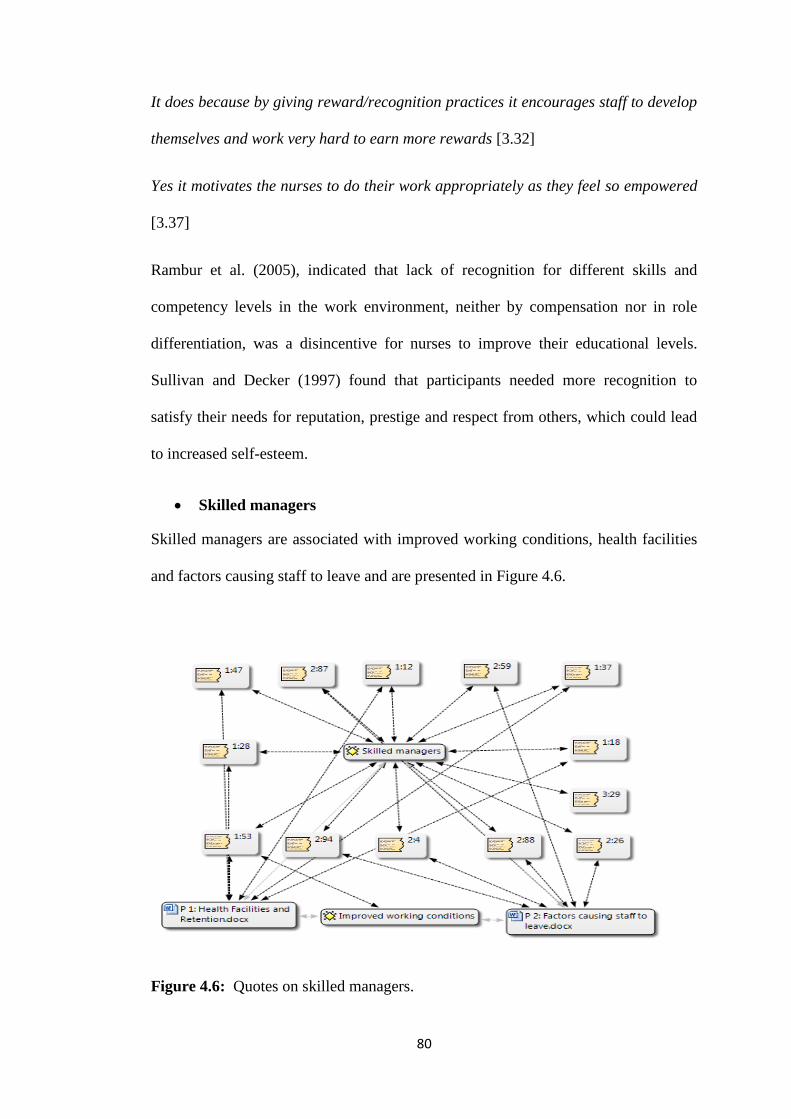
80
It does because by giving reward/recognition practices it encourages staff to develop
themselves and work very hard to earn more rewards [3.32]
Yes it motivates the nurses to do their work appropriately as they feel so empowered
[3.37]
Rambur et al. (2005), indicated that lack of recognition for different skills and
competency levels in the work environment, neither by compensation nor in role
differentiation, was a disincentive for nurses to improve their educational levels.
Sullivan and Decker (1997) found that participants needed more recognition to
satisfy their needs for reputation, prestige and respect from others, which could lead
to increased self-esteem.
Skilled managers
Skilled managers are associated with improved working conditions, health facilities
and factors causing staff to leave and are presented in Figure 4.6.
Figure 4.6: Quotes on skilled managers.

81
The following signified the ineffective management skills that exist in these
healthcare centres.
Place supervisors in departments that would do their job properly [1.18]
Improve the calibre of management [P.D.1.12]
They need good supervisors who encourage team work [P.D.1.28]
Create supportive working environment and fair supervision [P.D.1.53]
Adopt workforce management [P.D.1.47]
Place or recruit managers who are competent or provide training to the managers
to run facilities properly [P.D.1.37]
Better management from unit managers [2.26]
Lack of etiquette toward staff members by managers [2.87]
Disorganised working environment [2.94]
These findings are in harmony with those of O'Brien-Pallas, Duffield, and Hayes
(2006), who state that there is a direct relationship between nurse turnover and the
type of management. Poor supervision could arise within a work place when a
supervisor is insensitive and incompetent. This could lead to job dissatisfaction
which can further cause a high rate of nurses who were planning to leave their units
since they could to be less satisfied with their nurse manager when compared to
nurses who reported an intent to stay with their current unit (Cohen, Stuenkel, &
Nguyen, 2009; Stone et al., 2006).
The cause of workload in a way could have a bearing on managers’ inability to plan.
Workload could also be attributed to disequilibrium with nurse-patient ratios due to
82
turnover consequences. Satisfaction with workload is defined as a nurse’s
satisfaction with the type and number of activities that are accomplished as a regular
part of the job (Stamps & Piedmonte, 1986). Available studies tend to indicate low
satisfaction with workload by nurses (Gardulf, Orton, Eriksson, Unden, Arnetz,
Kajermo, et al., 2008; Tinker, Sweetham, & Nelson, 2011; Rheingans, 2008).
Untaxed overtime
The issue of overtime was associated with unpaid overtime, untaxed overtime, and
timely overtime payments as depicted in Figure 4.7.
Figure 4.7: Quotes on untaxed overtime.
The quotes pertaining to overtime were as follows.
Increase salary and pay overtime on time [P.D.1.2]
Increase salaries and reduce tax [P.D.1.67]
Don’t tax overtime [P.D.1.30]
Health workers to get their overtime payments on time [P.D.1.35]
Unpaid overtime working hours and tight work load schedule [P.D.2.34]
Working overtime with no payment [P.D.2.54]
83
The above indicate that working overtime to fill the gap of inadequate staff and not
being paid on time, may lead to frustration and dissatisfaction which may result in
turnover intentions. De Troyer (2000) contends that low job satisfaction levels can be
imputed to the physical working conditions. While Olds and Clarke (2010) indicate
that extended working hours, due to personnel shortages, affect health care delivered
to patients.
4.4.4 Objective 4
The objective was to analyse the association of demographic data and the
correlation/relationship of variables with each associated factor.
4.4.4.1 The analysis of the association of demographic factors
The analysis of the association of demographic factors to turnover covered gender salary
distribution and age; marital status; gender and salary; tenure and marital status. These are
presented and discussed below.
Gender, salary distribution and age
The cross tabulation between gender, salary and age aimed to tabulate numbers that
may provide insight as to what is the most likely salaries in particular age group and
further look into the most affected gender group. It can be noted in Table 4.21 that
the majority were females. However, gender was critical as the majority of the
respondents in the entire sample were females. Nonetheless, the salary structure
revealed that the majority received between N$10, 000 and 20, 000 per month.
Table 4.21 shows that 17 females out of 46 respondents who were married received a
salary of between N$15, 000 and 20, 000 per month. The majority of the nurses who
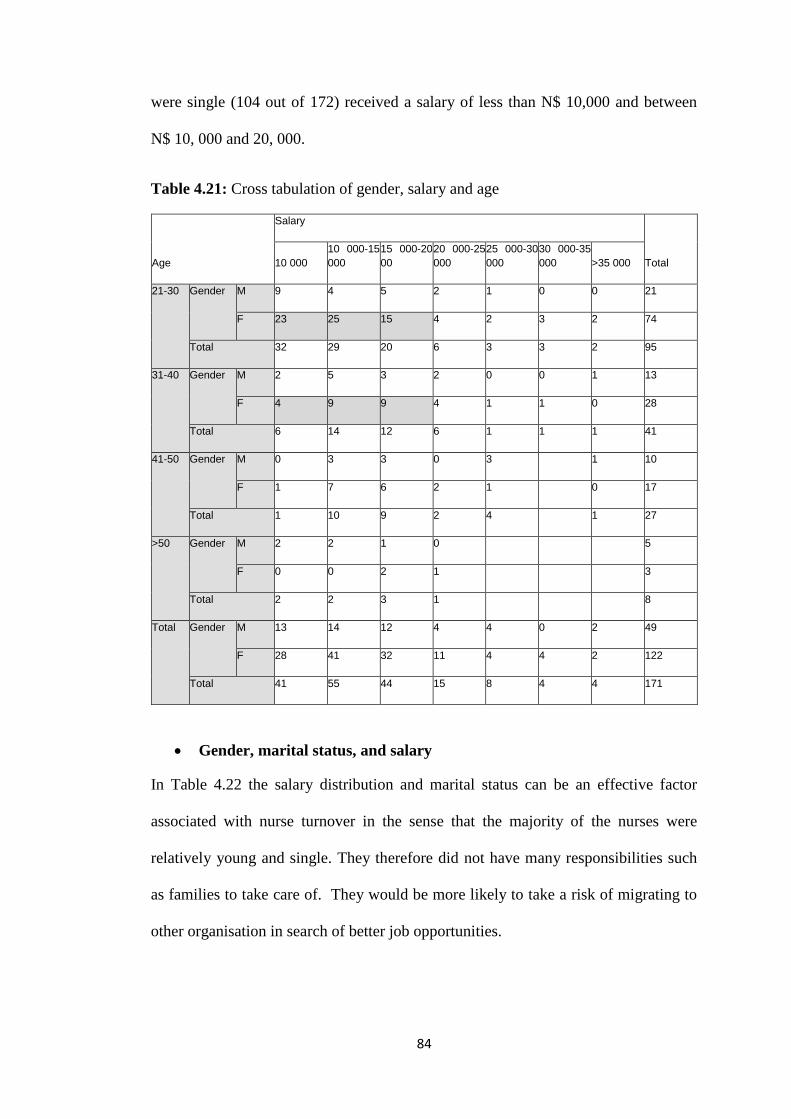
84
were single (104 out of 172) received a salary of less than N$ 10,000 and between
N$ 10, 000 and 20, 000.
Table 4.21: Cross tabulation of gender, salary and age
Age
Salary
Total 10 000
10 000-15
000
15 000-20
00
20 000-25
000
25 000-30
000
30 000-35
000 >35 000
21-30 Gender M 9 4 5 2 1 0 0 21
F 23 25 15 4 2 3 2 74
Total 32 29 20 6 3 3 2 95
31-40 Gender M 2 5 3 2 0 0 1 13
F 4 9 9 4 1 1 0 28
Total 6 14 12 6 1 1 1 41
41-50 Gender M 0 3 3 0 3 1 10
F 1 7 6 2 1 0 17
Total 1 10 9 2 4 1 27
>50 Gender M 2 2 1 0 5
F 0 0 2 1 3
Total 2 2 3 1 8
Total Gender M 13 14 12 4 4 0 2 49
F 28 41 32 11 4 4 2 122
Total 41 55 44 15 8 4 4 171
Gender, marital status, and salary
In Table 4.22 the salary distribution and marital status can be an effective factor
associated with nurse turnover in the sense that the majority of the nurses were
relatively young and single. They therefore did not have many responsibilities such
as families to take care of. They would be more likely to take a risk of migrating to
other organisation in search of better job opportunities.
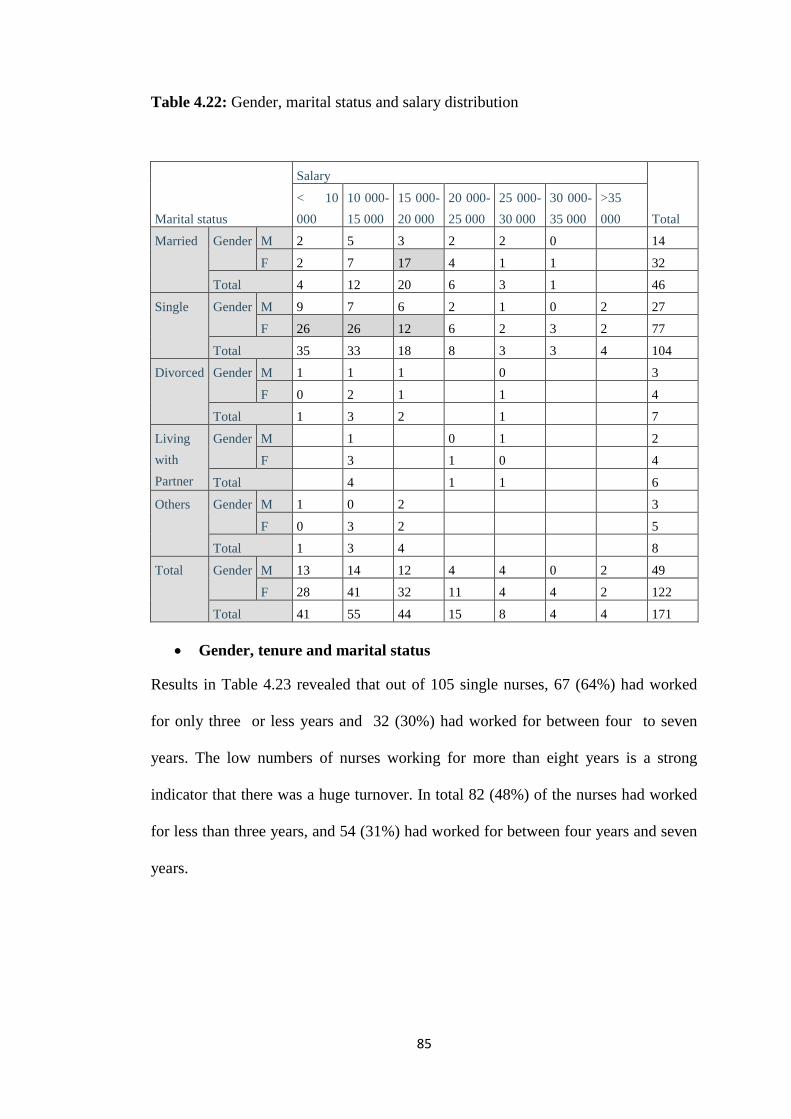
85
Table 4.22: Gender, marital status and salary distribution
Marital status
Salary
Total
< 10
000
10 000-
15 000
15 000-
20 000
20 000-
25 000
25 000-
30 000
30 000-
35 000
>35
000
Married Gender M 2 5 3 2 2 0 14
F 2 7 17 4 1 1 32
Total 4 12 20 6 3 1 46
Single Gender M 9 7 6 2 1 0 2 27
F 26 26 12 6 2 3 2 77
Total 35 33 18 8 3 3 4 104
Divorced Gender M 1 1 1 0 3
F 0 2 1 1 4
Total 1 3 2 1 7
Living
with
Partner
Gender M 1 0 1 2
F 3 1 0 4
Total 4 1 1 6
Others Gender M 1 0 2 3
F 0 3 2 5
Total 1 3 4 8
Total Gender M 13 14 12 4 4 0 2 49
F 28 41 32 11 4 4 2 122
Total 41 55 44 15 8 4 4 171
Gender, tenure and marital status
Results in Table 4.23 revealed that out of 105 single nurses, 67 (64%) had worked
for only three or less years and 32 (30%) had worked for between four to seven
years. The low numbers of nurses working for more than eight years is a strong
indicator that there was a huge turnover. In total 82 (48%) of the nurses had worked
for less than three years, and 54 (31%) had worked for between four years and seven
years.
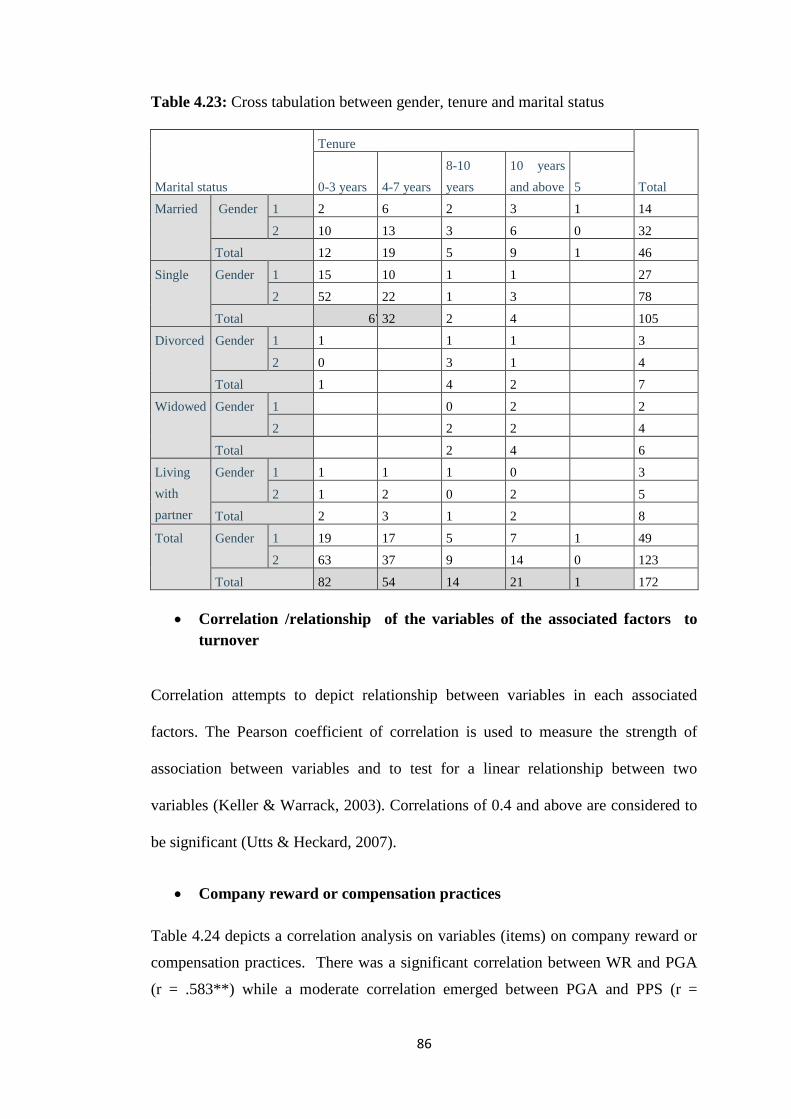
86
Table 4.23: Cross tabulation between gender, tenure and marital status
Marital status
Tenure
Total 0-3 years 4-7 years
8-10
years
10 years
and above 5
Married Gender 1 2 6 2 3 1 14
2 10 13 3 6 0 32
Total 12 19 5 9 1 46
Single Gender 1 15 10 1 1 27
2 52 22 1 3 78
Total 67 32 2 4 105
Divorced Gender 1 1 1 1 3
2 0 3 1 4
Total 1 4 2 7
Widowed Gender 1 0 2 2
2 2 2 4
Total 2 4 6
Living
with
partner
Gender 1 1 1 1 0 3
2 1 2 0 2 5
Total 2 3 1 2 8
Total Gender 1 19 17 5 7 1 49
2 63 37 9 14 0 123
Total 82 54 14 21 1 172
Correlation /relationship of the variables of the associated factors to
turnover
Correlation attempts to depict relationship between variables in each associated
factors. The Pearson coefficient of correlation is used to measure the strength of
association between variables and to test for a linear relationship between two
variables (Keller & Warrack, 2003). Correlations of 0.4 and above are considered to
be significant (Utts & Heckard, 2007).
Company reward or compensation practices
Table 4.24 depicts a correlation analysis on variables (items) on company reward or
compensation practices. There was a significant correlation between WR and PGA
(r = .583**) while a moderate correlation emerged between PGA and PPS (r =
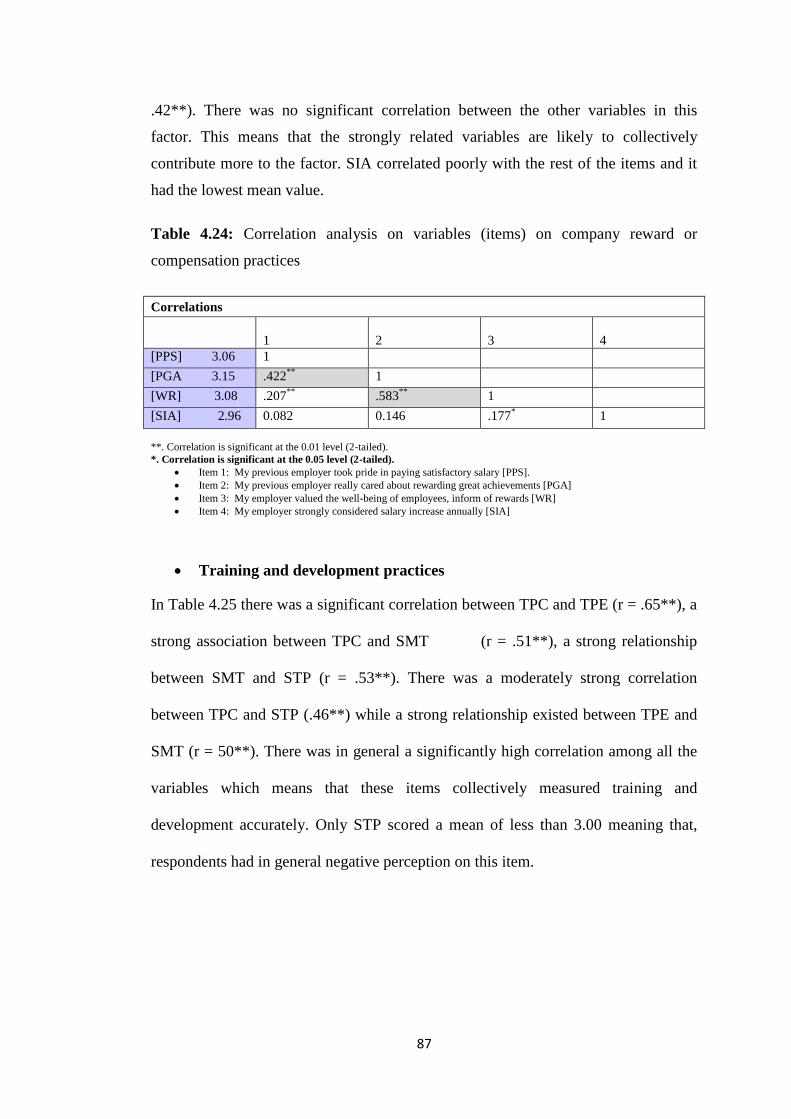
87
.42**). There was no significant correlation between the other variables in this
factor. This means that the strongly related variables are likely to collectively
contribute more to the factor. SIA correlated poorly with the rest of the items and it
had the lowest mean value.
Table 4.24: Correlation analysis on variables (items) on company reward or
compensation practices
Correlations
1
2
3
4
[PPS] 3.06 1
[PGA 3.15 .422**
1
[WR] 3.08 .207**
.583**
1
[SIA] 2.96 0.082 0.146 .177* 1
**. Correlation is significant at the 0.01 level (2-tailed).
*. Correlation is significant at the 0.05 level (2-tailed).
Item 1: My previous employer took pride in paying satisfactory salary [PPS].
Item 2: My previous employer really cared about rewarding great achievements [PGA]
Item 3: My employer valued the well-being of employees, inform of rewards [WR]
Item 4: My employer strongly considered salary increase annually [SIA]
Training and development practices
In Table 4.25 there was a significant correlation between TPC and TPE (r = .65**), a
strong association between TPC and SMT (r = .51**), a strong relationship
between SMT and STP (r = .53**). There was a moderately strong correlation
between TPC and STP (.46**) while a strong relationship existed between TPE and
SMT (r = 50**). There was in general a significantly high correlation among all the
variables which means that these items collectively measured training and
development accurately. Only STP scored a mean of less than 3.00 meaning that,
respondents had in general negative perception on this item.
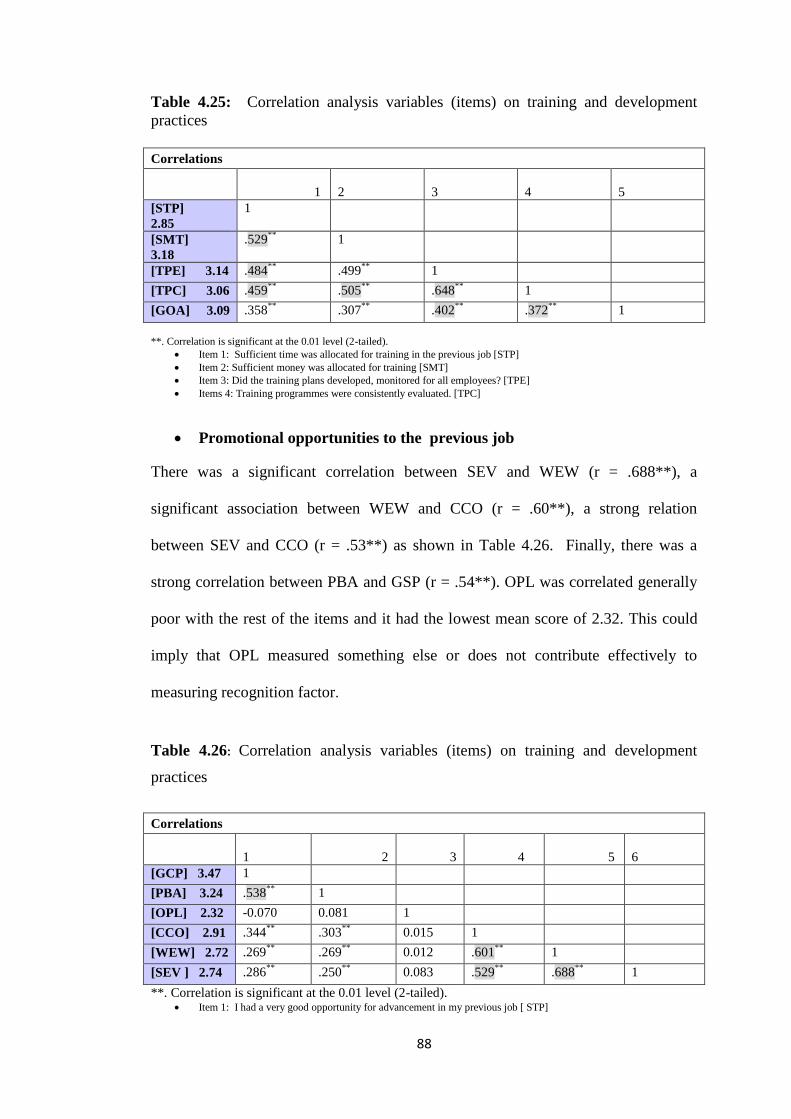
88
Table 4.25: Correlation analysis variables (items) on training and development
practices
Correlations
1
2
3
4
5
[STP]
2.85
1
[SMT]
3.18
.529**
1
[TPE] 3.14 .484**
.499**
1
[TPC] 3.06 .459**
.505**
.648**
1
[GOA] 3.09 .358**
.307**
.402**
.372**
1
**. Correlation is significant at the 0.01 level (2-tailed).
Item 1: Sufficient time was allocated for training in the previous job [STP]
Item 2: Sufficient money was allocated for training [SMT]
Item 3: Did the training plans developed, monitored for all employees? [TPE]
Items 4: Training programmes were consistently evaluated. [TPC]
Promotional opportunities to the previous job
There was a significant correlation between SEV and WEW (r = .688**), a
significant association between WEW and CCO (r = .60**), a strong relation
between SEV and CCO (r = .53**) as shown in Table 4.26. Finally, there was a
strong correlation between PBA and GSP (r = .54**). OPL was correlated generally
poor with the rest of the items and it had the lowest mean score of 2.32. This could
imply that OPL measured something else or does not contribute effectively to
measuring recognition factor.
Table 4.26: Correlation analysis variables (items) on training and development
practices
Correlations
1 2 3 4 5
6
[GCP] 3.47 1
[PBA] 3.24 .538**
1
[OPL] 2.32 -0.070 0.081 1
[CCO] 2.91 .344**
.303**
0.015 1
[WEW] 2.72 .269**
.269**
0.012 .601**
1
[SEV ] 2.74 .286**
.250**
0.083 .529**
.688**
1
**. Correlation is significant at the 0.01 level (2-tailed). Item 1: I had a very good opportunity for advancement in my previous job [ STP]
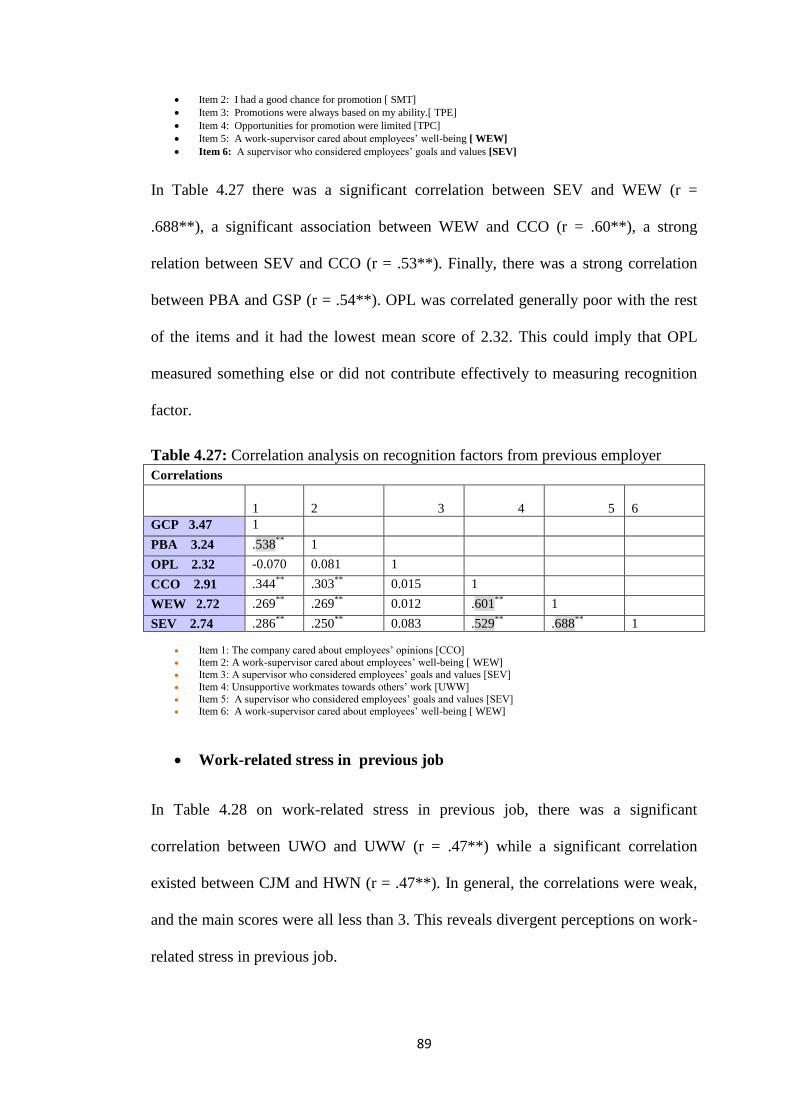
89
Item 2: I had a good chance for promotion [ SMT]
Item 3: Promotions were always based on my ability.[ TPE]
Item 4: Opportunities for promotion were limited [TPC]
Item 5: A work-supervisor cared about employees’ well-being [ WEW]
Item 6: A supervisor who considered employees’ goals and values [SEV]
In Table 4.27 there was a significant correlation between SEV and WEW (r =
.688**), a significant association between WEW and CCO (r = .60**), a strong
relation between SEV and CCO (r = .53**). Finally, there was a strong correlation
between PBA and GSP (r = .54**). OPL was correlated generally poor with the rest
of the items and it had the lowest mean score of 2.32. This could imply that OPL
measured something else or did not contribute effectively to measuring recognition
factor.
Table 4.27: Correlation analysis on recognition factors from previous employer
Correlations
1
2 3 4 5
6
GCP 3.47 1
PBA 3.24 .538**
1
OPL 2.32 -0.070 0.081 1
CCO 2.91 .344**
.303**
0.015 1
WEW 2.72 .269**
.269**
0.012 .601**
1
SEV 2.74 .286**
.250**
0.083 .529**
.688**
1
Item 1: The company cared about employees’ opinions [CCO]
Item 2: A work-supervisor cared about employees’ well-being [ WEW] Item 3: A supervisor who considered employees’ goals and values [SEV]
Item 4: Unsupportive workmates towards others’ work [UWW]
Item 5: A supervisor who considered employees’ goals and values [SEV] Item 6: A work-supervisor cared about employees’ well-being [ WEW]
Work-related stress in previous job
In Table 4.28 on work-related stress in previous job, there was a significant
correlation between UWO and UWW (r = .47**) while a significant correlation
existed between CJM and HWN (r = .47**). In general, the correlations were weak,
and the main scores were all less than 3. This reveals divergent perceptions on work-
related stress in previous job.
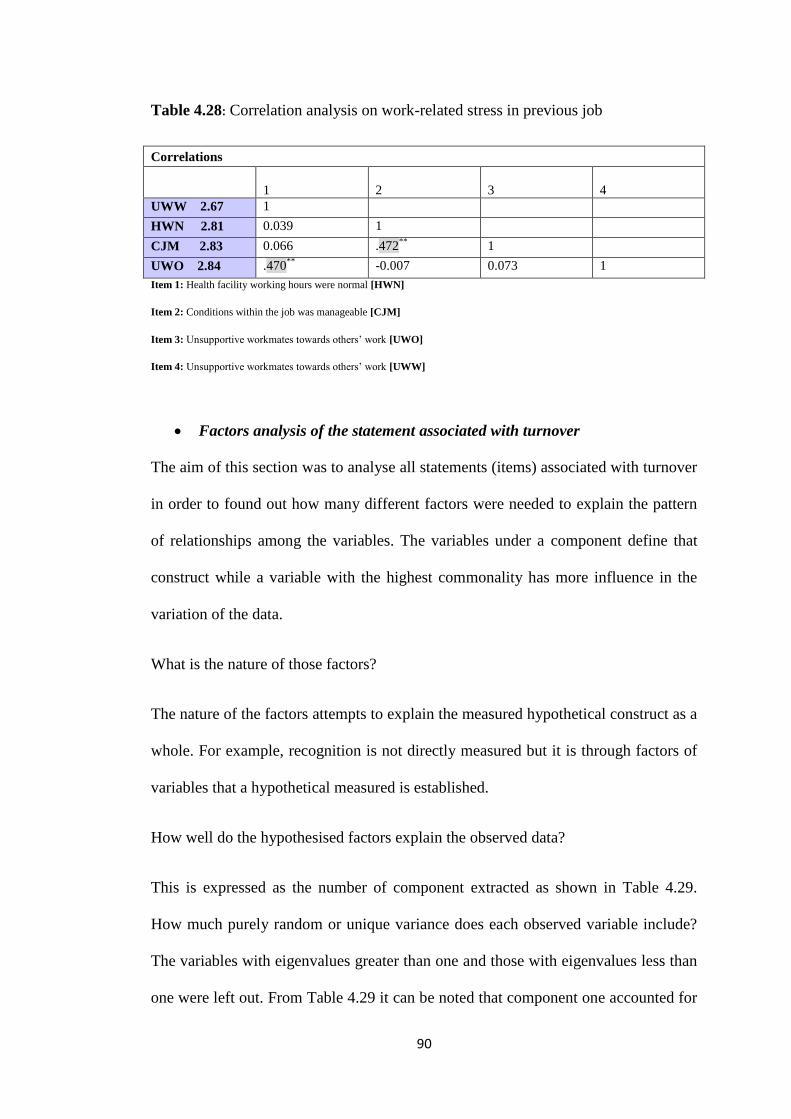
90
Table 4.28: Correlation analysis on work-related stress in previous job
Correlations
1
2
3
4
UWW 2.67 1
HWN 2.81 0.039 1
CJM 2.83 0.066 .472**
1
UWO 2.84 .470**
-0.007 0.073 1
Item 1: Health facility working hours were normal [HWN]
Item 2: Conditions within the job was manageable [CJM]
Item 3: Unsupportive workmates towards others’ work [UWO]
Item 4: Unsupportive workmates towards others’ work [UWW]
Factors analysis of the statement associated with turnover
The aim of this section was to analyse all statements (items) associated with turnover
in order to found out how many different factors were needed to explain the pattern
of relationships among the variables. The variables under a component define that
construct while a variable with the highest commonality has more influence in the
variation of the data.
What is the nature of those factors?
The nature of the factors attempts to explain the measured hypothetical construct as a
whole. For example, recognition is not directly measured but it is through factors of
variables that a hypothetical measured is established.
How well do the hypothesised factors explain the observed data?
This is expressed as the number of component extracted as shown in Table 4.29.
How much purely random or unique variance does each observed variable include?
The variables with eigenvalues greater than one and those with eigenvalues less than
one were left out. From Table 4.29 it can be noted that component one accounted for
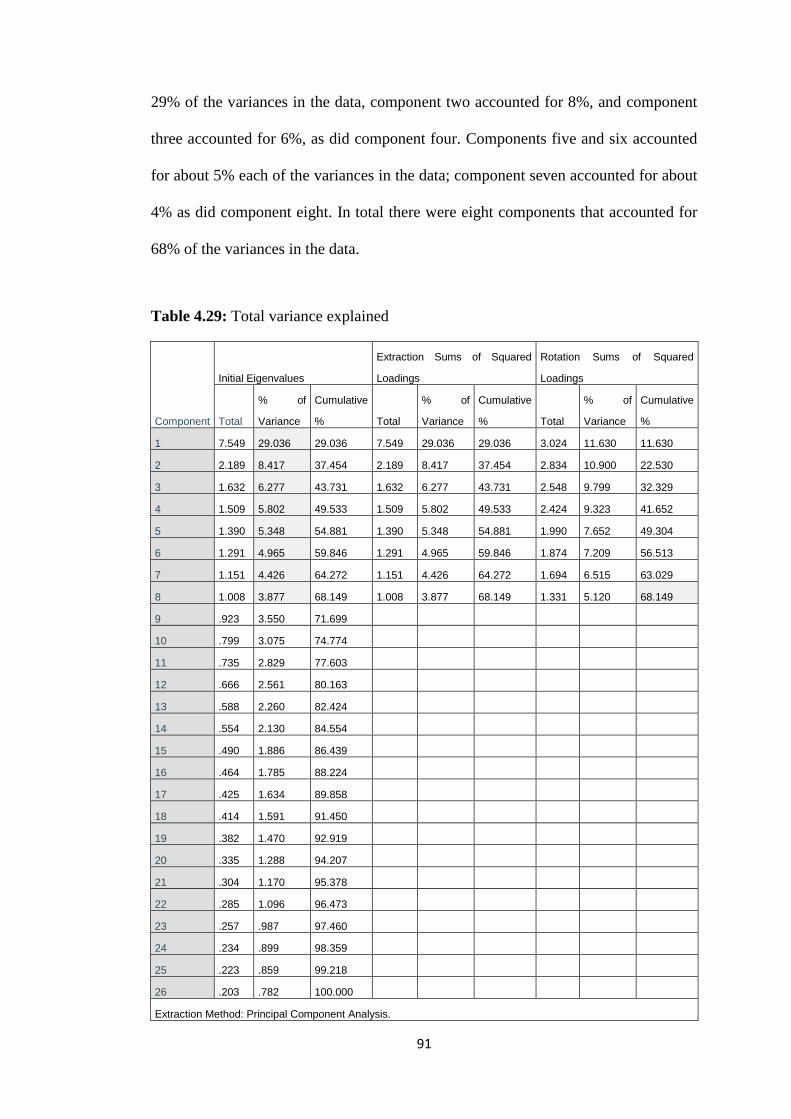
91
29% of the variances in the data, component two accounted for 8%, and component
three accounted for 6%, as did component four. Components five and six accounted
for about 5% each of the variances in the data; component seven accounted for about
4% as did component eight. In total there were eight components that accounted for
68% of the variances in the data.
Table 4.29: Total variance explained
Component
Initial Eigenvalues
Extraction Sums of Squared
Loadings
Rotation Sums of Squared
Loadings
Total
% of
Variance
Cumulative
% Total
% of
Variance
Cumulative
% Total
% of
Variance
Cumulative
%
1 7.549 29.036 29.036 7.549 29.036 29.036 3.024 11.630 11.630
2 2.189 8.417 37.454 2.189 8.417 37.454 2.834 10.900 22.530
3 1.632 6.277 43.731 1.632 6.277 43.731 2.548 9.799 32.329
4 1.509 5.802 49.533 1.509 5.802 49.533 2.424 9.323 41.652
5 1.390 5.348 54.881 1.390 5.348 54.881 1.990 7.652 49.304
6 1.291 4.965 59.846 1.291 4.965 59.846 1.874 7.209 56.513
7 1.151 4.426 64.272 1.151 4.426 64.272 1.694 6.515 63.029
8 1.008 3.877 68.149 1.008 3.877 68.149 1.331 5.120 68.149
9 .923 3.550 71.699
10 .799 3.075 74.774
11 .735 2.829 77.603
12 .666 2.561 80.163
13 .588 2.260 82.424
14 .554 2.130 84.554
15 .490 1.886 86.439
16 .464 1.785 88.224
17 .425 1.634 89.858
18 .414 1.591 91.450
19 .382 1.470 92.919
20 .335 1.288 94.207
21 .304 1.170 95.378
22 .285 1.096 96.473
23 .257 .987 97.460
24 .234 .899 98.359
25 .223 .859 99.218
26 .203 .782 100.000
Extraction Method: Principal Component Analysis.
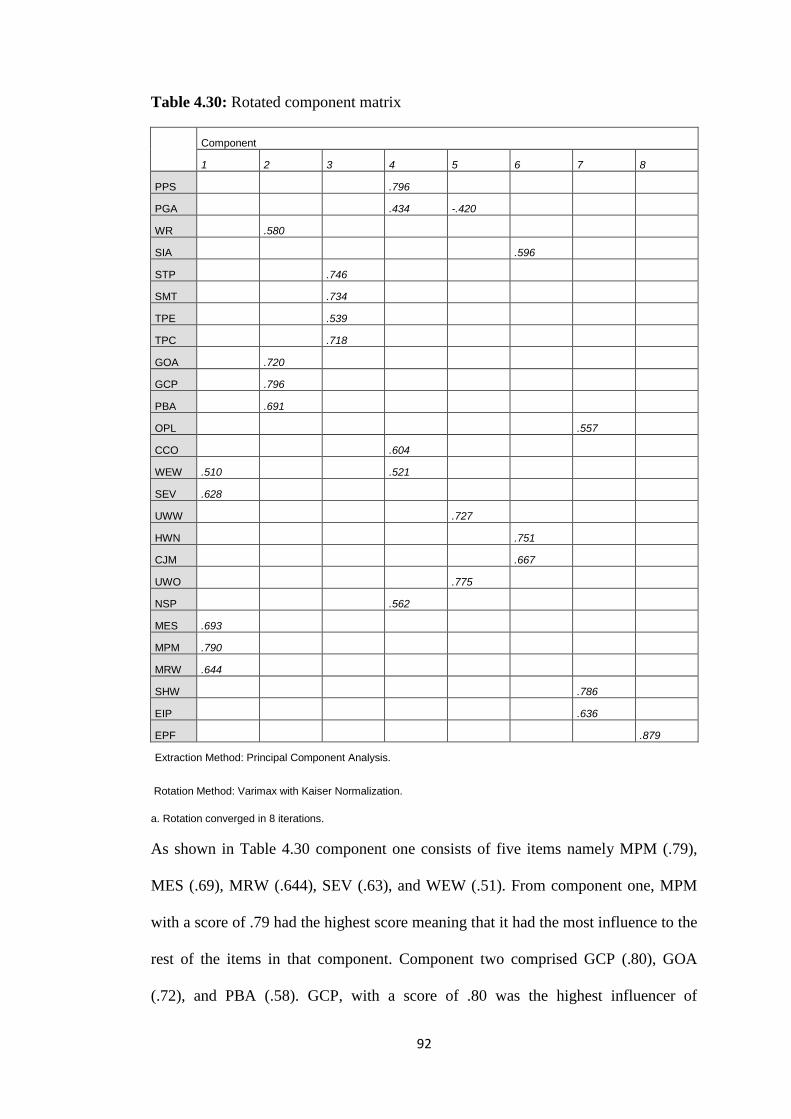
92
Table 4.30: Rotated component matrix
Component
1 2 3 4 5 6 7 8
PPS .796
PGA .434 -.420
WR .580
SIA .596
STP .746
SMT .734
TPE .539
TPC .718
GOA .720
GCP .796
PBA .691
OPL .557
CCO .604
WEW .510 .521
SEV .628
UWW .727
HWN .751
CJM .667
UWO .775
NSP .562
MES .693
MPM .790
MRW .644
SHW .786
EIP .636
EPF .879
Extraction Method: Principal Component Analysis.
Rotation Method: Varimax with Kaiser Normalization.
a. Rotation converged in 8 iterations.
As shown in Table 4.30 component one consists of five items namely MPM (.79),
MES (.69), MRW (.644), SEV (.63), and WEW (.51). From component one, MPM
with a score of .79 had the highest score meaning that it had the most influence to the
rest of the items in that component. Component two comprised GCP (.80), GOA
(.72), and PBA (.58). GCP, with a score of .80 was the highest influencer of
93
component two. Component three consists of STP (.75), SMT (.73), TPE (.54), and
TPC (.72). It can be noted that the item STP was the most influencer of component
three with a score of .75. Component four had PPS (.80), PGA (.43), CCO (.60),
WEW (.52) and NSP (.56). Item PPS was the leading member of component three at
.80 score. Component five had UWW (.73) and UWO (.76) as the only members.
UWO was the leading variable with a score of .76. Component six consisted of SIA
(.60), HWN (.75) and CJM (.67) as its members. HWN was the leading variable with
a score of .75. Last was component seven with OPL (.56), SHW (.79) and EIP (.64)
as its members. The leading item was SHW at .79.
It can be deduced that managers encouraging participative management (MPM) was
the greatest influencer of factors affected by staff turnover. This influence factor was
followed by: sufficient time being allocated for training in the previous job (STP);
my previous employer took pride in paying satisfactory salary (PPS); the respondents
strongly agreed that they were unsupportive workmates towards others’ work
(UWO); the respondents strongly agreed that health facility working hours were
normal (HWN); and a safe and happy workplace made employees feel good about
being there (SHW).
4.5. SUMMARY
This chapter presented the findings from the data analysis for each of the four
objectives. There was a strong concordance between the findings from the
quantitative closed-ended questions and the qualitative open-ended questions.
Factors such as poor remuneration, lack of skilled managers, delayed and taxed
overtime payments, lack of recognition figured prominently in the qualitative aspect

94
of the study. The next chapter covers the conclusions, limitations, recommendations,
and contributions of the study.
95
CHAPTER 5
DISCUSSIONS, CONCLUSIONS, LIMITATIONS,
RECOMMENDATIONS AND CONTRIBUTIONS OF THE
STUDY
5.1. INTRODUCTION
The previous chapter outlined the results of this research. This chapter discusses the
quantitative and qualitative research findings as presented in the results (chapter
four) It was expected that the analysis of the results displayed in the previous chapter
would allow the researcher to gain a deeper understanding of the factors that are
related to turnover among nurses in the public health institutions in the Khomas
Region in Namibia. This was in order to meet the four objectives listed in Chapter 1.
Conclusions, limitations, recommendations and contribution of the study, based on
the analysis and discussions, are also presented.
5.2. DISCUSSIONS
The discussions are largely based on the study objectives since the aim was to
determine the factors associated with turnover among nurses in public health
facilities in the Khomas Region. Two hundred and forty questionnaires were
distributed and 172 (72%) response rate were completed and returned. Welman,
Kruger and Mitchell (2005) maintain that the response above 50% is sufficient to
obtain meaningful statistical analysis and to obtain acceptable results.
5.2.1 Demographic factors (objective 1)
These were: age, gender, professional qualifications, and marital status and tenure.
Findings of this study revealed that the majority of the respondents were females.
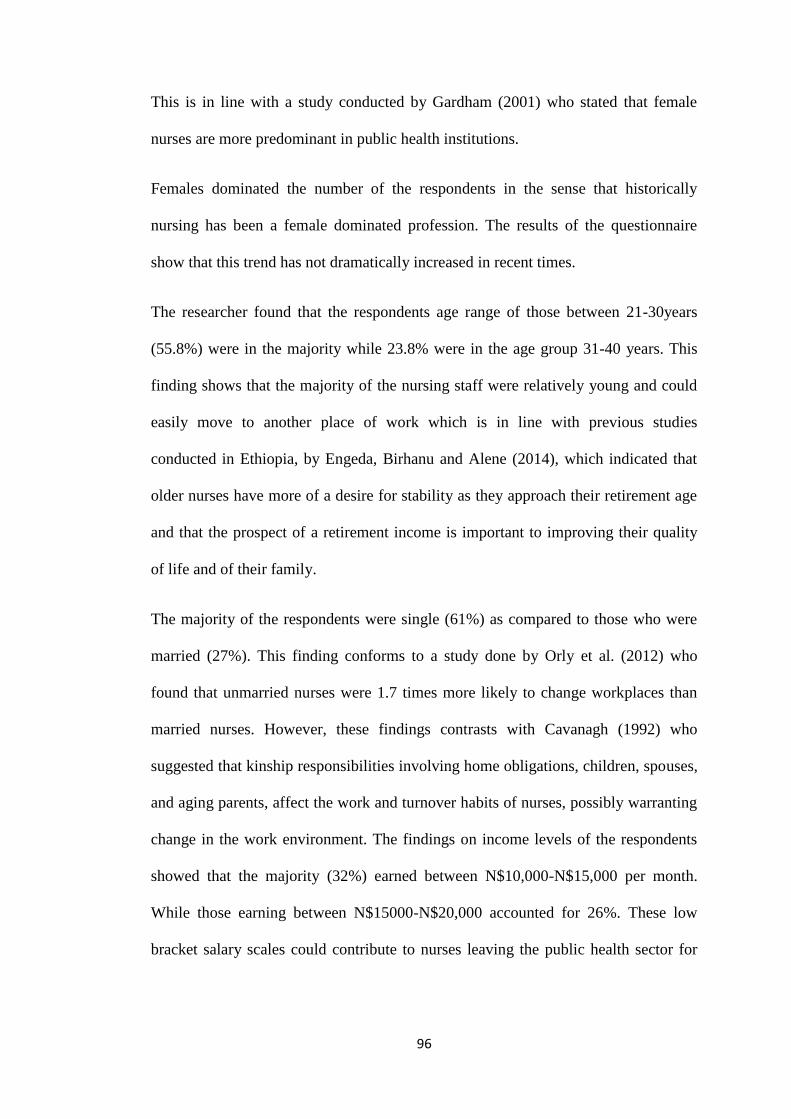
96
This is in line with a study conducted by Gardham (2001) who stated that female
nurses are more predominant in public health institutions.
Females dominated the number of the respondents in the sense that historically
nursing has been a female dominated profession. The results of the questionnaire
show that this trend has not dramatically increased in recent times.
The researcher found that the respondents age range of those between 21-30years
(55.8%) were in the majority while 23.8% were in the age group 31-40 years. This
finding shows that the majority of the nursing staff were relatively young and could
easily move to another place of work which is in line with previous studies
conducted in Ethiopia, by Engeda, Birhanu and Alene (2014), which indicated that
older nurses have more of a desire for stability as they approach their retirement age
and that the prospect of a retirement income is important to improving their quality
of life and of their family.
The majority of the respondents were single (61%) as compared to those who were
married (27%). This finding conforms to a study done by Orly et al. (2012) who
found that unmarried nurses were 1.7 times more likely to change workplaces than
married nurses. However, these findings contrasts with Cavanagh (1992) who
suggested that kinship responsibilities involving home obligations, children, spouses,
and aging parents, affect the work and turnover habits of nurses, possibly warranting
change in the work environment. The findings on income levels of the respondents
showed that the majority (32%) earned between N$10,000-N$15,000 per month.
While those earning between N$15000-N$20,000 accounted for 26%. These low
bracket salary scales could contribute to nurses leaving the public health sector for
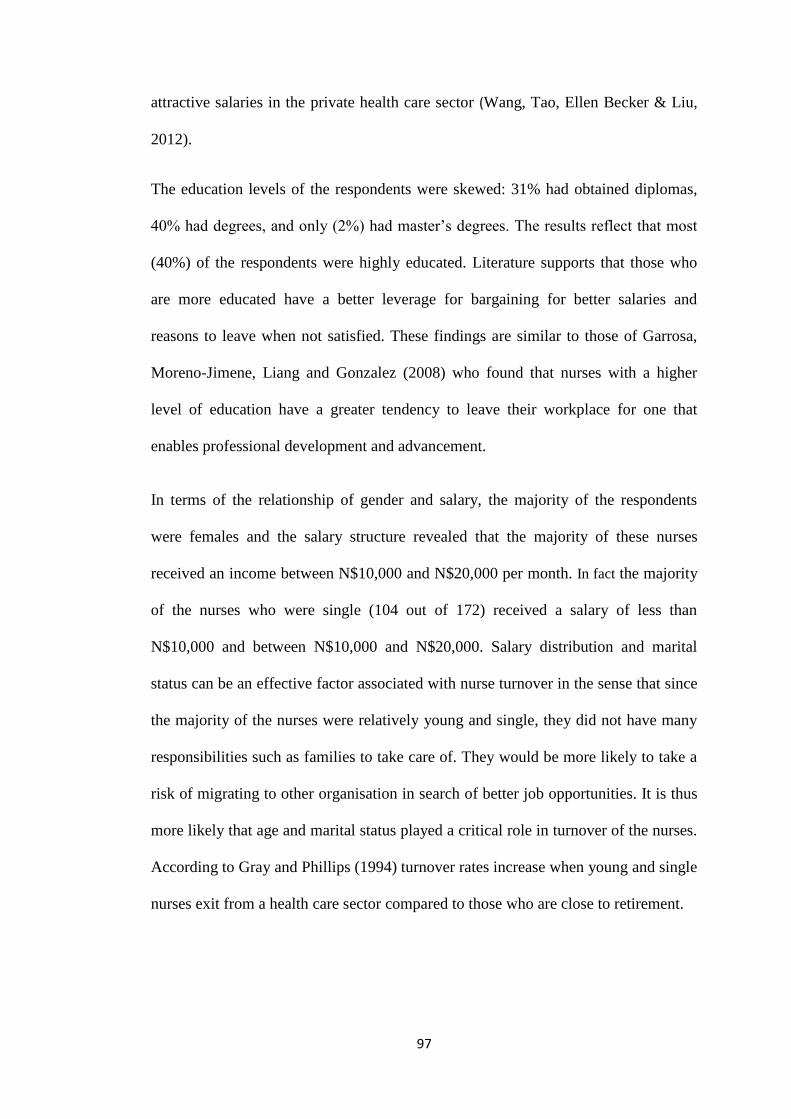
97
attractive salaries in the private health care sector (Wang, Tao, Ellen Becker & Liu,
2012).
The education levels of the respondents were skewed: 31% had obtained diplomas,
40% had degrees, and only (2%) had master’s degrees. The results reflect that most
(40%) of the respondents were highly educated. Literature supports that those who
are more educated have a better leverage for bargaining for better salaries and
reasons to leave when not satisfied. These findings are similar to those of Garrosa,
Moreno-Jimene, Liang and Gonzalez (2008) who found that nurses with a higher
level of education have a greater tendency to leave their workplace for one that
enables professional development and advancement.
In terms of the relationship of gender and salary, the majority of the respondents
were females and the salary structure revealed that the majority of these nurses
received an income between N$10,000 and N$20,000 per month. In fact the majority
of the nurses who were single (104 out of 172) received a salary of less than
N$10,000 and between N$10,000 and N$20,000. Salary distribution and marital
status can be an effective factor associated with nurse turnover in the sense that since
the majority of the nurses were relatively young and single, they did not have many
responsibilities such as families to take care of. They would be more likely to take a
risk of migrating to other organisation in search of better job opportunities. It is thus
more likely that age and marital status played a critical role in turnover of the nurses.
According to Gray and Phillips (1994) turnover rates increase when young and single
nurses exit from a health care sector compared to those who are close to retirement.
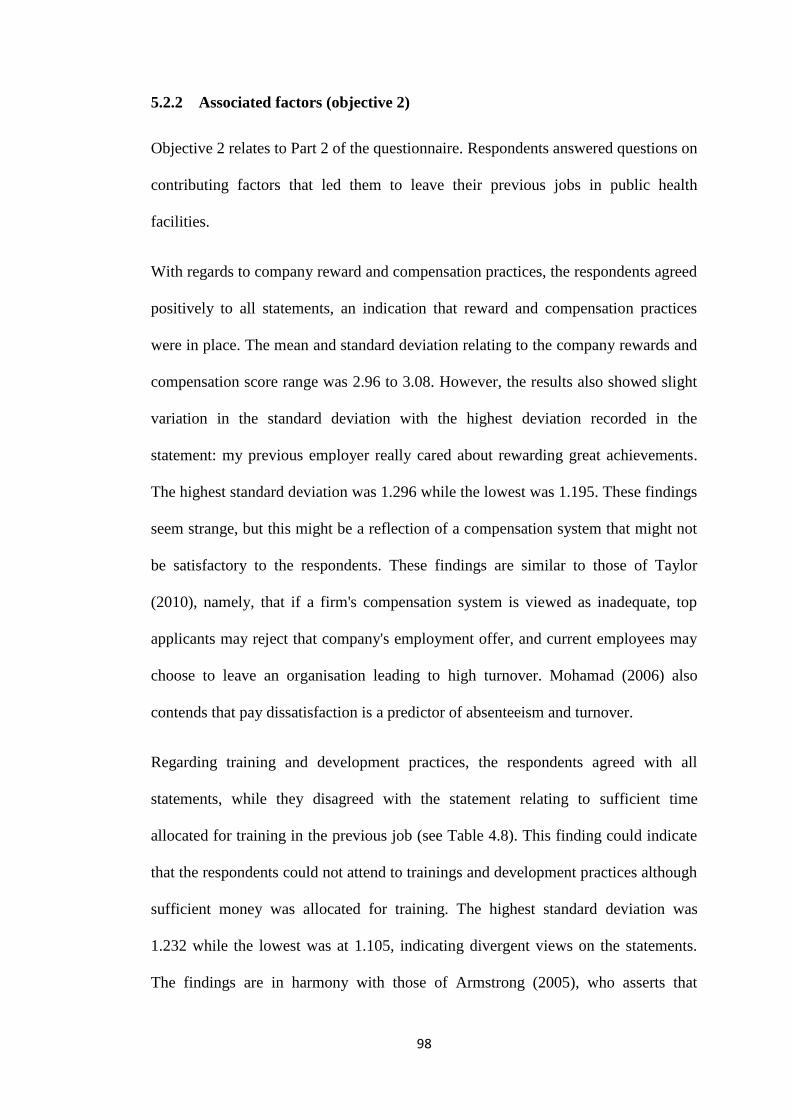
98
5.2.2 Associated factors (objective 2)
Objective 2 relates to Part 2 of the questionnaire. Respondents answered questions on
contributing factors that led them to leave their previous jobs in public health
facilities.
With regards to company reward and compensation practices, the respondents agreed
positively to all statements, an indication that reward and compensation practices
were in place. The mean and standard deviation relating to the company rewards and
compensation score range was 2.96 to 3.08. However, the results also showed slight
variation in the standard deviation with the highest deviation recorded in the
statement: my previous employer really cared about rewarding great achievements.
The highest standard deviation was 1.296 while the lowest was 1.195. These findings
seem strange, but this might be a reflection of a compensation system that might not
be satisfactory to the respondents. These findings are similar to those of Taylor
(2010), namely, that if a firm's compensation system is viewed as inadequate, top
applicants may reject that company's employment offer, and current employees may
choose to leave an organisation leading to high turnover. Mohamad (2006) also
contends that pay dissatisfaction is a predictor of absenteeism and turnover.
Regarding training and development practices, the respondents agreed with all
statements, while they disagreed with the statement relating to sufficient time
allocated for training in the previous job (see Table 4.8). This finding could indicate
that the respondents could not attend to trainings and development practices although
sufficient money was allocated for training. The highest standard deviation was
1.232 while the lowest was at 1.105, indicating divergent views on the statements.
The findings are in harmony with those of Armstrong (2005), who asserts that

99
dissatisfaction with career prospects is a major cause of employee turnover. Sullivan
and Decker et al. (2005) opine that today’s nurses want to have challenging careers
that offer opportunities for growth and advancement. Yin and Yang (2002) found
that the strongest organisational factors related to nurse turnover intentions, were,
lack of internal promotion and career advancement opportunity. However, despite
increased funding for career development by government to increase the supply of
nurses and improve healthcare services, there is a propensity to lose the trained
nurses to private sector thereby losing the massive investments (Dovlo, 2007).
On promotional opportunities in the previous job, the highest mean was 3.47 while
the lowest was 2.32. The highest standard deviation was 1.352 and the lowest was
1.223. The respondents disagreed with statements relating to promotional
opportunities revealing that there were no chances of promotion for them in the
public health facilities. The findings are similar to those of Kosteas (2011) who
contends that nursing staff become more committed if there is an expectancy of a job
promotion since it uplifts status and emoluments.
On recognition factors related to previous employer, the majority of the respondents
disagreed with all the statements with regards to recognition factors (see Table 4.11).
This may confirm that recognition is one of the major factors contributing to turnover
in the public health facilities. This is in line with Rambur et al. (2005) who indicated
that lack of recognition for different skills and competency levels in the work
environment, neither by compensation nor in role differentiation, was a disincentive
for nurses to improve their educational levels. Sullivan and Decker (1997), found
that participants needed more recognition to satisfy their needs for reputation,
prestige and respect from others, which could lead to increased self-esteem.
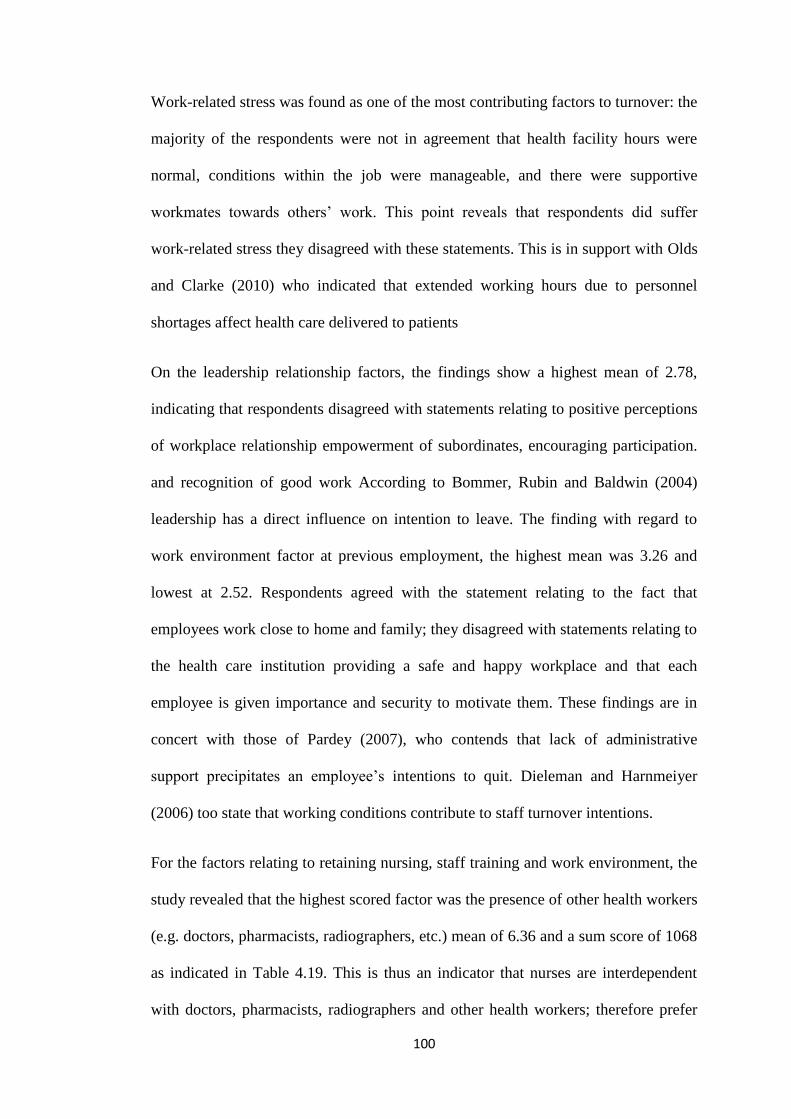
100
Work-related stress was found as one of the most contributing factors to turnover: the
majority of the respondents were not in agreement that health facility hours were
normal, conditions within the job were manageable, and there were supportive
workmates towards others’ work. This point reveals that respondents did suffer
work-related stress they disagreed with these statements. This is in support with Olds
and Clarke (2010) who indicated that extended working hours due to personnel
shortages affect health care delivered to patients
On the leadership relationship factors, the findings show a highest mean of 2.78,
indicating that respondents disagreed with statements relating to positive perceptions
of workplace relationship empowerment of subordinates, encouraging participation.
and recognition of good work According to Bommer, Rubin and Baldwin (2004)
leadership has a direct influence on intention to leave. The finding with regard to
work environment factor at previous employment, the highest mean was 3.26 and
lowest at 2.52. Respondents agreed with the statement relating to the fact that
employees work close to home and family; they disagreed with statements relating to
the health care institution providing a safe and happy workplace and that each
employee is given importance and security to motivate them. These findings are in
concert with those of Pardey (2007), who contends that lack of administrative
support precipitates an employee’s intentions to quit. Dieleman and Harnmeiyer
(2006) too state that working conditions contribute to staff turnover intentions.
For the factors relating to retaining nursing, staff training and work environment, the
study revealed that the highest scored factor was the presence of other health workers
(e.g. doctors, pharmacists, radiographers, etc.) mean of 6.36 and a sum score of 1068
as indicated in Table 4.19. This is thus an indicator that nurses are interdependent
with doctors, pharmacists, radiographers and other health workers; therefore prefer
101
their presence as they perform their duties. The lowest factor was the statement of
providing transport to work place with a mean of 3.94 and a corresponding sum score
of 618. However, this could be due to the factor that most employers stay close to
their homes or drive themselves to work. Other perceived factors were allocating
staff according to qualification (mean 6.21), provide safe work physical environment
(mean 6.02), provide pleasant social environment (mean 6.18), flexible working
hours (mean 6.10), and provide updated technological equipment (mean 6.14).
The role of recognition/staff reward on nursing staff turnover in terms of annual
bonus, performance bonus, performance award, performance award bonus,
simplified criteria for promotion and publicise acknowledgement of achievement
related to the aims and objectives of the study. The findings revealed that in terms of
the role of recognition and reward for staff turnover, 83% of respondents agreed with
the statement that annual bonus had an effect on staff turnover, while 13% disagreed.
On performance bonus, 39% agreed and 57% did not agree. Regarding performance
award (certificate), a total of 45% agreed and 85.2% disagreed with the statement.
Relating to simplified criteria for promotion 41% agreed and 56% did not agree with
the statement. On the issue of simplified criteria of promotion, 53% agreed with the
statement and 44% disagreed. On the need to publicise acknowledgement of
achievements, 45% agreed and 48% did not agree. The findings are similar to those
of Sullivan and Decker (1997), namely that participants need more recognition to
satisfy their needs for reputation, prestige and respect from others, which could lead
to increased self-esteem.
5.2.3 Opinions of the respondents (objective 3)
The main themes that emerged were salary increase, overtime, promotion on merit,
recognition and reward practices, favouritism, motivation, and skilled managers. The
102
issue of salary received more support as noted from the quotes. The problem of
salaries appears to be the main area of concern. Ozdemir (2009) suggest that rewards
are an essential of job satisfaction since they meet the needs and wants of the
working individual. When salaries are perceived to be low in a particular economic
dispensation, workers tend to balance the disequilibrium by leaving the organisation
for greener pastures.
According to many researchers, a constructive relationship exists between the pay
which one gets and job satisfaction. Maurer (2001) states that, rewarding workers
equitably for service rendered is one of the key factors to job satisfaction. However,
apart from poor salary increases being a factor that might have caused nurses to leave
public institutions, working long hours and unpaid overtime could have contributed
to this turnover. The response on working hours showed that 91 nurses disagreed that
the public sector had normal working hours and only 59 agreed. This goes further to
be supported by the opinions of respondents who voiced that even if they worked for
long hours they were rarely remunerated. Working overtime to fill the gap of
inadequate staff and not being paid on time, may lead to frustration and
dissatisfaction which may result in turnover intentions. The cause of workload in a
way could have a bearing on the inability to plan by the managers. Workload could
however be attributed to disequilibrium on the nurse-patient ratios due to turnover
consequences. Satisfaction with workload is defined as a nurse’s satisfaction with the
type and number of activities that are accomplished as a regular part of the job
(Stamps & Piedmonte, 1986). Available studies tend to indicate low satisfaction with
workload by nurses (Gardulf, Orton, Eriksson, Unden, Arnetz, Kajermo, et al., 2008;
Tinker, Sweetham, & Nelson, 2011; Rheingans, 2008). De Troyer (2000) contends
that low job satisfaction levels can be imputed to the physical working conditions.
103
The mentioned grievances above can also be tied to motivation. The study further
revealed that the public institutions nurses are not motivated. This is supported by the
responses which came out when asked if promotions or working conditions were
manageable. The response that came out frequently from the respondents was:
provide flexible working hours and promotions must be based on merit.
The results from Part 2 of the questionnaire also support this. The general consensus
was that nurses had limited opportunities for advancement or being promoted by
their previous employer. Statistics on promotion on merit reflected that only 32%
agreed that promotion was based on their abilities as compared to 46% who
disagreed (Table 4.9). However, respondents had differing opinions of this issue.
Certificate holders who had worked for many years wanted promotion to be based on
experience and not qualification. Diploma and degree holders preferred that
promotion should be based on merit.
In the study respondents also brought in the issue of favouritism on promotion
opportunities. They gave an opinion that the government should interview candidates
for promotion to avoid favouritism and that promotion should be given to those who
deserve it. Literature supports both the generalised and purposive data in relation to
promotion and favouritism. Baloch (2009) substantiates this by asserting that ‘unfair
promotion tendencies that were blighted by favouritism and nepotism are a
contributor to nursing turnover.’ The findings are in line with those of Baloch (2009)
who asserts that there is a constructive association among promotion and job
satisfaction. Workers become more committed if there is an expectancy of a job
promotion since it uplifts status and emoluments as suggested by Kosteas (2011).
104
Lack of recognition reduces morale and motivation on nurses’ performance which
may culminate into quit intentions. The findings are in harmony with those of
Rambur et al. (2005), who indicated that lack of recognition for different skills and
competency levels in the work environment, neither by compensation nor in role
differentiation, was a disincentive for nurses to improve their educational levels.
Sullivan and Decker (1997), found that participants needed more recognition to
satisfy their needs for reputation, prestige and respect from others, which could lead
to increased self-esteem.
With regards to leadership relations, the respondents felt that managers lacked
competence as reflected by their varied responses. These findings are in harmony
with those of O'Brien-Pallas, Duffield, and Hayes (2006), who state that there is a
direct relationship between nurses’ turnover and the type of management.
Poor supervision could arise within the work place when a supervisor is insensitive
and incompetent and this could lead to job dissatisfaction which can further cause a
high rate of nurses who were planning to leave their units. They were less satisfied
with their nurse manager when compared to nurses who reported an intent to stay
with their current unit (Cohen, Stuenkel, & Nguyen, 2009; Stone et al., 2006).
Causes of nurses staff turnover are also discussed by other authors (Parker, 2005, van
Zyl, Dalglish, du Plessis, Lues & Piertersen, 2013).
The findings regarding poor working environment as a precursor to nursing turnover
is in concert with De Troyer (2000) who contends that low job satisfaction levels can
be imputed to the physical working conditions. Olds and Clarke (2010) indicate that
extended working hours, due to personnel shortages, affect health care delivered to
patients.
105
5.2.4 Associations of the demographic data and correlations/ relationships of
variables of each associated factors (objective 4)
As noted earlier, the majority of the respondents was females which are a common
trend everywhere, and is not based on sampling criteria. The study as stated earlier
revealed that the salary distribution and marital status can be an effective factor
associated with nurse turnover in the sense that the majority of the nurses were
relatively young and single; therefore did not have many responsibilities such as
families to take care of. They would be more likely to take a risk of migrating to
other organisations to look for better job opportunities.
Furthermore, the study revealed a strong correlation between marital status and
movement which is tied to tenure. Regardless of gender, single respondents only
stayed in the public sector from 0 to 7 years. A total of 99 single respondents fell into
the periods of tenure of 0-3 years and 4-7 years as shown in Table 4.23. During the
same tenure periods, 31 married respondents left the public sector, and five left after
8 years.
Correlation attempts to depict relationship between variables in each associated
factors. Although correlation does not mean causality, it helps to identfy partens of
associations in the data that can be used to answer certain questions. When items are
highly correated, it implies that an increase (positive or negative) on one item results
in and increase of the other. In terms of intervention, it means that making
improvements one item may directly or indirectly cause improvement on the other.
Correlations can provide enough information to address objectives that are sound in
the sense that confidence intervals are also stated with the levels of correlation.
Correlations further help to reduce the number of items to a few that can be easily
106
managed and henceforth address research questions or provide platform for further
detailed analysis.
The study revealed that on company reward or compensation practices, there was a
significant correlation between the variables ‘my employer valued the well-being of
employees in the form of rewards’ and the variable ‘previous employer really cared
about rewarding great achievements’ (r = 0.58**). This shows that rewarding great
achievers (employees) increased their perception of being valued and the prospects
of their well-being. Well-being of employees has a bearing on their life in general
and thus can determine whether they want to remain in the company or not. A
moderate correlation emerged between the variable ‘previous employer really cared
about rewarding great achievements’ and ‘previous employer took pride in paying
satisfactory salaries’ (r = 0.42**). This implies that although the previous employer
rewarded great achievements, there was not much practical impression the employer
took pride in paying satisfactory salaries, which could compromise trust, henceforth
demotivate workers to stay on the job for longer. Ozdemir (2009) pointed out that
rewards are an essential part of job satisfaction. There was no significant correlation
between the other variables in this factor. This means that the strongly related
variables are likely to collectively contribute more to the factor. The variable my
employer strongly considered salary increase annually correlated poorly with the rest
of the items and it had the lowest mean value. This simply means, in the Khomas
region such variables may be more of influencer variables that may even be more
effective if they were placed in another factor. This part is dealt with in factor
analysis later in the chapter.
In terms of training and development practices, there was a significant correlation
between the variable “training programmes were consistently evaluated” and the
107
variable “was the training developed monitored for all employees?” (r = 0.65**).
There was a strong association between training programmes were constantly
evaluated and sufficient money was allocated for training (r = 0.51**). This result
illustrates that funding for training and evaluation of training programmes were in
place, however, this alone could not persuade nurses to stay on the job for long.
These programmes could have been perceived as higher order needs that may not be
necessary for most of the younger nurses. More pressing challenges such as
payments for over time and recognition could have had more impact on staff
retention. For example, Sullivan and Decker (1997), found that participants needed
more recognition to satisfy their needs for reputation, prestige and respect from
others, which could lead to increased self-esteem.
A strong relationship between the variables: “sufficient money was allocated for
training” and “sufficient time was allocated for training in the previous job” (r =
0.53**) was found significant. The study further revealed a moderate strong
correlation between variables training programs were consistently evaluated and
sufficient time was allocated for training in the previous job (0.46**). In addition, a
relationship (r =0.50**) existed between responses to the questions on whether the
training plans developed were monitored for all employees, and whether sufficient
money was allocated for training. Although these were considered a great
development, nurses may have felt that development programmes were not top
priority in terms of job satisfaction. Recognition factors from previous employer
showed a significant correlation between the variables: “a supervisor who considered
employees’ wellbeing” and “work supervisor cared about employee’s well-being” (r
= 0.68**). Furthermore, a significant association between the variables: “a work
supervisor cared about employee’s wellbeing” and “the company cared about
108
employees’ opinions” (r = 0.60**) was revealed. There was also a strong relation
between the variables: “a supervisor who considered employee’s goals and values”
and “the company cared about employees’ opinions” (r= 0.53**). The role of a
supervisor is critical to the day to day feeling and well-being of employees. Workers
usually run away from supervisors and not necessarily from the company. These
findings once again point to O'Brien-Pallas, Duffield, and Hayes (2006), who stated
that there is a direct relationship between nurses’ turnover and the type of
management.
There was a strong correlation between the variables: “promotions were always
based on my ability” and “l had a good chance for promotion” (r = 0.54**). If
workers perceived that promotions were based on merit, they would most likely find
it worthwhile attempting to work hard knowing that their contribution will be
recognized and rewarded. In the absence of this, workers will only work to keep their
jobs and leave whenever there was an opportunity to. Employees seek recognition in
what they do as Sullivan and Decker (1997), purported that participants need more
recognition to satisfy their needs for reputation and self-esteem. The variable:
“opportunities for promotion were limited” was correlated generally poor with the
rest of the items and it had the lowest mean score of 2.32. This could imply that
opportunities for promotions were limited measured something else or did not
contribute effectively to measuring recognition factor. Furthermore, on work-related
stress in the previous job, there was a significant correlation between the variables
unsupportive workmates towards other’s work and the statement a supervisor who
cared about employees’ wellbeing (r = 0.47**). A significant correlation existed
between the statement conditions within the job was manageable and health facility
working hours were normal (r = 0.47**). In general, the correlations were weak, and
109
the main scores were all less than 3. This reveals divergent perceptions on work-
related stress in the previous job. Although correlation does not mean causality, they
reveal relationships that are important for intervention. For instance, if a supervisor
was perceived to care about the well-being of nurses, then nurses were more likely to
perceive the workplace as supportive and caring which in turn may affectively
motivate them to do more.
5.3. CONCLUSIONS
The conclusions are based on the analysis of the data obtained from a structured
questionnaire that was completed by nurses who resigned from public health
facilities in the Khomas Region, Namibia. The conclusions are presented according
to the objectives of the study.
The study revealed that demographic factors such as gender, age, marital status,
tenure, and educational level contributed to turnover. The young and single
constituted the majority of respondents and were in the lower end of the income
brackets. All respondents were educated with a minimum qualification of a
certificate; while the highest qualification was a master’s degree. Furthermore, the
study revealed that the majority of the respondents rarely remained in the public
sector after 10 years. More single respondents moved mostly between 0 and 3 years
compared with the other respondents.
In addition to demographic factors, it was further concluded that the respondents
were dissatisfied by the reward or compensation schemes hence it could have been
the reason for them leaving the public health facilities. Poor leadership relationships
factors had a significant relationship with turnover. The respondents agreed that
management support and supervision was not adequate and effective. Interpersonal
110
relations were not excellent. Work-related stress was due to long working hours and
unsupportive workmates towards others’ work. Finally respondents complained
about the working environment which failed to provide a safe and happy working
environment.
The study revealed a strong concordance between the findings from the quantitative
closed-ended questions and the qualitative open-ended questions. Respondents were
given an opportunity to further express themselves on three questions. Factors such
as poor remuneration, lack of skilled managers, lack of recognition, delayed and
taxed overtime payments, lack of recognition, figured prominently in the opinions of
the respondents.
The respondents felt that there is need to increase salaries in public health sectors,
and that overtime should not be taxed and should also be given in time. They felt that
promotion should be based on experience as well as merit and not merely on
favouritism. According to the respondents, there is need for competent managers
who possess good managerial skills to achieve teamwork among nurses, and to create
supportive working environment, provide fair supervision and respect nurses fairly,
while avoiding favouritism.
5.4. LIMITATIONS
All research studies have limitations and this study is no exception. This study was
cross-sectional in nature which limits making causal inferences on nurse turnover in
Namibia. Time was also major limiting factor due to the unavailability of some
nurses to participate in the study citing other commitments. Obtaining a sample size
representative of the population in question was therefore difficult and the researcher
111
had to extend time by an extra two weeks to enable respondents to respond when it
was convenient.
Another limitation was reaching respondents because most of them had moved out of
the region under study. To overcome this, the researcher employed triangulation of
data collection methods. Apart from sourcing information from nurses who had
resigned from the public health facilities human resources department, the researcher
also obtained information from the Nurses Council of Namibia.
5.5. RECOMMENDATIONS
The recommendations are based on three functions of nursing: management,
education, and research.
5.5.1 Management
Improving managerial performance should be at the forefront of any initiative
focused on decreasing nurse turnover. This requires providing managers with
knowledge, tools, and time needed to engage nurses around critical workplace issues
that drive turnover. The researcher makes the following recommendations to the
management of MoHSS.
Remuneration/ salaries: The remuneration levels were a concern to most of the
respondents. These findings were also confirmed by those who have left the
public health sector for alternative jobs. Management should elicit government to
review the remuneration packages so that they are commensurate with those that
are paid in private hospitals and within the SADC region. There is a need to
benchmark with other health care organisations in order to arrive at an equitable
salary range. This could reduce turnover.
112
Management should clearly communicate work expectations to nurses,
providing information showing nurses’ performance relative to their work goals,
and giving nurses the opportunity to engage in conversations with leaders on
ways to improve performance and to increase nurses’ sense of autonomy and
control over their work. These managerial practices also should reduce stress-
related turnover caused by role ambiguity.
The health care sector needs to introduce exit interviews to determine what is
causing the turnover and make efforts to rectify the causes. This would assist
management to retain nursing staff and reduce both recruitment and training
costs. Regular surveys should be undertaken to also assist in detecting
problematic issues affecting the nursing staff.
5.5.2 Education
This study revealed lack of training and development practices for nurses in the
public health facilities. To address this, the following recommendations are
presented.
Strengthen orientation and training of new employees so that they can be clear
about what is expected of them and that positive feedback is given for job well
done in order to avoid turnover.
Stress management programmes should be made available for staff members by
conducting regular staff meetings where nurses can contribute their views, offer
flexible staffing arrangements, and by providing regular in-service/education
programmes which would enable staff to stay abreast of changes in healthcare.
The study revealed a lack of teamwork. A platform should be created to
encourage team building in order to establish better communication and problem-
solving between and within different teams. MoHSS should include in their
113
budgets team building activities. This can encourage the nursing staff to avoid
quit intentions from the healthcare institutions. There should be programmes to
assist staff to cope with their work and expectations.
Several methods can be used to provide and maintain continuing education
among staff members such as small-group activities in which staff members of
the same unit share interesting clinical experiences or other topics of mutual
interest with staff members of another unit. This may inspire some nurses to
further their educational training and may encourage others to read relevant
nursing literature to extend their knowledge. Programmes could be planned with
other healthcare services in the community with the aim of giving staff members
an insight into new techniques. Institutions should support individual
programmes for continuing education, such as degree courses at universities and
correspondence or college courses relevant to nursing. In addition, there is a need
to support attendance of workshops, seminars, conferences in order to develop
staff.
Management should ensure that employees with appropriate qualifications and
experience are available when the organisation requires service in order to
improve the quality of employees when they get the opportunity to progress in
their careers. Career development should reduce turnover as employees would
probably decide to stay instead of seeking greener pastures outside the
organisation.
5.5.3 Further research
The study only focused on nurse turnover in public health facilities in the Khomas
Region. Nurse turnover seems to be a national problem in Namibia. Therefore,
studies need to be undertaken in all the regions in Namibia to find out the extent to
114
which nurse turnover varies from one region to another and seek solutions that can
help the entire country. Further research should be conducted using in-depth
interviews to further explore the factors associated with nurse turnover in public
health facilities.
5.6. CONTRIBUTIONS OF THE STUDY
Based on the findings of the study it is suggested that this study contributed to the
body of knowledge, service providers, and the nursing profession.
5.6.1 Body of knowledge
According to the literature search, no study exists that focuses on factors affecting
nursing staff turnover within the Khomas Region of Namibia. Understanding of the
challenges associated with turnover among nurses provides a baseline for other
researchers relating to turnover of nurses in the country.
5.6.2 Service providers
The study should inform and assist MoHSS, policy-makers and healthcare center
management to use the results for follow-up organisation improvement initiatives
and to establish a baseline for future assessments in its pursuit to retain nursing staff
which should result in better service delivery and improved patient satisfaction.
5.6.3 Nursing profession
The study provides useful information on the factors that public health management
should address in order to curb the exodus of nurses from the sector. In addition, the
study contributes to the body of knowledge and literature relating to nurse turnover.
5.7. SUMMARY
This chapter represents the last part of this study. The research findings were discussed and
concluded. Limitations encountered during the study were revealed. Furthermore, the
recommendations based on the three functions namely management, education and research
were presented. Finally the chapter discussed the study’s contributions to the body of
knowledge, service providers and nursing professions.
115
REFERENCES
Abeysekera, R.(2007).The Impact of Human Resource Management Practices on
Marketing Executive Turnover of Leasing Companies in Sri Lanka.
Allen, R. K. (2000). Lean and mean: Workforce 2000 in America. Journal of
Workplace Learning, 9(1), 34-42
Anderson, T. P., Lindrud, S. N., Maharaj, G. R., Panser, C. J., Scott, M. J., & Sides,
T. L. W. (2010). U.S. Patent No. 7,819,911. Washington, DC: U.S. Patent
and Trademark Office.
Armstrong, M., & Baron, A. (2005). Managing performance: performance
management in action. CIPD publishing.
Aryee, S., & Chay, Y. W. (2001). Workplace justice, citizenship behaviour, and
turnover
Austin, S., Baldwin, A., Li, B., & Waskett, P. (1999). Analytical design planning
technique: a model of the detailed building design process. Design
studies, 20(3), 279-296.
Babbie, E (2005), The basic of social research (3rd
ed.) Canada
Ball, J. (2003), Understanding Herzburg’s Motivation Theory (2nd
ed.).United
Kingdom:
Baloch, Q. B., & Inam, M. (2009). Strategic Competitiveness: Creating Firm's
Future. Journal of Managerial Sciences, 3(1).
Baumann, N., & Scheffer, D. (2010). Seeing and mastering difficulty: The role of
affective behavior and outcomes: An examination among senior
managers. Journal of managerial Psychology, 18(8), 788-813.
Blaauw et al (2014). Comparing the job satisfaction and intention to leave of
different categories
Bogonko, M.N. & Kathure, K. C. (2015). An investigation into factors causing high
nurse turnover in mission hospital in Kenya: A case for Pcea Chogoria
116
Hospital. International Journal of Academic Research in Business and Social
Sciences. 5(3) : 2222-6990
Bommer, W., Rubin, R., & Baldwin, T. (2004). Setting the stage for effective
leadership: Antecedents of transformational leadership behaviour. The
Leadership Quarterly, (15)195-210.
Booyens, S. V. (2004). Introduction to Health Service Management. Company Ltd.
Branham, L. (2005). The 7 hidden reasons employees leave. American Management,
New York, 172.
Brink, H., Van der Walt, C. & Ransburg, G. (2016). Fundamentals of research
methodology fohealthcare professionals. 3rd
ed. Cape Town: Juta.
Buchan, J. (2004). Commentary, Nurse Workforce Planning in the UK: Policies and
Impact. Journal of Nursing Management.
Carmeli, A. (2003). The relationship between emotional intelligence and work
attitudes,
Cavanagh, S.J. & Coffin, D.A. (1992). Staff turnover among hospital nurses:
Employee turnover.Journal of Advanced Nursing.17 (11):1369-76.center:
Journal of Nursing Administration, 31(4), 210-6 change in achievement
flow. Cognition and Emotion, 24(8), 1304-1328.
Chatzizisis, Y. S., Coskun, A. U., Jonas, M., Edelman, E. R., Feldman, C. L., &
Stone, P. H. (2007). Role of endothelial shear stress in the natural history of coronary
atherosclerosis and vascular remodeling: molecular, cellular, and vascular
behavior. Journal of the American College of Cardiology, 49(25), 2379-2393.
Chen, J., & Chen, Z. (2008). Extended Bayesian information criteria for model
selection with large model spaces. Biometrika, 95(3), 759-771.
Cohen, L., Manion, L., & Morrison, K. (2012). Research methods in education. 5th
ed. London and New York: Routledge.
117
Cohen, J., Stuenkel, D., & Nguyen, Q. (2009). Providing a healthy work environment
for nurses: the influence on retention. Journal of Nursing Care
Quality, 24(4), 308-315.
Cole, L. E., & Cole, M. S. (2005). Employee Satisfaction and organizational
performance: a summary of key findings from applied psychology. Retrieved
April 21, 2017, from http://www.teammax.net/files/LiteratureReview.pdf
Cooper, W. W., Seiford, L. M., & Zhu, J. (Eds.). (2011). Handbook on data
envelopment analysis (Vol. 164). Springer Science & Business Media.
Cowin, L. (2002). The effects of nurses’ job satisfaction on retention: An Australian
perspective. Journal of Nursing Administration, 32(5), 256-291.
Creswell, J. (2014). Research design: Qualitative, quantitative and mixed methods
approaches (4th
ed). Los Angeles: SAGE
De Troyer, M. (2000, September). The hospital sector in Europe. In Introductory
Report, TUTB-SALTSA Conference, Brussels.
De Vos, A. S., Delport, C. S. L., Fouché, C. B., & Strydom, H. (2011). Research at
grass roots: A primer for the social science and human professions.
Dess, G. G., & Shaw, J. D. (2001). Voluntary turnover, social capital, and
organizational performance. Academy of management review, 26(3),
446-456. development in education (6. b.).
Dieleman, M. & Harnmeijer, J.W., 2006, Improving health worker performance: In
search of promising practices, Royal Tropical Institute.
Dovlo D. 2007. Migration of nurses from Sub-Saharan Africa: A review of issues
and challenges. Health Services Research.
Dudoskiy, J. (2016). The ultimate guide to writing a dissertation in business studies:
A step-by-step assistance. Retrieved from
http://www.research methodoloy.net/about- us/ebook/
118
Dunn, A. L., Trivedi, M. H., Kampert, J. B., Clark, C. G., & Chambliss, H. O.
(2005). Exercise treatment for depression: efficacy and dose
response. American journal of preventive medicine, 28(1), 1-8.
Effken, J.A., Verran, J.A., Logue, M.D. & Ya-Chuan, H., (2010). Nurse managers'
decisions: Fast and favoring remediation. Journal of Nursing
Administration, 40(4), 188-195.
Emory, C. W., & Cooper, D. R. (1991). Business Research Methods. Homewood IL:
Richard D. Irwin.
Engeda, E. H., Birhanu, A. M., & Alene, K. A. (2014). Intent to stay in the nursing
profession and associated factors among nurses working in Amhara
Regional State Referral Hospitals, Ethiopia. BMC nursing, 13(1), 24.
Erickson, F. (1985). Qualitative Methods in Research in Research on Teaching. East
for Native North America. Healing traditions: The mental health of
Aboriginal peoples. Vancouver: University of British Columbia.
Friese, S. (2014). Qualitative data analysis with ATLAS.ti. London:Sage.
Gardulf, A., Orton, M., Eriksson, L. E., Unden, M., Arnetz, B., Kajermo, K. N., &
Nordstrom, G. (2008). Factors of importance for work satisfaction among
nurses in a university hospital in Sweden. Scandinavian Journal of Caring
Sciences, 22(2), 151-160.
Garrosa, E., Moreno-Jimenez, B., Liang, Y., & Gonzalez, J. L. (2008). The
relationship between socio-demographic variables, job stressors, burnout,
and hardy personality in nurses: An exploratory study. International
journal of nursing studies, 45(3), 418-427.
Gayet, S., Paffen, C. L., & Van der Stigchel, S. (2013). Information matching the
content of visual working memory is prioritized for conscious
access. Psychological science, 24(12), 2472-2480.
Gillies, A. S. (2004). Epistemic conditionals and conditional epistemics. Noûs, 38(4),
585-616.
119
Gone, J. P. (2009). Encountering professional psychology: Re-envisioning mental
health services government. Review of public personnel
administration, 20(2), 63-74.
Gray, A.M. & Phillips, V.L. (1994).Turnover, age and length of service: a
comparison of nurses and other staff in the National Health Service.
Journal of Advanced Nursing, 19 (4), 819-827.
Gregory, K. (2011). The importance of employee satisfaction. The Journal of the
Division of
Business & Information Management. Retrieved March, 5, 2014.
Greyling, J., & Stanz, K. (2010). Turnover of nursing employees in a Gauteng
hospital group. SA Journal of Industrial Psychology, 36(1), 11-pages.
Griffeth, R. & Hom, P. (2001). Retaining Valued Employees, Thousand Oaks, Calif:
SAGE Publications Inc., eBook Collection (EBSCOhost), [viewed 9
September 2017].
Grove, S., Burns, N., & Gray, J. (2013). The practice of nursing research: Appraisal,
synthesis and generation of evidence. (7th
ed.) Elsevier: St Louis,
Missouri.
Hall, E.J. (2004). Nursing attrition and the work environment in South African health
facilities.
Hamaideh, S. H. (2011). Stressors and reactions to stressors among university
students. International journal of social psychiatry, 57(1), 69-80.
Haoses-Gorases, L., Jonas, A., & Kapaama, P. (2014). Professional staff turnover in
the Namibian public sector. International Journal of Innovative and
Applied Research, 2(2), 2.
Hart, S. E. (2005). Hospital ethical climates and registered nurses' turnover
intentions. Journal of Nursing Scholarship, 37(2), 173 177.
Hayajneh, Y. A. (2001). Identification of the influence of organizational variables on
hospital staff nurses' job performance.
120
Hayes, L. J., O’Brien-Pallas, L., Duffield, C., Shamian, J., Buchan, J., Hughes, F., &
Stone, P. W. (2006). Nurse turnover: a literature review. International journal
of nursing studies, 43(2), 237-263.Healthcare.
Healy, M. & Perry, C. (2000). Comprehensive criteria to judge validity and
reliability of qualitative research within the realism paradigm. International
Journal on Qualitative Market Research. 3(3), 118-126.
Henning, E., Van Rensburg, W., & Smit, B. (2004). Finding your way in qualitative
research.
Hinkin, T. R., & Tracey, J. B. (2000). The cost of turnover: Putting a price on the
learning curve. Cornell hotel and restaurant administration quarterly, 41(3),
14-21Human resource management. (6th
ed.). Oxford: Oxford University
Human
Hunt, S. T. (2009). Nursing turnover: costs, causes, and solutions. Success Factors
for Healthcare, 1-12.
Heckard, U., & Utts, J. M. (2007). Mind on Statistics.
Khatri, N., Fern, C. T., & Budhwar, P. (2001). Explaining employee turnover in an
Asian context. Human Resource Management Journal, 11(1), 54-74.
Keller, G., & Warrack, B. (2003). Statistics for management and economics,
ThomsonLearning. Inc., USA.
Khin, E. W. S., & Heng, T. N. (2012). Epistemological Taxonomy in Management &
Ac-counting Research Philosophy. Actual Problems of Economics
(131): 330-338.
Khoele, A., & Daya, P. (2014). Investigating the turnover of middle and senior
managers in the pharmaceutical industry in South Africa. SA Journal of
Human Resource Management, 12(1), 1-10.
Kitson, A., Harvey, G., & McCormack, B. (1998). Enabling the implementation of
evidence based practice: a conceptual framework. Quality and Safety
in Health Care, 7(3), 149-158.
Kombo, D. K., & Tromp, D. L. (2006). A (2006). Proposal and thesis writing.
121
Kosteas, V. D. (2011). Job satisfaction and promotions. Industrial Relations: A
Journal of Economy and Society, 50(1), 174-194.
Krippendorff, K. (2013). Analysis Content. Lansing, Mich.: Institute for Research on
Teaching.
Law Dictionary (n.d.)
Laphalala, R.P., (2006). Factors Influencing Nursing Turnover in selected Private
hospitals in England: University of South Africa. MBA project unpublished
Lu, K. Y., Lin, P. L., Wu, C. M., Hsieh, Y. L., & Chang, Y. Y. (2002). The
relationships among turnover intentions, professional commitment, and
job satisfaction of hospital nurses. Journal of Professional
Nursing, 18(4), 214-219.
Lum, W. (2002). The use of self of the therapist. Contemporary Family
Therapy, 24(1), 181-197.
Manley, K. (2000). Organisational culture and consultant nurse outcomes: part 2
nurse outcomes. Nursing Standard, 14(37), 34-38.
Manojlovich, M. (2005). Promoting nurses' self‐efficacy: a leadership strategy to
improve practice. Journal of Nursing Administration, 35(5), 271-278.
Mathis, R.B., & Jackson, J.H. 2007. Human Resource Management. 10th
Edition.
Singapore: Thompson.
Maurer, T. J. (2001). Career-relevant learning and development, worker age, and
beliefs about self-efficacy for development. Journal of management, 27(2),
123-140.
Mccooey, D., & McCooey, D. (2009). Keeping good employees on board: Employee
retention strategies to navigate any economic storm. Morgan James
Publishing.
McCormack, B., Kitson, A., Harvey, G., Rycroft‐Malone, J., Titchen, A., & Seers, K.
(2002). Getting evidence into practice: the meaning ofcontext'. Journal of
advanced nursing, 38(1), 94-104.
122
McDaniel, C. & Gates, R. 2006. Marketing Research Essentials. 5th
ed. New Jersey:
John Wiley and Sons.
McGovern, T. V., & Miller, S. L. (2008). Integrating teacher behaviors with
character strengths and virtues for faculty development. Teaching of
Psychology, 35(4), 278-285.
Milkovich, G. T., Newman, J. M., & Cole, N. (2005). Compensation, First Canadian
Edition.
Mkansi, M. & Acheampong, E. A. (2012). Research Philosophy Debates and
Classifications: Students’ Dilemma. The Electronic Journal of
Business Research Methods, l0, 132-140.
Mohamad A., (2006). Turnover Intentions of Hotel Employees: The role of HRM
practices, trust in organizations, and affective commitment.
Nel, P. S., Van Dyk, P. S., Haasbroek, G.D., Schultz, H. B., Sono, T., & Werner, A.
(2004).
Netswera, F. G. (2008). A case study of community participation in governance and
service delivery in the City of Johannesburg. Consolidating developmental
local government: lessons from the South African experience.
Noe, H. (2006). Gerhart and Wright. 2000. Fundamentals of human resource.
O'Brien-Pallas, L., Duffield, C., & Hayes, L. (2006). Do we really understand how to
retain of health workers in Tanzania, Malawi, and South Africa.
Journal of Global Health
Olds, D. M., & Clarke, S. P. (2010). The effect of work hours on adverse events and
errors in health care. Journal of safety research, 41(2), 153-162.
organizational change. Strategic HR Review, 6(5), 16-19.
Oulton, J. A. (2006). The global nursing shortage: an overview of issues and
actions. Policy,
123
Onyango, P. O. (2017). Influence Of Talent Management On Employee Retention In
Public Hospitals In Kenya; A Case Of Siaya County Refferal
Hospital. Strategic Journal of Business & Change Management, 4(2).
Özdemir, N., Karadeniz, D., & İskender, B. B. (2009). Fractional optimal control
problem of a distributed system in cylindrical coordinates. Physics
Letters A, 373(2), 221-226.
Pardey, D. (2007). Leadership in turbulent times: Effective leadership during times
of organizational change. Strategic HR Review, 6(5), 16-19.
Parker, R., (2005). Human Resource department: Capio Healthcare. United
Kingdom
Peterson, J. (2014). Philosophical paradigms, data collection, and analysis design of
a green technology education mixed methods research. Retrieved from
https://www.linkedin.com/pulse/20140714153011-31971126-philosophical
paradigms-data-collection-and-analysis-design-of-a-green-technology
education-mixed-methods-research
Phillips, P. J., & Beveridge, J. R. (2009, September). An introduction to biometric
completeness: The equivalence of matching and quality. In Biometrics:
Theory, Applications, and Systems, 2009. BTAS'09. IEEE 3rd International
Conference on (pp. 1-5).
Polit, D. F., & Beck, C. T. (2008). Nursing research: Generating and assessing
evidence for nursing practice. Lippincott Williams & Wilkins. Politics,
& Nursing Practice, 7(3_suppl), 34S-39S.
Price J., Mueller C., (2001). Professional Turnover, the Case for Nurses: Ames, IA,
USA: Iowa
Price, J. L., & Mueller, C. W. (1981). A causal model of turnover for
nurses. Academy of management journal, 24(3), 543-565.
Rahmawati, Y. (2008). Epistemological, Ontological, and Methodological. Viewed
at
124
https://pendidikansains.wordpress.com/2008/04/12/epistemological-
ontological-and-methodological/ Date accessed: 16 October 2017.
Rambur, B., Mclntosh, B., Palumbo, M.V. & Reinier, K., (2005). Education as a
determinant of career retention and job satisfaction among registered
nurses: Image. Journal of Nursing Scholarship, 37(2): 185-192
Rankhumisi, E.M. & Mavundla, T.R., 2005, 'Employee retention factors for
SouthResearch in the Built Environment: Application of "Mixed" Research
Approach. Works Study, 51 (1):17-31.Resource Management 3(2), 36-40.
resource management. (6th
ed.).
Oxford: Oxford University Press.Netswera, F.G.,
Rheingans, J. I. (2008). Pediatric oncology nurses' management of patients'
symptoms. Journal of Pediatric Oncology Nursing, 25(6),
303-311.
Richard, J. P. (2003). Time-delay systems: an overview of some recent advances and
open problems. automatica, 39(10), 1667-1694.
Robbins, P. S. (2004). Organizational behaviour. New Jersey: Prentice Hall.
Sadri, J., Sadri, S., &Nayak, N. (2011).Human resource management. Delhi:
Jaico.satisfaction and satisfaction with the professional practice model.
Journal of
Samad, S. (2006). Predicting turnover intentions: The case of Malaysian government
doctors. Journal of American Academy of Business, 8(2), 113-119.
Sekeran, U. & Bougie, R. (2013). Research methods for business: A skill building
approach. (6th
ed.) New York: Wiley.
Shader, K., Broome, M. E., Broome, C. D., West, M. E., & Nash, M. (2001). Factors
influencing satisfaction and anticipated turnover for nurses in an academic
medical center. Journal of Nursing Administration, 31(4), 210-216.
Silver,C.& Lewins, A. (2014).Using software in qualitative research: A step-by-step
guide.(2nd
ed.).Thousand Oaks, CA: Sage Publications.
125
Simon, M. 2014.Nine per cent of nurses across Europe report intent to leave their
profession with burnout among the associated personal and
professional factors. Evidence Based Nursing, 17(2); 54-5
Smerek, R. E., & Peterson, M. (2007, March). Examining Herzberg’s theory:
Improving Job Satisfaction among non-academic employees at a
University. Research in Higher Education, 48(2). Retrieved from
http://www.sesp.northwestern.edu/docs/publications/75905635251f8
1e09ecbfa.pdf.
Smith, J. A. (Ed.). (2007). Qualitative psychology: A practical guide to research
methods. Sage.
Stamps, P. L., & Piedmonte, E. B. (1986). Nurses and work satisfaction: An index
for
measurement. Health Administration Press.
Stanz, K., & Greyling, J. (2010).Turnover of nursing employees in a Gauteng
hospital group: original research. SA Journal of Industrial
Psychology. 36(1).State University Press.
Strachota, E., Normandin, P., O’brien, N., Clary, M., & Krukow, B. (2003). Reasons
registered nurses leave or change employment
status. Journal of Nursing Administration, 33(2), 111-117.
Stone, P. W., & Gershon, R. R. (2006). Nurse work environments and occupational
safety in intensive care units. Policy, Politics, & Nursing Practice, 7(4), 240
247.
Styptak, J.M., Marsland, D.W., & Ulmer, D. (1999). Job satisfaction: Putting theory
into Practice.
Sullivan E.J.,& Decker P.J., (2005). Effective Leadership & Management in Nursing,
6 Th Edition: Pearson Prentice Hall, New Jersey.
Swanepoel, B. J., Erasmus, B. J., & Schenk, H. W. (2008).South African Human
Resources Management: Theory and Practice. (4th
ed.). Cape Town,
South Africa: Juta.
126
Taylor, B.J. (2006). Research in nursing and health care: evidence for practice. 3rd
ed. Australia: Carnage Learning.
Tetlow, I. J., Morell, M. K., & Emes, M. J. (2004). Recent developments in
understanding the regulation of starch metabolism in higher
plants. Journal of experimental botany, 55(406), 2131-2145.
Tinker, A., Sweetham, J., & Nelson, J. W. (2011). Reflection as a process to
understand
caring behaviors during implementation of Relationship-Based Care
in a community health service in England. In J. W. Nelson & J.
Watson (Eds.), Measuring Caring: A compilation of international
research on Caritas as healing intervention. New York: Springer.
Torkabadi, M., & Kheirkhah, B. (2013). Evaluating the Job Satisfaction in Iranian
Petrochemical Industry: A Case Study. New York Science Journal,
6(5). Retrieved from
http://www.sciencepub.net/newyork/ny0605/009_14992ny0605_54_6
0.pdf
Tshilongamulenzhe, M.C. (2012). Integrated learning programme management and
evaluation model for the South African skills development context.
(Unpublished doctoral dissertation). University of South Africa.
Turnover in Mission Hospitals in Kenya: A Case for Pcea Chogoria
Hospital. International
Journal of Academic Research in Business and Social Sciences, 5(3),
55.Van Schaik Publishers. Pretoria.
Wagner, A., Wright, J., Ganesh, A., Zhou, Z., Mobahi, H., & Ma, Y. (2012). Toward
a practical face recognition system: Robust alignment and illumination by
sparse representation. IEEE Transactions on Pattern Analysis and Machine
Intelligence, 34(2), 372-386.
127
Wang L, Tao H, Ellenbecker CH, Liu XH. Predictors of hospital nurses‟ intent
to stay: Across sectional questionnaire in Shanghai, China. Int Nurs Rev.
2012;59(4):547-54
Weiner, B. (1985). An attributional theory of achievement motivation and
emotion. Psychological review, 92(4), 548.
Welman, C., Kruger, F. & Mitchell, B. (2005). Research methodology. Cape Town:
Oxford.
Windle, P.E. (2008). Addressing the nurse staffing shortage. Journal of Peri
Anaesthesia
World Health Organization. (2006). The world health report 2006: working together
for health.
Yin, J. & Yang, K. (2002). Nursing turnover in Taiwan: A meta-analysis of related
factors. International Journal of Nursing Studies 2002; 39: 573–581.
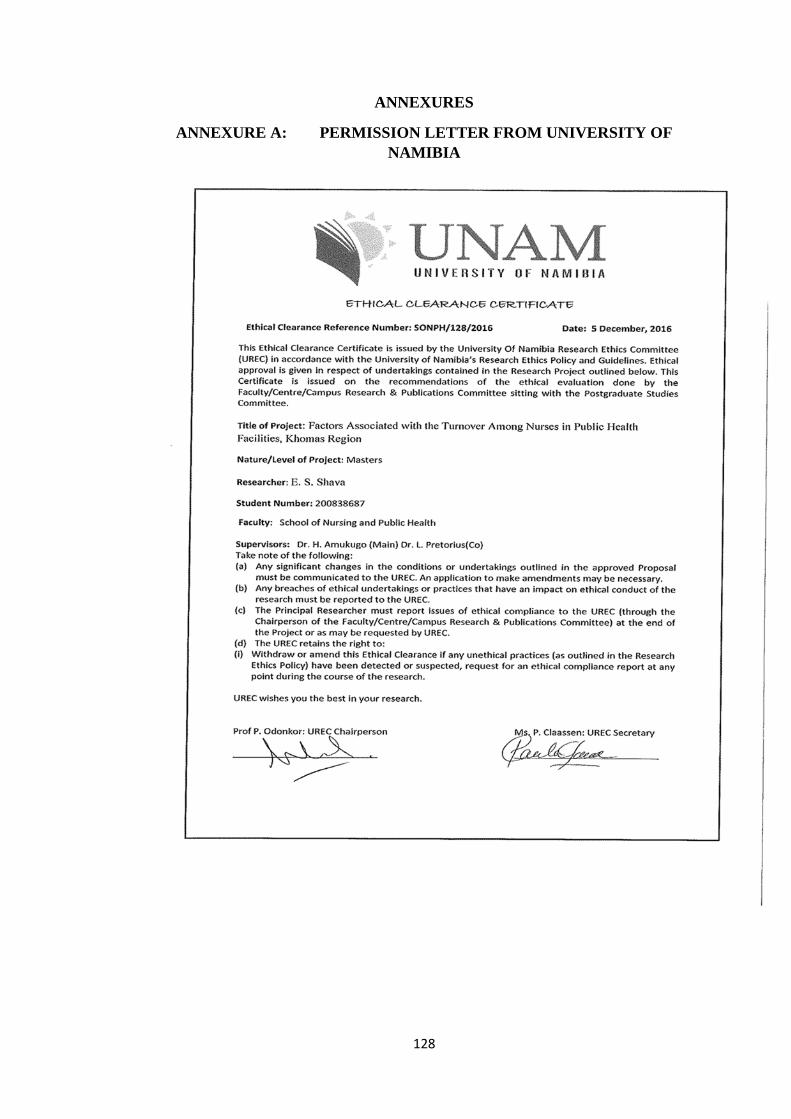
128
ANNEXURES
ANNEXURE A: PERMISSION LETTER FROM UNIVERSITY OF
NAMIBIA
129
ANNEXURE B: CLEARANCE CERTIFICATE UNIVERSITY OF
NAMIBIA
130
ANNEXURE C: PERMISSION LETTER FROM MINISTRY OF
HEALTH AND SOCIAL SERVICE NAMIBIA
131
132
ANNEXURE D: PERMISSION LETTER CATHOLIC HOSPITAL
133
ANNEXURE E: CONSENT FOR RESPONDENTS
My name is Eusebia Shava, a health professional working for Roman Catholic
Hospital in Khomas Region. I am conducting a study on factors associated with the
turnover among nurses in public health facilities, Khomas Region. You have been
selected by chance to participate in this study. Although the study will not benefit
you directly, it will provide information that might enable the Ministry of Health and
Social Services to identify the factors associated with turnover in their public health
facilities and assist them with decision making on how they can minimize the
turnover. The study is approved by training institution (UNAM) where I am currently
studying, as well as by the Ministry of Health and Social Services. It may take you
up to 20 minutes to respond to the questions. You are free to ask any question about
the study if you need more clarification. Your participation in this study is voluntary
and you have the right to refuse to participate. You also have the right to withdraw
anytime. The information collected from you will be coded so it is not linked to your
name and your identity will not be revealed at any time in a study. All data will be
kept in a secure place and will not be shared with any person without your
permission.
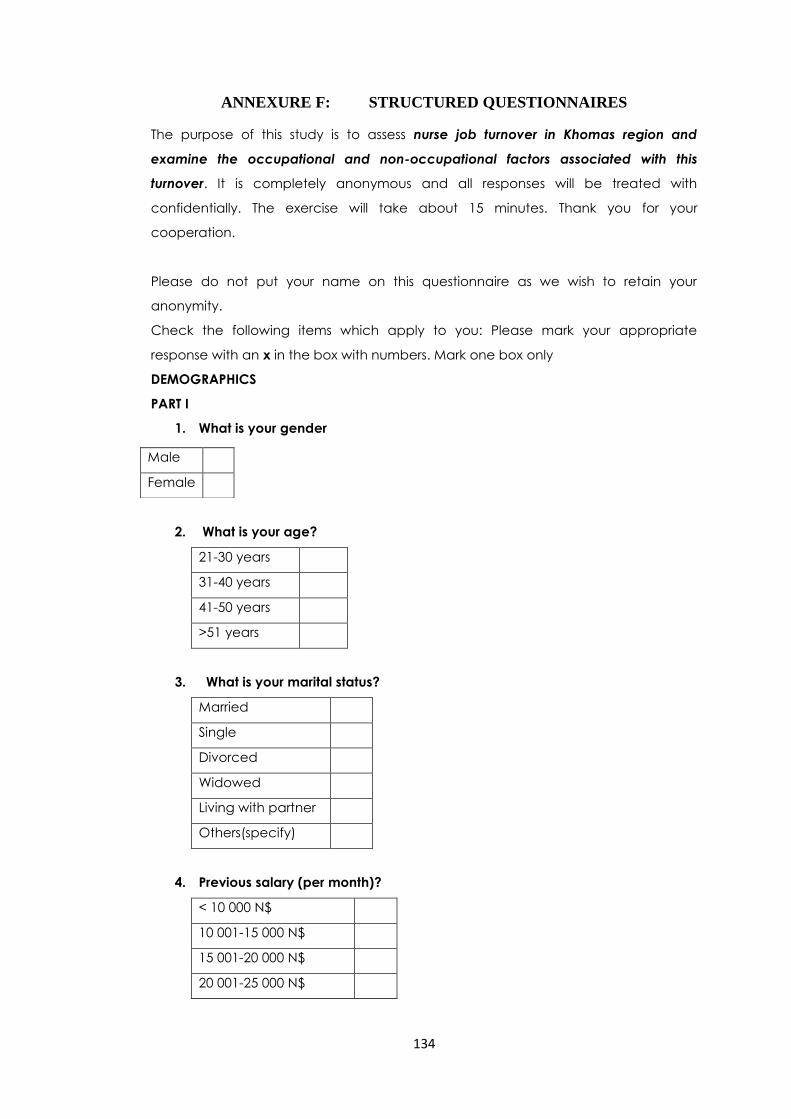
134
ANNEXURE F: STRUCTURED QUESTIONNAIRES
The purpose of this study is to assess nurse job turnover in Khomas region and
examine the occupational and non-occupational factors associated with this
turnover. It is completely anonymous and all responses will be treated with
confidentially. The exercise will take about 15 minutes. Thank you for your
cooperation.
Please do not put your name on this questionnaire as we wish to retain your
anonymity.
Check the following items which apply to you: Please mark your appropriate
response with an x in the box with numbers. Mark one box only
DEMOGRAPHICS
PART I
1. What is your gender
2. What is your age?
21-30 years
31-40 years
41-50 years
>51 years
3. What is your marital status?
Married
Single
Divorced
Widowed
Living with partner
Others(specify)
4. Previous salary (per month)?
< 10 000 N$
10 001-15 000 N$
15 001-20 000 N$
20 001-25 000 N$
Male
Female
135
25 001-30 000 N$
30 001-35 000 N$
>35 000
5. Level of education
Certificate
Diploma
Degree
Masters
Others specify
6. For how long have you worked in this position?
0-3 years
4- 7 Years
8-10 years
10 years and above

136
PART II
Contributing factors to leaving the previous job and accepting the job
SA- Strongly agree; A-Agree; N-Neutral; D-Disagree; SD-Strongly disagree
A. Company reward or compensation Practices
Please indicate your level of disagreement / agreement
with the following statements by Ticking [√] the MOST
appropriate box.
SA
1
A
2
N
3
D
4
S
D
5
1. My previous employer took pride in paying
satisfactory salary.
2. My previous employer really cared about
rewarding great achievements
3. My employer valued the well-being of employees,
inform of rewards.
4. My employer strongly considered salary increase
annually
B. The following statements relate to training and development practices
Please indicate your level of disagreement / agreement
by Ticking [√] the MOST appropriate box
SA
1
A
2
N
3
D
4
S
D
5
1 Sufficient time was allocated for training in the
previous job
2 Sufficient money was allocated for training
2 Did the training plans developed, monitored for
all employees?
3 Training programmes were consistently evaluated.

137
C. The following statements relate to promotional opportunities in your
previous job.
Please indicate your level of disagreement /
agreement by Ticking [√] the MOST appropriate box
SA
1
A
2
N
3
D
4
SD
5
1. I had a very good opportunity for
advancement in my previous job.
2. I had a good chance for promotion.
3. Promotions were always based on my ability.
4. Opportunities for promotion were limited.
D. The following statements relate to recognition factors by your previous
employer
Please indicate your level of disagreement /
agreement by Ticking [√] the MOST appropriate box.
SA
1
A
2
N
3
D
4
SD
5
1 The company cared about employees’
opinions
2 A work-supervisor cared about employees’
well-being
3 A supervisor who considered employees’ goals
and values
4 Unsupportive workmates towards others’ work
E. The following statements relates to work – related stress in the previous job.
Please indicate your level of disagreement /
agreement by Ticking [√] the MOST appropriate box?
S A
1
A
2
N
3
D
4
SD
5
1 Health facility working hours were normal
2 Conditions within the job was manageable
3 Unsupportive workmates towards others’ work
F Leadership relationship factors in the previous job
Please indicate your level of disagreement /
agreement by Ticking [√] the MOST appropriate box?
SA
1
A
2
N
3
D
4
SD
5
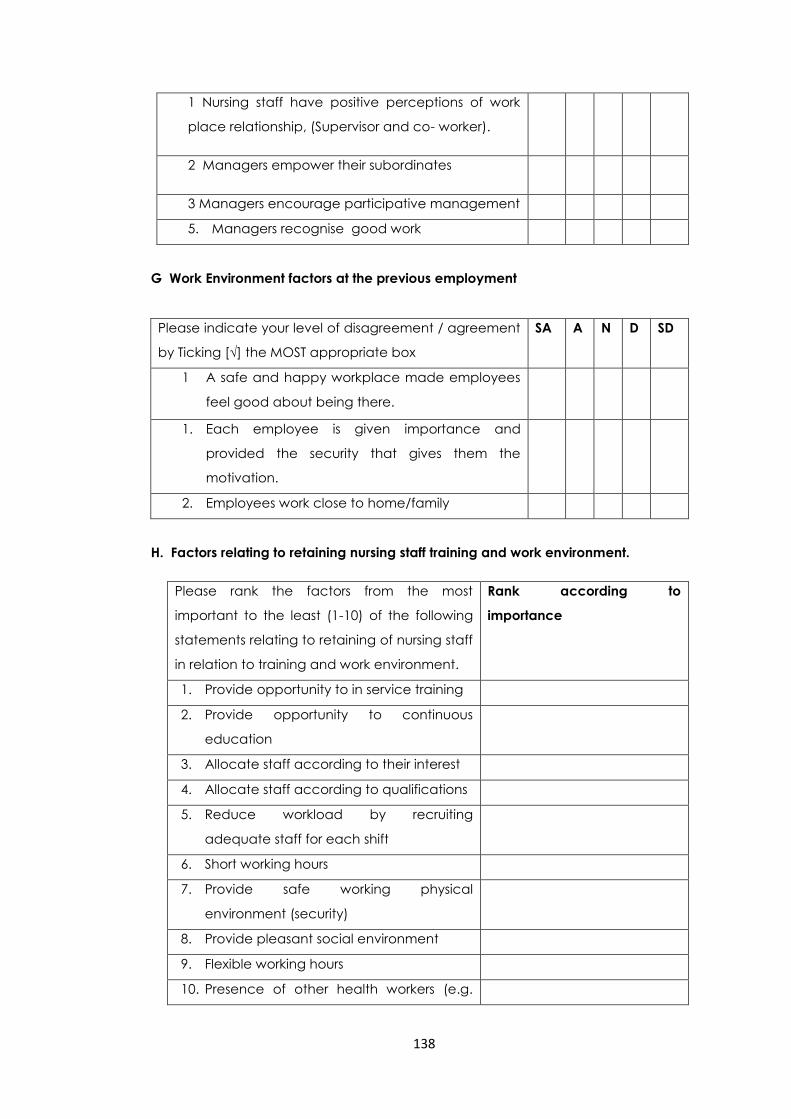
138
1 Nursing staff have positive perceptions of work
place relationship, (Supervisor and co- worker).
2 Managers empower their subordinates
3 Managers encourage participative management
5. Managers recognise good work
G Work Environment factors at the previous employment
Please indicate your level of disagreement / agreement
by Ticking [√] the MOST appropriate box
SA A N D SD
1 A safe and happy workplace made employees
feel good about being there.
1. Each employee is given importance and
provided the security that gives them the
motivation.
2. Employees work close to home/family
H. Factors relating to retaining nursing staff training and work environment.
Please rank the factors from the most
important to the least (1-10) of the following
statements relating to retaining of nursing staff
in relation to training and work environment.
Rank according to
importance
1. Provide opportunity to in service training
2. Provide opportunity to continuous
education
3. Allocate staff according to their interest
4. Allocate staff according to qualifications
5. Reduce workload by recruiting
adequate staff for each shift
6. Short working hours
7. Provide safe working physical
environment (security)
8. Provide pleasant social environment
9. Flexible working hours
10. Presence of other health workers (e.g.

139
doctors, pharmacists, radiographer etc.)
11. Sufficient equipment, medication and
other supplies
12. Provide updated technological
equipment
13. Provide good management/ supervision
etc.
14. Provide transport to work place
I. The role of recognition/staff reward on nursing staff turnover
Please indicate your response to the following statements
relating to effect of recognition and reward of staff turnover
by Ticking [√] the MOST appropriate box
Yes
0
No
01
1. Annual bonus
2. Performance bonus
3. Performance award (certificate)
4. Performance award and bonus
5. Simplified criteria of promotion
6. Publicise acknowledgment of achievements
J. In your own opinion what can the public health facilities do to retain nursing
staff?
………………………………………………………………………………………………………
………………………………………………………………………………………………………
………………………………………………………………………………………………………
………………………………………………………………………………………………………
………………………………………………………………………………………………………
………………………………………………………………………………………………………
…………………………………………………………………
K. In your own opinion explain whether /or not Recognition/Reward Practices
causes staff turnover?
………………………………………………………………………………………………………
………………………………………………………………………………………………………
………………………………………………………………………………………………………

140
………………………………………………………………………………………………………
…………………………………………………………………………
L. What other factors that could have influenced you to leave your previous
employment?
……………………………………………………………………………………………………………
……………………………………………………………………………………………………………
……………………………………………………………………………………………………………
……………………………………………………………………………………………………………
…………………………………………
THANK YOU FOR YOUR PARTICIPATION
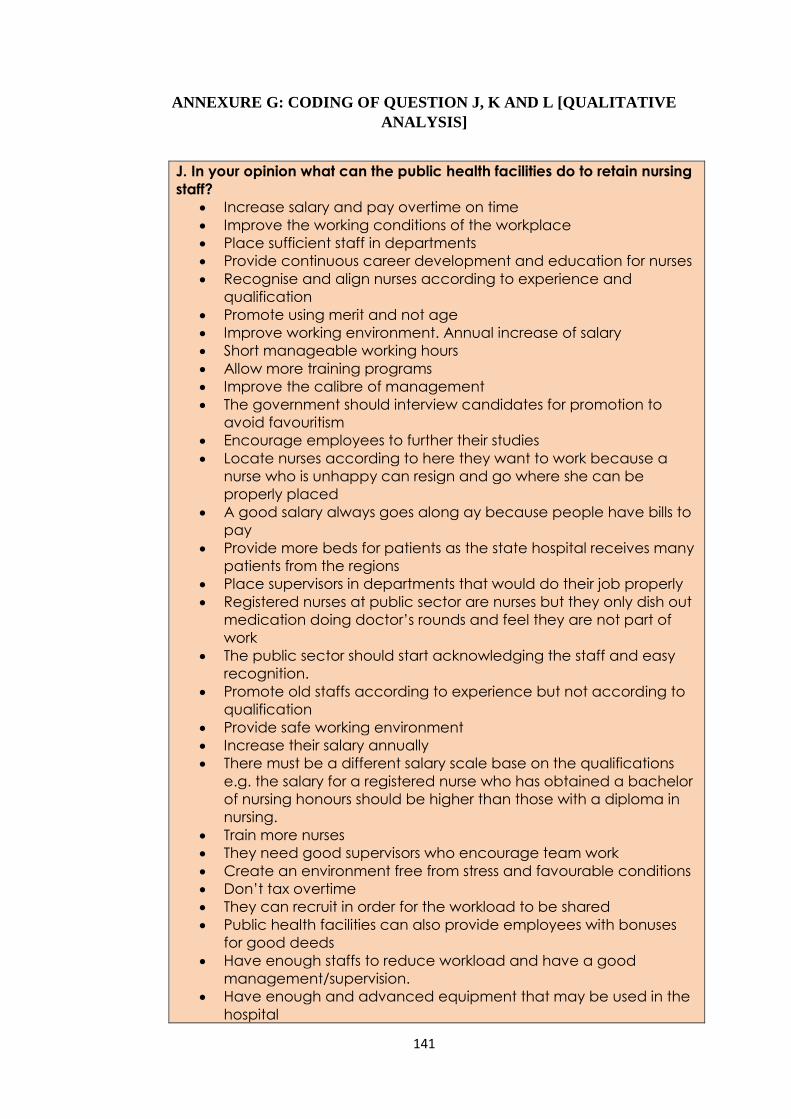
141
ANNEXURE G: CODING OF QUESTION J, K AND L [QUALITATIVE
ANALYSIS]
J. In your opinion what can the public health facilities do to retain nursing
staff?
Increase salary and pay overtime on time
Improve the working conditions of the workplace
Place sufficient staff in departments
Provide continuous career development and education for nurses
Recognise and align nurses according to experience and
qualification
Promote using merit and not age
Improve working environment. Annual increase of salary
Short manageable working hours
Allow more training programs
Improve the calibre of management
The government should interview candidates for promotion to
avoid favouritism
Encourage employees to further their studies
Locate nurses according to here they want to work because a
nurse who is unhappy can resign and go where she can be
properly placed
A good salary always goes along ay because people have bills to
pay
Provide more beds for patients as the state hospital receives many
patients from the regions
Place supervisors in departments that would do their job properly
Registered nurses at public sector are nurses but they only dish out
medication doing doctor’s rounds and feel they are not part of
work
The public sector should start acknowledging the staff and easy
recognition.
Promote old staffs according to experience but not according to
qualification
Provide safe working environment
Increase their salary annually
There must be a different salary scale base on the qualifications
e.g. the salary for a registered nurse who has obtained a bachelor
of nursing honours should be higher than those with a diploma in
nursing.
Train more nurses
They need good supervisors who encourage team work
Create an environment free from stress and favourable conditions
Don’t tax overtime
They can recruit in order for the workload to be shared
Public health facilities can also provide employees with bonuses
for good deeds
Have enough staffs to reduce workload and have a good
management/supervision.
Have enough and advanced equipment that may be used in the
hospital
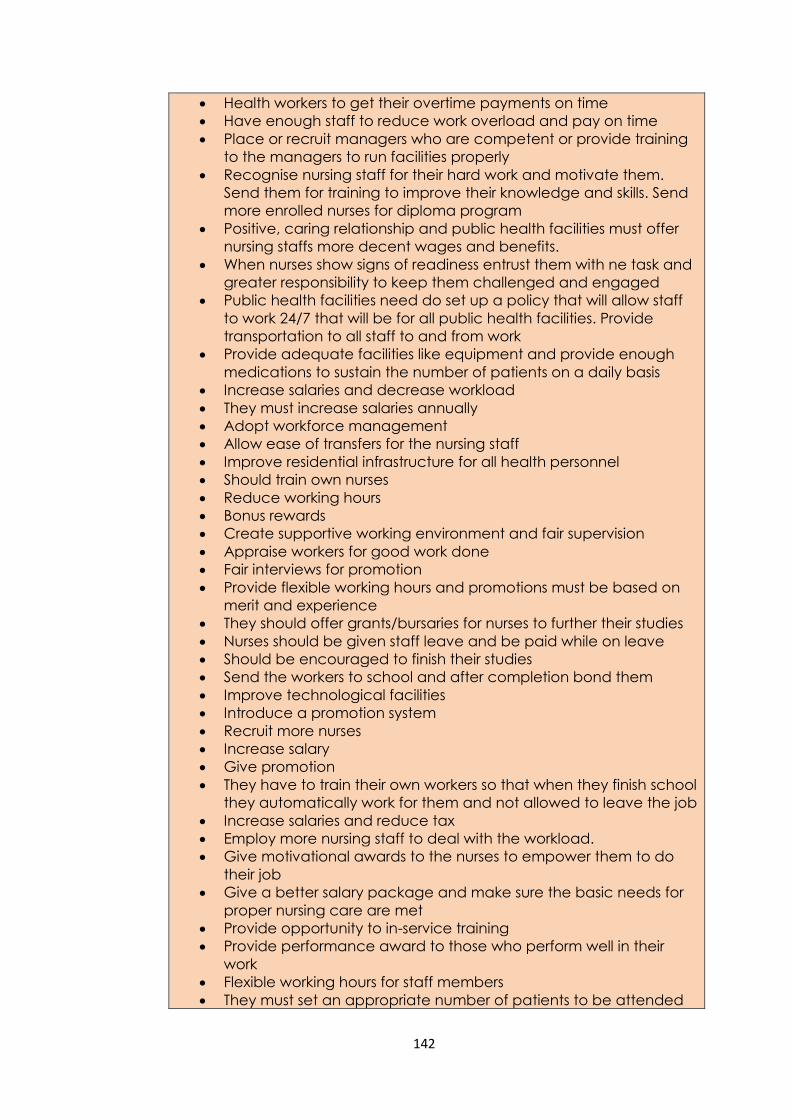
142
Health workers to get their overtime payments on time
Have enough staff to reduce work overload and pay on time
Place or recruit managers who are competent or provide training
to the managers to run facilities properly
Recognise nursing staff for their hard work and motivate them.
Send them for training to improve their knowledge and skills. Send
more enrolled nurses for diploma program
Positive, caring relationship and public health facilities must offer
nursing staffs more decent wages and benefits.
When nurses show signs of readiness entrust them with ne task and
greater responsibility to keep them challenged and engaged
Public health facilities need do set up a policy that will allow staff
to work 24/7 that will be for all public health facilities. Provide
transportation to all staff to and from work
Provide adequate facilities like equipment and provide enough
medications to sustain the number of patients on a daily basis
Increase salaries and decrease workload
They must increase salaries annually
Adopt workforce management
Allow ease of transfers for the nursing staff
Improve residential infrastructure for all health personnel
Should train own nurses
Reduce working hours
Bonus rewards
Create supportive working environment and fair supervision
Appraise workers for good work done
Fair interviews for promotion
Provide flexible working hours and promotions must be based on
merit and experience
They should offer grants/bursaries for nurses to further their studies
Nurses should be given staff leave and be paid while on leave
Should be encouraged to finish their studies
Send the workers to school and after completion bond them
Improve technological facilities
Introduce a promotion system
Recruit more nurses
Increase salary
Give promotion
They have to train their own workers so that when they finish school
they automatically work for them and not allowed to leave the job
Increase salaries and reduce tax
Employ more nursing staff to deal with the workload.
Give motivational awards to the nurses to empower them to do
their job
Give a better salary package and make sure the basic needs for
proper nursing care are met
Provide opportunity to in-service training
Provide performance award to those who perform well in their
work
Flexible working hours for staff members
They must set an appropriate number of patients to be attended
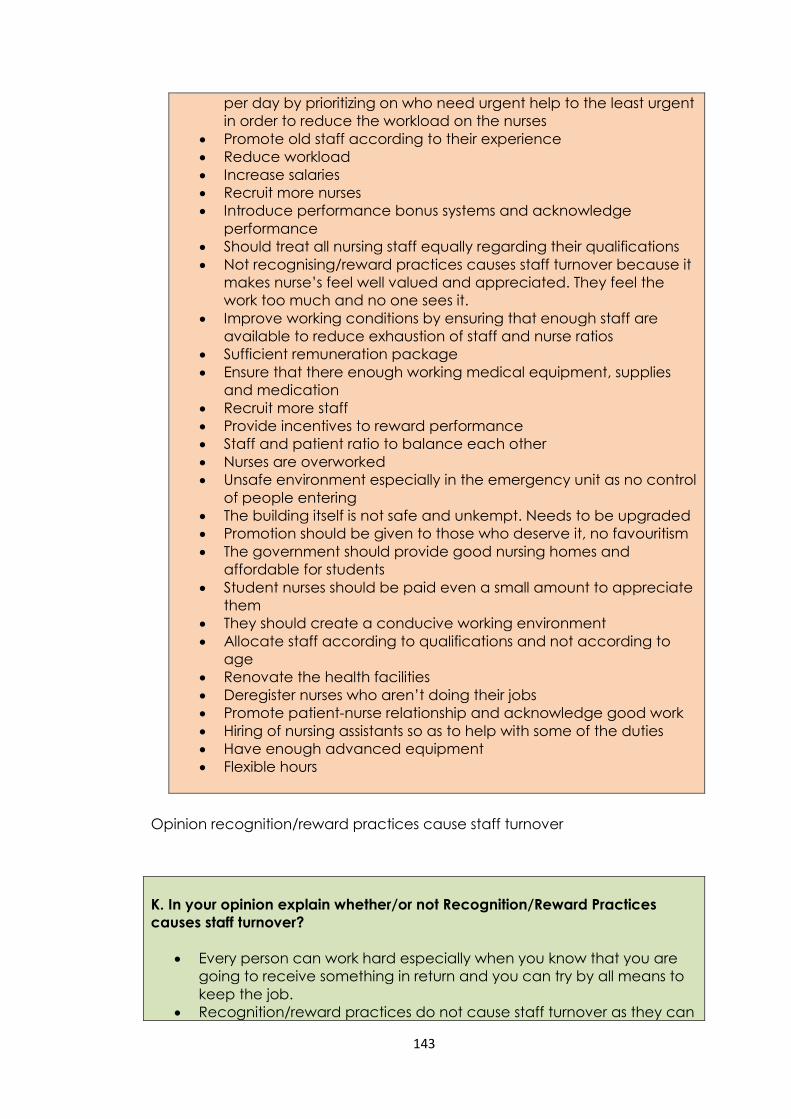
143
per day by prioritizing on who need urgent help to the least urgent
in order to reduce the workload on the nurses
Promote old staff according to their experience
Reduce workload
Increase salaries
Recruit more nurses
Introduce performance bonus systems and acknowledge
performance
Should treat all nursing staff equally regarding their qualifications
Not recognising/reward practices causes staff turnover because it
makes nurse’s feel well valued and appreciated. They feel the
work too much and no one sees it.
Improve working conditions by ensuring that enough staff are
available to reduce exhaustion of staff and nurse ratios
Sufficient remuneration package
Ensure that there enough working medical equipment, supplies
and medication
Recruit more staff
Provide incentives to reward performance
Staff and patient ratio to balance each other
Nurses are overworked
Unsafe environment especially in the emergency unit as no control
of people entering
The building itself is not safe and unkempt. Needs to be upgraded
Promotion should be given to those who deserve it, no favouritism
The government should provide good nursing homes and
affordable for students
Student nurses should be paid even a small amount to appreciate
them
They should create a conducive working environment
Allocate staff according to qualifications and not according to
age
Renovate the health facilities
Deregister nurses who aren’t doing their jobs
Promote patient-nurse relationship and acknowledge good work
Hiring of nursing assistants so as to help with some of the duties
Have enough advanced equipment
Flexible hours
Opinion recognition/reward practices cause staff turnover
K. In your opinion explain whether/or not Recognition/Reward Practices
causes staff turnover?
Every person can work hard especially when you know that you are
going to receive something in return and you can try by all means to
keep the job.
Recognition/reward practices do not cause staff turnover as they can
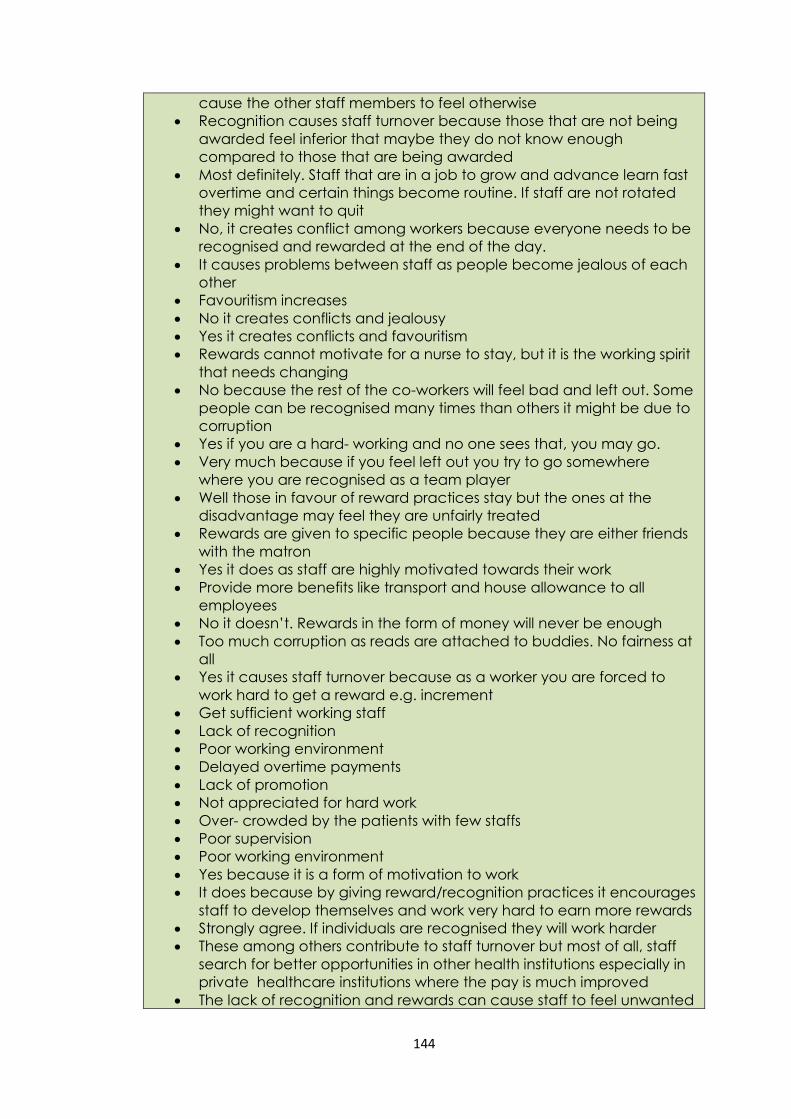
144
cause the other staff members to feel otherwise
Recognition causes staff turnover because those that are not being
awarded feel inferior that maybe they do not know enough
compared to those that are being awarded
Most definitely. Staff that are in a job to grow and advance learn fast
overtime and certain things become routine. If staff are not rotated
they might want to quit
No, it creates conflict among workers because everyone needs to be
recognised and rewarded at the end of the day.
It causes problems between staff as people become jealous of each
other
Favouritism increases
No it creates conflicts and jealousy
Yes it creates conflicts and favouritism
Rewards cannot motivate for a nurse to stay, but it is the working spirit
that needs changing
No because the rest of the co-workers will feel bad and left out. Some
people can be recognised many times than others it might be due to
corruption
Yes if you are a hard- working and no one sees that, you may go.
Very much because if you feel left out you try to go somewhere
where you are recognised as a team player
Well those in favour of reward practices stay but the ones at the
disadvantage may feel they are unfairly treated
Rewards are given to specific people because they are either friends
with the matron
Yes it does as staff are highly motivated towards their work
Provide more benefits like transport and house allowance to all
employees
No it doesn’t. Rewards in the form of money will never be enough
Too much corruption as reads are attached to buddies. No fairness at
all
Yes it causes staff turnover because as a worker you are forced to
work hard to get a reward e.g. increment
Get sufficient working staff
Lack of recognition
Poor working environment
Delayed overtime payments
Lack of promotion
Not appreciated for hard work
Over- crowded by the patients with few staffs
Poor supervision
Poor working environment
Yes because it is a form of motivation to work
It does because by giving reward/recognition practices it encourages
staff to develop themselves and work very hard to earn more rewards
Strongly agree. If individuals are recognised they will work harder
These among others contribute to staff turnover but most of all, staff
search for better opportunities in other health institutions especially in
private healthcare institutions where the pay is much improved
The lack of recognition and rewards can cause staff to feel unwanted
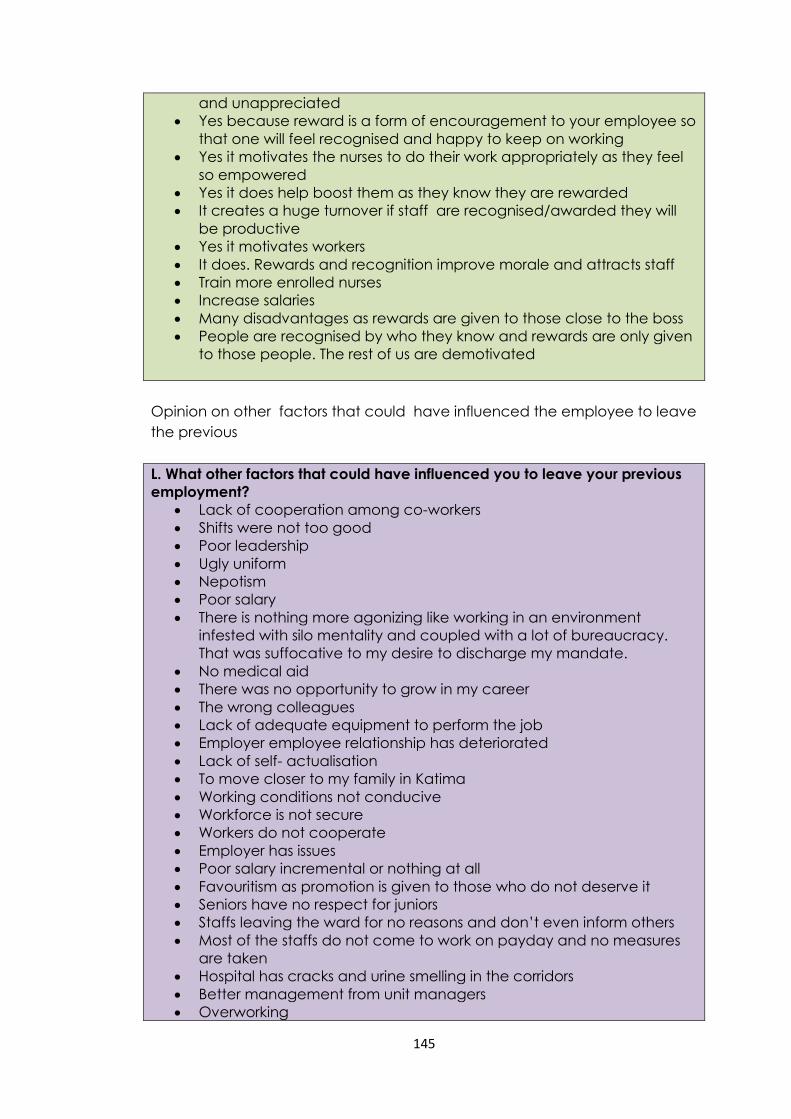
145
and unappreciated
Yes because reward is a form of encouragement to your employee so
that one will feel recognised and happy to keep on working
Yes it motivates the nurses to do their work appropriately as they feel
so empowered
Yes it does help boost them as they know they are rewarded
It creates a huge turnover if staff are recognised/awarded they will
be productive
Yes it motivates workers
It does. Rewards and recognition improve morale and attracts staff
Train more enrolled nurses
Increase salaries
Many disadvantages as rewards are given to those close to the boss
People are recognised by who they know and rewards are only given
to those people. The rest of us are demotivated
Opinion on other factors that could have influenced the employee to leave
the previous
L. What other factors that could have influenced you to leave your previous
employment?
Lack of cooperation among co-workers
Shifts were not too good
Poor leadership
Ugly uniform
Nepotism
Poor salary
There is nothing more agonizing like working in an environment
infested with silo mentality and coupled with a lot of bureaucracy.
That was suffocative to my desire to discharge my mandate.
No medical aid
There was no opportunity to grow in my career
The wrong colleagues
Lack of adequate equipment to perform the job
Employer employee relationship has deteriorated
Lack of self- actualisation
To move closer to my family in Katima
Working conditions not conducive
Workforce is not secure
Workers do not cooperate
Employer has issues
Poor salary incremental or nothing at all
Favouritism as promotion is given to those who do not deserve it
Seniors have no respect for juniors
Staffs leaving the ward for no reasons and don’t even inform others
Most of the staffs do not come to work on payday and no measures
are taken
Hospital has cracks and urine smelling in the corridors
Better management from unit managers
Overworking

146
Not receiving my overtime money on time
Salary increase
There was limited opportunities to specialise
No compatible relationship between employer and employee
Burnout and overworked
Salary not enough to cater for needs
Unpaid overtime working hours and tight work load schedule
Insubordination, some employees that worked in the hospital for a
long time do not co-operate
Private Doctors that admit patients that do not to be admitted.
Reward and recognition can make staff to stay and work hard to
impress the boss
Salary not adequate to cater for my personal living
Very low salaries and the car allowances that nurses do not have
Salary was too low and I couldn’t afford paying for rent and meet
basic needs. I couldn’t save to buy my dream car
Lack of respect/no recognition/lack of team work/unwillingness by
co-workers to accommodate each other
Long working hours
Long shifts
Too long distance to the workplace
Lack of motivation
Poor hygiene at workplace
Depleted infrastructure
Supplies which were always out of stock
Poor salary
No promotion and the level of payment was a bit low
Delayed overtime payment
Lack of promotion
Overload of work
Working overtime with no payment
Workload
I would be closer to my family in Windhoek
No time for studies
Lack of promotion
Poor management with management
Poor working conditions
Lack of communication among colleagues
Work related stress
Night shifts
Poor cooperation from senior nurses
Poor working conditions
Poor salaries
Too long distance to work place
Workload
Lack of equipment
Lack of opportunities
Could not be granted leave to pursue fulltime studies
The state hospital refused to give me study leave
Lack of mutual respect between employee and employer
Poor salary and unfavourable health practice
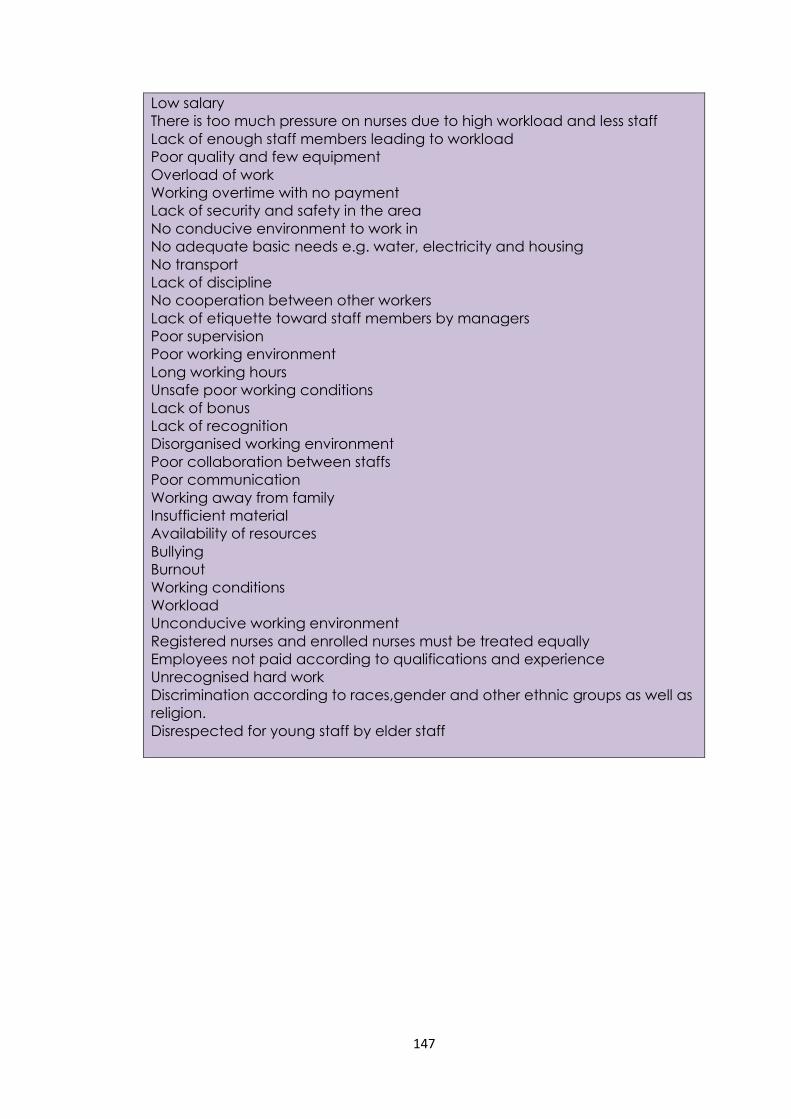
147
Low salary
There is too much pressure on nurses due to high workload and less staff
Lack of enough staff members leading to workload
Poor quality and few equipment
Overload of work
Working overtime with no payment
Lack of security and safety in the area
No conducive environment to work in
No adequate basic needs e.g. water, electricity and housing
No transport
Lack of discipline
No cooperation between other workers
Lack of etiquette toward staff members by managers
Poor supervision
Poor working environment
Long working hours
Unsafe poor working conditions
Lack of bonus
Lack of recognition
Disorganised working environment
Poor collaboration between staffs
Poor communication
Working away from family
Insufficient material
Availability of resources
Bullying
Burnout
Working conditions
Workload
Unconducive working environment
Registered nurses and enrolled nurses must be treated equally
Employees not paid according to qualifications and experience
Unrecognised hard work
Discrimination according to races,gender and other ethnic groups as well as
religion.
Disrespected for young staff by elder staff
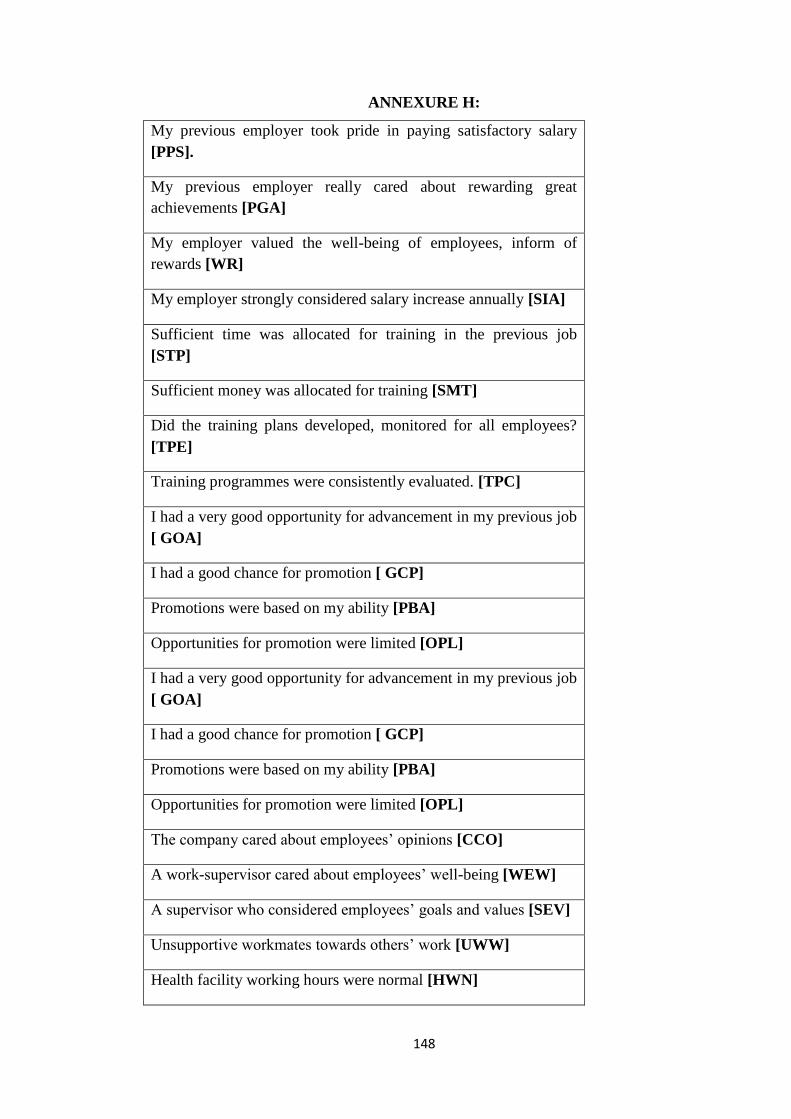
148
ANNEXURE H:
My previous employer took pride in paying satisfactory salary
[PPS].
My previous employer really cared about rewarding great
achievements [PGA]
My employer valued the well-being of employees, inform of
rewards [WR]
My employer strongly considered salary increase annually [SIA]
Sufficient time was allocated for training in the previous job
[STP]
Sufficient money was allocated for training [SMT]
Did the training plans developed, monitored for all employees?
[TPE]
Training programmes were consistently evaluated. [TPC]
I had a very good opportunity for advancement in my previous job
[ GOA]
I had a good chance for promotion [ GCP]
Promotions were based on my ability [PBA]
Opportunities for promotion were limited [OPL]
I had a very good opportunity for advancement in my previous job
[ GOA]
I had a good chance for promotion [ GCP]
Promotions were based on my ability [PBA]
Opportunities for promotion were limited [OPL]
The company cared about employees’ opinions [CCO]
A work-supervisor cared about employees’ well-being [WEW]
A supervisor who considered employees’ goals and values [SEV]
Unsupportive workmates towards others’ work [UWW]
Health facility working hours were normal [HWN]
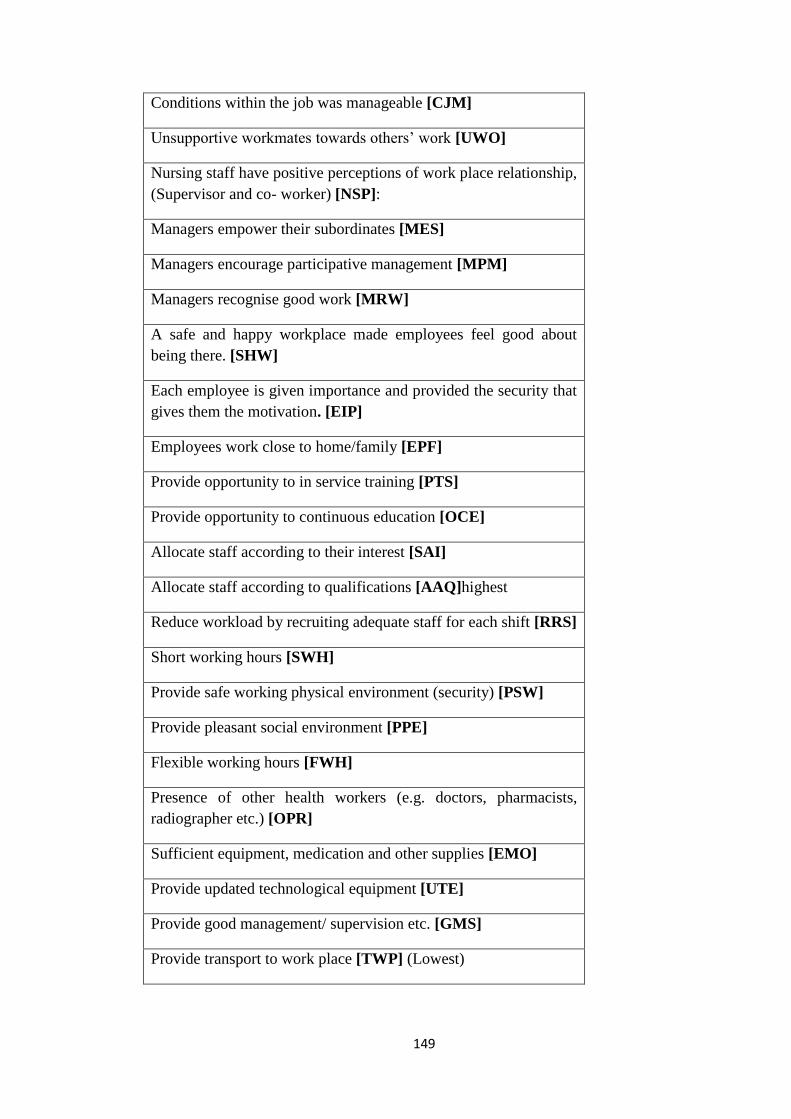
149
Conditions within the job was manageable [CJM]
Unsupportive workmates towards others’ work [UWO]
Nursing staff have positive perceptions of work place relationship,
(Supervisor and co- worker) [NSP]:
Managers empower their subordinates [MES]
Managers encourage participative management [MPM]
Managers recognise good work [MRW]
A safe and happy workplace made employees feel good about
being there. [SHW]
Each employee is given importance and provided the security that
gives them the motivation. [EIP]
Employees work close to home/family [EPF]
Provide opportunity to in service training [PTS]
Provide opportunity to continuous education [OCE]
Allocate staff according to their interest [SAI]
Allocate staff according to qualifications [AAQ]highest
Reduce workload by recruiting adequate staff for each shift [RRS]
Short working hours [SWH]
Provide safe working physical environment (security) [PSW]
Provide pleasant social environment [PPE]
Flexible working hours [FWH]
Presence of other health workers (e.g. doctors, pharmacists,
radiographer etc.) [OPR]
Sufficient equipment, medication and other supplies [EMO]
Provide updated technological equipment [UTE]
Provide good management/ supervision etc. [GMS]
Provide transport to work place [TWP] (Lowest)

150
ANNEXURE I: EDITOR’S LETTER