Embed Size (px)
Citation preview
Department of Economic History
Master Programme in Economic Demography
Factors behind internal migration and migrant
aspects
EKHR01
Master’s thesis
Spring 2010
Supervisor: Associate Professor Kirk Scott
Department of Economic History
Master Programme in Economic Demography
nternal migration and migrant’s livelihood
aspects: Dhaka City, Bangladesh.
By
Mohammad Mastak Al Amin
Email: [email protected]
Supervisor: Associate Professor Kirk Scott
’s livelihood
MOHAMMAD MASTAK AL AMIN Page 2
Abstract
The main objective of this paper was to examine the factors which determine the internal
migration to Dhaka city, Bangladesh and to find out their impact on migrant’s livelihood
aspect. The sample comprised 448 individuals from the rural and urban areas towards Dhaka
city. In this study I enhanced to analyze and interpret the determinants of socio-economic,
economic and environmental factors associated with the internal migration in Bangladesh.
The study showed the factors that affected the internal migration were mainly occupational,
educational and climatic. These factors were analyzed and discussed through the migration
theories- neo classical theory, new economics of migration theory and network theory. The
ordinary least square technique was applied on three regression models which indicated that
there were differences due to internal migration regarding to these economic, demographic
and environmental factors in Bangladesh.
Key words: Occupational, educational, environmental, migrants, Bangladesh.
MOHAMMAD MASTAK AL AMIN Page 3
C O N T E N T S
Page
Acknowledgements 4
1. Introduction 5
1.1 Research problem 6
1.2 Aim and scope 7
1.3 Outline of the thesis 9
2. Background 10
2.1 Previous research 11
2.2 Theoretical foundation 15
2.2.1 Neo classical theory 18
2.2.2 New economic theory of migration 18
2.2.3 Network theory 19
2.3 Hypothesis 19
3. Data 20
3.1 Source material 20
3.2 Sample 21
4. Methodology
4.1 Limitations and statistical model 23
4.1.1 Limitations of the study 23
4.1.2 Statistical model 24
4.2 Definition of variables 25
4.2.1 Dependent variables 26
4.2.2 Independent variables 26
5. Empirical analysis 28
5.1 Statistical results 34
5.2 Discussion 41
6. Conclusion 46
References 47
Appendix 51
MOHAMMAD MASTAK AL AMIN Page 4
Acknowledgements
The author wishes to convey his heartiest gratitude and sincere thanks to his supervisor Kirk
Scott for the stimulant and helpful comments and Aminul & Matti for proof reading, also
Maksudul Hannan for his data set.
MOHAMMAD MASTAK AL AMIN
MOHAMMAD MASTAK AL AMIN Page 5
1. Introduction:
In spite of being Migration is a favorite topic of research in the developing countries, studying
of internal migration and integration aspects in Bangladesh has never been a subject of
rigorous and sustained study. My paper enhanced to analyze and interpret the determinants
like socio-economic, economic and environmental factors of internal migration in
Bangladesh.
Migration is defined as changing the place of residence by crossing a specified administrative
or political boundary permanently. Lee (1966) has given a precise definition of migration. He
considered all movements: permanent or semi-permanent changes of residence whether
forced or voluntary, as migration. Migration is mainly classified into two types: internal and
international migration. Internal migration is defined as, the change of the place of residence
from one administrative border line to another within the same country, while international
migration is a movement in excess of a national border line.
Over the time, it has been hectic with the statistics and pictures of poverty in Bangladesh,
people have come to allow it as an adverse but irreversible state of affairs. However, today’s
world is more affluent than it ever been. The situations have changed in the recent years. The
world is now technologically more advanced in the recent years providing new opportunities
to economic progress and trim down hunger. Although many countries of the world tried to
off target in meeting the ambitious Millennium Development Goals (MDGs) that will try to
cut hunger poverty and other social problems by 2015, rapid and momentous improvement is
apparently possible. In the UN Millennium Summit in September 2000, the actions and target
which enclosed were approved by 189 nations, Bangladesh has made remarkable
improvement in human development i.e. accomplishment of gender uniformity in primary and
secondary school enrolment (UNDP, 2008). Poverty reduction is another goal of MDGs
where Bangladesh is moving forward.
Migration and poverty reduction has an unresolved relationship whether migration is one of
the major factors of poverty reduction. In one way migration is a cause and consequence of
poverty and on the other way poverty can be condensed or induced by population movement.
Considering the underlying relation between migration and poverty, Skeldon (2002: 67)
depicted the relative impact of migration on poverty and poverty on migration differs
according to the stage of progress of the area that we consider.
In this study, my focus was on internal migration in Bangladesh, mainly from rural and urban
areas toward Dhaka city and I tried to find out the reasons behind this scene and effects on
their livelihood aspects.
MOHAMMAD MASTAK AL AMIN Page 6
1.1 Research problem:
The study of migration is an important issue in different fields which comes out not only from
the people’s movement from place to place but also considers its influence on livelihood
aspects of individuals as well as urban growth. In a wide sense, it is the rearrangement of
dwelling of various period and natures. Migration from rural area to urban area is one of the
major causes of fast and unintended expansion of cities and towns.
For developing countries the internal migration rate was always higher in case of rural-urban
migration, a distinctive selectivity with respect to age, sex, caste, marital status, education,
occupation etc. crop up and the inclination of migration diverge significantly among these
socio-economic groups (Lee, 1966; Sekhar, 1993). The differentials of migration have
significant role in making out the nature and strength of the socio-economic and demographic
impacts of the population concerned. There were many researchers who tried to establish
some uniformly applicable migration patterns for all countries. However, only migration by
age has been found to be more or less alike for developed as well as developing countries.
Most of the study found that adult males were more inclined to migrate than other people of
the community. Several studies depicted that determinants of migration differ from country to
country, even within a country and the values were depending on the socio-economic,
demographic and cultural factors. High unemployment rate, low income, high population
growth, unequal distribution of land, demand for higher schooling, prior migration patterns,
and dissatisfaction with housing, natural disasters have been identified some of the well-
known determinants of migration (Nabi, 1992; Sekhar, 1993).
The developing country in Asia, Africa, Latin America and the Pacific, migration is a silent
feature of life which allied with the countries economic growth (Gurmu et al., 2000). In Asia,
the living conditions at household level provide support to comprehend the broader crisis of
poverty that is the consequences of migration. In case of Bangladesh, this helps to identify the
most exposed groups who hold the poor living conditions. .
My study point up the link between migration and household living conditions which is
understable and explicable that replicates the miscellany of definitions as well as
understanding of migrants and migration, in addition to poverty. Although it is not always
true that only the poor people are involving with migration. In Bangladesh, the internal
migration from rural to urban areas also emulates for the progression of industrialization i.e.
garments factory which imply demand in labor market (Mazumder, 1987; Oberai, 1987).
In my study, I tried to estimate the patterns of inter-regional migration and the determinants
associated with migration by regression analysis. The research questions for my thesis are:
What are the reasons behind the internal migration in Bangladesh?
How it effects on livelihood aspects in Bangladesh?
There are miscellaneous reasons why people migrated by forced or voluntarily that occur
internally and internationally in Bangladesh. The severe poor people are more likely to
migrate internally. I am expecting the factors that affects on internal migration in Dhaka city
may be wages in labor market, education, political turmoil, low living standards, demand for
specific skills set & knowledge and also the environmental factors - river erosion, land slide,
soil erosion, infertility of land, salinity, flood and drought of Bangladesh whose bound people
to move from their place of origin to new places.
MOHAMMAD MASTAK AL AMIN Page 7
1.2 Aim and scope:
Bangladesh is one of the least developed countries in these growing worlds which have
enormous rural population and agricultural work force. Nowadays people move from place to
place with a growing rate. This movement brings people into the different groups. This is a
challenge for the individuals who migrated from their home places to host places to adapt
with the new cultural environment. Immigrants are fretful about the expected of the host
places and desirable changes. There is always an opposite side of the coin that they are also
concerned about their own circumstances and preferences (Islam, 2008)
Migration has very close relation with identity construction. Relations are changing towards
groups and individuals that influence the migrant’s identification with the entities like nation-
state and ethnic group. The constructions of identity take place according to individual’s self
definition and membership of a group and the relation with others. The vital constituents are
dissimilarity in relation with other ethnic groups and nation-states. (Hedberg & Kepsu, 2008)
The factors whose affects the internal migration are individual education, age and also ethnic
origin. These are important due to differences between human capital types in the matter of
transferability and discrimination (Rooth and Ekberg, 2006). Rural to urban migration is one
of the foremost contributors to fast and unintended growth of towns and cities. Bangladesh is
one of the least developing countries, has a large rural population and agricultural labor force.
The United Nations Population Division predicts that the urban population of Bangladesh will
increase 93 percent between 2000 and 2020, compare with expansion in the rural population
which is only around 22 percent (Bangladesh Urban Health Survey, 2006). This rapid
urbanization, marked particularly by the recent extremely abrupt growth of large cities in
Bangladesh such as Dhaka and Chittagong, is obsessed primarily by rural to urban migration
(Afsar, 2003). Dhaka is the capital city of Bangladesh plays the most dominant role in the
urbanization process contains one-third of the urban population of Bangladesh (ESCAP,
1993:25). For the remarkable enlargement in the urban population in Bangladesh, rural to
urban migration has the most viable justification. The most notable feature of this
urbanization is the mushrooming escalation of slums and squatters with the increased rural
migrants in search of employment and income (Afsar, 2000).
Migration is a driver of growth and also is an imperative path away from poverty with
considerable affirmative impacts on people’s livelihoods and welfare in Asia (Anh, 2003).
Afsar (2003) disputed that the remittances have expanded the area under cultivation and rural
labor markets that shrink poverty directly or indirectly by making land availability for
tenancy in Bangladesh. Ping (2005) illustrated that the huge contribution of migrant labor
was a significant factor for the overall development in China.
I tried to examine:
• The patterns and trends of internal migration in Bangladesh.
• The background factors which were considered as push-pull factors for migrants and
their present living Status.
• The major problems faced by migrants.
• The Consequences after migration which were based on their present living conditions
and socio-economic conditions.
• Some policy issues and instruments about the future policy for the policy makers and
researchers.
MOHAMMAD MASTAK AL AMIN Page 8
My aim was to answer my research topic by considering the following questions. The
questions were based on before and after migration -
� Difference between individual’s incomes.
� Difference between individual’s occupational positions.
� Difference between individual’s years of schooling and educational
facilities.
� Difference between wealth of family.
� Political situations.
� Amount of loss due to environmental disasters.
This paper tried to focus on different determinants of internal migration on the basis of
secondary information. The differentials of migration had important function in classifying
the nature and potency of the socio-economic and demographic impacts due to the
population concerned. There were many researchers who tried to find some evenly
applicable migration patterns for different countries, though only migration according to age
was found and its effect was only on urban planning.From the view of individual level the
differentials that person involved in the migration process were adult and more educated. The
push factors that influenced the internal migration may be poverty, occupation, education and
family influence.
This topic was academically motivated because, internal migration was an important
issue in developing countries where the people who lived in rural areas or small cities
moved in a big city or the capital city to attain better life for their survival. Bangladesh
which is a prosperous developing country had vast experienced with this internal
migration from the rural or small cities to its capital city Dhaka recently. The matter
that internal migration due to various reasons especially natural disasters partly
ignored in the academic and public debate on increased polarization on internal
migration in Bangladesh. I was interested to consider the country Bangladesh for my
study because although the population register system was not good in Bangladesh, but
the increasing number of migrants has been substantial and mostly in one direction to
Dhaka from different places of the country, that makes Bangladesh an useful case for
research on internal migration.
MOHAMMAD MASTAK AL AMIN Page 9
1.3 Outline of the Thesis:
In this paper, the main purpose is to identify the factors behind the internal migration and
indicates the effect on livelihood aspects of migrated people from different rural and urban
areas to Dhaka city. In the second chapter, the background information will be discussed to
understand the perspective in which the internal migration in Dhaka city took place. The
previous research and relevant migration theories will be carried out and discussed as a part of
chapter two to analyze factors behind migration and their impacts on livelihood. In the
background chapter, factors effective for internal migration in Dhaka will be discussed to
understand well again what we are coping with. In order to systematize the foundation of this
paper; previous researches about internal migration and theoretical background will be point
out in this chapter. The hypothesis section is discussing, before the data collection procedure
and the data sources applied in chapter three.
The third chapter specifies the information about data and encountered problems in the data
set will be pointed out. Furthermore, in the first part I will try to discuss the data source, data
collection procedure and the difficulties in the data set. And in the second part, sample size
and preparation of data will be explained.
The next chapter indicates the explanation of the method part that will be used to answer my
research question. Type of the study and the research method’s analyzing procedure will be
shown here in the method part. More specifically the method part will depict the design of the
dataset, type of regression estimators, definition of dependent and independent variables. In
addition, the regression model that I need to use of the purpose of my paper also discuss in
this chapter.
The fifth chapter will give explanation about the empirical model, which includes the
statistical results, one way tabulations and cross tabulations of the independent variables and
the discussion parts. In the statistical analysis part, the regression model outcomes will be
showed in the tables and the required information’s like: coefficient of variables, p-values, R-
squared values etc. about statistical analysis will be carried out in order to draw more reliable
conclusions. The next part will discuss the results from regression analysis and also the
interpretation of the coefficients. The estimated values and the outcomes from regression
analysis compare with the theories and early research will be examined to avoid extraneous
results. The last part of this chapter will be carried out the interpretation of all statistical
results to answer the research question.
Finally, the summary of the results and conclusions will be pointed out. Additionally, brief
comparisons of these statistical analysis and results for Dhaka city with others country will
help us to sketch final conclusions and generate possible solutions for future researches.
MOHAMMAD MASTAK AL AMIN Page 10
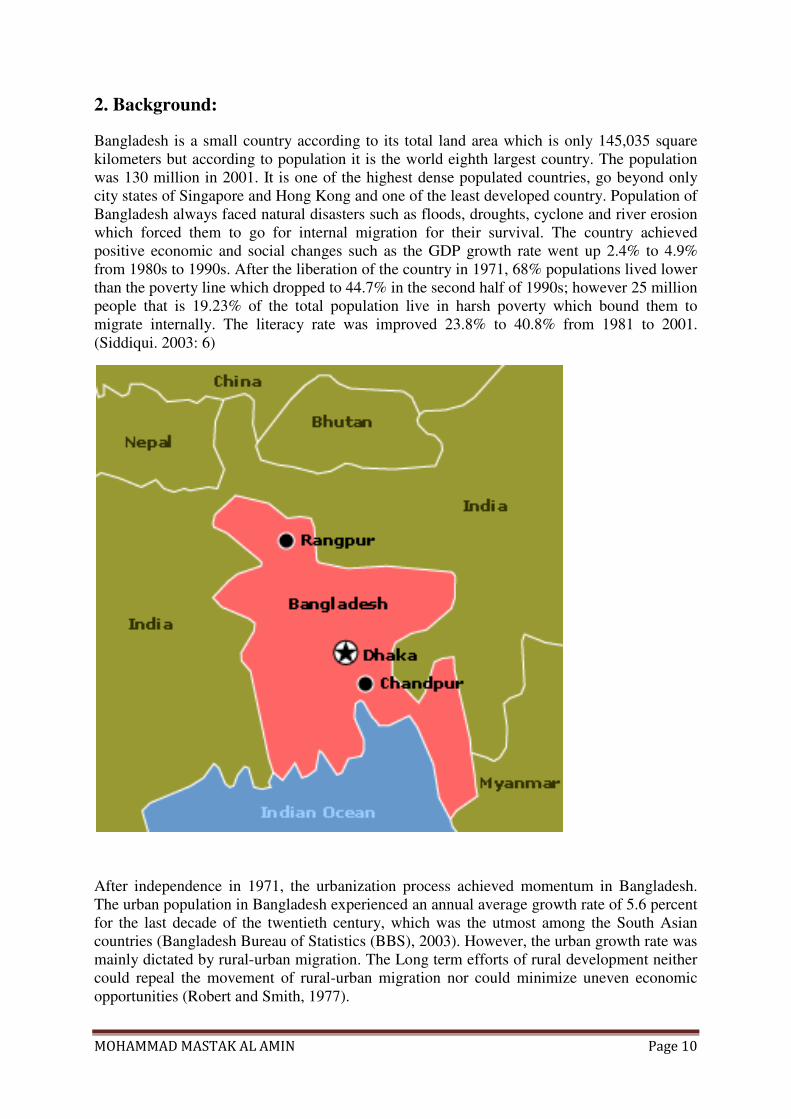
2. Background:
Bangladesh is a small country according to its total land area which is only 145,035 square
kilometers but according to population it is the world eighth largest country. The population
was 130 million in 2001. It is one of the highest dense populated countries, go beyond only
city states of Singapore and Hong Kong and one of the least developed country. Population of
Bangladesh always faced natural disasters such as floods, droughts, cyclone and river erosion
which forced them to go for internal migration for their survival. The country achieved
positive economic and social changes such as the GDP growth rate went up 2.4% to 4.9%
from 1980s to 1990s. After the liberation of the country in 1971, 68% populations lived lower
than the poverty line which dropped to 44.7% in the second half of 1990s; however 25 million
people that is 19.23% of the total population live in harsh poverty which bound them to
migrate internally. The literacy rate was improved 23.8% to 40.8% from 1981 to 2001.
(Siddiqui. 2003: 6)
After independence in 1971, the urbanization process achieved momentum in Bangladesh.
The urban population in Bangladesh experienced an annual average growth rate of 5.6 percent
for the last decade of the twentieth century, which was the utmost among the South Asian
countries (Bangladesh Bureau of Statistics (BBS), 2003). However, the urban growth rate was
mainly dictated by rural-urban migration. The Long term efforts of rural development neither
could repeal the movement of rural-urban migration nor could minimize uneven economic
opportunities (Robert and Smith, 1977).
MOHAMMAD MASTAK AL AMIN Page 11
2.1 Previous Research:
Many developing countries had experienced a rising concentration of people in urban areas,
mainly their largest cities for the last few decades. This rural- urban or urban-urban migration
had influenced the poverty and the household living conditions as well as health status and
life styles of migrants. Here I tried to discuss from the previous literatures about the
background information on internal migration and its socio-economic consequences.
The direct and indirect factors were available with gaze at the impact of internal migration on
poverty mitigation. For example the head count index, in addition to the unemployment rates
and the increase of income in case of poor urban households illustrated a definite inclination
of poverty decline and enhanced economic conditions. About 6.7 per cent annual growth rate
was contrasting to 3.4 per cent per capita enlargement for rural incomes. The situations of the
garment factory workers also provided the evidence between the link of migration and
poverty (Afsar, 2003). Among the people who didn’t have any income before migration, 80
per cent of them were earning adequate money to set them above the poverty threshold.
Indirectly, some of the current progresses in rural areas tend to shore up the function of
migration in poverty mitigation of those areas. Rahman et al. (1996) in their study showed
that the head-count index of poverty was doubled compared with the non-migrant households.
One of the major reasons for out-migration is the lack of year-round employment in rural
areas in Bangladesh. It was found from Afsar and Baker (1999) literature that the adult
members in Faridpur and Rajbari in Bangladesh, about two fifths of the households faced lack
of year-round employment. It was also argued that these migrants had desired to develop their
situation in addition to entrance into information and supportive networks facilitated them to
seize the risk of migration. Skeldon (2002) viewed migration as ‘creator and product of
poverty’.
In the context of migration, land is an important factor in Bangladesh. Landless family took
their decision for migration more often comparing those with land. The family those have
land be able to manage the damaged by natural disasters like periodic rain, flooding, drought,
river erosion, land slide, soil erosion, but the landless households could not handle the
resultant effects (Kuhn, 2000). Hossain (2001) found in his study that those who belonged
larger land properties more than 50 decimals in Bangladesh were migrated more often than
those who had smaller land properties (6 to 50 decimals). The land ownership and migration
were not always clear-cut. This was because, the people with greater resources were normally
not more involved in firm activities, were likely to involve in the labor market. However they
tried to broaden their earnings and hazards over a number of geographical settings. On the
other hand the landless people shifted their livelihood on permanent type of migration
whether they didn’t have more choices. Long, H. et al. (2008) analyzed in their study about
the change of land used of urban-rural areas in Chongqing and its policy dimensional from
1995 to 2006, by using the data from both research institutes and government departments.
They showed in their study that there was a significant changed in land used over the period
from 1995 to 2006 in Chongqing. They characterized the land-use change in Chongqing into
two major trends, the first one was non-agricultural land which increased considerably from
1995 to 2006 and second one was the aggregation index of urban and rural settlements which
illustrated that the local urban-rural development experienced a progression of changing from
aggregation (1995-2000) to decentralization (2000-2006).
MOHAMMAD MASTAK AL AMIN Page 12
Migration has always the latent to make better income and shrink poverty; it is largely depend
on the nature of migration, the kind of physical, human and social capital of migrants, over
and above the economic prospects both at the place of origin and the place of destination.
There were various studies which suggested an off-putting link between internal migration
and poverty. Finan (2004) found in his study that the momentary migration was a regular
livelihood strategy for the poor people in the southeast Bangladesh but its ability was limited
to be out of them from the poverty. Blackburn (2010) in his study showed that, income was an
important factor to change geographical location or to take decision about internal migration.
He also demonstrated that the couple took the decision for migration although the gain was
not occurring for both the spouses in US. Moreover the wives losing 20% of their earnings
before migration on average as well as also descend their work hours. Glaseser et al. (2001) in
Blackburn (2010) suggested that the local consumption attributed and lower transportation
costs were also important factors to take decisions about the location.
Prior to the establishment of garment sectors, the poorer women enforced by the poverty and
be deficient of social security were migrated to Dhaka city to improve their livelihood,
worked as construction labor or domestic worker. When the garment sectors were expanded
in Dhaka city, the young women migrated more due to the opportunity to entry into labor
market. However, the demand was always higher for domestic workers in urban household;
the stream of female domestic workers was study from rural to urban areas. The lack of
institutional support and increment of the nuclear family in a large number, for childcare the
upper and middle class women in urban areas seeked domestic help in order to contribute in
the labor market. The previous literatures suggested that the male member of the family in
Bangladesh was always a prevailing variable to find out the scenery and types of migration.
Afsar (2002) and Kuhn (2000) showed in their study that how one adult male member in
Bangladesh assisted for internal or international migration. Rogaly and Rafique (2003: 679)
also established that in single-earner household when husband migrated, the difficulties
allowed by women. They specified “when men migrate, women in single-earner households
must adjust their own behavior as a part of their investment in the social relations through
which they access credit and other forms of support during their husband’s absences”.
Bangladesh is a revirine country where flood is a recurring themes. The population mobility
regained in these recent years towards Dhaka city in case of the vulnerable ecology. The most
ecologically vulnerable districts in Bangladesh: Lalmonirhat, Gaibandha, Kurigram and
Rangpur are often affected by floods because they are in the river erosion belts of the
Brahmaputra River. These districts are most dejected regions and situated in the northwestern
part of the country. Hossain, Khan and Seeley (2003) showed in their study that seasonal
migration was a significant livelihood strategy for the poor households who usually affected
by these natural disasters. Rogaly and Rafique (2003) found in their study that seasonal
migration was more common livelihood strategy in West Bengal among the poorest people
who were usually most affected by these natural disasters. There were generally four seasons
demands for supplementary workers in rice production peaks, therefore seasonal migration
centered round agricultural work. A large number of rickshaw pullers embarked on regular
journeys to villages during the harvest season from Dhaka city (Majumder et al., 1996). There
was also rural to rural seasonal migration whether the people of the villages with vulnerable
adverse ecology went better location whether there was more land to farm staple foods.
Therefore migration set off by ecological vulnerability, especially by floods (Afsar and Baker,
1999). From Kuhn (2000) study, Matlab Thana in Bangladesh suggested that the seasonal
migration took place to permanent migration when the social ties were weedy and the family
did not have labor force to contribute in seasonal migration and also insisted people those
have social networks in their migrated places. They helped them to get into the labor market
MOHAMMAD MASTAK AL AMIN Page 13
easily. Barbieri, F. A (2007) discussed some of the key determinants of a recent pattern of
development and environmental change in the Amazon which had radically changed people’s
livelihoods and welfare. The urbanization processes interced the progressively more complex
articulations between rural and urban areas. Various macro and micro level case study and the
theoretical assessment of contemporary “urbanization” changed in the whole Amazon leading
edge, which suggested that the conventional country dichotomy was to be set sideways if we
understand the dynamics of modern development and environmental changes in the Amazon
edge.
Hossain and Yadava (2001) demonstrated in their study that among ten villages of comilla
district of Bangladesh 7.39 percent of the total villagers were migrated from these villages.
Among them those who were of age 15 years to 30 years had the highest percentage which
was 68.5. However from the year 1993 to 1997, 3.81 percent of the villagers were migrated.
They also showed that 36.6 percent of the migrants were going abroad and 32.1 percent were
at Dhaka division in Bangladesh. Among the migrants, 70 percent were migrating for jobs or
better opportunity and only 9 percent were students. They also stated in their study that
individuals with higher education were more likely to migrate. They also found that the
tendency of rural out migration was 2.7 times higher for the household with more than one
adult male members compared to a single adult male member household and it was 19.3 times
higher for the households with more than three adult male members . Those who were
involved in non agricultural occupation had 11.2 times risk of migrating than a farmer with
landowner.
Rogaly and Rafique (2003) also stated that, “seasonal migration is for most of those involved,
a way of hanging on. For a small minority of migrants with land, supportive family structures,
other social assets and/or other sources of income, remittances may remain available for
investment in agriculture or to make an impression through conspicuous consumption”. He
also found that the household which had more than one male earner to make certain the
enhanced use of wages and enhanced economic security. Alternatively, Afsar (2002) noted in
his study that the matter of contractual labor migration female spouses were more sensible
than male.
The immigrants’ position in the labor market concerned their labor-market position in the
time of resides in the host place. Rooth and Ekberg (2006) focused on two main areas-
migrants’ the first one was occupational pattern and second one was about migrants’
occupational position, mobility and incomes compared with natives. They found that the
employment rate was approximately same until the end of 1970s and then there was a falling
trend compared with natives. In the late 1990s the employment rate still lower, although some
recovery started. The redundancy rate varied among various immigrant groups in Sweden and
being high for non-European migrants. They found migration occupational position fit in to a
poorer socio-economic level and the upward trend for working mobility was slower than
natives whether they hold the same educational stage. The labor migrants made their choice to
migrate was a part of economic occupational progression. In their study they tried to figure
out whether occupational mobility described a U-shaped relationship and the U-shaped
relationship was stronger for those migrants’ who hold high status in view of occupation in
their home place and occupational mobility was going up those who invested their human
capital to the host place for example education. (Rooth & Ekberg 2006)
Mberu (2006) showed in his study, there was a significant living conditions improvement of
permanent and temporary migrants over non migrants. A negative connection was present
with living conditions relative to non-migrants which were indicated by return migrants. The
MOHAMMAD MASTAK AL AMIN Page 14
author disputed that in Ethiopia, migration may be applicable for improved living conditions
if the migrants were educated and capable to access into non-agricultural livelihood sources.
The economic, psychological and social stability helped them to transform into better living
conditions which usually appeared to be lacking in the country of the period under
consideration.
Tremblay (2001) found in his study that the number of migrating people increased in order to
study purpose and the main destinations were the developed countries. A huge numbers of
students from Northern Africa found in those countries having historical, cultural and
linguistic connections to the Arab region. In France, the Maghreb students were over a quarter
of all international students whereas Moroccan students were 11.8 per cent, Algerian were
10.9 per cent and Tunisian were 3.4 per cent in 1998. On the other hand the Moroccan
students represented 6.8 per cent of the foreign student population in Spain. Akar (2010)
illustrated in his study that migration trend always higher either the areas of inner-city
neighborhoods or newer squatter settlements build on undeveloped land which was rural areas
but on the urban periphery in Turkey. This was because that these places provided very good
schools those who hold rich resources, urban facilities, very high quality of education and
high academic achievements of students. Akar(2010) also specified in his article “Research
shows that inter-provincial migration is driven by structural factors such as long-term regional
differences in employment rates and labor productivity (Kulu and Billari, 2004); security and
forced migration (Erman, 2001); differences in educational opportunities (Valverde and Vile,
2003; Wegren and Drury, 2001); and the urban/rural structure of provinces (Coulombe,
2006)”
In conclusion, we found that there were so many literatures available on internal migration,
even though very few have studied the all major factors as well as reason for natural disasters
behind this internal migration and its impact on their livelihood. I tried to investigate the main
factors behind this internal migration in Dhaka city and also their impacts on livelihoods.
Chaudhury & Curlin (1975) have investigated a range of demographic and social factors
in their study and found that demographic factors such as age, sex, family size and
occupation had enormous impact on migration. They also found that the uppermost
outmigration rate pertained to domestic servants, who were followed by mill and office
workers and unemployed persons. From their study it was also depicted that the farmers
who had small amount of land were less likely to move out from the village. Afsar (1999)
stated that the migrants from rural area to Dhaka city didn’t have good financial condition and
most of them settle in slum and squatter settlements, among them three out of every five
found work within one week after their arrival. They invested their time and energy to contact
with relatives, friends and neighbors in Dhaka city before their arrival and three-quarters of
them secured their first job by their social networks in Dhaka.
MOHAMMAD MASTAK AL AMIN Page 15
2.2 Theoretical Foundation:
Study of internal migration is a key importance in social sciences as well as economics and it
emerges not only the movement of people between one place to another place inside the
country but also influences on livelihoods and urban growth. Internal migration depends on
the socio-economic, demographic and cultural factors like high unemployment rate, low
income, and high population growth, unequal distribution of land, demand for higher
schooling, prior migration patterns and dissatisfaction with housing. The accelerating rate of
migration was high among the developing countries of Asia; the average annual growth rate
of urban population was 6.5 per cent in Bangladesh, 3.4 in India, 4.2 in Pakistan and Sri
Lanka from 1970 to 1990 (Hugo, 1992).This urban growth contributed three-fifths to two-
thirds by rural urban internal migration. Most of the previous studies considered the
determinants of internal migration in Bangladesh were age, sex, caste, marital status,
education, occupation. The aim of my study is to consider those determinants as well as the
natural disasters like floods, droughts, river erosion that make bound to migrate people to
urban areas. I tried to focus on the differentials and determinants of internal migration, they
were:
a) Selectivity of migrants b) Nature of migration c) Factors active for migration.
MOHAMMAD MASTAK AL AMIN Page 16
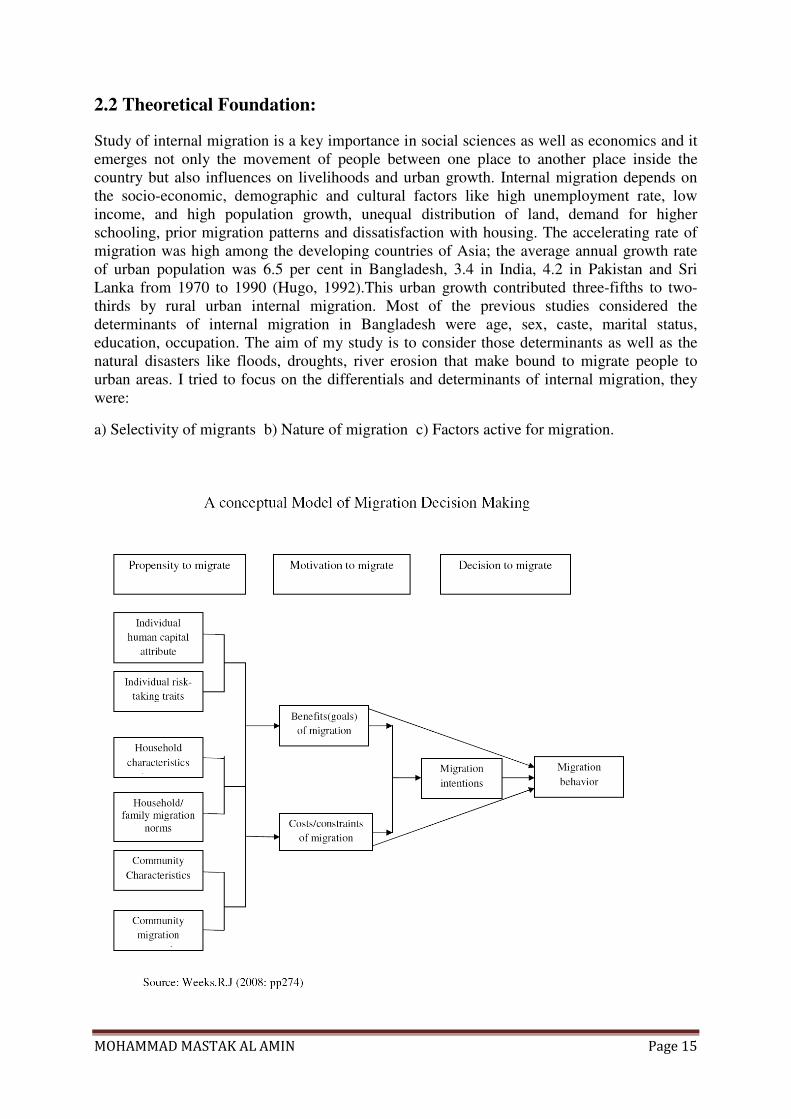
The model gives us an over view of the most important aspects of the migration that from the
conceptual model of De Jong and Fawcett (1981) and revised by De Jong (2000) in Weeks
(2008: p274). The process of migration thought of having three main stages, they were- the
propensity to migrate in general, the motivation to migrate to a specific location and the
decision taken to migrate. The migration process commences with the given culture and
society that represented by the community where the individuals or household members live.
The decision of migration may often be a household tactic for improving their quality of life.
Moreover the decision is made according to the sociocultural environment where they live,
not made in a vacuum. In case of selectivity of migrants, individual and household
characteristics are important factors. For example families without young adults are less likely
to reflect migration. Social and cultural norms are also key factors that can take part in a role
in discouraging migration accentuating the place or community or the political and economic
instability. (Weeks, 2008: p 275)
There are some people who are greater risk taker than others, so personal characteristics are
also important. The propensity to move may be cultural, Long (1991) in Weeks (2008: p275)
suggested that residential mobility for developed nations including United States, Canada,
Australia, New Zealand populated by migrants who displaced the indigenous population-
were the country with the maximum rates of mobility. The societal and cultural norms are
combined with demographic characteristics to shape the values that people hold about
migration. These benefits stand for clusters of motivation to move, desires for wealth, status,
better living or working conditions, entertainment, personal freedom and religious beliefs, as
well as risk taking ability merge with household and community to impinge on costs and
constraints that might remain an individual from migrating. The aim to move lead to take
steps of moving itself and the unexpected events may perhaps affect the migration decision.
(Weeks 2008: p 275-276)
The prospective migrants retorted to the urban employment probability and treating them as
an economic phenomenon, the Harris-Todaro model demonstrated certain parametric ranges,
raise in urban employment may result in advanced levels of urban unemployment and even
condensed national product. (Riadh, 1998)
There are many theoretical foundations on migration that are complement to each other and
also there is no unique theory which can explain all reasons about internal migration, only a
scraped theory have built up largely in separation from one another but not always according
to disciplinary limits (Massey et al., 1993: p432). The most theory is leveled as either push or
pull theories by economists. They explain the factors force an individual to leave a region or
country or attract them to a different region. In migration the push factors may be low wages,
political turmoil, low living standards and the pull factors may be the higher wages, high
living standards, decreasing political violence and demand for specific skills set and
knowledge (Castles et al., 1998: 20).
Among different theories for migration, push-pull theory is the most frequently heard
enlightenment which stating that some people are pushed out to move from their prior locality
while others have been pulled or magnetized to some other places else. This idea was first
launched by Ravenstein in 1889 who suggested that among push and pull factors, pull factors
were more important. Ravenstein in Weeks (2008) specified that “Bad or oppressive laws,
heavy taxation, an unattractive climate, uncongenial social surroundings, and even
compulsion (slave trade, transportation), all have produce and are still producing currents of
migration, but none of this currents can compare in volume with that which arises from the
desire inherent in most men to ‘better’ themselves in material respects.” (Weeks 2008: p272)
MOHAMMAD MASTAK AL AMIN Page 17
In this way Ravenstein specified that the people voluntarily migrated because of the aspiration
to get forward more than the desire to get away from the unpleasant situation. On the other
hand Davis (1963) in Weeks (2008) disputed that this is not the desire to run away from
poverty but the search of happiness or the panic of social slippage.
Stress or strain might be a big factor which pushes a person to migrate, however it was rare
case that people respond to voluntary migration only because of the stress factors, but also
they feel some reasonable attractive alternative which was the pull factor. The social science
model specified that the decision for migration was depending on computing a cost benefit
analysis which suggested that people moved only when the benefits exceed the costs. Lee
(1966) in Weeks (2008: p273) suggested that there might be some intervening obstacles
between wish to move and the concrete decision to do so.
There are also two other migration strategies step migration and chain migration whose help
to determine where migrants to go. By the process of Step migration people try to trim down
the risk of their decision about movement by kind of inching away from home. For example
first the rural people may possibly walk off for nearby city, from there to a bigger city and
perhaps ultimately to a huge metropolis. On the other hand chain migration also reduces risk
by relating migrants to a reputable flow from a familiar origin to a predetermined goal where
prior migrants have by now scoped out the circumstances and set the ground work for the new
arrivals which is very similar to network theory (Weeks, 2008: 281).
Massey and his associates (1994) in Weeks (2008) specified that there were various theories
whose explaining contemporary patterns of migration. Every theory was carried in some way
or other way around by the existing evidence and in particular none of them was specially
disproved. This serves to understand that migration is a very numerous and complex process,
no single theory can detain all of its nuances but all of them could add something to
understanding of migration.
The major theories that help to explain different aspects of migration, among them 1)
neoclassical economics 2) the new household economics of migration 3) dual labor market
theory and 4) world systems theory spotlight on the commencement of migration patterns. On
the other hand the theories 1) network theory 2) institutional theory 3) cumulative causation
help to enlighten the perpetuation of migration.
Here I tried to discuss the neo classical theory, the new economic theory of migration and the
network theory which are mostly applicable and useful for explaining the internal migration.
The migration system theory tries to explain immigration as an association between receiving
countries and their earlier colonies that’s why it is not applicable for my purpose (Castles et
al., 1998: 24).
Neo classical theory and the new economic theory of migration relate to making decisions
about voluntary migration of individuals or households. Here I tried to focus on the theories
that explain causes of migration and social & economic factors with their effects.
MOHAMMAD MASTAK AL AMIN Page 18
2.2.1 Neo classical theory:
The oldest migration theory is the neo classical theory that works on both the micro level and
macro level that went after by the new economics of migration. The main principles of this
theory are wages which aggravated individual for immigration and the various wage levels
that grounds economic balance between two geographical areas (Harris et al. 1970: 129,
Massey et al. 1993: 433). This theory states that geographical differences in wages bound to
move from low wages area to high wages area and this is due to demand & supply of labor in
specific areas. Regions with high labor force supply obvious have low wage levels compare
with the low labor force supply areas. The wage levels ultimately steady at balance when the
high wage regions acquired sufficient high labor supply. Therefore the migration will stop
when there are no wage differences between different regions. The migration depends on the
labor market situations (Harris et al. 1970: 138, Massey et al. 1993: 434). To summing up this
theory demonstrates the push and pull factors impact on labors movement from the areas with
huge supply of labor like developing country or agricultural areas to developed country or
industrial areas with a huge supply of capital. They also provide high wages compare with the
previous wages (Massey et al., 1993: 433).
This theory is also applied through microeconomic model. It is based on the basis that
individuals make their mind to migrate not only base on the wages but also tentative
speculation in human capital that can progress their economic productivity and on the whole
standard of living. They consider their destinations according to where they will get the
highest return. Individuals also consider the psychological price like prospects of finding
employment, probability of being expelled from host country and economic cost of
immigration (Borjas, 1989: 460). The theory concludes that assimilation, education and
experience also influence individuals to make their decision about migrations.
2.2.2 New Economic Theory of Migration:
The previous theory based on the maximization of individual wages those who looks for go
up on top of deficiencies in the labor market of place of origin. The new economic theory has
different view with neo classical theory that migration is a result of letdown in capital markets
which either don’t exists or inadequate. This theory states that people set up their decisions
for the best for their entire family or household to conquer credit barriers. In this situation the
decisions are made by household not by the individual. This is because that family wants to
branch out their risks not just on the basis of income but also according to geographical base
to reduce their financial and property losses. The members of the family work in different
fields that reduces the risk of the total security and wealth of the family because if one of
them would be laid off or unable to work due to sickness or die. This is the developing and
agricultural world insurance policy while they carve up the net optimistic returns from
migration (Bloom et al. 1985: 175, Massey et al. 1993: 436). Households try to improve their
income compare with other families. Wage differences are not essential for migration in this
purpose but it also be a certain extent frustration of not to having superior income to go with
the well of families that Bloom refer as relative deprivation (Bloom et al., 1985: 439).
This theory illustrates that immigrants try to widen the risk rather than just enlarge in income
and also not focus on the wage equilibrium. The main theme of this theory is that people
subsidized their journey to decrease the risk inherent in societies with weak institutions like
no unemployment insurance, no welfare, no bank from where people expect financial support
MOHAMMAD MASTAK AL AMIN Page 19
and well being for their household economy (Weeks, 2008: 282). This theory better explains
about the households and individual behavior than the neo classical theory.
2.2.3 Network Theory:
When migration has begun, it is going on its own way and moderately detach from the forces
that acquired it going in the prior place, this is the way of the chain migration. Massey et al.
(1993: 449) in Weeks (2008: 283) explain that by network theory migrants set up
interpersonal ties that “connect migrants, former migrants and non-migrants in origin and
destination areas through ties of kinship, friendship, and shared community origin. They
increase the likelihood of international movement because they lower the costs and risks of
movement and increase the expected net returns to migration” (Weeks 2008: 283). This
theory states about peoples social networks that is when individual know people from the
community who have migrated earlier i.e. they have relatives or associates to the specific area
then they are more likely to get interest to migrate there, because it decreases their
psychological and financial cost as well as increases social security (Castles et al., 1998: 26).
This network also helps them to get into the labor market easily and make them easy to
integrate in the host country society. This social network is very essential since it facilitate
migrants to construct a smoother shift into the new destination. This type of migration
ultimately may turn into a rite of passage into adulthood for the general public in developing
countries having diminutive to accomplish with economic supply and demand (Weeks, 2008:
283).
2.3 Hypothesis:
According to my research questions, I considered the following hypotheses and tried to
illustrate that wether they were significant or not by different statistical measures:
1. There were a significant difference between income in the place of origin and the
place of destination: Dhaka city.
2. Migrants from rural area increased their income in a greater extent to get relief from
poverty compared to the migrants from urban areas.
3. An increased in income was increased monthly savings to provide the respondents
more secured life.
4. There must be significant relationship between change of income and the reasons
behind moving towards Dhaka city.
5. The occupational reasons of coming Dhaka had significant relationship with the
change of income in terms of standard of living of respondents.
6. The educational reasons of coming Dhaka had significant relationship with the change
of income in terms of standard of living of respondents.
7. The climatic reasons of coming Dhaka were highly significant for internal migration
due to forced migration.
MOHAMMAD MASTAK AL AMIN Page 20
These hypothesises were demonstrated from the different economic theories. People migrated
from his/her place of origin to place of destination because there must be significant
differences occurred between their incomes. In general, rural people have less income
compared with the urban people in their place of origin. Therefore usually the income after
migration increased in a greater extent for the respondents who migrated from rural area than
the people migrated from urban area. That is, the change of income after migration was
always higher for the migrant from rural areas. On the other hand, savings always provide
secured life to the respondents which must have significant positive relationship with the
income of the respondent. The reasons behind their movement to Dhaka city must have
significant relationship with their change of income after their migration, although more
specifically the occupational reasons, educational reasons and also the climatic reasons had
significant relationship with internal migration.
3. Data:
To study the causes and consequences of internal migration the census data of Bangladesh is
not sufficient because only some information’s about place of birth is available in the census
schedule. To get data on internal migration in Bangladesh is also very difficult though the
registration system is not good. Accordingly, it is important to give attention to micro-level
studies based on sample surveys, which have the advantage of identifying regional
heterogeneity. Therefore it is better to use survey data for internal migration which are
collected from the field. The vital issue was to turn up with a data set which could be applied
to answer my proposed research questions. The data which I used for my study purpose
contains the total number of 448 migrant’s details with their monthly income, occupation,
years of schooling, age, sex, and parent’s years of schooling, land property, their type of
family and their main reasons towards Dhaka city. All these information’s were in detail for
the two circumstances before migration and after migration which provides about the changes
of their livelihood after migration. Respondent’s occupation were divided into various groups
unemployed, business, service, student, fisherman, rickshaw puller, day labor, housewife,
agriculture, maid/servant, garments worker, retired, government officer, teacher, tutor, guard,
shop-keeper and others, from which I didn’t get very good idea about the situation and also to
avoid the complexity I classified them into seven major groups they were unemployed,
business, sevice, student, agriculture, labourer and others. This caused extra work to remove
the inconsistency presenting in the data set.
3.1 Source material:
The source of the data for my study is sample survey data which was conducted by
Muhammad Maksudul Hannan Masters student of Department of Population Science,
University of Dhaka, Bangladesh. I took consent from him to use the dataset only for my
study purpose to find the research result other than any purpose. A cross sectional data
analysis type study design was applied for this study which contained the retrospective
information of migrants’. Here he used a semi structured questionnaire for this study which
had both open and closed questions. The questionnaire included questions on demographic,
socio-economic, health related, causes and psychological aspects of the respondents. The
open ended questions were included to get information in depth on some aspect and to
understand the real context of the migration.

MOHAMMAD MASTAK AL AMIN Page 21
The respondents were classified into two categories according to their previous status of
resident:
� Urban resident: Individual whose native and current place of residence is an urban
area.
� Rural resident: Individual whose native place was a rural area and current place of
residence is an urban area.
The data contained 448 individuals information among them 58.5% were females that is 262
individuals and 41.5% were males that was 186 and the minimum age of the respondent was
18 years and the maximum age 82 years. The technique he used for data collection was
interview technique; while the tool used was questionnaire which had structured questions
with some open ended questions and developed phase by phase to carry out the tentative
inquisition. The questionnaire was built up in both of Bengali and English language. All of the
respondents were asked in the following area:
� Background information like respondent’s age, age at migration, sex, home district,
place of origin, religion, etc.
� Demographic characteristics such as respondent’s family type, family size, marital
status, birth order, number of children, etc.
� Socio-economic characteristics of respondents, such as number of schooling years,
occupation, monthly income, family income, expenditure patterns, possession of
household items, household condition, training, sanitation, drinking water, electricity,
gas, social activities, number of livestock, amount of land, etc.
� Reasons for migration in order of preference, for every category of reason further
query was made to explore the motive behind that stated reason, reason behind
choosing Dhaka, whether the decision of migration was made by the respondent or
family, person accompanied him during migration, assistance got from any person,
etc.
� Perception related information, like fulfilling of motivation, satisfaction with socio-
economic condition, problems in Dhaka, reason behind not leaving Dhaka, etc.
The questions all of them were made in both of the before and after migration perspective, to
acquire the comprehensible idea about the transform in livelihood. .
3.2 Sample:
The dataset contained a total number of 448 individual’s information who were successfully
interviewed to collected the required information for internal migration in Dhaka city,
therefore the sample size for this study was 448. This was because of the time and budget
constrains. The data collection was done from the prospective of the respondents and the
structured questionnaire with some open-ended questions was used for this study purpose.
The dataset contains socio-economic, economic and demographic independent variables and
also here I considered occupation as dummy variable to control for specific effects and avoid
the various categories of occupation which may not give precise results. Here I tried to find
out the impacts on their livelihoods due to their mobily to the capital city Dhaka from their
place of origin. Therefore I considered three dependent variables: income before coming
Dhaka, income after coming Dhaka and the change of income after coming Dhaka for three
separate regression models to get particular knowledge about these independent variables with
three dependent variables.
MOHAMMAD MASTAK AL AMIN Page 22
He considered those respondents as migrant who came outside of Dhaka and stayed Dhaka at
least 3 months. The people who migrated to Dhaka long ago and therefore fail to recollect
their prior information were not considered as respondent to avoid the recall bias The heads of
the household of the migrant families were interviewed but in case of the single migrants,
students though he/she was not the household head, living alone in Dhaka at student housing
or rented house, was taken as respondent of the study to cove different pattern of migration.
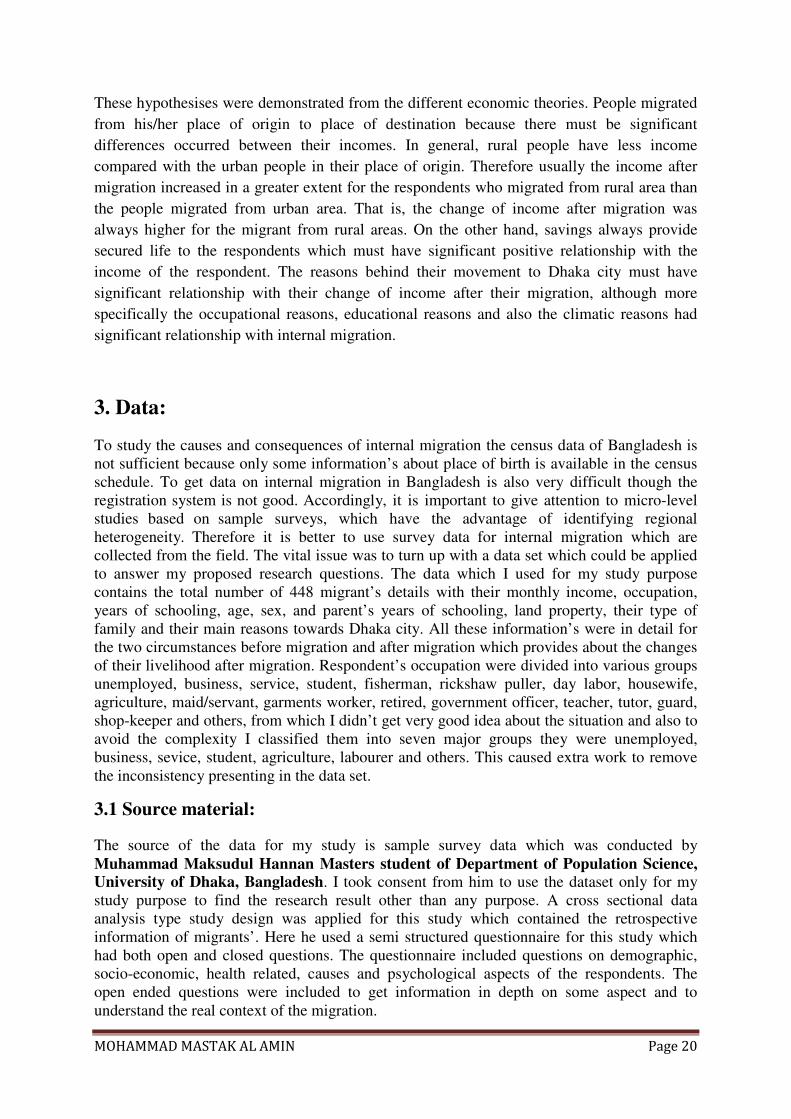
To select the sample for this study have done in two stages. The overall population of Dhaka
city was divided into Nineteen PSUs (Primary Sampling Units) as defined by BBS
(Bangladesh Bureau of Statistics). From them, in the first stage he applied simple random
sampling technique to select three PSUs (Primary Sampling Units) Dhanmondi (Elephant
Road), Choto Diya Bari (Mirpur Majar Road) and Shahjahan Road (Mohammadpur)
randomly out of the nineteen PSUs defined by BBS (Bangladesh Bureau of Statistics) for
Dhaka city. At the second stage, the household lists of the three randomly selected PSUs were
considered as the population frame. After that using random number table a total number of
448 households were interviewed, among them 151 were taken from Elephant Road,
Dhanmondi; 147 were from Chhoto Diya Bari, Mirpur Majar Road and 150 from Shahjahan
Road, Mohammadpur. Households of the three PSUs were visited and interviewed only those
who were migrants.
Table: Study Area for the Study
PSU No. Name of the 19 PSUs Randomly Selected 3
PSUs
0505 Badda
Dhanmondi, Elephant
Road
0506 Manikdi
0507 Demra
0508 Dhanmondi, Elephant Road
0509 Hazaribagh
Shahjahan Road,
Mohammadpur
0510 Kamrangirchar
0511 Khilgaon
0514 Lalbagh, Shahidnagar
0515 Chhoto Diya Bari, Mirpur Majar Road
0516 Pirerbag, Sheorapara
0517 Shahjahan Road, Mohammadpur
0518 Motijheel
0519 Pallabi, 11 No. Section
MOHAMMAD MASTAK AL AMIN Page 23
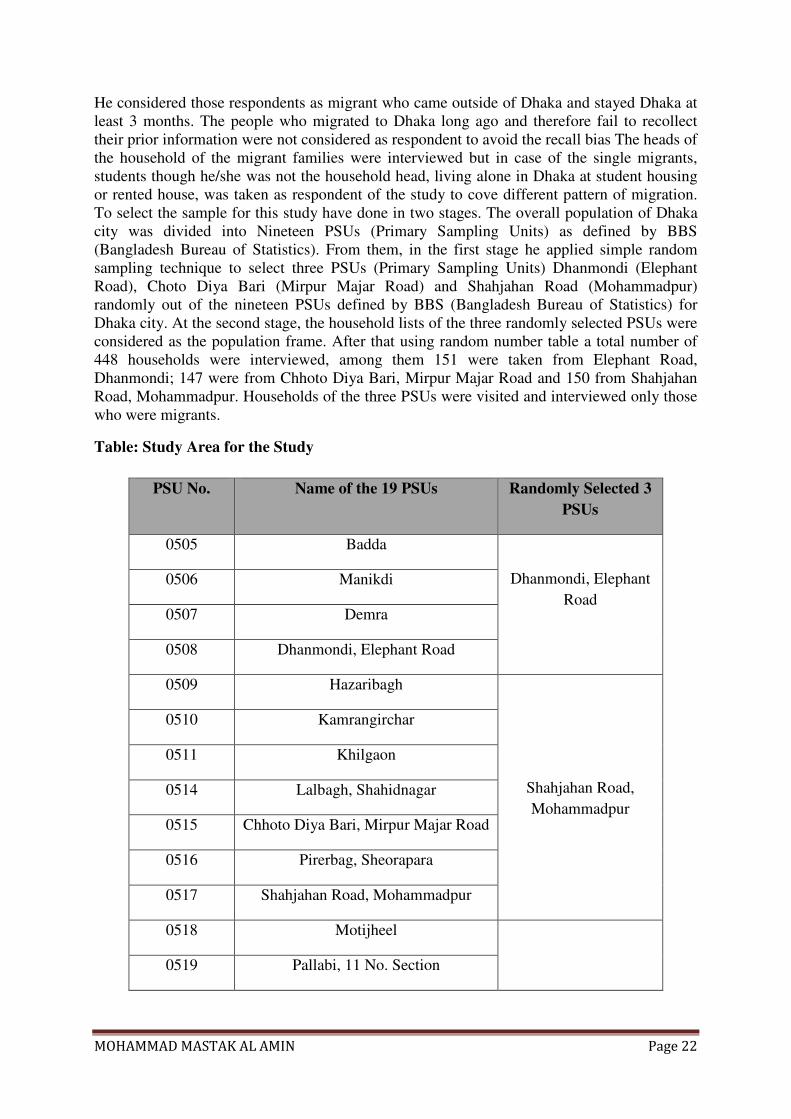
0520 Ramna, Buet Quarter
Chhoto Diya Bari,
Mirpur Majar Road
0521 Manda, Sobujbag
0522 IG Gate, Shampur
0523 Demra
0524 Begunbari
0525 Uttara, Kaola Staff Quarter
Sources: Bangladesh Bureau of Statistics.
4. Methodology:
4.1 Limitations and Statistical model:
This section is divided into two parts: the limitations of the study & the statistical models that
applied for my study purpose, and the next part is about the definition of the variables that
used in the models both the dependent variables and the independent variables. A quantitative
analysis was carried out for the sample survey data that I used to identifying the factors
behind the internal migration in Dhaka city and its impact on the livelihood aspects of the
migrants people according to their living standards due to their changes of income. A
comparison has done between the two groups who migrated from the rural area and who from
the urban area and tried to identify the factors behind their mobility separately. It is very
common in economic aspects to use quantitative analysis and frequently use to be carried out
the variations between different factors. Moreover it is also apply because of it’s aptitude to
give high quality results by restraining the subjectivity of the researcher to the preference of
variables only, which can vary the outcome significantly. For the purpose of my study the
quantitative experiment assessed and evaluated the factors most influential to identify the
impacts on livelihood after migration. Three different models have been considering
identifying the changes of the factors that effect on migrant’s living standard. Whether the
sample size was very small, it reduced the probability that exact population parameters lied
within 95% confidence interval therefore I used 10% significance level rather than 5% for the
analysis..
4.1.1 Limitations of the study:
Migration is a vast area of academic research and study. There are plenty of books, articles,
essays and research projects that have been published frequently by several disciplines and
scholars. The main limitation of my study was the time and word constraints, because my
study applied smaller time period and focused on a limited geographical area, also used a
restricted number of chosen variables. The critical inadequacy of the data was that the rural
urban migrants were identified at the time of the survey those may not be representative for
all people who were migrated in the recent past in terms of preferred individuality, if there has
been selected forward or return migration. Still in the successive discussion of the results
these limits of the study were taken into consideration.
MOHAMMAD MASTAK AL AMIN Page 24
4.1.2 Statistical Model:
Analysis has done in different levels to answer the research questions. The study mainly
divided into two parts, in the first part, I tried to find out the reasons behind the internal
migration or what were the factors associated with internal migration in Bangladesh. To
analyze the first part of my study I need to do some univariate table, bi-variate table and cross
tabulations to identify the factors. In the sense of uni-variate level, frequency of distribution,
percentage of relevant variables were done and presented in both tabular and graphical form.
Here I used univariate analyses to examine the independent variables separately, to get the
preface notion of how significant each independent variable by itself. The examination of
percentages was useful for studying the association between two variables, though these
percentages did not permit for quantification or testing the association in a bivariate analysis.
For my study purpose, it is functional to consider various independent variables to evaluate
the relationship in addition to statistical test of the hypothesis to check whether there is any
association between them. The Chi-square test was carried out to test the existence of
association between the categories of two qualitative variables. In my study, some of the
independent variables were quantitative and some were qualitative. To perform the test we
categorized these quantitative variables into different categories on the base of their respective
standard ranges. I also tried to make cross tabulations to compare the relationship among
different variables, moreover to find whether the relationship was significant or not.
For the purpose of my study and answered to my research questions regression analysis was
carried out. Regression analysis is a statistical technique which is used to investigate and
modeling the relationships between variables (Montgomery, 1992: 1). It is a method of
studying the dependence of one variable on one or more explanatory variables to estimate or
predict the dependent variable in terms of the values of regressor variables. (Islam, 2002: 234)
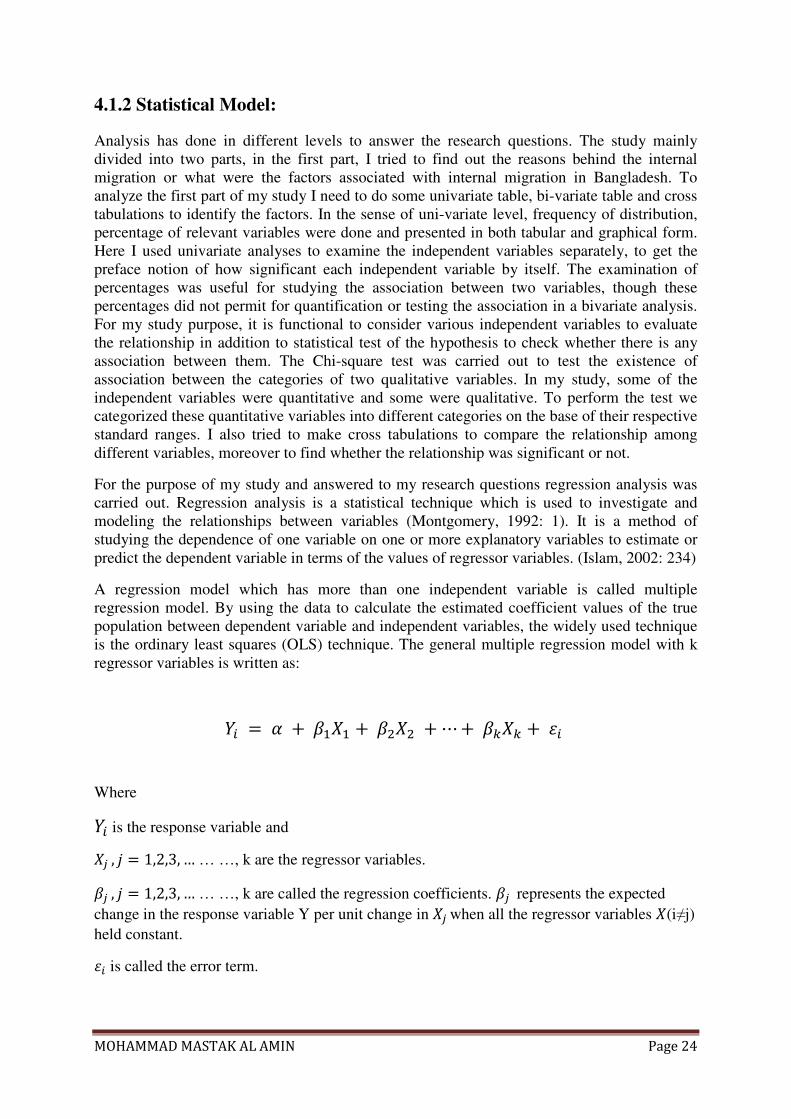
A regression model which has more than one independent variable is called multiple
regression model. By using the data to calculate the estimated coefficient values of the true
population between dependent variable and independent variables, the widely used technique
is the ordinary least squares (OLS) technique. The general multiple regression model with k
regressor variables is written as:
�� = � + ��� + � + ⋯ + ��� + �
Where
�� is the response variable and
� , � = 1,2,3, … … …, k are the regressor variables.
�� , � = 1,2,3, … … …, k are called the regression coefficients. �� represents the expected
change in the response variable Y per unit change in � when all the regressor variables (i≠j)
held constant.
� is called the error term.
MOHAMMAD MASTAK AL AMIN Page 25
α is constant, it represents the expected change in the response variable y when all the
regressor variables are held constant. (Montgomery, 1992: 118)
For my data set I tried to make three regression models to find out the specific effects of
livelihood after internal migration. The regression models are-
Income_before = f (respondent’s years of schooling_before, father’s years of schooling,
mothers’s years of schooling, total number of family members_before, monthly
savings_before, sex, family type, place of origin, occupation_before, reasons behind
migration)
Income_after = f (age, age_squared, respondent’s years of schooling_after, total number of
family members_now, monthly savings_now, sex, occupation_after, reasons behind
migration)
Change of income = f (age, age_squared, respondent’s years of schooling_after, total number
of family members_now, monthly savings_now, sex, occupation_after, reasons behind
migration)
For this analysis, the statistical techniques; ordinary least squares (OLS) regression technique
was used to determine the effects of the reasons behind the internal migration on livelihood
aspects. Here I tried to estimate the causal relationships between the independent variables.
The inputs of the variables were in a predetermined order on the regression equation.
However, the variables entering order were determined from the literature review as well as
experience. The operational measures were selected and used in regression model by the data
which are available (Nabi, 1992). The collected data was analyzed by most extensively using
software SPSS (Statistical Package for Social Science), MS Excel and MS Word which were
found to be necessary in various aspects to complete this study.
4.2 Definition of variables:
This small-scale survey data included information on socioeconomic characteristics of the
respondent’s occupation, income, education, land ownership, health and socio-demographic
variables respondent’s age, age of migration, sex, family size and family type. The dependent
and independent variables are identified according to my study purpose and also considering
the conceptual framework. Here I tried to find out the reasons behind the internal migration of
Dhaka city and to identify the change of livelihood of the respondents after migration,
therefore the income of the respondent consider as dependent variable. The respondents of my
study were the migrants’ people, so it is obvious that they had changed their residence either
from the area of urban to rural or urban to urban. The independent variables are respondent’s
place of origin, age, age squared, sex, years of schooling, parent’s years of schooling,
occupation, family size, family type, monthly savings, reasons behind migration.
MOHAMMAD MASTAK AL AMIN Page 26
4.2.1 Dependent variables:
To examine effects of livelihood aspects after migration, income of the respondent used as
outcome variable. Here we considered the respondent’s income before migration; income
after migration and the change of income after migration as our dependent variable in three
different regression models to find out the effect of livelihood aspects after migration. The
survey data set have income measures, which are typically used as indicators of household
economic status. The data set didn’t have the variables ‘change of income after migration’ for
which I created a new variable ‘change of income’ of the respondent’s by subtracting the
income before migration from the income after migration. In developing countries, the
conventional perception of poverty is emphasis on income. Montgomery et al. (2000) have
noted that in developing countries, it is quite often that households pull together their incomes
from several sources which always change from year to year or even from season to season.
Some employments have the transient nature that couple with the uncertainty of net economic
return, makes it conceivable to gaze at any one year’s income as envoy of the incomes earned
in excess of the longer time period in which demographic decisions are made.
4.2.2 Independent variables:
Here I considered the variables as independent variables for my study are respondent’s place
of origin, age, age squared, years of schooling of the respondents, parent’s years of schooling,
occupation, family size, family type, total value of the household items and the reasons for
migration. The place of origin was categorised by rural and urban area which specified that
respondents who migrated from the urban area and who from rural area. Age of the
respondent was considered as the present age of respondent’s in years and also the age at
migration was considered the age when he migrated which is also in years. Education is the
major source of human capital formation and eventually a crucial tool for poverty evasion. It
is always likely that mobility, economical status and development of households will differ
across various levels of educational accomplishment. In my data, education was calculated as
the highest years of schooling completed. We consider education of the respondent’s,
education of respondent’s father and mother also as independent variable. We considered the
family type as independent variable which was in two categories: single family and joint
family. In terms of occupation, the categories were made in order to unemployed, business,
service, student, agriculture, laborer and others. Dhaka is the most important destination for
migrants as it is the capital of the country. The regional effects were examined along with the
respondent’s place of birth. We also considered the main reasons for migration as independent
variable which has categorised as motive for occupation, education, social, political,
beneficial and climatic.
Here I concluded age squared as independent variable. This is because we usually expect that
the young, inexperienced workers have relatively low wages but their wages go up when their
experience is increasing. After their middle age the wages again decline up to their retirement
age. Therefore to capture these life patterns of wages I concluded age and also age squared to
explain the exact effect of the respondent’s level of income. We generally expect that the
coefficient value of the independent variable age squared is always less than zero and the
coefficient value for age is greater than zero to obtain the inverted U-shape curve of the
respondent income. Adding polynomial terms in the regression model is a simple and flexible
way to clarify the nonlinear relationships between variables. (Hill et al., 2008: 168-170)
MOHAMMAD MASTAK AL AMIN Page 27
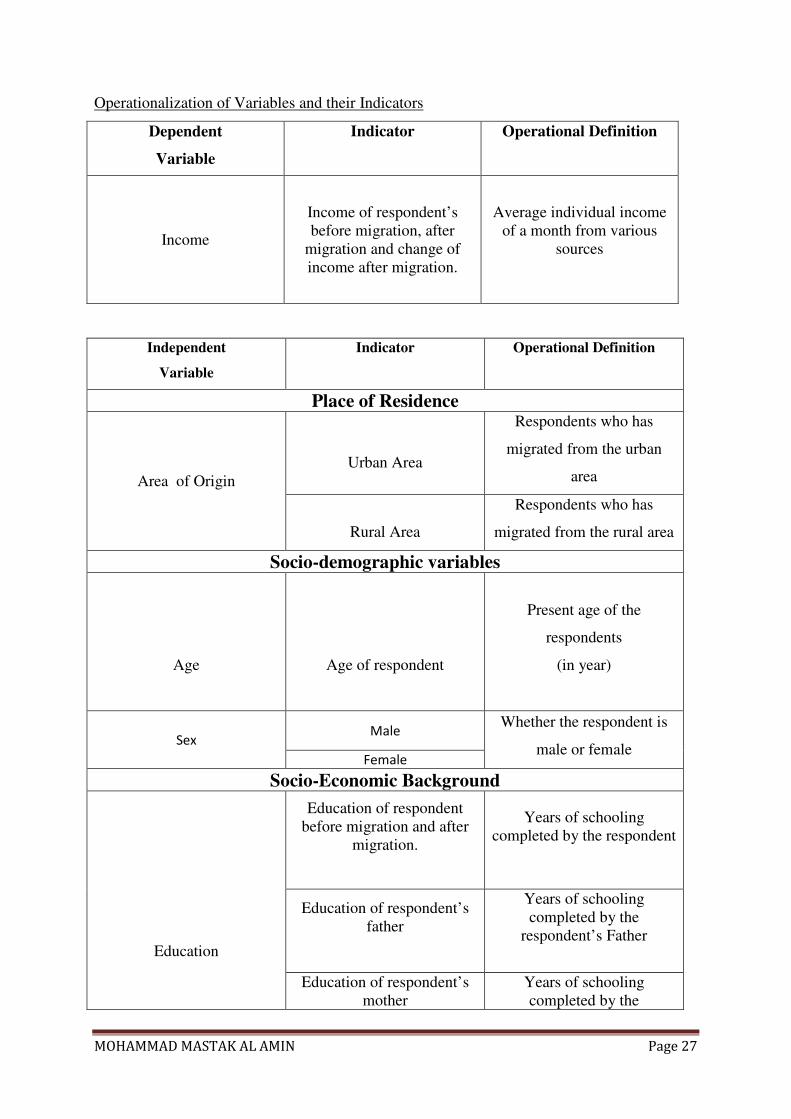
Operationalization of Variables and their Indicators
Dependent
Variable
Indicator Operational Definition
Income
Income of respondent’s
before migration, after
migration and change of
income after migration.
Average individual income
of a month from various
sources
Independent
Variable
Indicator Operational Definition
Place of Residence
Area of Origin
Urban Area
Respondents who has
migrated from the urban
area
Rural Area
Respondents who has
migrated from the rural area
Socio-demographic variables
Age
Age of respondent
Present age of the
respondents
(in year)
Sex Male
Whether the respondent is
male or female Female
Socio-Economic Background
Education
Education of respondent
before migration and after
migration.
Years of schooling
completed by the respondent
Education of respondent’s
father
Years of schooling
completed by the
respondent’s Father
Education of respondent’s
mother
Years of schooling
completed by the
MOHAMMAD MASTAK AL AMIN Page 28
respondent’s Mother
Occupation
Occupation of respondent
before migration and after
migration.
The main profession in
which the respondent spends
his/her maximum time
Family
Family Structure
Family Size
Number of members in the
family
Family Type
Form of the family
5. Empirical analysis:
At individual level the differentials of migration have been discussed into three major aspects
of migration: selectivity of migrants, nature of migration and factors active for migration that
I mentioned earlier. The aim of my study was to discuss the selectivity & nature of migration
and focused on the differentials and determinants of internal migration and also explained all
the factors which were active for migration & how they affected the livelihood aspects by
empirical results from various statistical measures.
Selectivity of Migrants:
The characteristics of the individual i.e age, marital status, years of schooling, occupation of
the respondents have been considered to understand the selectivity of migration process.
MOHAMMAD MASTAK AL AMIN
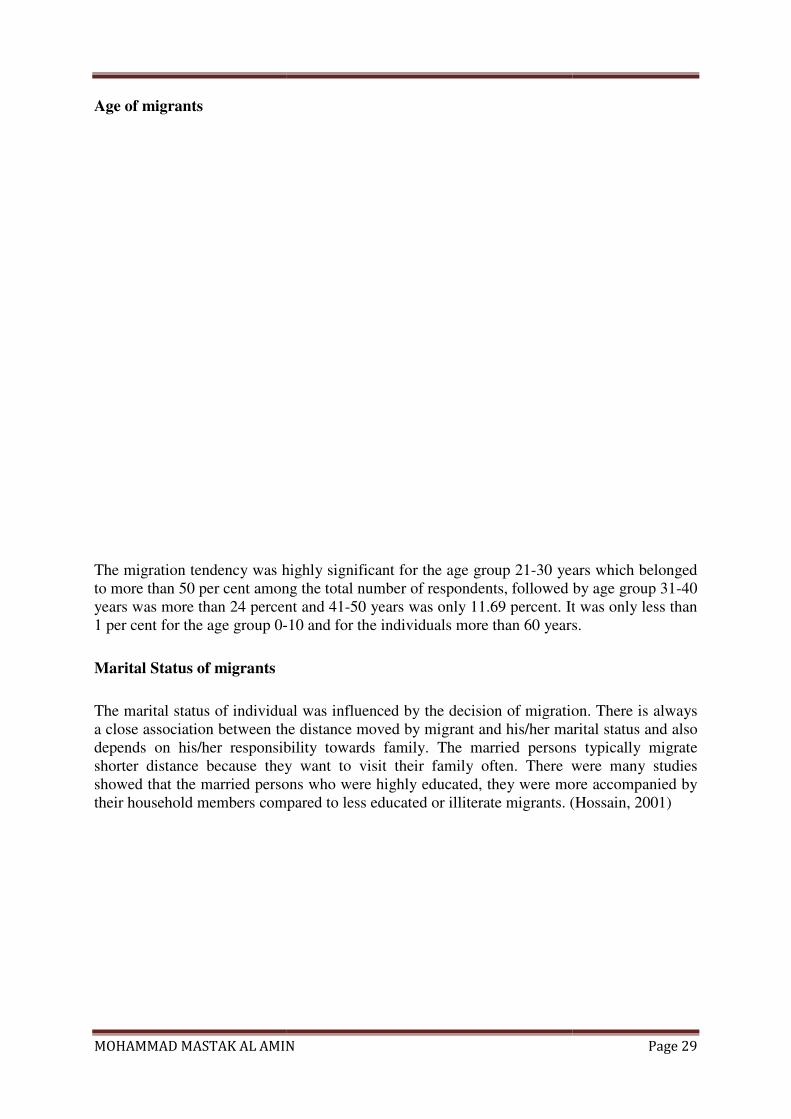
Age of migrants
The migration tendency was highly significant for the age group 21
to more than 50 per cent among the total number of respondents, followed by age group 31
years was more than 24 percent and 41
1 per cent for the age group 0-
Marital Status of migrants
The marital status of individual wa
a close association between the dis
depends on his/her responsibility towards family. The married persons typically migrate
shorter distance because they want to v
showed that the married persons who were highly educated, they were more accompanied by
their household members compared to less educated or illiterate migrants. (Hossain, 2001)
MOHAMMAD MASTAK AL AMIN
The migration tendency was highly significant for the age group 21-30 years which belonged
to more than 50 per cent among the total number of respondents, followed by age group 31
24 percent and 41-50 years was only 11.69 percent. It
-10 and for the individuals more than 60 years.
e marital status of individual was influenced by the decision of migration. There is
a close association between the distance moved by migrant and his/her marital status and also
depends on his/her responsibility towards family. The married persons typically migrate
shorter distance because they want to visit their family often. There we
ed persons who were highly educated, they were more accompanied by
their household members compared to less educated or illiterate migrants. (Hossain, 2001)
Page 29
30 years which belonged
to more than 50 per cent among the total number of respondents, followed by age group 31-40
percent. It was only less than
10 and for the individuals more than 60 years.
s influenced by the decision of migration. There is always
tance moved by migrant and his/her marital status and also
depends on his/her responsibility towards family. The married persons typically migrate
isit their family often. There were many studies
ed persons who were highly educated, they were more accompanied by
their household members compared to less educated or illiterate migrants. (Hossain, 2001)
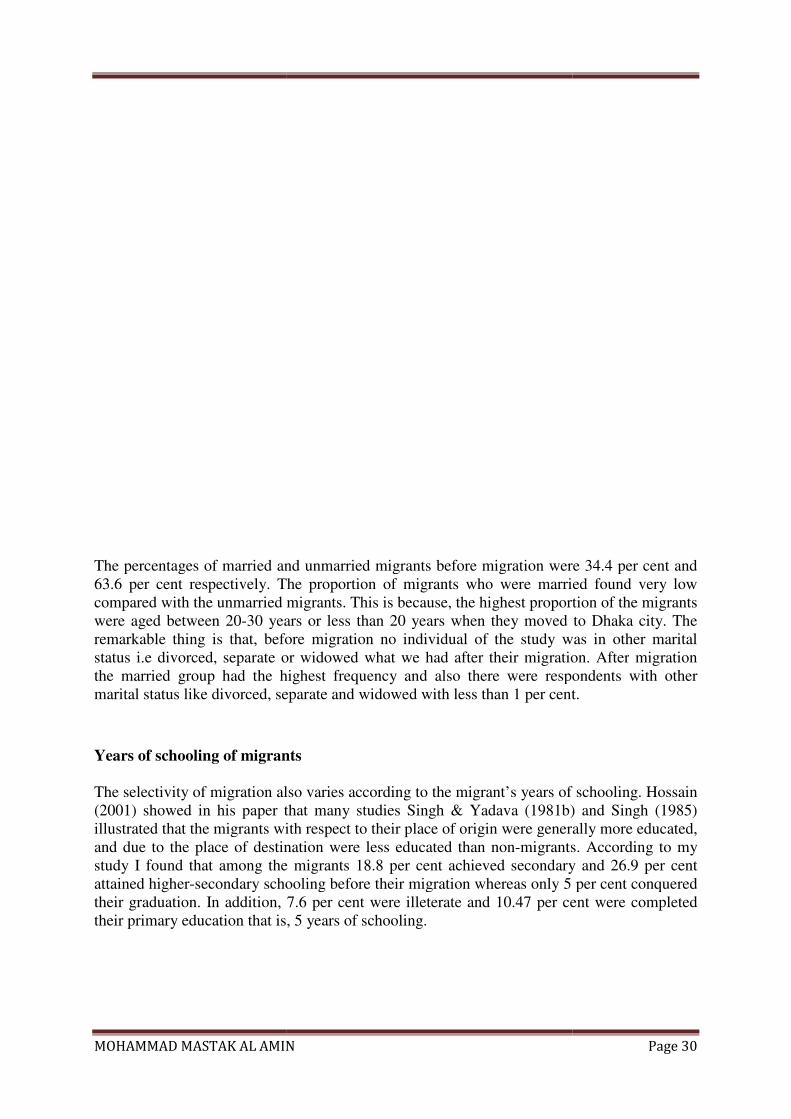
MOHAMMAD MASTAK AL AMIN
The percentages of married and unmarried migrants
63.6 per cent respectively. The proportion of migrants who were married found very low
compared with the unmarried migrants. This is because, the highest proportion of the migrants
were aged between 20-30 years or less than 20 years when they moved to Dhaka cit
remarkable thing is that, before migration
status i.e divorced, separate or widowed what we had
the married group had the hi
marital status like divorced, separate and widowed with less than 1 per cent.
Years of schooling of migrants
The selectivity of migration also varies according to the migrant’s years of schooling. Hossain
(2001) showed in his paper that many studies Singh & Yadava (1981b) and Singh (1985)
illustrated that the migrants with re
and due to the place of destination we
study I found that among the migrants 18.8 per cent achieved secondary and 26.9 per cent
attained higher-secondary schooling before their migration whereas only 5 per cent conquered
their graduation. In addition, 7.6 per cent were illeterate and 10.47 per cent were
their primary education that is
MOHAMMAD MASTAK AL AMIN
The percentages of married and unmarried migrants before migration were 34.4 per cent and
per cent respectively. The proportion of migrants who were married found very low
compared with the unmarried migrants. This is because, the highest proportion of the migrants
30 years or less than 20 years when they moved to Dhaka cit
before migration no individual of the study was in other marital
separate or widowed what we had after their migration. After
the highest frequency and also there were respondents with other
marital status like divorced, separate and widowed with less than 1 per cent.
Years of schooling of migrants
The selectivity of migration also varies according to the migrant’s years of schooling. Hossain
that many studies Singh & Yadava (1981b) and Singh (1985)
illustrated that the migrants with respect to their place of origin were generally more educated,
ue to the place of destination were less educated than non-migrants. According to my
ound that among the migrants 18.8 per cent achieved secondary and 26.9 per cent
secondary schooling before their migration whereas only 5 per cent conquered
their graduation. In addition, 7.6 per cent were illeterate and 10.47 per cent were
their primary education that is, 5 years of schooling.
Page 30
were 34.4 per cent and
per cent respectively. The proportion of migrants who were married found very low
compared with the unmarried migrants. This is because, the highest proportion of the migrants
30 years or less than 20 years when they moved to Dhaka city. The
no individual of the study was in other marital
after their migration. After migration
spondents with other
marital status like divorced, separate and widowed with less than 1 per cent.
The selectivity of migration also varies according to the migrant’s years of schooling. Hossain
that many studies Singh & Yadava (1981b) and Singh (1985)
re generally more educated,
migrants. According to my
ound that among the migrants 18.8 per cent achieved secondary and 26.9 per cent
secondary schooling before their migration whereas only 5 per cent conquered
their graduation. In addition, 7.6 per cent were illeterate and 10.47 per cent were completed
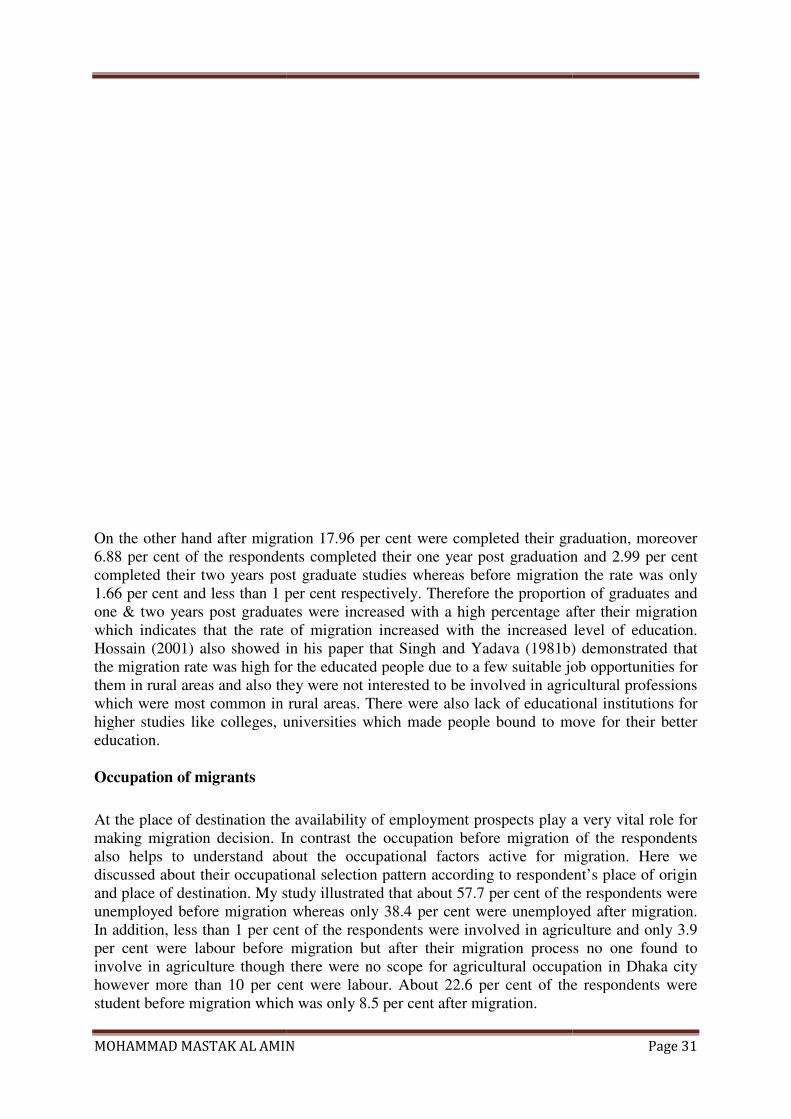
MOHAMMAD MASTAK AL AMIN
On the other hand after migration 17.96 per cent were completed their graduation, moreover
6.88 per cent of the respondents completed their one year post graduation and 2.99 per cent
completed their two years post graduate studies whereas before migration
1.66 per cent and less than 1 per cent respectively. Therefore the proportion of graduates and
one & two years post graduates were increased with a high percentage after their migration
which indicates that the rate of migration increased
Hossain (2001) also showed in his paper that Singh and Yadava (1981b) demonstrated that
the migration rate was high for the educated people due to a few suitable job opportunities for
them in rural areas and also the
which were most common in rural areas. There were also lack of educational institutions for
higher studies like colleges, universities which made people bound to move for their better
education.
Occupation of migrants
At the place of destination the availability of employment prospects play a very vital role for
making migration decision. In contrast the occupation before migration of the respondents
also helps to understand about the occu
discussed about their occupational selection pattern according to respondent’s place of origin
and place of destination. My study illustrated that about 57.7 per cent of the respondents were
unemployed before migration whereas only 38.4 per cent were unemploye
In addition, less than 1 per cent of the respondents were involved in agriculture and only 3.9
per cent were labour before migration but after their migration process no one found to
involve in agriculture though there were no scope for agricultural occupation in Dhaka city
however more than 10 per cent were labour. About 22.6 per cent of the respondents were
student before migration which was only 8.5 per cent after migration.
MOHAMMAD MASTAK AL AMIN
On the other hand after migration 17.96 per cent were completed their graduation, moreover
6.88 per cent of the respondents completed their one year post graduation and 2.99 per cent
completed their two years post graduate studies whereas before migration
1.66 per cent and less than 1 per cent respectively. Therefore the proportion of graduates and
one & two years post graduates were increased with a high percentage after their migration
which indicates that the rate of migration increased with the increased level of education.
Hossain (2001) also showed in his paper that Singh and Yadava (1981b) demonstrated that
the migration rate was high for the educated people due to a few suitable job opportunities for
them in rural areas and also they were not interested to be involved in agricultural professions
which were most common in rural areas. There were also lack of educational institutions for
higher studies like colleges, universities which made people bound to move for their better
At the place of destination the availability of employment prospects play a very vital role for
making migration decision. In contrast the occupation before migration of the respondents
also helps to understand about the occupational factors active for migration. Here we
discussed about their occupational selection pattern according to respondent’s place of origin
and place of destination. My study illustrated that about 57.7 per cent of the respondents were
migration whereas only 38.4 per cent were unemploye
, less than 1 per cent of the respondents were involved in agriculture and only 3.9
per cent were labour before migration but after their migration process no one found to
olve in agriculture though there were no scope for agricultural occupation in Dhaka city
however more than 10 per cent were labour. About 22.6 per cent of the respondents were
student before migration which was only 8.5 per cent after migration.
Page 31
On the other hand after migration 17.96 per cent were completed their graduation, moreover
6.88 per cent of the respondents completed their one year post graduation and 2.99 per cent
completed their two years post graduate studies whereas before migration the rate was only
1.66 per cent and less than 1 per cent respectively. Therefore the proportion of graduates and
one & two years post graduates were increased with a high percentage after their migration
with the increased level of education.
Hossain (2001) also showed in his paper that Singh and Yadava (1981b) demonstrated that
the migration rate was high for the educated people due to a few suitable job opportunities for
y were not interested to be involved in agricultural professions
which were most common in rural areas. There were also lack of educational institutions for
higher studies like colleges, universities which made people bound to move for their better
At the place of destination the availability of employment prospects play a very vital role for
making migration decision. In contrast the occupation before migration of the respondents
pational factors active for migration. Here we
discussed about their occupational selection pattern according to respondent’s place of origin
and place of destination. My study illustrated that about 57.7 per cent of the respondents were
migration whereas only 38.4 per cent were unemployed after migration.
, less than 1 per cent of the respondents were involved in agriculture and only 3.9
per cent were labour before migration but after their migration process no one found to
olve in agriculture though there were no scope for agricultural occupation in Dhaka city
however more than 10 per cent were labour. About 22.6 per cent of the respondents were
MOHAMMAD MASTAK AL AMIN
Nature of migration:
We get the idea of the respondent’s employment status at the place of origin and place of
destination by examine the nature of their migration patterns. We found from the table
69.2 per cent of the migrants moved Dhaka city for occupational purpose and 15.8 per cent
were for their educational matter. About 64.8 per cent migrants were moved due to lack of
working area and 16.7 per cent moved in terms of lack of work correspo
efficiency in the table 5a(1).
Dhaka for finding work and 31.4 per cent were for more income. Among them 82.4 per cent
found in table 5(b) were moved for better educational instit
for their childrens better education. Those who migrated for their
were significantly high for the groups who wanted to get into the universit
percentage was 86.3 in the table 5b(1)
higher secondary level schooling are insufficient in most of the rural areas as well as small
cities or towns.
The Factors which were active for migration:
To take decision about migra
various economic, non-economic and social factors. The factors are usually explained by two
points of view- the factors which pushed off the respondents towards Dhaka city and those
factors which pulled them to attain these prospects. Here I found from my data that economic
reasons played foremost part in migration decision.
of the respondents migrated due to their occupational reasons; among them over 53 percent
moved for finding works, 31.4 per cent for better income compared to their previous place
MOHAMMAD MASTAK AL AMIN
We get the idea of the respondent’s employment status at the place of origin and place of
destination by examine the nature of their migration patterns. We found from the table
69.2 per cent of the migrants moved Dhaka city for occupational purpose and 15.8 per cent
were for their educational matter. About 64.8 per cent migrants were moved due to lack of
working area and 16.7 per cent moved in terms of lack of work correspo
. In the table 5(a), more than fifty per cent individuals came to
Dhaka for finding work and 31.4 per cent were for more income. Among them 82.4 per cent
were moved for better educational institutions and only 4.8 per cent moved
for their childrens better education. Those who migrated for their educational purpose, the rate
significantly high for the groups who wanted to get into the university education and the
ble 5b(1). This is because; in Bangladesh the institutions for post
higher secondary level schooling are insufficient in most of the rural areas as well as small
The Factors which were active for migration:
To take decision about migration from one place to another place may be influenced by
economic and social factors. The factors are usually explained by two
the factors which pushed off the respondents towards Dhaka city and those
lled them to attain these prospects. Here I found from my data that economic
reasons played foremost part in migration decision. In table 5 we found more than 69 per cent
of the respondents migrated due to their occupational reasons; among them over 53 percent
moved for finding works, 31.4 per cent for better income compared to their previous place
Page 32
We get the idea of the respondent’s employment status at the place of origin and place of
destination by examine the nature of their migration patterns. We found from the table 5 that
69.2 per cent of the migrants moved Dhaka city for occupational purpose and 15.8 per cent
were for their educational matter. About 64.8 per cent migrants were moved due to lack of
working area and 16.7 per cent moved in terms of lack of work corresponding to the
ore than fifty per cent individuals came to
Dhaka for finding work and 31.4 per cent were for more income. Among them 82.4 per cent
utions and only 4.8 per cent moved
educational purpose, the rate
y education and the
. This is because; in Bangladesh the institutions for post
higher secondary level schooling are insufficient in most of the rural areas as well as small
tion from one place to another place may be influenced by
economic and social factors. The factors are usually explained by two
the factors which pushed off the respondents towards Dhaka city and those
lled them to attain these prospects. Here I found from my data that economic
ore than 69 per cent
of the respondents migrated due to their occupational reasons; among them over 53 percent
moved for finding works, 31.4 per cent for better income compared to their previous place
MOHAMMAD MASTAK AL AMIN Page 33
and 10.5 percent due to their transfer of job and more than 4 percent for others reasons for
example due to the movement of their family described in table 5(a). Considering the
occupational reasons in the table 5a(1), 64.8 per cent found lack of working area in their place
of origin, more than 16 per cent discovered them in the position that unavailibility of work
according to their efficiency and 9.3 per cent didn’t try for any job. Besides this factor, the
major reasons for the migration were educational, social, political, beneficial and climatic
which compel them to migrate into the new place. More than 15 per cent of the individuals
migrated in terms of the educational reasons, among them more than 80 per cent moved for
better educational institutes and 4.8 per cent respondents came at Dhaka city to provide their
childrens better educational facilities which were found in table 5(b). In Bangladesh, scarcity
of schools, colleges and universities are always a big problem in the rural and small town
areas. In our dataset the respondents who provided the informations of the lack of educational
institutes in the place of origin, we got from the table 5b(1) more than 86 per cent respondents
didn’t have universities and 12.1 per cent didn’t have colleges in their place of origin. Only
1.6 per cent didn’t have schools which depicted that most of the rural and small town areas
have schools though Bangladesh is a developing country and the literacy rate increases day by
day. One of the reasons of migrating in Dhaka city was social reasons. It was found from the
data that the main push factor for graduate level migrants was job searching which followed
by poverty and studies whereas poverty was the main push factor for illeterate migrants.
Among the respondents 9.6 per cent of them migrated because of social reason which
contained family collisions, social insecurity, and gender inequality. In our data more than 60
per cent of the respondents hold the nuclear family where as less than 40 per cent lived in
joint family. Among the respondents showed in table 5(c), 18.2 per cent migrated for family
collisions, 10.4 per cent moved to Dhaka city for their social security and less than 3 per cent
migrated because of the gender inequality. There were some political reasons moved to Dhaka
city i.e. victim of political vindictiveness, lack of laws and order, which was less than one per
cent of the migrants.
Yadava (1988) in Hossain (2001) papers described that the decision for migration of an
individual was also influenced by some others factors which pulled them to the place of
destination. Dhaka is the capital city of Bangladesh which has most of the modern facilities,
health facilities, communication facilities and many others facilities that the rural areas or
small towns do not have. About 3 per cent of the respondents migrated for these facilities
among them 3.5 per cent for health facilities, 22.4 per cent for different urban facilities, more
than 37 per cent for modern facilities, less than 5 per cent for communication facilities and
23.5 per cent moved to think about their children’s bright future which described in table 5(f).
I mentioned earlier that Bangladesh is a revirine country where floods are very common
matter. In these recent years the population mobility recuperated towards Dhaka in case of the
vulnerable ecology and climate change. The most ecologically affected districts were
Lalmonirhat, Gaibandha, Kurigram and Rangpur in Bangladesh, where floods were very
common phenomenon because they are in the river erosion belts of the Brahmaputra River.
Less than two per cent of the respondents of my study migrated for the clamatic reasons: river
erosion, land slide, cyclone, flood and drought which are very natural phenomenon in
Bangladesh. These factors forced them to migrate towards Dhaka city. In the table 5(d) we
found among the respondents who were affected by these climatic factors, 40 per cent of them
were affected by river erosion, 20 per cent for land slide and cyclone, 10 per cent for flood
and drought. For these above climatic reasons 44.4 per cent of the respondents lost their home
and land of household, 11.1 per cent lost their agricultural land mentioned in the table 5d(1).
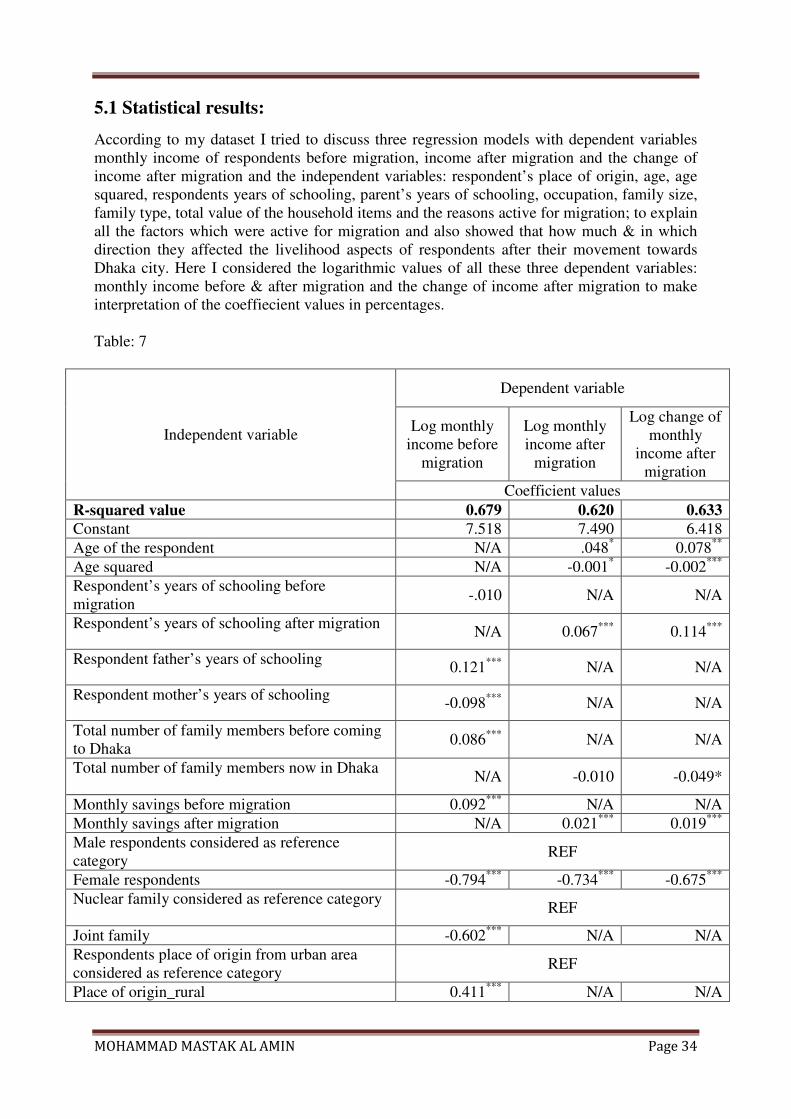
MOHAMMAD MASTAK AL AMIN Page 34
5.1 Statistical results:
According to my dataset I tried to discuss three regression models with dependent variables
monthly income of respondents before migration, income after migration and the change of
income after migration and the independent variables: respondent’s place of origin, age, age
squared, respondents years of schooling, parent’s years of schooling, occupation, family size,
family type, total value of the household items and the reasons active for migration; to explain
all the factors which were active for migration and also showed that how much & in which
direction they affected the livelihood aspects of respondents after their movement towards
Dhaka city. Here I considered the logarithmic values of all these three dependent variables:
monthly income before & after migration and the change of income after migration to make
interpretation of the coeffiecient values in percentages.
Table: 7
Independent variable
Dependent variable
Log monthly
income before
migration
Log monthly
income after
migration
Log change of
monthly
income after
migration
Coefficient values
R-squared value 0.679 0.620 0.633
Constant 7.518
7.490
6.418
Age of the respondent N/A .048*
0.078**
Age squared N/A -0.001*
-0.002***
Respondent’s years of schooling before
migration -.010 N/A N/A
Respondent’s years of schooling after migration N/A 0.067
*** 0.114
***
Respondent father’s years of schooling 0.121
*** N/A N/A
Respondent mother’s years of schooling -0.098
*** N/A N/A
Total number of family members before coming
to Dhaka 0.086
*** N/A N/A
Total number of family members now in Dhaka N/A -0.010 -0.049*
Monthly savings before migration 0.092***
N/A N/A
Monthly savings after migration N/A 0.021***
0.019***
Male respondents considered as reference
category REF
Female respondents -0.794***
-0.734***
-0.675***
Nuclear family considered as reference category REF
Joint family -0.602***
N/A N/A
Respondents place of origin from urban area
considered as reference category REF
Place of origin_rural 0.411***
N/A N/A
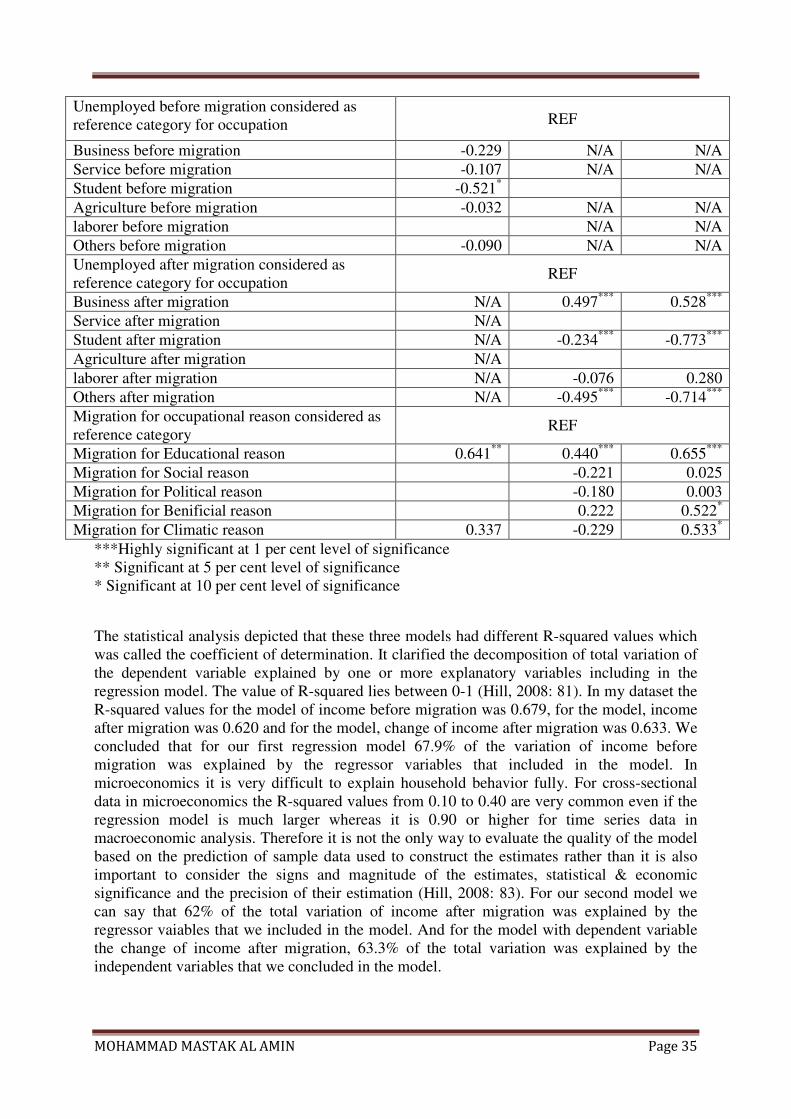
MOHAMMAD MASTAK AL AMIN Page 35
Unemployed before migration considered as
reference category for occupation REF
Business before migration -0.229 N/A N/A
Service before migration -0.107 N/A N/A
Student before migration -0.521*
Agriculture before migration -0.032 N/A N/A
laborer before migration N/A N/A
Others before migration -0.090 N/A N/A
Unemployed after migration considered as
reference category for occupation REF
Business after migration N/A 0.497***
0.528***
Service after migration N/A
Student after migration N/A -0.234***
-0.773***
Agriculture after migration N/A
laborer after migration N/A -0.076 0.280
Others after migration N/A -0.495***
-0.714***
Migration for occupational reason considered as
reference category REF
Migration for Educational reason 0.641**
0.440***
0.655***
Migration for Social reason
-0.221 0.025
Migration for Political reason
-0.180 0.003
Migration for Benificial reason
0.222 0.522*
Migration for Climatic reason 0.337 -0.229 0.533*
***Highly significant at 1 per cent level of significance
** Significant at 5 per cent level of significance
* Significant at 10 per cent level of significance
The statistical analysis depicted that these three models had different R-squared values which
was called the coefficient of determination. It clarified the decomposition of total variation of
the dependent variable explained by one or more explanatory variables including in the
regression model. The value of R-squared lies between 0-1 (Hill, 2008: 81). In my dataset the
R-squared values for the model of income before migration was 0.679, for the model, income
after migration was 0.620 and for the model, change of income after migration was 0.633. We
concluded that for our first regression model 67.9% of the variation of income before
migration was explained by the regressor variables that included in the model. In
microeconomics it is very difficult to explain household behavior fully. For cross-sectional
data in microeconomics the R-squared values from 0.10 to 0.40 are very common even if the
regression model is much larger whereas it is 0.90 or higher for time series data in
macroeconomic analysis. Therefore it is not the only way to evaluate the quality of the model
based on the prediction of sample data used to construct the estimates rather than it is also
important to consider the signs and magnitude of the estimates, statistical & economic
significance and the precision of their estimation (Hill, 2008: 83). For our second model we
can say that 62% of the total variation of income after migration was explained by the
regressor vaiables that we included in the model. And for the model with dependent variable
the change of income after migration, 63.3% of the total variation was explained by the
independent variables that we concluded in the model.
MOHAMMAD MASTAK AL AMIN Page 36
We discussed before, the determinants of migration give us a better idea about the migration
motives that some people participated in migration process while others not. These three
linear regression models have been applied to study these determinants of migration. For our
first regression model, the findings in the table-7 showed that the independent variables
respondent father’s years of schooling, mother’s years of schooling, monthly savings before
migration, total number of family members before, female respondent, joint family type,
respondent from rural area, occupation before as student and the educational reasons behind
the migration were highly significant for the dependent variable income of the respondent
before migration at 1%, 5% and 10% level of significance while the regressor variables
respondent years of schooling before migration, occupation those who were involved in
business, service, agriculture & others, and the climatic reasons behind migration, had no
significant effect. The independent variables those who regressed to our dependent variable
respondent’s income before came to Dhaka; among them respondent’s years of schooling,
mother’s years of schooling, female respondents, joint family type, occupation those who
were involved in business, service, student, agriculture and others, have had negative effect.
The second regression model illustrated from the table-7, the independent variables age of the
respondents, age squared, respondent years of schooling or highest class completed after
migration, monthly savings after migration, female respondents, present occupation as
businessman, student and others, the educational reasons behind migration were highly
significant for the dependent variable income of the respondent after migration at 1% and
10% level of significance whereas total number of family members in Dhaka, occupation now
as labourer, the reasons behind migration for educational, social, political, beneficial and
climatic had no significant effect on the considered dependent variable. Among them the
regressor variables age squared of the respondents, total number of family members in Dhaka,
female respondents, occupation now as student, labourer and others and the social, political
and climatic reasons behind migration have had negative upshot on income after migration.
From our third regression model we got from the table-7 that the dependent variable change
of income of the respondent after migration have had very high significant effects by the
independent variables age of the respondents, age squared, respondent’s years of schooling
after migration, total number of family members in Dhaka, monthly savings after migration,
female respondents, present occupation as businessman, student & others and the educational
reasons, beneficial reasons & climatic reasons behind migration at 1%, 5% & 10% level of
significance. However, the reasons behind migration for social & political and present
occupation as labor had no significant effect on our dependent variable. Among them the
independent variables age squared of the respondents, total numbers of family members in
Dhaka, female respondents, present occupation as student & others have had negative effect
on the respondents’ change of income after migration.
The interpretation of the coefficient values of independent variables for the dependent
variable respondent’s income before migration we found from the table-7, for the education
variable the total number of years of schooling of the respondent and his/her mother had
negative affect, but for each year of schooling completed by respondent’s father, the monthly
income of the respondent had increased by 12.1% before came to Dhaka. From the table-7 we
found that respondent’s years of schooling was highly significant for the dependent variables
monthly income after migration and the change of monthly income respectively. The income
had increased by 6.7% and 11.4% for the dependent variables monthly income after migration
and the change of monthly income respectively for each year of schooling increased by the
respondent.
MOHAMMAD MASTAK AL AMIN Page 37
It was found from the table-7, age of the respondent was also highly significant and 4.8%
monthly income had increased after migration for increased of each year of age of the
migrants while the change of monthly income had increased about 7.8%. We mentioned
earlier that the age squared must have negative effect with monthly income which depicted
from our data that 0.1% monthly income after migration and 0.2% change of income had
decreased for one unit change of age squared value.
There were several studies Connell et al.1976; Sekhar, 1993; Upton, 1967 described in
Hossain (2001) paper that family size was positively related with the migration process. In
other view, people who were from large households took part into migration procedure
frequently because of to hold up some family members to go outside for work. The study
illustrated that the total number of family members had positive effect on monthly income
before migration but negative effect on monthly income after migration and the change of
monthly income. We found from table-7 that one unit increased of family members had
increased 8.6% of respondent monthly income before came to Dhaka but 1% and 4.9%
decreased respectively of his monthly income and the change of monthly income respectively
after his arrival to Dhaka city.
We usually expect that the monthly savings of the respondents must have positive effect on
respondent’s income which also demonstrated from our study. The monthly savings showed
highly significant for our dependent variables in all the three models, if the respondent wanted
to upgrade one unit of his monthly savings, his monthly income need to increased 9.2% per
month before migration; 2.1% monthly income after migration and 1.9% for the change of
monthly income after their migration.
We considered the regressor variables sex, family type, place of origin, occupation and
reasons for migration as dummy variables that we concluded in the model. We found from the
model, the coefficient of the female respondent was -0.794 reflected that the monthly income
before migration for the female respondent was 79.4% less than male respondent which was
considered as reference group. For the other two models the dependent variables respondent’s
monthly income and the change of monthly income after migration the coefficient values for
the female respondent were -0.734 and-0.675 respectively which indicated that the monthly
income and the change of income after migration were 73.4% and 67.5% less for the female
respondents than the male respondents.
The independent variables, types of family that the respondent’s hold before and the place of
origin from where the respondent came, also had impact on his/her monthly income before
migration. It was found from the table-7, both the independent variables were highly
significant and the monthly income before migration in case of joint family was 60.2% less
than the single family, on the other hand the rural respondents had 41.1% more monthly
income than the reference category: urban respondents before migration.
Occupations were significantly related to the monthly income of the respondent’s before
migration, after migration and also for the change of income after migration which induced
them for internal migration to acquire the better living. It was discussed before that
occupations were divided into seven categories unemployment, business, service, student,
agriculture, labour and others; considered it as dummy variable to find their separate effect
compared with the reference group unemployed in all the three regression models. From
table-7 we found, the occupations were not significant for the dependent variables monthly
MOHAMMAD MASTAK AL AMIN Page 38
income before migration except those who were student which was really surprising. And the
interesting thing was that all type of occupations: business, service, student, agriculture and
others have had negative effect for our first model where we considered the dependent
variable as monthly income before migration. But in our second model it was found that the
occupations business, student and others were significant except labourer. It showed that only
the businessmen have had positive effect on the monthly income after migration and the rest
had negative effect. The coefficent value for business was 0.497 which implied that 49.7%
businessman had more monthly income than the unemployed respondents and the coeffient
values for the others occupations student, labourer and others were -0.23, -0.076 and -0.495
respectively which implied that the respondents who involved in these occupations had 23%,
7.6% and 4.95% less income than the reference category respectively after their migration.
The third model where we considered the monthly change of income after migration as
dependent variable depicted that the categories business, student and others were highly
significant, among them businessman had positive effect whereas student and others had
negative effect. The coefficient values from the table-7 we found for business was 0.528
which depicted those respondents who involved in business had 52.8% more monthly change
of income than the reference category those who were unemployed after their movement to
Dhaka city while the student & others had 77.3% & 71.4% less monthly change of income. It
was found that the respondents who involved in non-agricultural occupation like business,
service, student, labourer and others had greater chance of migration compared with the
occupation agriculture. This may be because for the diminutive extent to get an occupation
into agricultural sector in the urban areas in Bangladesh.
We also considered the reasons behind migration as dummy variable where educational,
social, political, beneficial and climatic reasons were compared our reference category
occupational reasons due to migrate at Dhaka city. For our first model the respondents who
were migrated due to educational reasons had monthly income 64.1% more and those who
due to climatic reasons had 33.7% more than the reference category those who migrated due
to occupational reasons where we considered monthly income of the respondent before
migration as our dependent variable. In the second model those who migrated due to
educational reasons had 44% more and those who due to beneficial reasons had 22.2% more
monthly income after migration than the reference category who migrated due to occupational
reason. On the other hand those who migrated due to social, political and climatic reasons had
negative effects which implied that they had less monthly income after migration compared to
those respondents who migrated for occupational reasons and the amounts were 22.1%, 18%
and 22.9% respectively.
For our third model where we considered change of income after migration as our dependent
variable; among all respondents those who migrated due to educational reasons had 65.5%,
due to social reasons had 2.5%, due to political reasons had 0.3%, due to beneficial reasons
had 5.22% and due to climatic reasons had 5.33% more change of income than the reference
category who migrated due to occupational reasons.
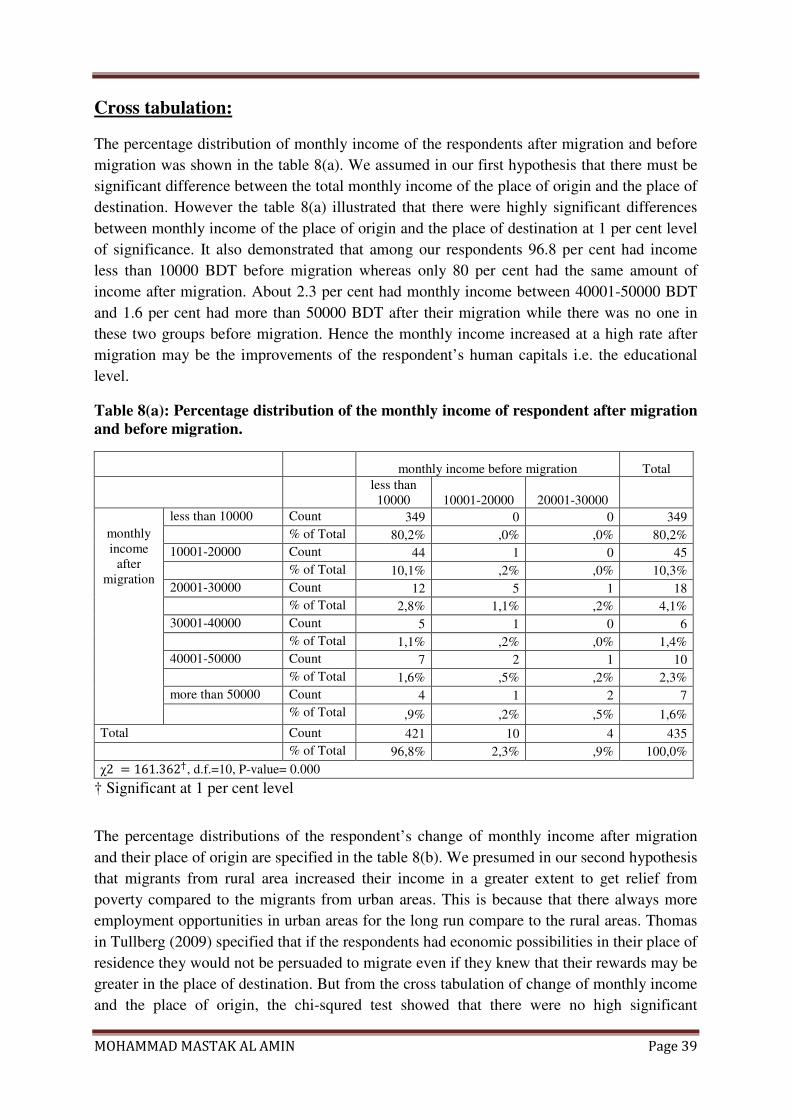
MOHAMMAD MASTAK AL AMIN Page 39
Cross tabulation:
The percentage distribution of monthly income of the respondents after migration and before
migration was shown in the table 8(a). We assumed in our first hypothesis that there must be
significant difference between the total monthly income of the place of origin and the place of
destination. However the table 8(a) illustrated that there were highly significant differences
between monthly income of the place of origin and the place of destination at 1 per cent level
of significance. It also demonstrated that among our respondents 96.8 per cent had income
less than 10000 BDT before migration whereas only 80 per cent had the same amount of
income after migration. About 2.3 per cent had monthly income between 40001-50000 BDT
and 1.6 per cent had more than 50000 BDT after their migration while there was no one in
these two groups before migration. Hence the monthly income increased at a high rate after
migration may be the improvements of the respondent’s human capitals i.e. the educational
level.
Table 8(a): Percentage distribution of the monthly income of respondent after migration
and before migration.
monthly income before migration Total
less than
10000 10001-20000 20001-30000
monthly
income
after
migration
less than 10000 Count 349 0 0 349
% of Total 80,2% ,0% ,0% 80,2%
10001-20000 Count 44 1 0 45
% of Total 10,1% ,2% ,0% 10,3%
20001-30000 Count 12 5 1 18
% of Total 2,8% 1,1% ,2% 4,1%
30001-40000 Count 5 1 0 6
% of Total 1,1% ,2% ,0% 1,4%
40001-50000 Count 7 2 1 10
% of Total 1,6% ,5% ,2% 2,3%
more than 50000 Count 4 1 2 7
% of Total ,9% ,2% ,5% 1,6%
Total Count 421 10 4 435
% of Total 96,8% 2,3% ,9% 100,0%
χ2 = 161.362�, d.f.=10, P-value= 0.000
† Significant at 1 per cent level
The percentage distributions of the respondent’s change of monthly income after migration
and their place of origin are specified in the table 8(b). We presumed in our second hypothesis
that migrants from rural area increased their income in a greater extent to get relief from
poverty compared to the migrants from urban areas. This is because that there always more
employment opportunities in urban areas for the long run compare to the rural areas. Thomas
in Tullberg (2009) specified that if the respondents had economic possibilities in their place of
residence they would not be persuaded to migrate even if they knew that their rewards may be
greater in the place of destination. But from the cross tabulation of change of monthly income
and the place of origin, the chi-squred test showed that there were no high significant
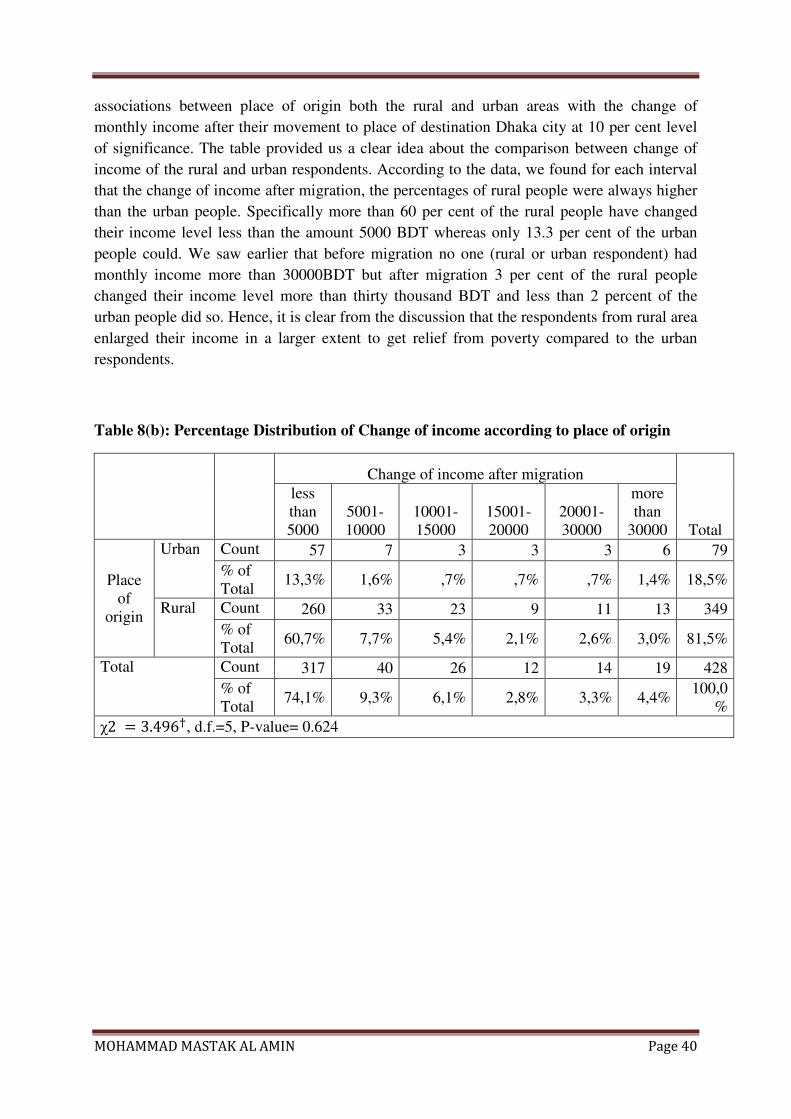
MOHAMMAD MASTAK AL AMIN Page 40
associations between place of origin both the rural and urban areas with the change of
monthly income after their movement to place of destination Dhaka city at 10 per cent level
of significance. The table provided us a clear idea about the comparison between change of
income of the rural and urban respondents. According to the data, we found for each interval
that the change of income after migration, the percentages of rural people were always higher
than the urban people. Specifically more than 60 per cent of the rural people have changed
their income level less than the amount 5000 BDT whereas only 13.3 per cent of the urban
people could. We saw earlier that before migration no one (rural or urban respondent) had
monthly income more than 30000BDT but after migration 3 per cent of the rural people
changed their income level more than thirty thousand BDT and less than 2 percent of the
urban people did so. Hence, it is clear from the discussion that the respondents from rural area
enlarged their income in a larger extent to get relief from poverty compared to the urban
respondents.
Table 8(b): Percentage Distribution of Change of income according to place of origin
Change of income after migration
Total
less
than
5000
5001-
10000
10001-
15000
15001-
20000
20001-
30000
more
than
30000
Place
of
origin
Urban Count 57 7 3 3 3 6 79
% of
Total 13,3% 1,6% ,7% ,7% ,7% 1,4% 18,5%
Rural Count 260 33 23 9 11 13 349
% of
Total 60,7% 7,7% 5,4% 2,1% 2,6% 3,0% 81,5%
Total Count 317 40 26 12 14 19 428
% of
Total 74,1% 9,3% 6,1% 2,8% 3,3% 4,4%
100,0
%
χ2 = 3.496�, d.f.=5, P-value= 0.624
MOHAMMAD MASTAK AL AMIN Page 41
5.2 Discussion:
We considered in our hypothesis that there must be a positive relationship between
respondent’s monthly income and monthly savings which illustrated that an increased in
income was increased their monthly savings to provide them more secured life. According to
the regression analysis the independent variable monthly savings of the respondents were
highly significant for all of our three models with dependent variables monthly income before
migration, monthly income after migration and change of monthly income after migration
respectively. We also considered the hypothesises that there must be significant relationship
between respondent’s change of monthly income after migration and the factors behind
towards Dhaka city, more specifically the occupational reasons, educational reasons and the
climatic reasons. According to my dataset we found that not all the categories of occupations
were significant for the model, therefore business, student and others were highly significant
for our model with dependent variable change of monthly income after migration which we
discussed before. We also found that the educational reasons, beneficial reasons and the
climatic reasons were highly significant for the model with dependent variable respondent’s
change of monthly income after migration which depicted from the table-7.
I discussed in the theoretical section that the main principles of neo classical theory is the
various wage levels between two geographical areas which bound to move from low wages
area to high wages area and this is due to demand & supply of labour in specific areas.
According to my study the people migrated from rural areas or small towns to Dhaka city
which is mega city and the capital of Bangladesh. Therfore it is obvious that the wage levels
were higher in Dhaka city than their place of origin and also there was high demand for labour
supply. According to the table 1 we found that 96.8 per cent of the respondent’s income was
less than 10000 BDT at the place of origin and the highest income was 30000 BDT. Only 2.3
per cent of the respondents had income between 20000-30000 BDT before their move. In
contrast, the percentages of the income increased after migration, about 10.3 per cent had
income between 10000-20000 BDT and 4 per cent had 20000-30000 BDT. The respondent
also had maximum income more than 50000 BDT and the percentage was 1.8 per cent of the
total respondents. Comparing these two scenarios of the monthly income it is clear that the
respondent’s had higher income in the place of destination which provides that the wage
levels were high at Dhaka city compared to the place of origin which shoved them to move at
Dhaka city.
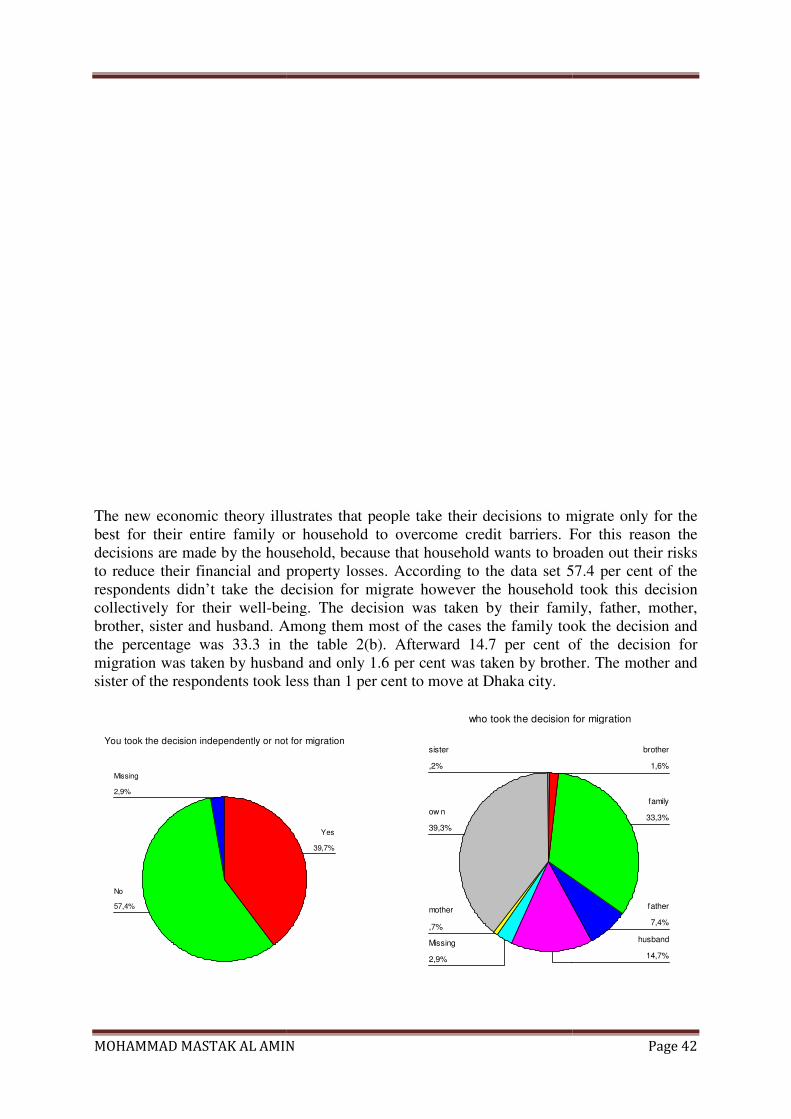
MOHAMMAD MASTAK AL AMIN
The new economic theory illustrates
best for their entire family or household to overcome credit barriers. For this reason the
decisions are made by the household, because that household wants to broaden out their risks
to reduce their financial and property losses. According to the data set 57.4 per cent of the
respondents didn’t take the decision for migrate however the household took this decision
collectively for their well-being. The decision was taken by their family, father, mot
brother, sister and husband. Among them most of the cases the family took the decision and
the percentage was 33.3 in the table 2(b)
migration was taken by husband and only 1.6 per cent was taken by brother
sister of the respondents took less than 1 per cent to move at Dhaka city.
You took the decision independently or not for migration
2,9%
57,4%
Missing
No
MOHAMMAD MASTAK AL AMIN
y illustrates that people take their decisions to migrate only for the
best for their entire family or household to overcome credit barriers. For this reason the
decisions are made by the household, because that household wants to broaden out their risks
r financial and property losses. According to the data set 57.4 per cent of the
respondents didn’t take the decision for migrate however the household took this decision
being. The decision was taken by their family, father, mot
brother, sister and husband. Among them most of the cases the family took the decision and
in the table 2(b). Afterward 14.7 per cent of the decision for
migration was taken by husband and only 1.6 per cent was taken by brother
sister of the respondents took less than 1 per cent to move at Dhaka city.
You took the decision independently or not for migration
39,7%
Yes
who took the decision for migration
,2%
39,3%
,7%
2,9%
sister
ow n
mother
Missing
Page 42
that people take their decisions to migrate only for the
best for their entire family or household to overcome credit barriers. For this reason the
decisions are made by the household, because that household wants to broaden out their risks
r financial and property losses. According to the data set 57.4 per cent of the
respondents didn’t take the decision for migrate however the household took this decision
being. The decision was taken by their family, father, mother,
brother, sister and husband. Among them most of the cases the family took the decision and
. Afterward 14.7 per cent of the decision for
migration was taken by husband and only 1.6 per cent was taken by brother. The mother and
who took the decision for migration
14,7%
7,4%
33,3%
1,6%
husband
father
family
brother
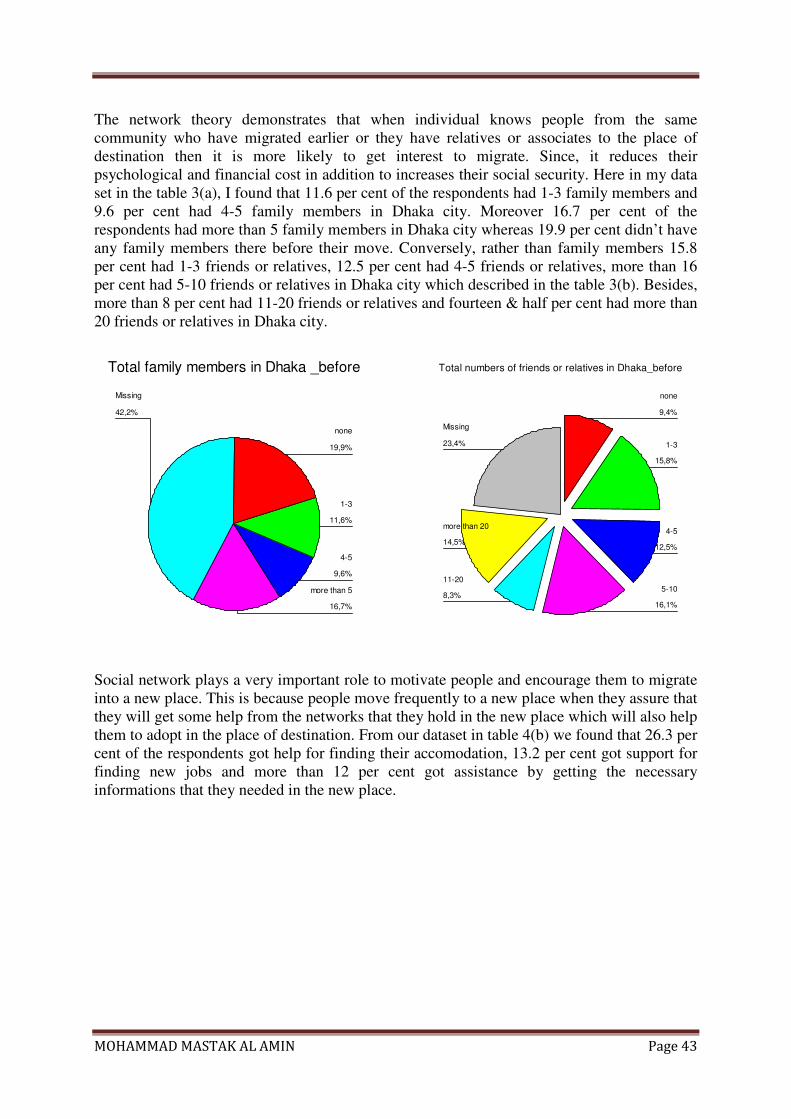
MOHAMMAD MASTAK AL AMIN Page 43
The network theory demonstrates that when individual knows people from the same
community who have migrated earlier or they have relatives or associates to the place of
destination then it is more likely to get interest to migrate. Since, it reduces their
psychological and financial cost in addition to increases their social security. Here in my data
set in the table 3(a), I found that 11.6 per cent of the respondents had 1-3 family members and
9.6 per cent had 4-5 family members in Dhaka city. Moreover 16.7 per cent of the
respondents had more than 5 family members in Dhaka city whereas 19.9 per cent didn’t have
any family members there before their move. Conversely, rather than family members 15.8
per cent had 1-3 friends or relatives, 12.5 per cent had 4-5 friends or relatives, more than 16
per cent had 5-10 friends or relatives in Dhaka city which described in the table 3(b). Besides,
more than 8 per cent had 11-20 friends or relatives and fourteen & half per cent had more than
20 friends or relatives in Dhaka city.
Total family members in Dhaka _before
42,2%
16,7%
9,6%
11,6%
19,9%
Missing
more than 5
4-5
1-3
none
Total numbers of friends or relatives in Dhaka_before
23,4%
14,5%
8,3%16,1%
12,5%
15,8%
9,4%
Missing
more than 20
11-205-10
4-5
1-3
none
Social network plays a very important role to motivate people and encourage them to migrate
into a new place. This is because people move frequently to a new place when they assure that
they will get some help from the networks that they hold in the new place which will also help
them to adopt in the place of destination. From our dataset in table 4(b) we found that 26.3 per
cent of the respondents got help for finding their accomodation, 13.2 per cent got support for
finding new jobs and more than 12 per cent got assistance by getting the necessary
informations that they needed in the new place.
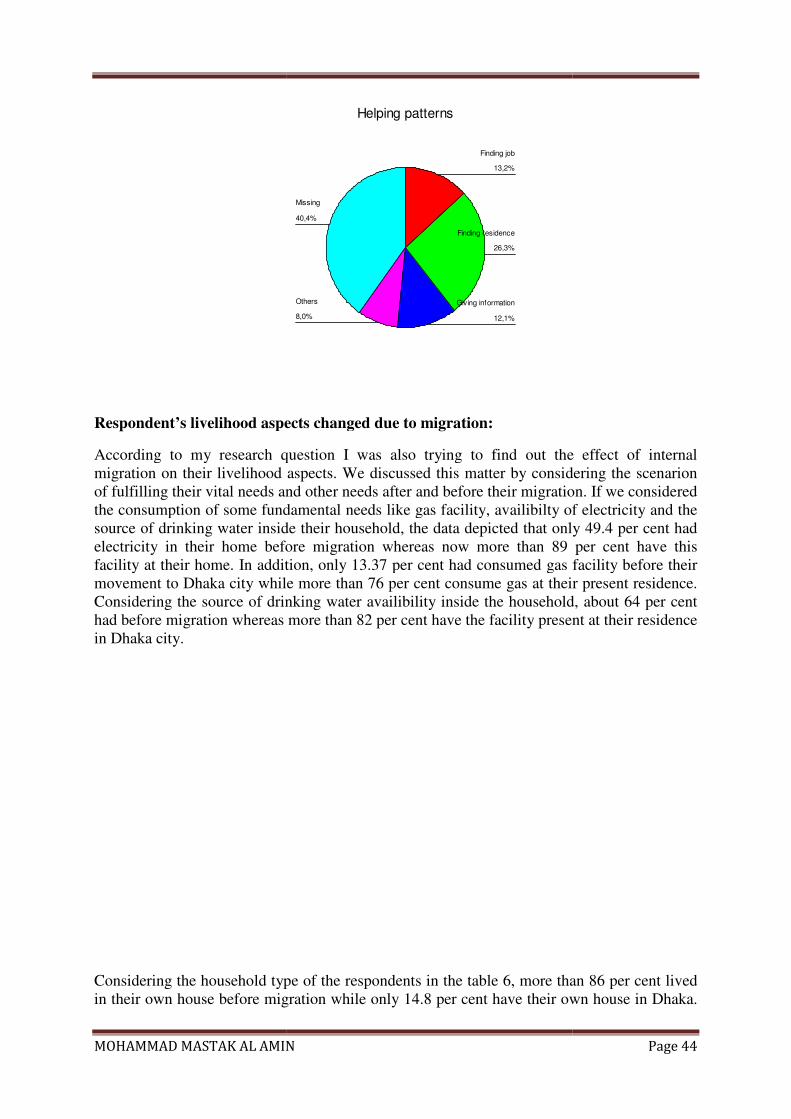
MOHAMMAD MASTAK AL AMIN
Respondent’s livelihood aspects changed due to
According to my research question I was
migration on their livelihood aspects. We
of fulfilling their vital needs and other needs after and before their migration. If we considered
the consumption of some fundamental needs like gas facility, availibilty of electricity and the
source of drinking water inside t
electricity in their home before migration whereas now more than 89 per cent have this
facility at their home. In addition, only 13.37 per cent had consumed gas facility before the
movement to Dhaka city while more than 76 per cent consume gas at their present residence.
Considering the source of drinking water availibility inside the household, about 64 per cent
had before migration whereas more than 82 per cent have the facility
in Dhaka city.
Considering the household type of the respondents
in their own house before migration while only 14.8 per cent have their own house in Dhaka.
MOHAMMAD MASTAK AL AMIN
Helping patterns
40,4%
8,0% 12,1%
26,3%
13,2%
Missing
Others Giving information
Finding residence
Finding job
livelihood aspects changed due to migration:
ing to my research question I was also trying to find out the effect of internal
heir livelihood aspects. We discussed this matter by considering the scenarion
of fulfilling their vital needs and other needs after and before their migration. If we considered
the consumption of some fundamental needs like gas facility, availibilty of electricity and the
water inside their household, the data depicted that only 49.4 per cent had
electricity in their home before migration whereas now more than 89 per cent have this
facility at their home. In addition, only 13.37 per cent had consumed gas facility before the
movement to Dhaka city while more than 76 per cent consume gas at their present residence.
Considering the source of drinking water availibility inside the household, about 64 per cent
had before migration whereas more than 82 per cent have the facility present at their residence
Considering the household type of the respondents in the table 6, more than 86 per cent lived
in their own house before migration while only 14.8 per cent have their own house in Dhaka.
Page 44
also trying to find out the effect of internal
this matter by considering the scenarion
of fulfilling their vital needs and other needs after and before their migration. If we considered
the consumption of some fundamental needs like gas facility, availibilty of electricity and the
that only 49.4 per cent had
electricity in their home before migration whereas now more than 89 per cent have this
facility at their home. In addition, only 13.37 per cent had consumed gas facility before their
movement to Dhaka city while more than 76 per cent consume gas at their present residence.
Considering the source of drinking water availibility inside the household, about 64 per cent
present at their residence
more than 86 per cent lived
in their own house before migration while only 14.8 per cent have their own house in Dhaka.
MOHAMMAD MASTAK AL AMIN
Most of the migrants lived in
migration the amount was only 10 per cent in the place of origin. About 4.7 per cent live
their relative’s house in Dhaka city and 2.8 per cent live
From our data we also compare
migration which showed that
per cent of the respondents had the household items whose value was
while more than 29 per cent had
BDT after their migration. In addition, more than 22 per cent have the values of 50001
100000 BDT household items after migration whereas only 11.16
moved towards Dhaka. Most of the respondents had consumed the household items whose
total value was less than 50000 BDT before
opposite after migration which depicted
was more than 50000 BDT.
A large amount of Bangladeshi people live under the poverty line. Most of them do not
consume meat in a week very often. So that we can use as an indicator of living standard of
our respondents is the consumption of meat in a week. The data showed that more than 8 per
cent of the respondents didn’t consume meat atleast one time in a week before their
while the percentage was less than 3 after their migration. More than 65 per cent consumed 1
3 times and 5.13 per cent consumed 4
moved to Dhaka the percentages we
MOHAMMAD MASTAK AL AMIN
in a rented house in Dhaka which was 77.9 per cent but before
migration the amount was only 10 per cent in the place of origin. About 4.7 per cent live
their relative’s house in Dhaka city and 2.8 per cent lived in other places.
compared the total value of their household items before and after
that the change of their standard of living. Before migration about 4
per cent of the respondents had the household items whose value was more than 100000 BDT
while more than 29 per cent had the household items whose value was more than 100000
BDT after their migration. In addition, more than 22 per cent have the values of 50001
100000 BDT household items after migration whereas only 11.16 percent had befor
moved towards Dhaka. Most of the respondents had consumed the household items whose
total value was less than 50000 BDT before their migration. The scenerion wa
migration which depicted that most of them consumed the items whose value
A large amount of Bangladeshi people live under the poverty line. Most of them do not
consume meat in a week very often. So that we can use as an indicator of living standard of
consumption of meat in a week. The data showed that more than 8 per
cent of the respondents didn’t consume meat atleast one time in a week before their
s less than 3 after their migration. More than 65 per cent consumed 1
3 times and 5.13 per cent consumed 4-7 times in a week before migration although after
moved to Dhaka the percentages were more than 69 per cent and 12.72 per cent respectively.
Page 45
s 77.9 per cent but before
migration the amount was only 10 per cent in the place of origin. About 4.7 per cent lived in
the total value of their household items before and after their
the change of their standard of living. Before migration about 4
more than 100000 BDT
s more than 100000
BDT after their migration. In addition, more than 22 per cent have the values of 50001-
percent had before their
moved towards Dhaka. Most of the respondents had consumed the household items whose
their migration. The scenerion was totally
d the items whose value
A large amount of Bangladeshi people live under the poverty line. Most of them do not
consume meat in a week very often. So that we can use as an indicator of living standard of
consumption of meat in a week. The data showed that more than 8 per
cent of the respondents didn’t consume meat atleast one time in a week before their migration
s less than 3 after their migration. More than 65 per cent consumed 1-
7 times in a week before migration although after
re more than 69 per cent and 12.72 per cent respectively.
MOHAMMAD MASTAK AL AMIN Page 46
6. Conclusion:
There are various economic theories that guided the discussion about the causes of internal
migration. Therefore it is very difficult to find out the reasons for internal migration. However
it is possible to comprehend the matter by applying different theories individually or together
that I discussed in my theoretical part which were neo classical theory, new economic theory
and network theory. These theories confer to a precise aspect of immigration and sometimes
they may complement each other. For example it is very difficult to apply the new economic
theory to mass immigration since an alternative for relative deprivation would be difficult to
attain as this theory put the spotlight on relative deprivation. This is rational because a huge
portion of the immigration decision is ascribed not only for the present financial safety but
also for the future welfare. Our dataset showed that more than 57% of the respondent’s
households took the decision for migration to broaden out the risks of financial and property
losses and that the decision was taken by their family, father, husband, mother, brother and
sister.
With the enlargement of urbanization and industrialization the immigration effectively took
place. There was always an unwavering internal migration stream that had an affirmative
impact on the urbinization. Bangladesh is a developing country where migrants go after some
specific reputable places because the opportunities are unduly distributed into some big cities
like Dhaka. The migrant’s characteristics i.e. age, marital status, years of schooling and their
occupation provide a better idea about the selectivity of migrants. According to our data,
more than 50% of the total respondents involved mostly in migration process were in the age
group 20-30 years. More than 63% were unmarried, this could be realted to the fact that the
highest proportion of the migrants were aged between 20-30 years or less than 20 years when
they migrated to Dhaka city. Only 18.8% completed their secondary and 26.9% completed
their higher secondary schooling before migration where 17.96% and 9.87% were completed
their graduation and post graduation respectively after their migration. Before migration
57.7% were unemployed while the percentage was only 38.4% after migration. Here I tried to
find out the main reasons behind migration. From the dataset I found that 69.2% were moved
to Dhaka for their occupational purpose among them 53% for finding jobs, 31.4% for better
income, 10.5% due to the transfer of their previous job and more than 15% moved for
educational matters.
It was found that among the respondents who completed their graduation before migration,
the main reason for moved towards Dhaka was for jobs. There were some respondents who
migrated because of some facilitative reasons i.e. health facilities, urban facilities, modern
facilities, communication facilities, better schooling facilities in Dhaka city. Among the total
respondents of our study less than two percent were forced to migrate because of climatic
reasons such as river erosion, land slide, cyclone, flood, drought.
My aim was also to examine their livelihood changes due to internal migration. Therefore I
compared some of the fundamental needs of migrants between their place of origin and the
place of residence. Only 49.4% had electricity before migrating where 89% have now at their
place of residence in Dhaka, about 13.37% consumed gas before migration while 76% have
MOHAMMAD MASTAK AL AMIN Page 47
gas facility in Dhaka and only 64% had sources of drinking water inside their place of origin
which is now 82% at their present residence. Hence the study showed that the fundamental
needs of respondents were fulfilled at a high rate after their migration which depicts that their
living standard went up due to migration. If we considered their total values of household
items, only 4% had the value of household items more than 100000 BDT whereas about 29%
have the same value of household items now at their present residence. Before migration only
5.13% consumed meat 4-7 times in a week while the percentage was more than 12% after
migration. All of these values indicated that the living standard of the migrants went up due to
migration for some extent.
This study may help the policy makers and the social scientists for employing and expanding
different programs for rural development though in this study I tried to find out the
characteritics of the respondents, who were mostly involved in migration process, the main
factors behind this internal migration at individual and household level. Moreover, I also tried
to make an overview of their livelihood changes due to internal migration effects which can
help for proper urban planning although my study also explained the intentions and directions
about the migration process.
References:
1. Afsar, R. (1999) “Is migration transferring rural poverty to urban areas? An analysis
of longitudinal survey data of Dhaka city”, Paper presented at the workshop Changes
and Determinants of urban poverty: Dhaka, Grameen Trust, Grameen Bank,
Bangladesh.
2. Afsar, R. (2000) “Rural-Urban Migration in Bangladesh: Causes, Consequences and
Challenges”, University Press Ltd., Dhaka.
3. Afsar, R. (2002) “Migration and Rural Livelihoods”, In K. Toufique and C. Turton
(eds.), Hands Not Land: How Livelihoods are Changing in Rural Bangladesh,
Bangladesh Institute of Development Studies, Dhaka: 89-96.
4. Afsar, R. (2003) “Internal migration and the development nexus: The case of
Bangladesh”, paper presented at the regional Conference on Migration, Development
and Pro-Poor Policy Choices in Asia, Dhaka, 22-24 June.
5. Afsar, R. and Baker, J. (1999) “Interaction between Rural Areas and Rural Towns”,
Agderforskning, Agder Research Foundation, Kristiansan, Norway, mimeo.
6. Akar, H. (2010) “Challenges for schools in communities with internal migration
flows: evidence from Turkey”, International Journal of Educational Development,
30:263-276.
7. Anh, D.N. (2003) “Migration and poverty in Asia: with reference to Bangladesh,
China, the Philippines and Vietnam”, Ad hoc expert group meeting on Migration and
MOHAMMAD MASTAK AL AMIN Page 48
Development, organized by the Economic and Social Commission for Asia and the
Pacific, Bangkok, 27-29 August.
8. Bangladesh Bureau of Statistics (BBS) (2003), Bangladesh Population Census 2001,
Demography, 27(4): 601-605.
9. Bangladesh Urban Health Survey (2006), National Institute of Population Research
and Training (NIPORT), MEASURE evaluation, ICDDR, B: Knowledge for Global
Lifesaving Solutions, Associates for Community and Population Research (ACPR).
10. Barbieri, F. A. (2007) “Towns in the jungle: exploring linkages between rural-urban
mobility, urbanization and development in the Amazon”, Paper presented to the
PRIPODE workshop on Urban Population, Development and Environment Dynamics
in Developing Countries, Nairobi, Kenya.
11. Blackburn, L.M. (2010) “Internal migration and the earnings of married couples in the
United States”, Journal of Economic Geography, 10: 87-111.
12. Bloom, D.E. and Stark, O. (1985) “The New Economics of Labor Migartion”,
American Economic Review, 75(2): 173-178.
13. Borjas, G.J. (1989) “Economic Theory and International Migartion”, International
Migration Review, 23(3): 457-485.
14. Castles, S. and Mark, J. M. (1998) “The Age of Migration: International Population
Movements in the Modern World”, Guilford Publications Palgrave.
15. Chaudhury, H.R. and Curlin, C.G. (1975) “Dynamics of Migration in a Rural Area of
Bangladesh”, Bangladesh Development Studies, 3: 181-230.
16. ESCAP (1993) “State of Urbanization in Asia and the Pacific”, United Nations:
Bangkok.
17. Finan, T. (2004) “The dynamics of debt in southeast Bangladesh”, CARE
Bangladesh, Dhaka, mimeo.
18. Gurmu, E., Goldstein, S. and Goldstein, A. (2000). “Migration, Gender and Health
Survey in Five Regions of Ethiopia: 1998. (A United Nation Training and Research
Project on the Interrelations of Migration and Economic Change, Women’s Status,
Reproduction and Health) ”, Addis Ababa: Addis Ababa University and Province:
Brown University.
19. Harris, J. R. and Todaro M.P. (1970) “Migration, Unemployment and Development: A
Two-Sector Analysis”, American Economic Review, 60(1): 126-142.
20. Hedberg, C. & Kepsu, K. (2008) “Identity in motion: The process of Finland-Swedish
migration to Sweden”, National Identities, 10(1): 95-118.
21. Hill, C. R.; Griffiths, E. W. and Lim, C. G (2008) “Principles of Econometrics”, John
Miley & Sons, Inc., USA.
22. Hossain, M. Z. (2001) "Rural-Urban Migration in Bangladesh: A Micro-Level Study",
Paper presented at the International Union for the Scientific Study of Population
(USSP), General Conference, Salvador, August 20-24.
MOHAMMAD MASTAK AL AMIN Page 49
23. Hossain, M. I.; Khan, I. A. and Seeley, J. (2003) “Surviving on their Feet: Charting
the Mobile Livelihoods of the Poor in Rural Bangladesh”, Paper prepared for the
conference, Staying Poor: Chronic Poverty and Development Policy, University of
Manchester, April.
24. Hossain, Z.M. and Yadava, S.N.K (2001) “Population Diversity and Rural Out-
Migration: Testing the Lee Theory in the context of Bangladesh”, JOURNAL OF
POPULATION AND SOCIAL STUDIES, 10(1).
25. Hugo, G.J. (1992) “Migration and Rural-Urban Linkages in the ESCAP Region”,
Paper presented for the pre-conference seminar of the Fourth Population Conference
on Migration and Urbanization: Inter-Relationship with socio-economic Development
and Evaluating Policy Issues, Seoul, Republic of Korea.
26. Islam, A. (2008) “Acculturation Preferences among Bangladeshi Immigrants in
London and Malmoe”, Siirtolaisuusinstituutti, Web Reports 37.
27. Islam, N.M (2002) “An Introduction to Statistics and Probability”, BOOK WORLD,
Dhaka, Bangladesh.
28. Kuhn and Randall, S. (2000) “The Logic of Letting Go: Family and Individual
Migration from Rural Bangladesh”, Labor and Population Working Papers, RAND
Corporation, California.
29. Lee, E. S. (1966) “A Theory of Migration”, Demography, 3(1): 47-57.
30. Long, H.; Wu, X.; Wang, W. and Dong, G. (2008) “Analysis of Urban-Rural Land-
Use Change during 1995-2006 and Its Policy Dimensional Driving Forces in
Chongqing, China”, Sensors, 8:681-699.
31. Massey, S.D; Hugo, G; Kouaouci, A; Pellegrino, A. and Taylor, E.J. (1993) “Theories
of International Migration: A Review and Appraisal,” Population and Development
Review, 19(3): 431-466.
32. Mberu, U. B. (2006) “Internal migration and household living conditions in
Ethiopia”, Demographic Research, 14(21): 509-540.
33. Montgomery, M.; Gragnolati, M.; Burke, A.K. and Paredes, E. (2000) “Measuring
Living Standards with Proxy Variables”, Demography, 37(2): 155-174.
34. Montgomery, C.D. & Peck, A.E. (1992) “Introduction to Linear Regression
Analysis”, John Miley & Sons, Inc., USA.
35. Majumder, P. P.; Mahmud, S. and Afsar, R. (1996) “Squatters of Dhaka: Dynamism
in the Life of Agargoan Squatters”, University Press Limited, Dhaka.
36. Mazumdar, D. (1987) “Rural-Urban Migration in Developing Countries: In
Handbook of Regional and Urban Economics”, E.S. Mills (ed.), Elsevier, USA.
37. Nabi, A.K.M N (1992)”Dynamics of Internal Migration in Bangladesh”, Canadian
Studies in Population, 19(1): 81-98.
38. Oberai, A.S. (1987) “Migration, Urbanization and Development”, Geneva:
International Labor Office.
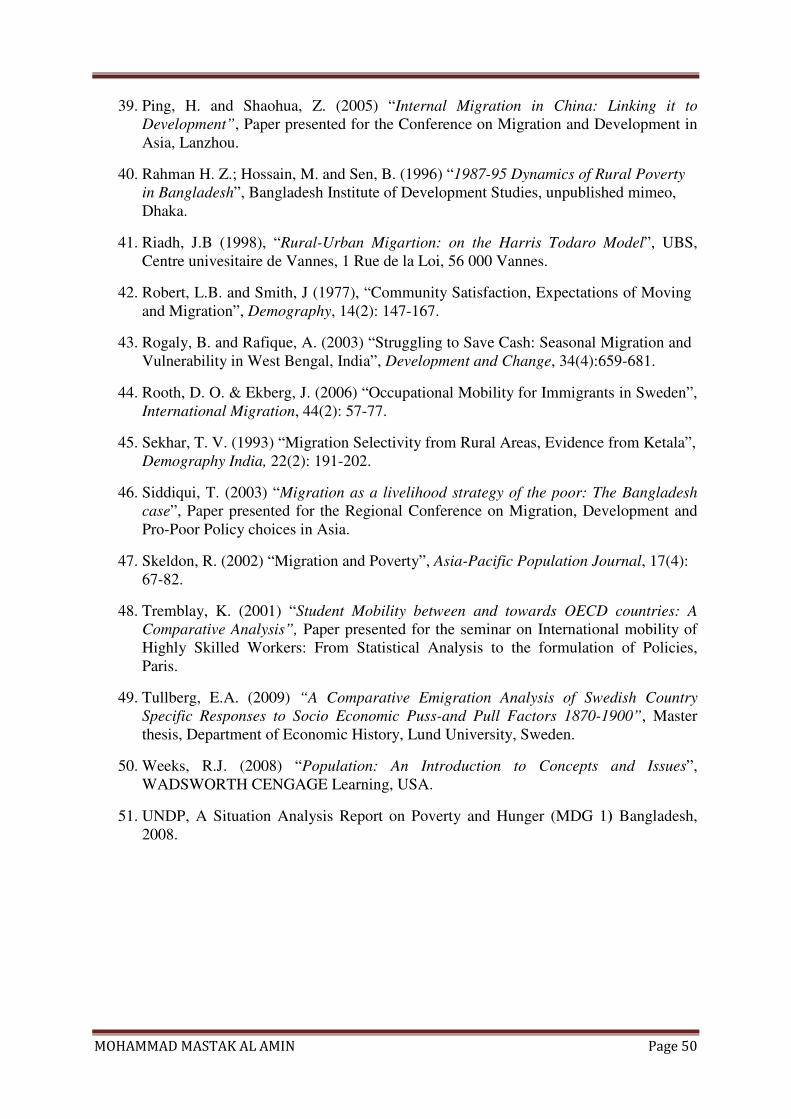
MOHAMMAD MASTAK AL AMIN Page 50
39. Ping, H. and Shaohua, Z. (2005) “Internal Migration in China: Linking it to
Development”, Paper presented for the Conference on Migration and Development in
Asia, Lanzhou.
40. Rahman H. Z.; Hossain, M. and Sen, B. (1996) “1987-95 Dynamics of Rural Poverty
in Bangladesh”, Bangladesh Institute of Development Studies, unpublished mimeo,
Dhaka.
41. Riadh, J.B (1998), “Rural-Urban Migartion: on the Harris Todaro Model”, UBS,
Centre univesitaire de Vannes, 1 Rue de la Loi, 56 000 Vannes.
42. Robert, L.B. and Smith, J (1977), “Community Satisfaction, Expectations of Moving
and Migration”, Demography, 14(2): 147-167.
43. Rogaly, B. and Rafique, A. (2003) “Struggling to Save Cash: Seasonal Migration and
Vulnerability in West Bengal, India”, Development and Change, 34(4):659-681.
44. Rooth, D. O. & Ekberg, J. (2006) “Occupational Mobility for Immigrants in Sweden”,
International Migration, 44(2): 57-77.
45. Sekhar, T. V. (1993) “Migration Selectivity from Rural Areas, Evidence from Ketala”,
Demography India, 22(2): 191-202.
46. Siddiqui, T. (2003) “Migration as a livelihood strategy of the poor: The Bangladesh
case”, Paper presented for the Regional Conference on Migration, Development and
Pro-Poor Policy choices in Asia.
47. Skeldon, R. (2002) “Migration and Poverty”, Asia-Pacific Population Journal, 17(4):
67-82.
48. Tremblay, K. (2001) “Student Mobility between and towards OECD countries: A
Comparative Analysis”, Paper presented for the seminar on International mobility of
Highly Skilled Workers: From Statistical Analysis to the formulation of Policies,
Paris.
49. Tullberg, E.A. (2009) “A Comparative Emigration Analysis of Swedish Country
Specific Responses to Socio Economic Puss-and Pull Factors 1870-1900”, Master
thesis, Department of Economic History, Lund University, Sweden.
50. Weeks, R.J. (2008) “Population: An Introduction to Concepts and Issues”,
WADSWORTH CENGAGE Learning, USA.
51. UNDP, A Situation Analysis Report on Poverty and Hunger (MDG 1) Bangladesh,
2008.
MOHAMMAD MASTAK AL AMIN Page 51
Appendix:
Table: 1
Monthly income_before Monthly income_after
Frequency Percent
Valid
Percent Frequency Percent Valid Percent
less than
10000 424 94,6 96,8 357 79,7 80,2
10001-20000 10 2,2 2,3 46 10,3 10,3
20001-30000 4 ,9 ,9 18 4,0 4,0
30001-40000 0 0 0 6 1,3 1,3
40001-50000 0 0 0 10 2,2 2,2
more than
50000 0 0 0 8 1,8 1,8
Total 438 97,8 100,0 445 99,3 100,0
Missing 10 2,2 3 ,7
448 100,0 448 100,0
Table: 2(a)
You took the decision independently or not for migration
Frequency Percent Valid Percent
Yes 178 39,7 40,9
No 257 57,4 59,1
Total 435 97,1 100,0
Missing 13 2,9
448 100,0
Table: 2(b)
Who took the decision for migration.
Frequency Percent Valid Percent
Brother 7 1,6 1,6
Family 149 33,3 33,3
Father 33 7,4 7,4
Husband 66 14,7 14,7
Missing 13 2,9 2,9
Mother 3 ,7 ,7
Own 176 39,3 39,3
Sister 1 ,2 ,2
Total 448 100,0 100,0
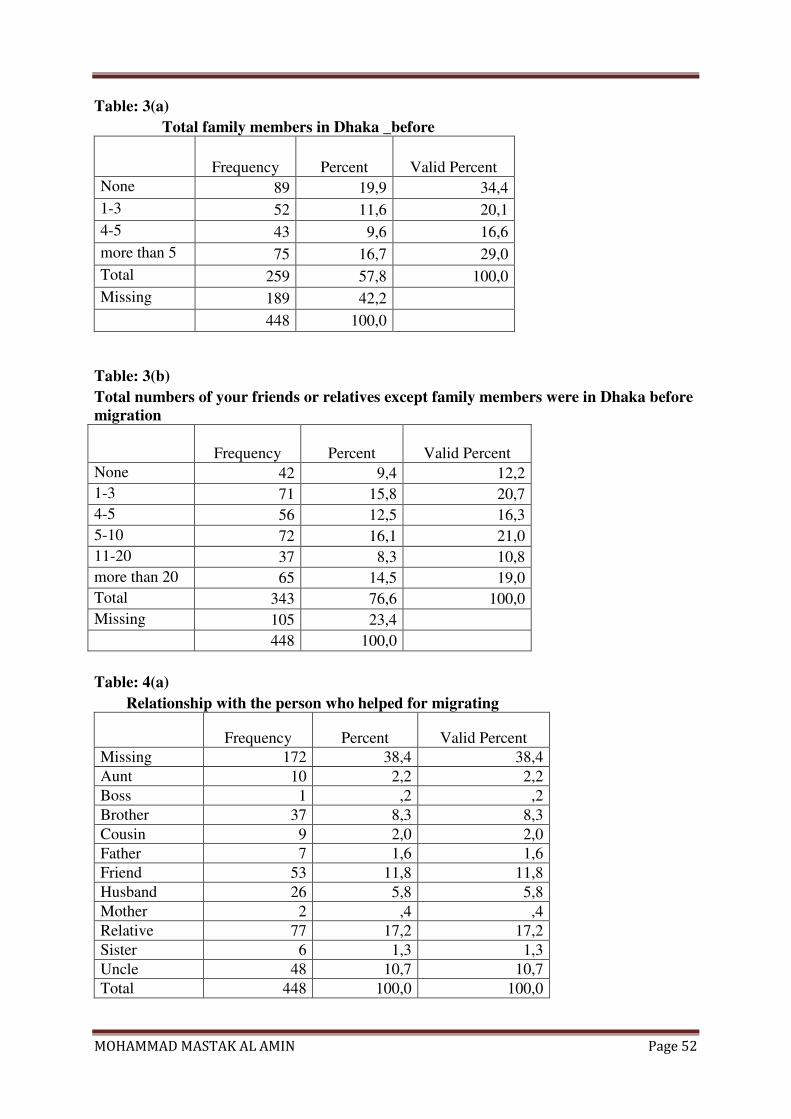
MOHAMMAD MASTAK AL AMIN Page 52
Table: 3(a)
Total family members in Dhaka _before
Frequency Percent Valid Percent
None 89 19,9 34,4
1-3 52 11,6 20,1
4-5 43 9,6 16,6
more than 5 75 16,7 29,0
Total 259 57,8 100,0
Missing 189 42,2
448 100,0
Table: 3(b)
Total numbers of your friends or relatives except family members were in Dhaka before
migration
Frequency Percent Valid Percent
None 42 9,4 12,2
1-3 71 15,8 20,7
4-5 56 12,5 16,3
5-10 72 16,1 21,0
11-20 37 8,3 10,8
more than 20 65 14,5 19,0
Total 343 76,6 100,0
Missing 105 23,4
448 100,0
Table: 4(a)
Relationship with the person who helped for migrating
Frequency Percent Valid Percent
Missing 172 38,4 38,4
Aunt 10 2,2 2,2
Boss 1 ,2 ,2
Brother 37 8,3 8,3
Cousin 9 2,0 2,0
Father 7 1,6 1,6
Friend 53 11,8 11,8
Husband 26 5,8 5,8
Mother 2 ,4 ,4
Relative 77 17,2 17,2
Sister 6 1,3 1,3
Uncle 48 10,7 10,7
Total 448 100,0 100,0
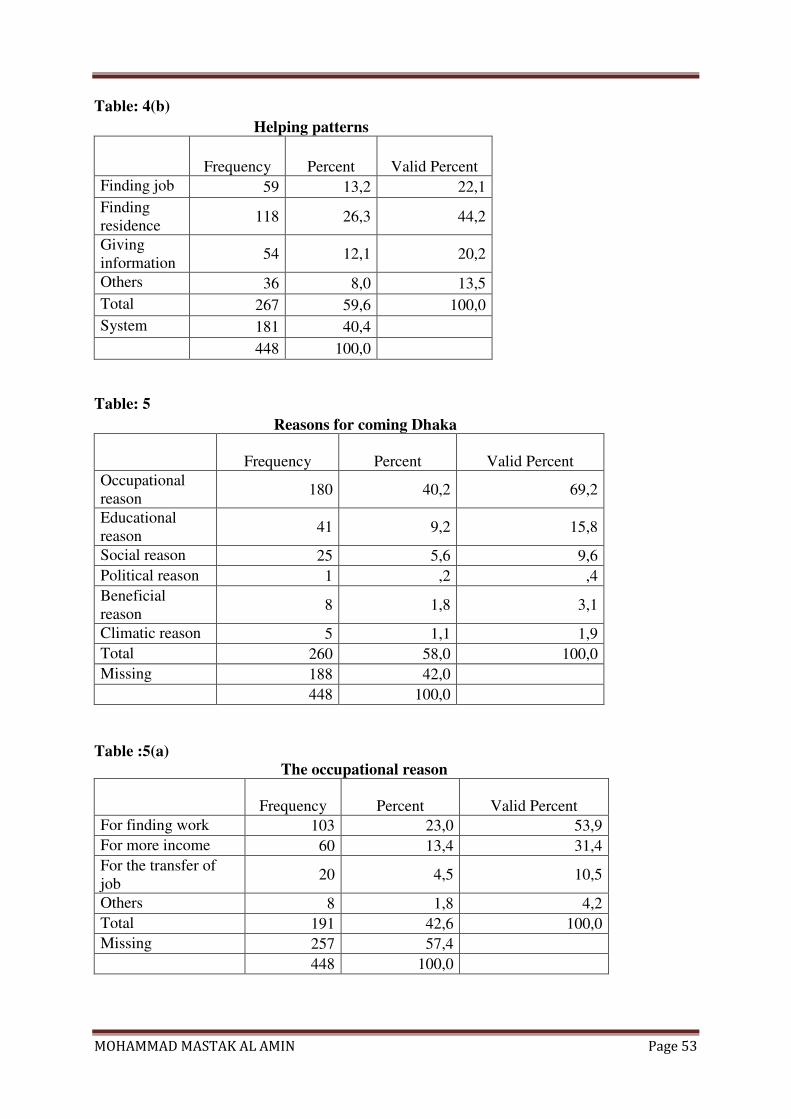
MOHAMMAD MASTAK AL AMIN Page 53
Table: 4(b)
Helping patterns
Frequency Percent Valid Percent
Finding job 59 13,2 22,1
Finding
residence 118 26,3 44,2
Giving
information 54 12,1 20,2
Others 36 8,0 13,5
Total 267 59,6 100,0
System 181 40,4
448 100,0
Table: 5
Reasons for coming Dhaka
Frequency Percent Valid Percent
Occupational
reason 180 40,2 69,2
Educational
reason 41 9,2 15,8
Social reason 25 5,6 9,6
Political reason 1 ,2 ,4
Beneficial
reason 8 1,8 3,1
Climatic reason 5 1,1 1,9
Total 260 58,0 100,0
Missing 188 42,0
448 100,0
Table :5(a)
The occupational reason
Frequency Percent Valid Percent
For finding work 103 23,0 53,9
For more income 60 13,4 31,4
For the transfer of
job 20 4,5 10,5
Others 8 1,8 4,2
Total 191 42,6 100,0
Missing 257 57,4
448 100,0
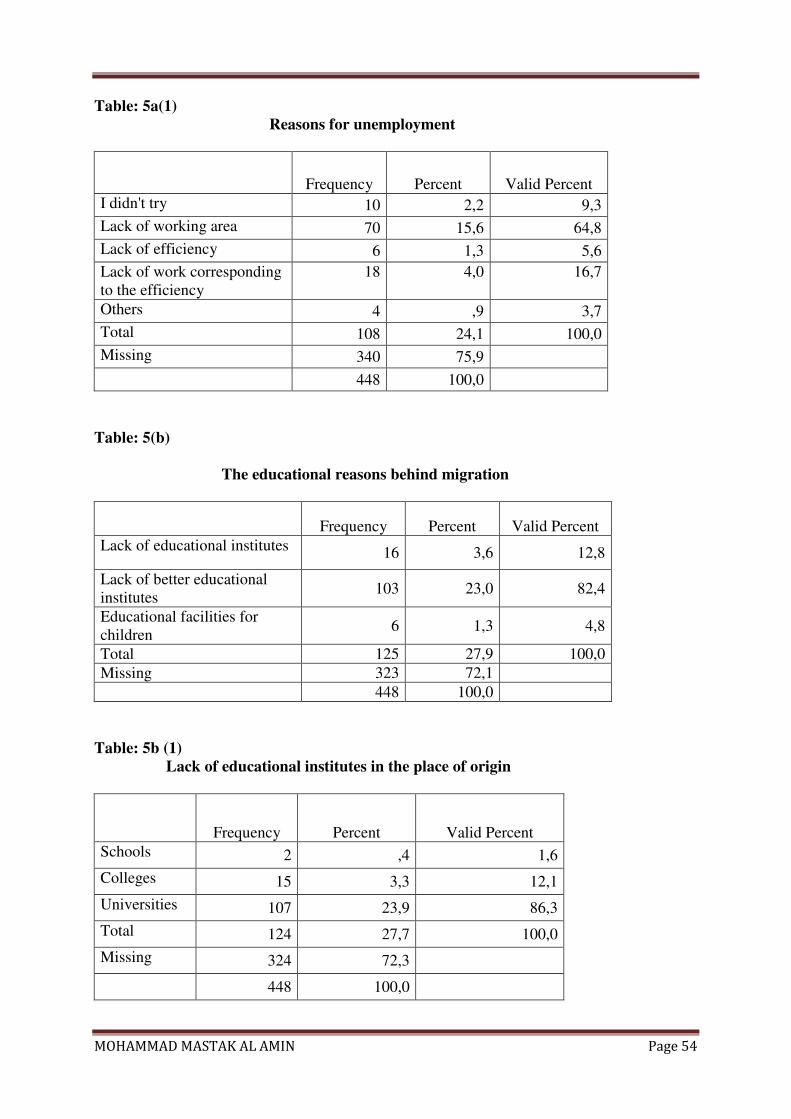
MOHAMMAD MASTAK AL AMIN Page 54
Table: 5a(1)
Reasons for unemployment
Frequency Percent Valid Percent
I didn't try 10 2,2 9,3
Lack of working area 70 15,6 64,8
Lack of efficiency 6 1,3 5,6
Lack of work corresponding
to the efficiency
18 4,0 16,7
Others 4 ,9 3,7
Total 108 24,1 100,0
Missing 340 75,9
448 100,0
Table: 5(b)
The educational reasons behind migration
Frequency Percent Valid Percent
Lack of educational institutes 16 3,6 12,8
Lack of better educational
institutes 103 23,0 82,4
Educational facilities for
children 6 1,3 4,8
Total 125 27,9 100,0
Missing 323 72,1
448 100,0
Table: 5b (1)
Lack of educational institutes in the place of origin
Frequency Percent Valid Percent
Schools 2 ,4 1,6
Colleges 15 3,3 12,1
Universities 107 23,9 86,3
Total 124 27,7 100,0
Missing 324 72,3
448 100,0
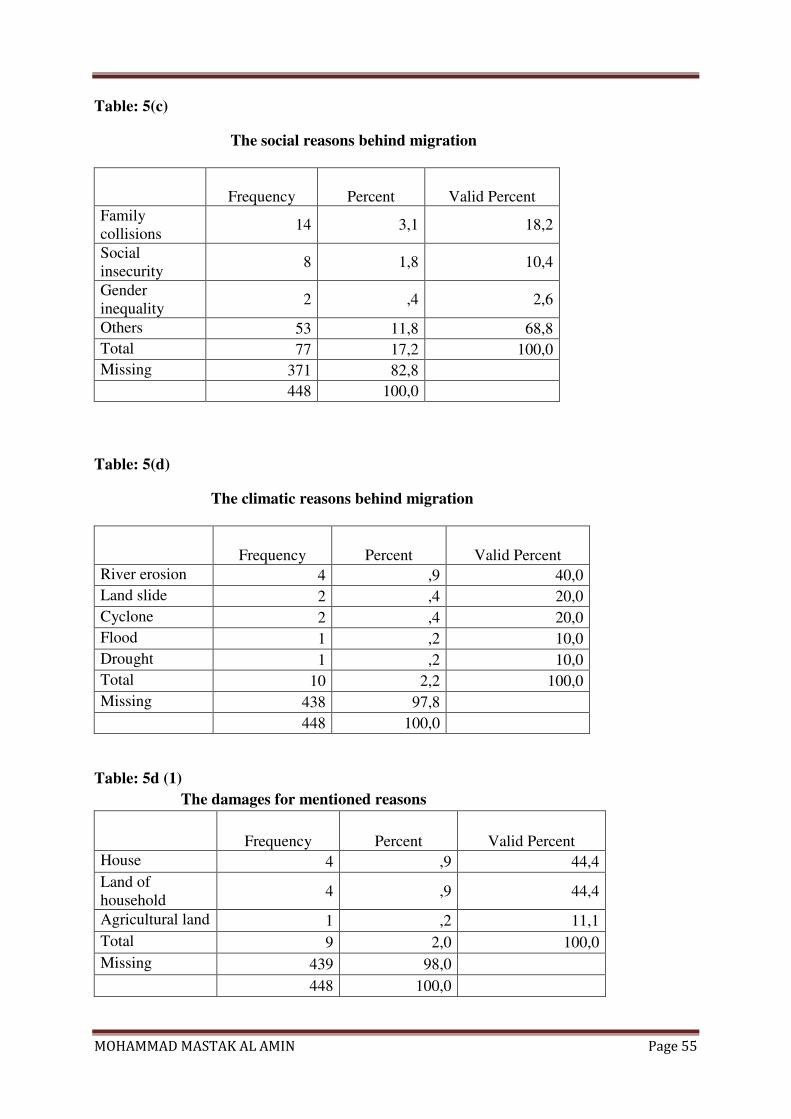
MOHAMMAD MASTAK AL AMIN Page 55
Table: 5(c)
The social reasons behind migration
Frequency Percent Valid Percent
Family
collisions 14 3,1 18,2
Social
insecurity 8 1,8 10,4
Gender
inequality 2 ,4 2,6
Others 53 11,8 68,8
Total 77 17,2 100,0
Missing 371 82,8
448 100,0
Table: 5(d)
The climatic reasons behind migration
Frequency Percent Valid Percent
River erosion 4 ,9 40,0
Land slide 2 ,4 20,0
Cyclone 2 ,4 20,0
Flood 1 ,2 10,0
Drought 1 ,2 10,0
Total 10 2,2 100,0
Missing 438 97,8
448 100,0
Table: 5d (1)
The damages for mentioned reasons
Frequency Percent Valid Percent
House 4 ,9 44,4
Land of
household 4 ,9 44,4
Agricultural land 1 ,2 11,1
Total 9 2,0 100,0
Missing 439 98,0
448 100,0
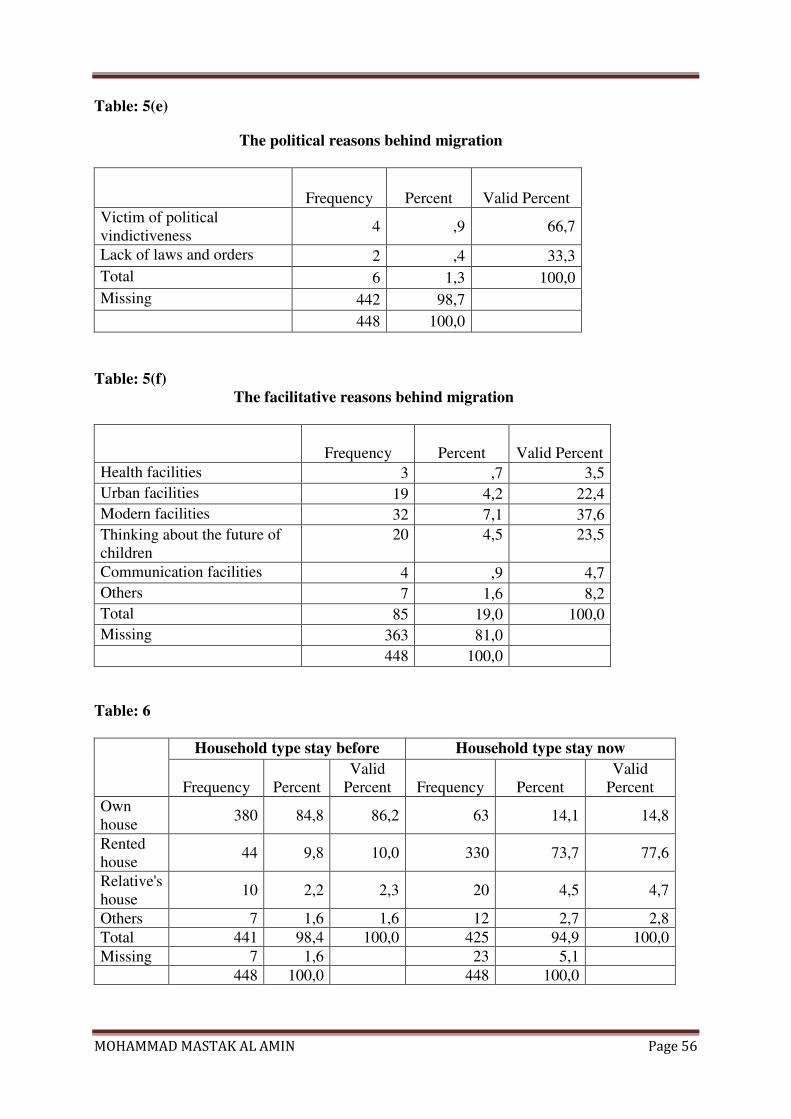
MOHAMMAD MASTAK AL AMIN Page 56
Table: 5(e)
The political reasons behind migration
Frequency Percent Valid Percent
Victim of political
vindictiveness 4 ,9 66,7
Lack of laws and orders 2 ,4 33,3
Total 6 1,3 100,0
Missing 442 98,7
448 100,0
Table: 5(f)
The facilitative reasons behind migration
Frequency Percent Valid Percent
Health facilities 3 ,7 3,5
Urban facilities 19 4,2 22,4
Modern facilities 32 7,1 37,6
Thinking about the future of
children
20 4,5 23,5
Communication facilities 4 ,9 4,7
Others 7 1,6 8,2
Total 85 19,0 100,0
Missing 363 81,0
448 100,0
Table: 6
Household type stay before Household type stay now
Frequency Percent
Valid
Percent Frequency Percent
Valid
Percent
Own
house 380 84,8 86,2 63 14,1 14,8
Rented
house 44 9,8 10,0 330 73,7 77,6
Relative's
house 10 2,2 2,3 20 4,5 4,7
Others 7 1,6 1,6 12 2,7 2,8
Total 441 98,4 100,0 425 94,9 100,0
Missing 7 1,6 23 5,1
448 100,0 448 100,0