Embed Size (px)
Citation preview
Suzane S. de Sá, Brett B. Palm, Pedro Campuzano-Jost, Douglas A. Day, Weiwei Hu, Gabriel Isaacman-VanWertz, Lindsay Yee, Joel
Brito, Samara Carbone, Matt K. Newburn, Ryan Thalman, Jian Wang, John Shilling, Allen Goldstein, Paulo Artaxo, Rodrigo Souza,
Antonio Manzi, M. Lizabeth Alexander, Jose L. Jimenez ,
Scot T. Martin
ACRIDICON-CHUVA Workshop, Ilha Bela, 2016
Factors controlling the production of secondary organic material from
isoprene epoxydiols (IEPOX) in the Amazonian wet season
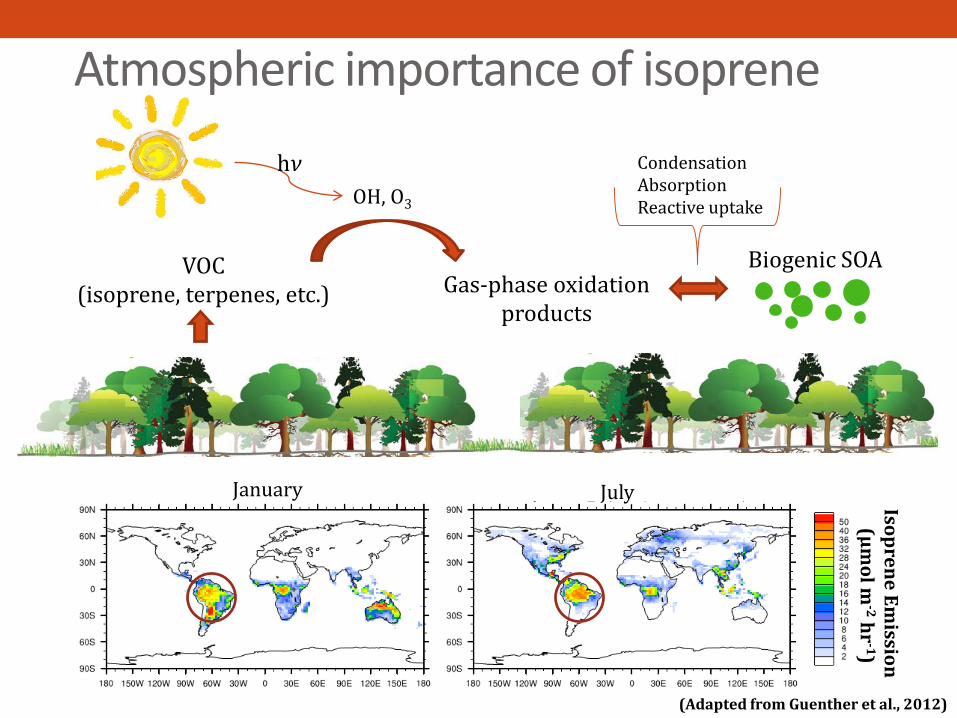
(Adapted from Guenther et al., 2012)
January July Isop
ren
e E
missio
n
(μm
ol
m-2
hr
-1)
VOC(isoprene, terpenes, etc.)
OH, O3
hν
Gas-phase oxidation products
Biogenic SOA
Atmospheric importance of isoprene
CondensationAbsorptionReactive uptake
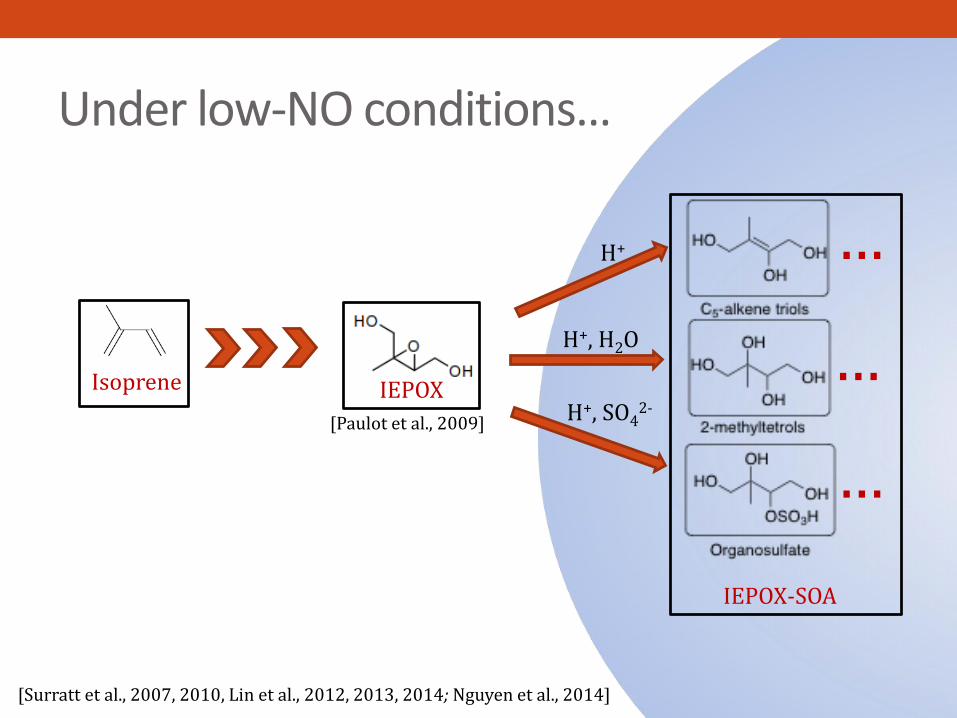
Isoprene
[Paulot et al., 2009]
IEPOX
Under low-NO conditions…
IEPOX-SOA
…
…
…
H+
H+, H2O
H+, SO42-
[Surratt et al., 2007, 2010, Lin et al., 2012, 2013, 2014; Nguyen et al., 2014]

Atmospheric importance of IEPOX-SOAIEPOX-SOA = SOA derived from isoprene epoxydiols (IEPOX)
[Hu et al., 2015]
IEPOX-SOA factor = statistical factor estimated from positive matrix factorization (PMF) of AMS organic mass spectra

In the Amazon forest…
Sources of NO : Soils [Bakwin et al., 1990]
Sources of sulfate: In-basin: DMS/H2S Atlantic ocean African biomass burning [Andreae et al., 1990; Chen et al., 2009]
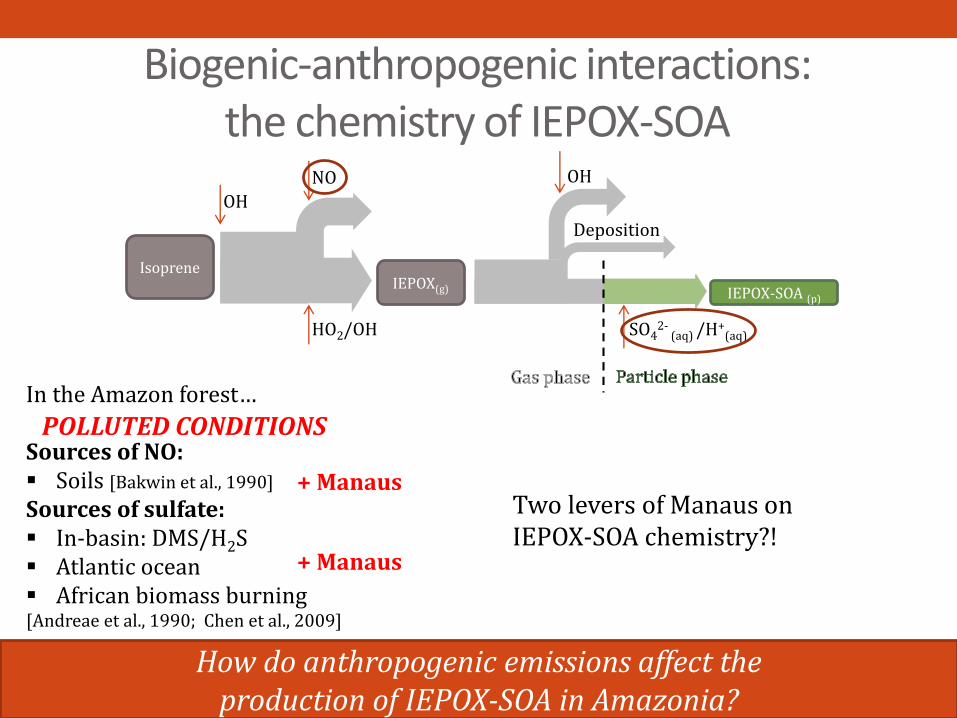
Biogenic-anthropogenic interactions: the chemistry of IEPOX-SOA
IsopreneIEPOX(g)
OH
NO
HO2/OH
Deposition
SO42-
(aq) /H+(aq)
IEPOX-SOA (p)
OH
BACKGROUND CONDITIONS
+ Manaus
+ Manaus
Biogenic-anthropogenic interactions: the chemistry of IEPOX-SOA
Two levers of Manaus on IEPOX-SOA chemistry?!
IsopreneIEPOX(g)
OH
NO
HO2/OH
Deposition
SO42-
(aq) /H+(aq)
IEPOX-SOA (p)
OH
How do anthropogenic emissions affect the production of IEPOX-SOA in Amazonia?
In the Amazon forest…
Sources of NO: Soils [Bakwin et al., 1990]
Sources of sulfate: In-basin: DMS/H2S Atlantic ocean African biomass burning [Andreae et al., 1990; Chen et al., 2009]
POLLUTED CONDITIONS
+ Manaus
+ Manaus

Motivating questions
1. Is sulfate mass concentration a good predictor for IEPOX-SOA factor loadings in the Amazon?
2. Can a role of NO on IEPOX-SOA factor loadings be quantified through the use of NOy as an indicator of integrated exposure of airmass to NO?
3. What is the effect of urban pollution (sulfate + NO) on the loading of IEPOX-SOA factor in the Amazon basin?
(NOy = NO + NO2 + reservoir species)

GoAmazon2014/5 Experiment
Wind speed (m s-1
)
0 - 0.5 0.5 - 2 2 - 4 4 - 6 6+
G1
Focus:IOP1 (wet season): Feb 1 – Mar 31 2014Afternoon data (12:00 – 16:00 local time)
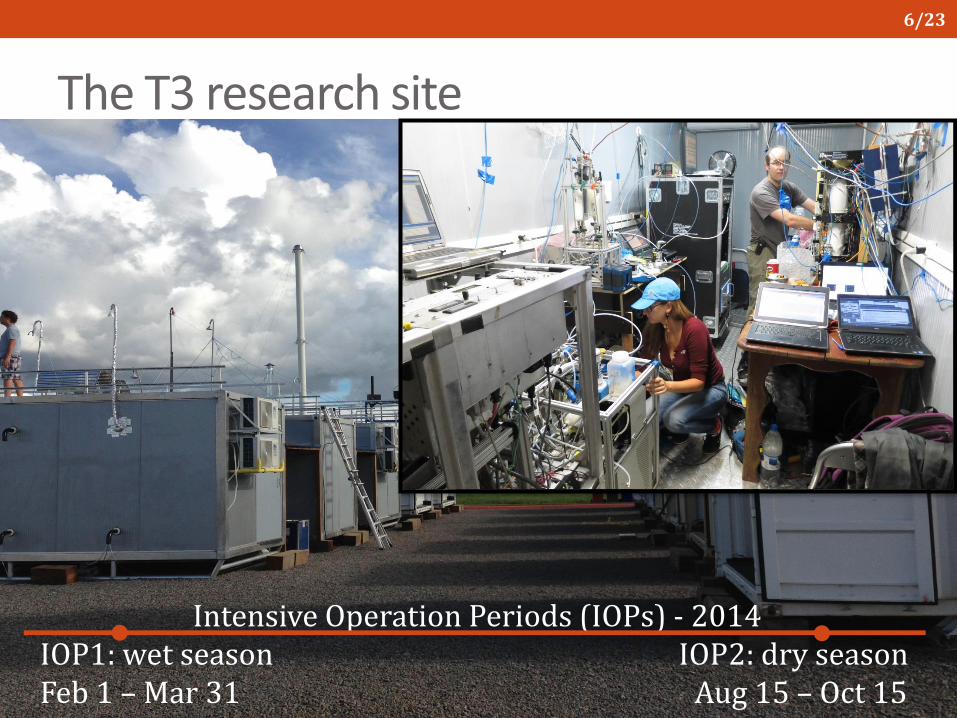
The T3 research site
Intensive Operation Periods (IOPs) - 2014IOP1: wet season IOP2: dry seasonFeb 1 – Mar 31 Aug 15 – Oct 15
6/23
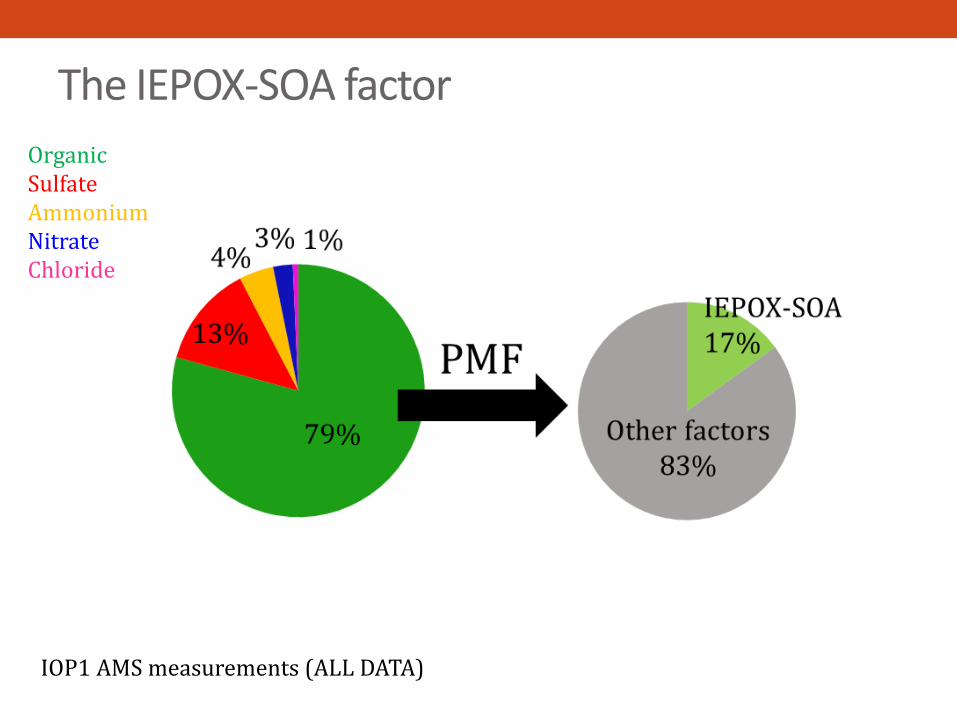
The IEPOX-SOA factor
IOP1 AMS measurements (ALL DATA)
OrganicSulfateAmmoniumNitrateChloride
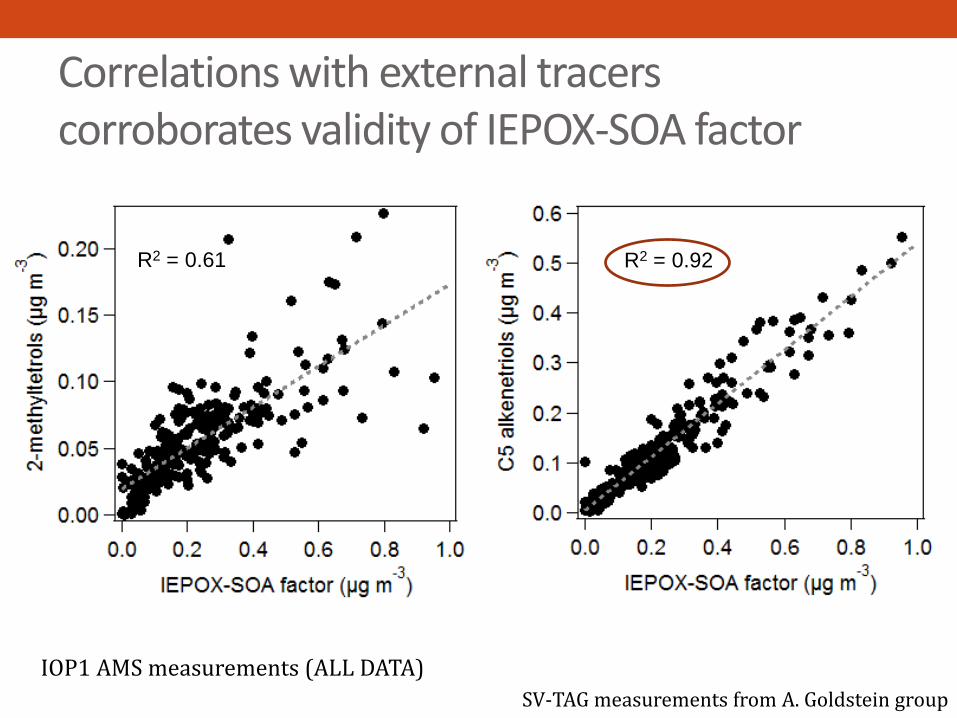
Correlations with external tracers corroborates validity of IEPOX-SOA factor
R2 = 0.61 R2 = 0.92
SV-TAG measurements from A. Goldstein group
IOP1 AMS measurements (ALL DATA)

Sulfate as a predictor of IEPOX-SOA
• IOP1, afternoon data (12:00-16:00 local time)
R2 = 0.5 SE U.S.R2: 0.48 – 0.60[Xu et al., 2015, Hu et al., 2015, Budisulistiorini et
al., 2013, 2015]
IEPOX-SOA factor loadings = f(sulfate), favored at sulfate

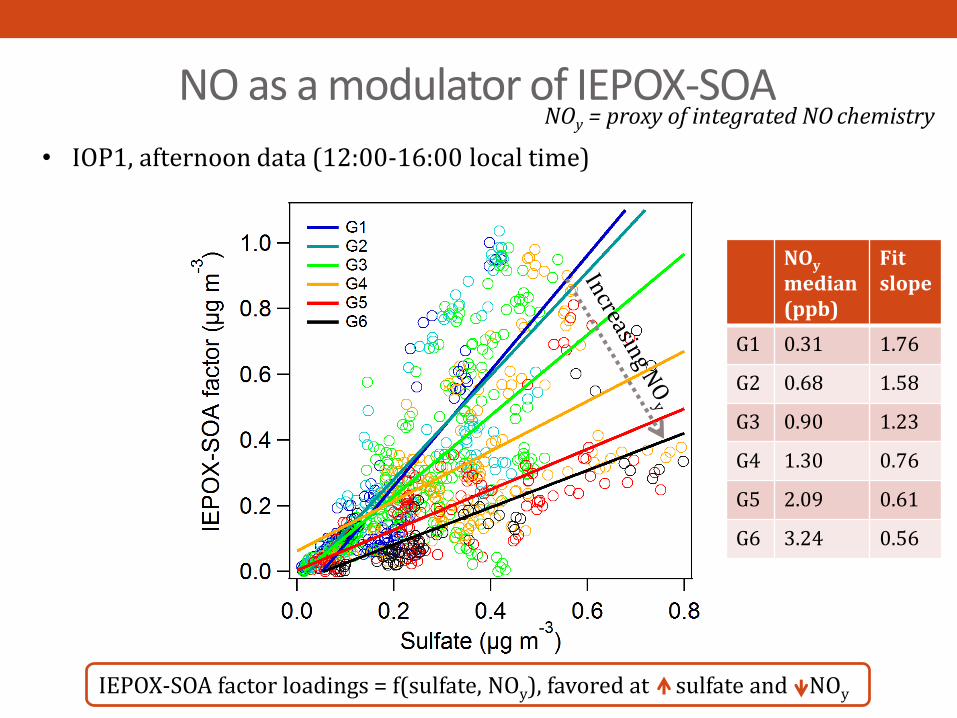
NO as a modulator of IEPOX-SOA
• IOP1, afternoon data (12:00-16:00 local time)
NOy
median (ppb)
Fit slope
G1 0.31 1.76
G2 0.68 1.58
G3 0.90 1.23
G4 1.30 0.76
G5 2.09 0.61
G6 3.24 0.56
NOy = proxy of integrated NO chemistry
IEPOX-SOA factor loadings = f(sulfate, NOy), favored at sulfate and NOy
75%
25%
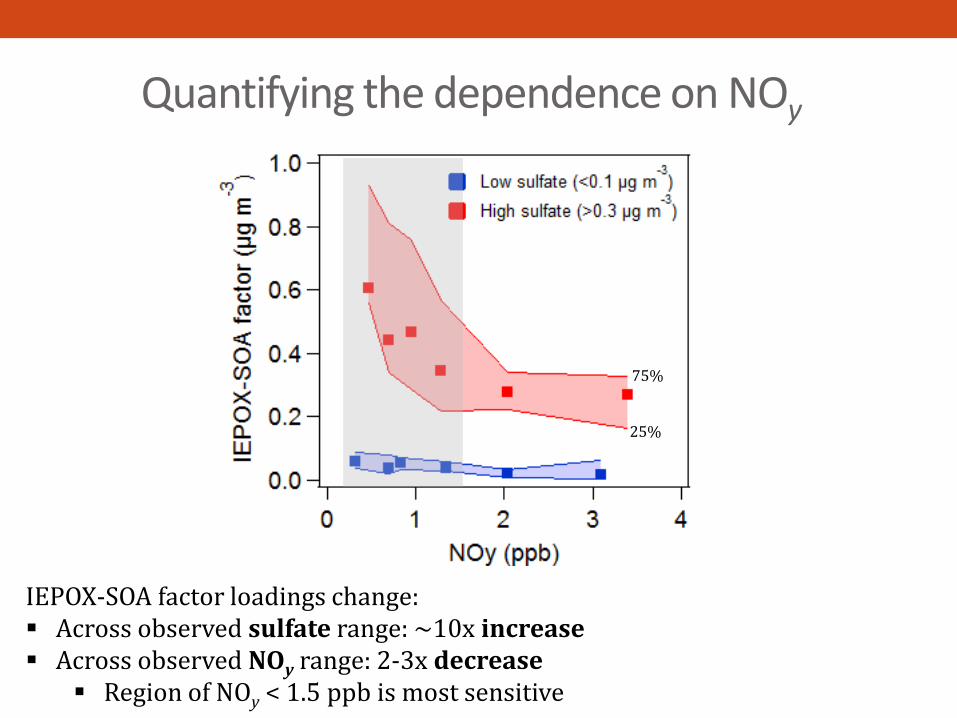
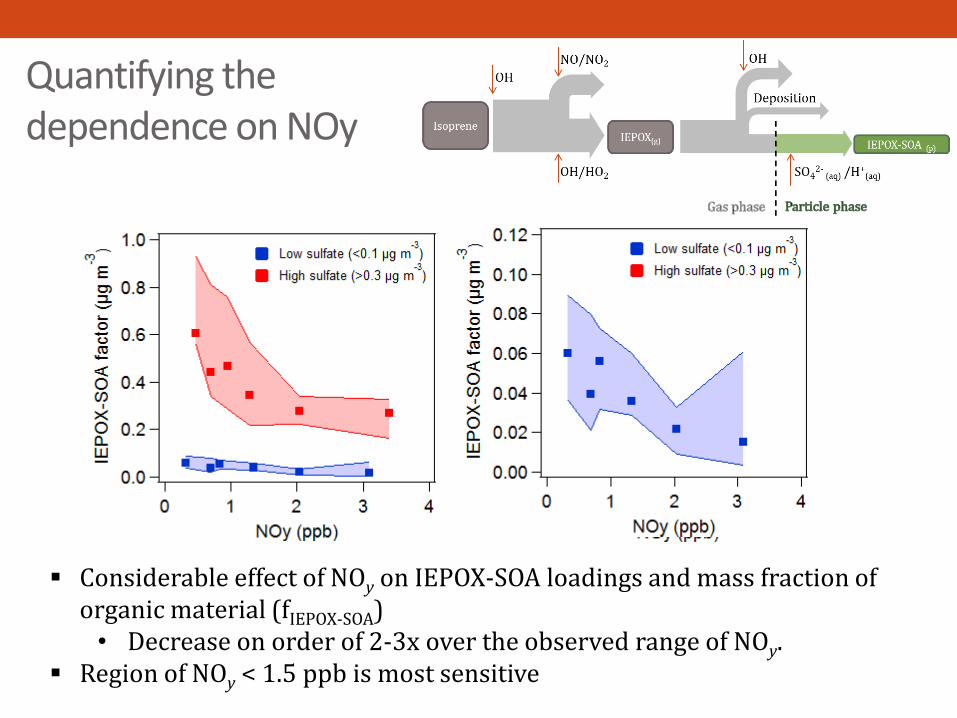
Quantifying the dependence on NOy
IEPOX-SOA factor loadings change: Across observed sulfate range: ~10x increase Across observed NOy range: 2-3x decrease
Region of NOy < 1.5 ppb is most sensitive
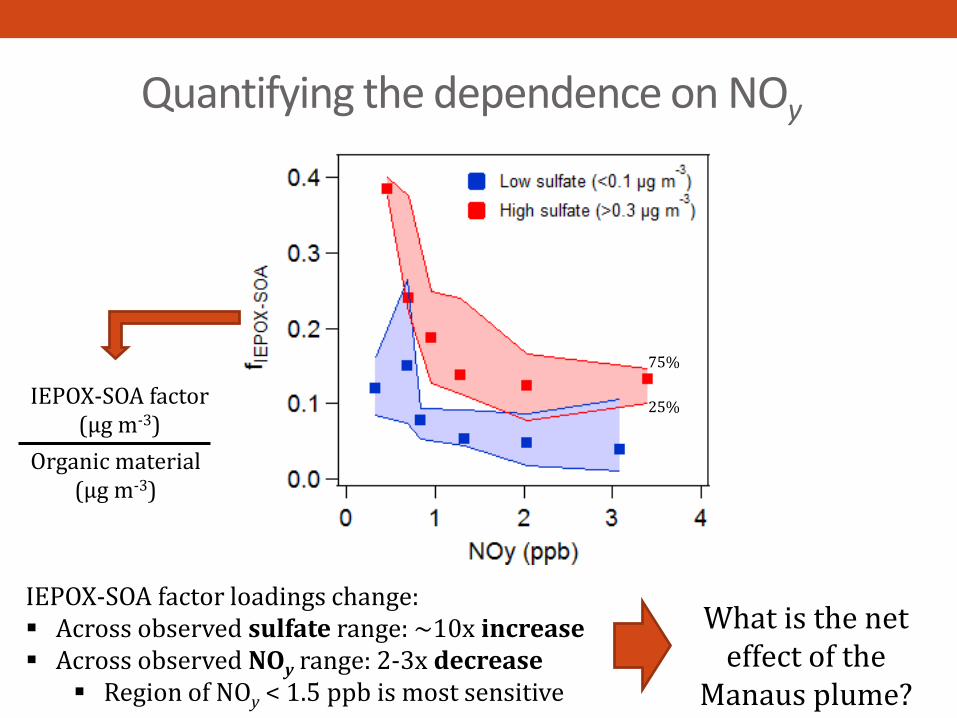
Quantifying the dependence on NOy
IEPOX-SOA factor loadings change: Across observed sulfate range: ~10x increase Across observed NOy range: 2-3x decrease
Region of NOy < 1.5 ppb is most sensitive
What is the net effect of the
Manaus plume?
75%
25%IEPOX-SOA factor
(µg m-3)
Organic material (µg m-3)

Case study
Background conditions
Pollutedconditions
March 3 2014 March 13 2014
vs.

March 3 2014: Background conditions
NOy
Particle counts
Data credit: Backward airmass trajectories: group of M. Assunção Silva Dias, USPG1 NOy data: Stephen Springston, ARM G1 CPC data: Fan Mei, ARM

March 13 2014: Polluted conditions
Particle counts
NOy
Data credit: Backward airmass trajectories: group of M. Assunção Silva Dias, USPG1 NOy data: Stephen Springston, ARM G1 CPC data: Fan Mei, ARM
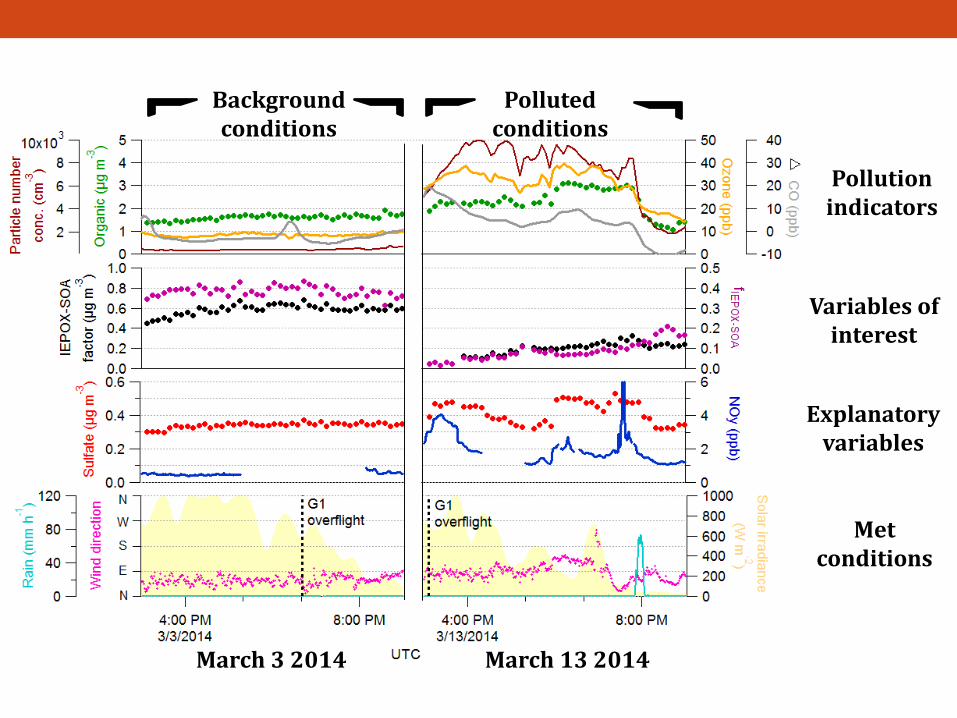
Background conditions
Polluted conditions
Pollution indicators
Variables of interest
Explanatory variables
Met conditions
March 3 2014 March 13 2014

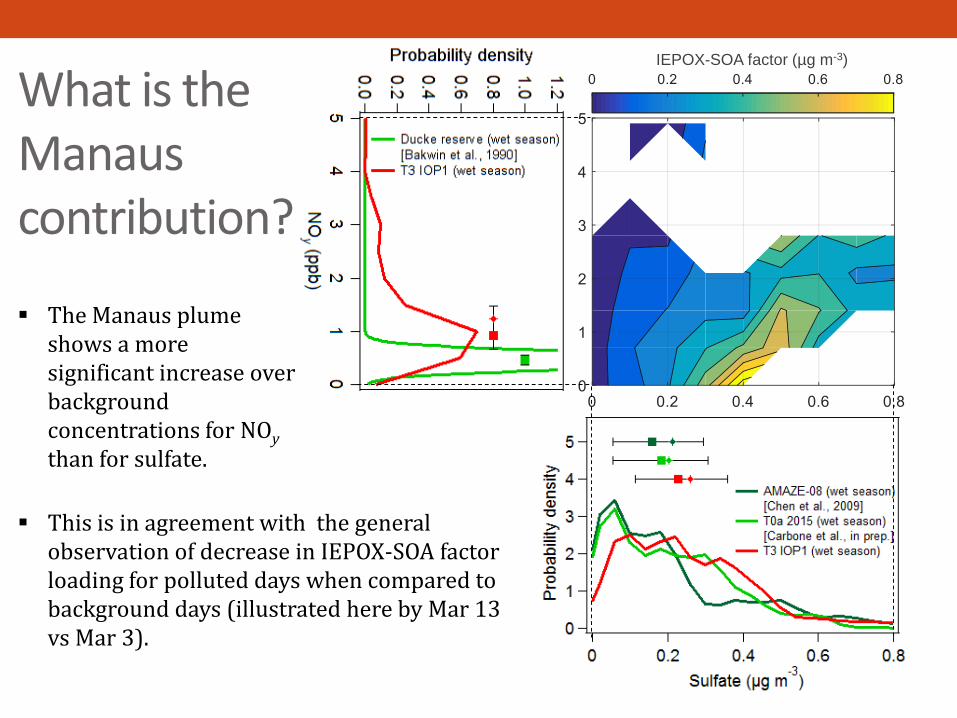
Manaus contribution over background is more significant for NOy than for sulfate
This is in agreement with case comparisons for polluted vs background days, where the Manaus plume is associated with lower IEPOX-SOA factor loadings.
Higher IEPOX-SOA loading Lower IEPOX-SOA loading
Green are PDF from other sites (background reference)Red is PDF for T3 data
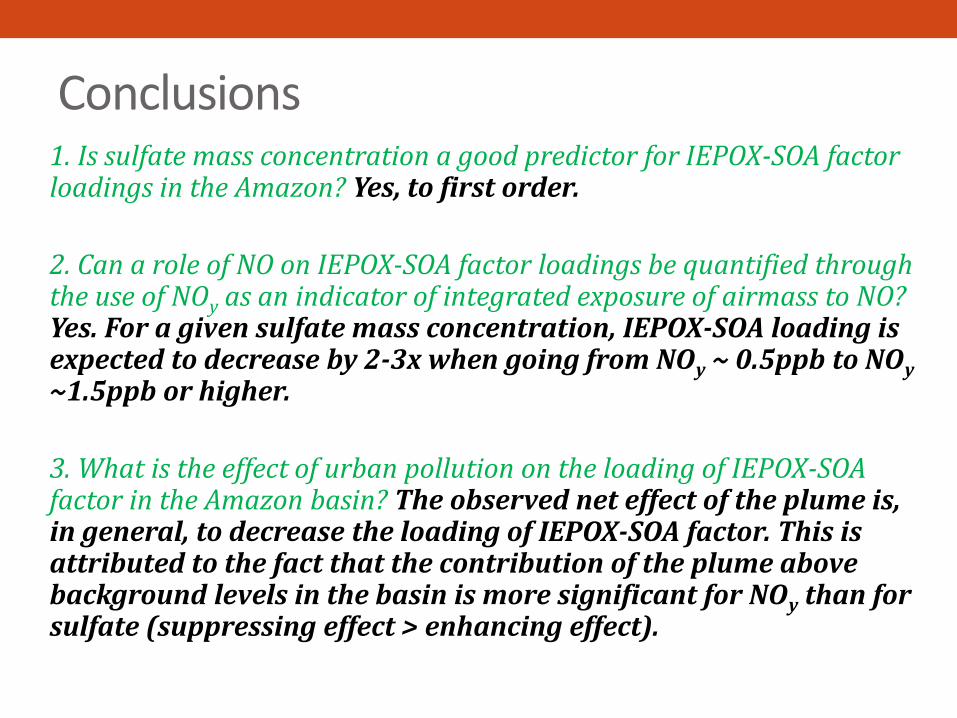
Conclusions1. Is sulfate mass concentration a good predictor for IEPOX-SOA factor loadings in the Amazon? Yes, to first order.
2. Can a role of NO on IEPOX-SOA factor loadings be quantified through the use of NOy as an indicator of integrated exposure of airmass to NO? Yes. For a given sulfate mass concentration, IEPOX-SOA loading is expected to decrease by 2-3x when going from NOy ~ 0.5ppb to NOy
~1.5ppb or higher.
3. What is the effect of urban pollution on the loading of IEPOX-SOA factor in the Amazon basin? The observed net effect of the plume is, in general, to decrease the loading of IEPOX-SOA factor. This is attributed to the fact that the contribution of the plume above background levels in the basin is more significant for NOy than for sulfate (suppressing effect > enhancing effect).

Acknowledgements All collaborators ARM team Funding agencies

Thank you for listening!
?

Aerosol Mass Spectrometry
HR-ToF-AMS
[DeCarlo et al., 2006]
Mass concentrations: Organic, Sulfate, Ammonium, Nitrate, Chloride Chemically resolved mass-size distribution Mass spectra, EI “fingerprint”
Aerodyne High-resolution Time-of-Flight Aerosol Mass Spectrometer
(AMS)
Non-refractory PM1
UniversalReproducibleFragmentation
NR material
7/23
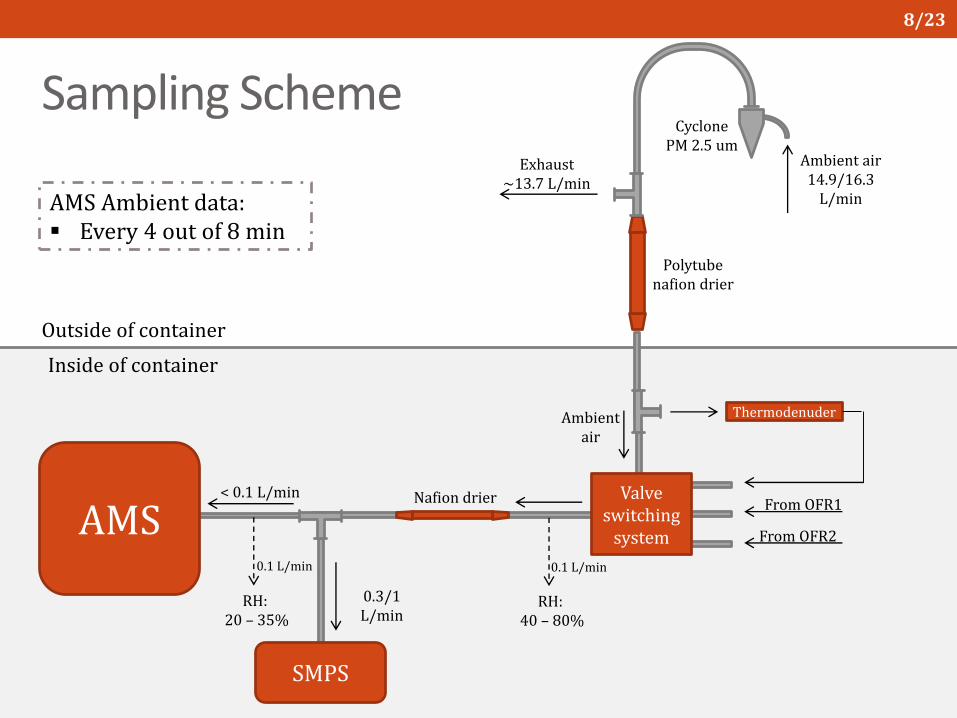
Sampling SchemeExhaust
~13.7 L/min
Ambient air 14.9/16.3
L/min
Polytubenafion drier
Cyclone PM 2.5 um
Valve switching
system
From OFR1
From OFR2
0.3/1 L/min
Outside of container
Inside of container
Nafion drier
RH:40 – 80%
AMS
RH:20 – 35%
SMPS
< 0.1 L/min
0.1 L/min 0.1 L/min
ThermodenuderAmbient air
AMS Ambient data: Every 4 out of 8 min
8/23

In light of the chemical mechanism…
Dependence on sulfate: at higher sulfate/acidity, reactive uptake is favored. Dependence on NOy: at higher NO:
(i) Direct effect: HO2 pathway is suppressed (ii) Indirect effect: oxidation capacity increased chemical loss enhanced oτOH(IEPOX-SOA) ~9days (See poster A13E-0395 (Weiwei Hu))oτOH(IEPOX(g)) ~24 h oOH increase ~3x in plume!oTransport time Manaus-T3 is ~4h!
*
IEPOX-SOA factor loadings = f(sulfate, NOy), favored at sulfate and NOy
τ = 1-2h
τ ~ 1day
τ ~ 1dayτOH ~9days
τaq ?
τdep ~ 1week
τisopooh ~3h
IEPOX-SOA factor (µg m-3)
What is the Manaus contribution?
The Manaus plume shows a more significant increase over background concentrations for NOy
than for sulfate.
This is in agreement with the general observation of decrease in IEPOX-SOA factor loading for polluted days when compared to background days (illustrated here by Mar 13 vs Mar 3).
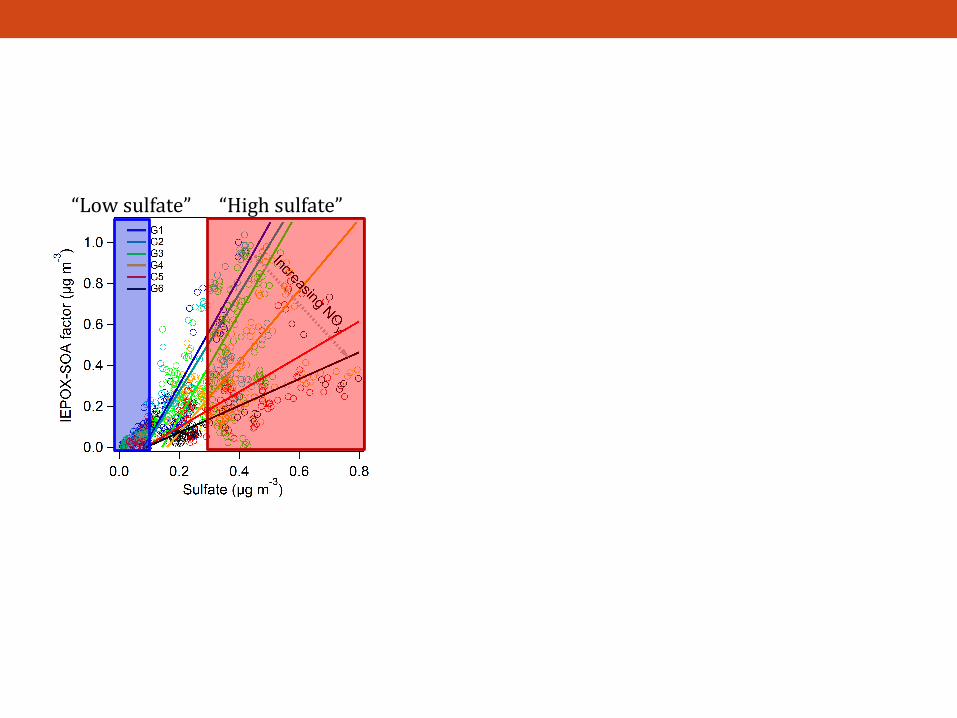
“Low sulfate” “High sulfate”

(Adapted from Guenther et al., 2012)
January July Isop
ren
e E
missio
n
(μm
ol
m-2
hr
-1)
VOC(isoprene, terpenes, etc.)
OH, O3
hν
Gas-phase oxidation products
Biogenic SOA
Atmospheric importance of isoprene
CondensationAbsorptionReactive uptake

Atmospheric importance of IEPOX-SOAIEPOX-SOA = SOA derived from isoprene epoxydiols (IEPOX) IEPOX
[Hu et al., 2015]
IEPOX-SOA factor: estimated from positive matrix factorization (PMF) of AMS organic mass spectra
[Paulot et al., 2009]
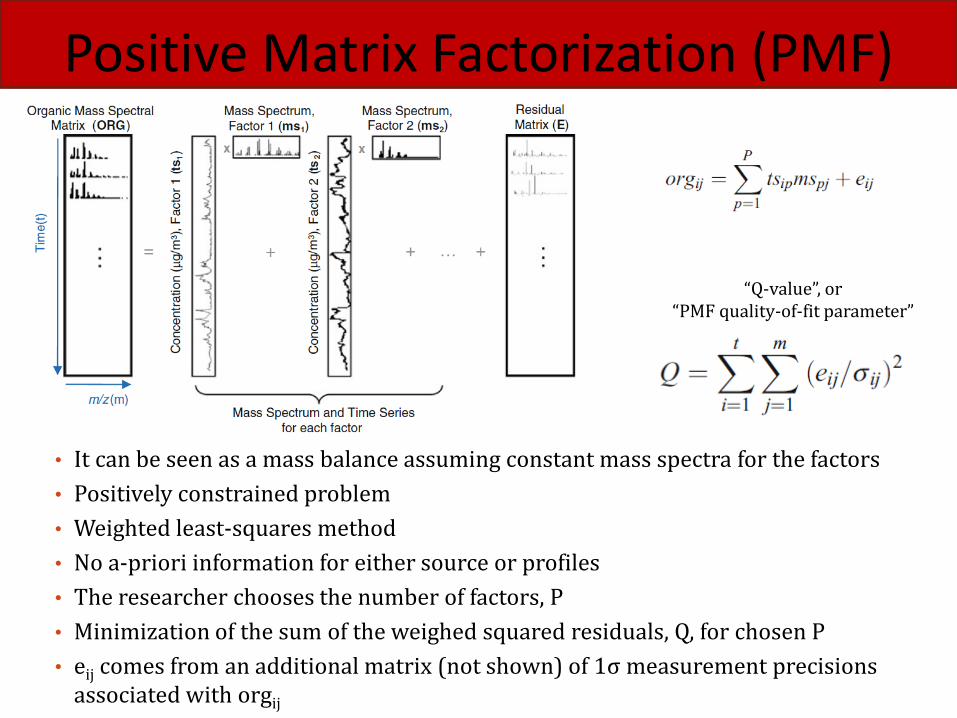
Positive Matrix Factorization (PMF)
• It can be seen as a mass balance assuming constant mass spectra for the factors
• Positively constrained problem
• Weighted least-squares method
• No a-priori information for either source or profiles
• The researcher chooses the number of factors, P
• Minimization of the sum of the weighed squared residuals, Q, for chosen P
• eij comes from an additional matrix (not shown) of 1σ measurement precisions associated with orgij
“Q-value”, or “PMF quality-of-fit parameter”
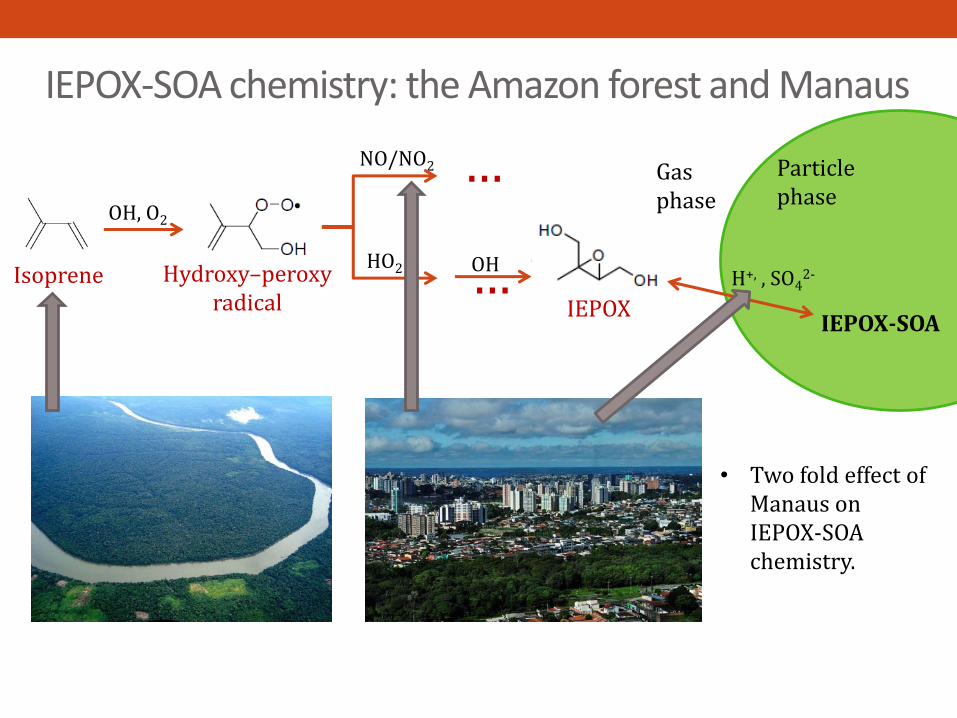
IEPOX-SOA chemistry: the Amazon forest and Manaus
Isoprene Hydroxy–peroxy radical
HO2
NO/NO2
products
OH, O2
OH…IEPOX-SOA
H+, , SO42-
Gasphase
Particle phase
IEPOX
• Two fold effect of Manaus on IEPOX-SOA chemistry.
…
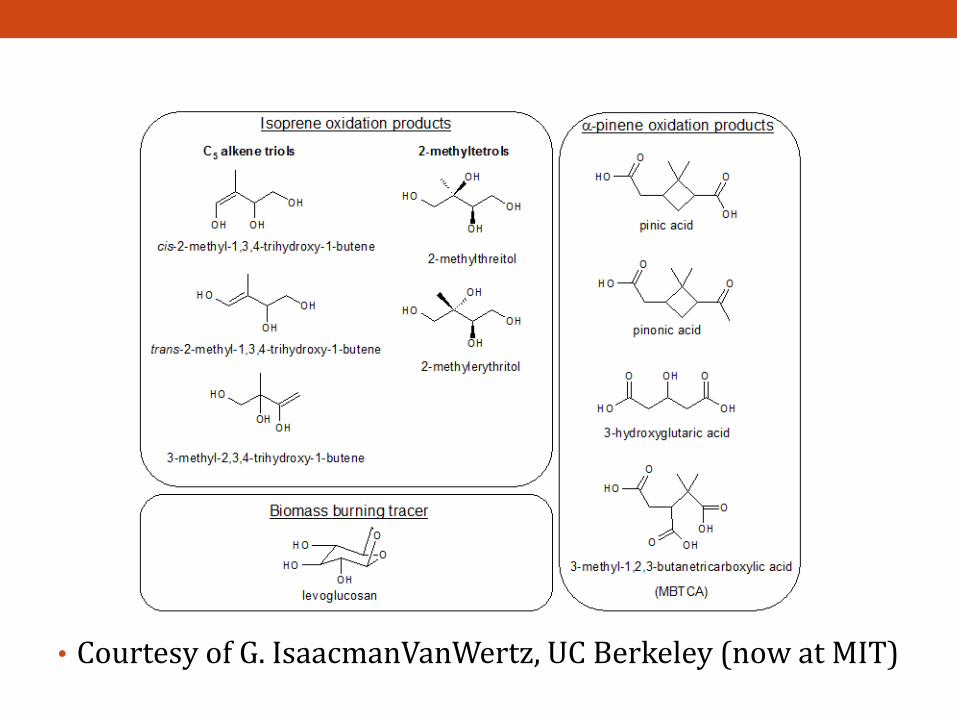
• Courtesy of G. IsaacmanVanWertz, UC Berkeley (now at MIT)
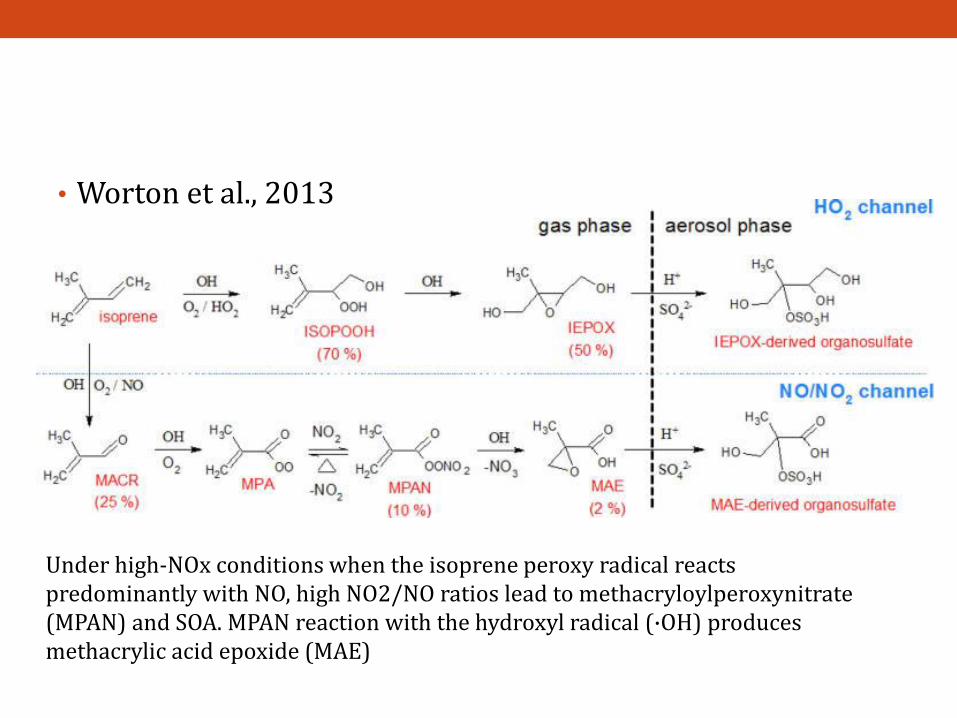
• Worton et al., 2013
Under high-NOx conditions when the isoprene peroxy radical reacts predominantly with NO, high NO2/NO ratios lead to methacryloylperoxynitrate(MPAN) and SOA. MPAN reaction with the hydroxyl radical (·OH) produces methacrylic acid epoxide (MAE)

The IEPOX-SOA factor
79%
1%3%4%
13%PMF
Other factors83%
IEPOX-SOA17%
IOP1 AMS measurements
(ALL DATA)
OrganicSulfateAmmoniumNitrateChloride
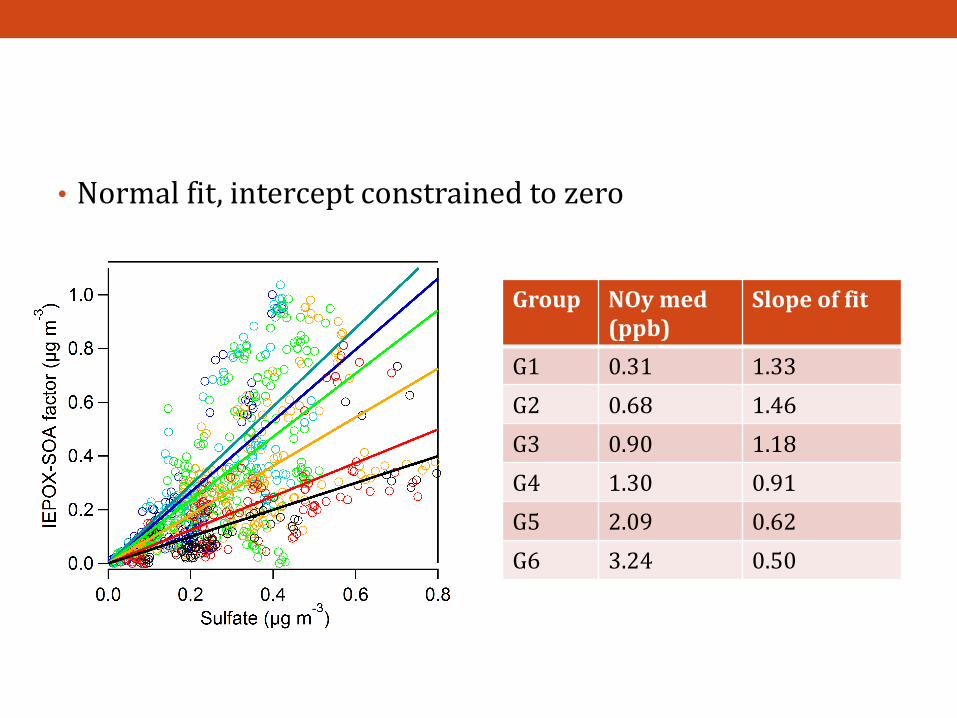
• Normal fit, intercept constrained to zero
Group NOy med (ppb)
Slope of fit
G1 0.31 1.33
G2 0.68 1.46
G3 0.90 1.18
G4 1.30 0.91
G5 2.09 0.62
G6 3.24 0.50
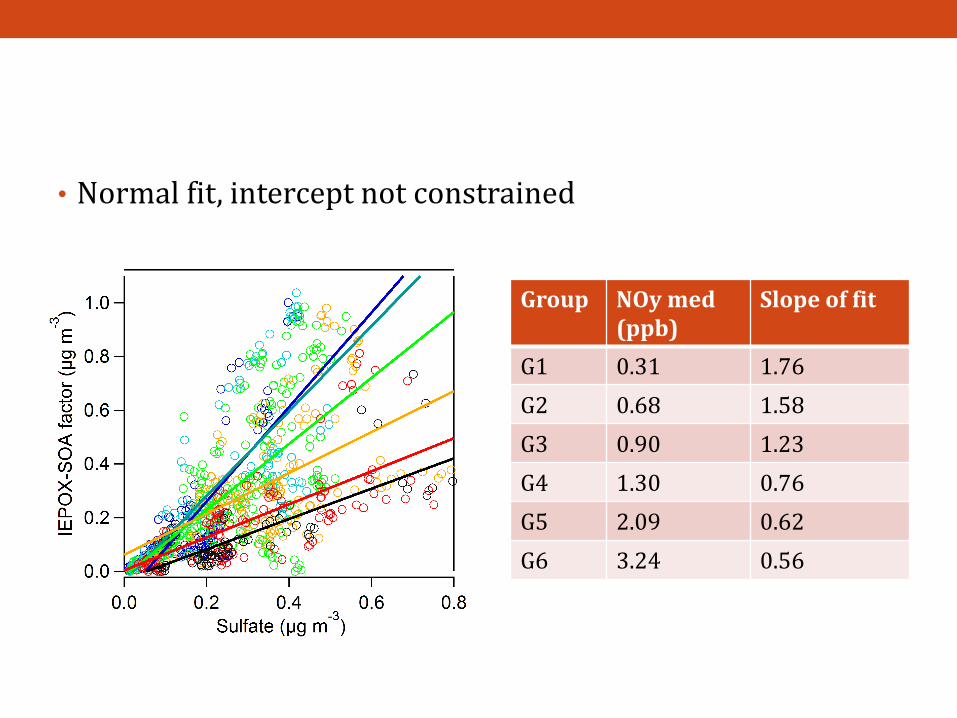
• Normal fit, intercept not constrained
Group NOy med (ppb)
Slope of fit
G1 0.31 1.76
G2 0.68 1.58
G3 0.90 1.23
G4 1.30 0.76
G5 2.09 0.62
G6 3.24 0.56

NO as a modulator of IEPOX-SOA
• IOP1, afternoon data (12:00-16:00 local time)
NOy
median (ppb)
Fit slope
G1 0.31 2.61
G2 0.68 2.39
G3 0.90 2.54
G4 1.30 1.74
G5 2.09 0.86
G6 3.24 0.65
NOy = proxy of integrated NO chemistry
IEPOX-SOA factor loadings = f(sulfate, NOy), favored at sulfate and NOy

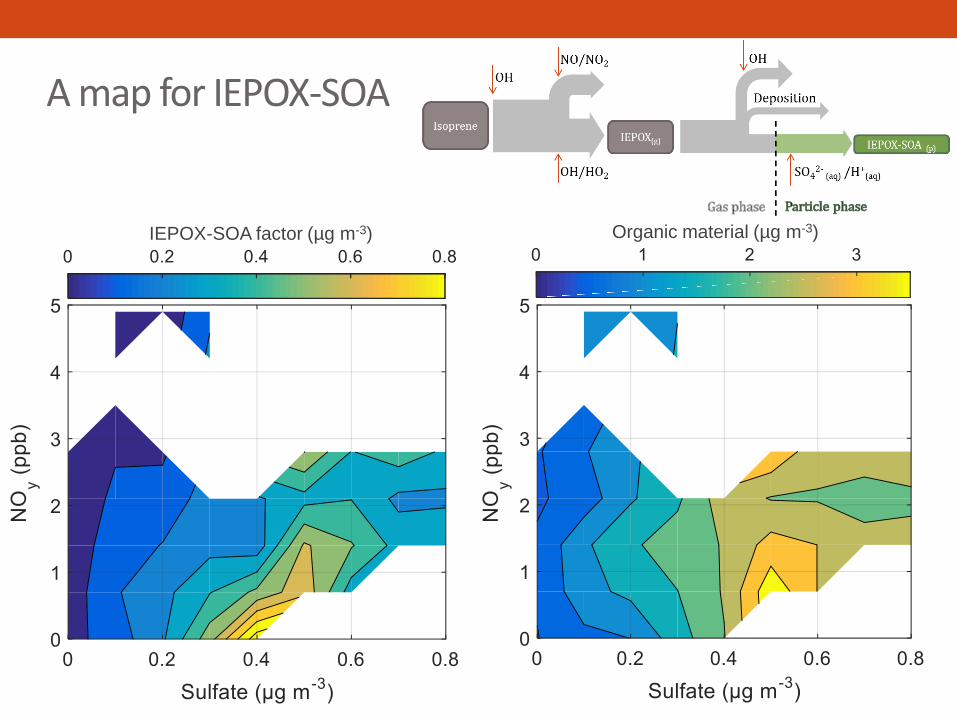
A map for IEPOX-SOA
Organic material (µg m-3)IEPOX-SOA factor (µg m-3)

Shown case study
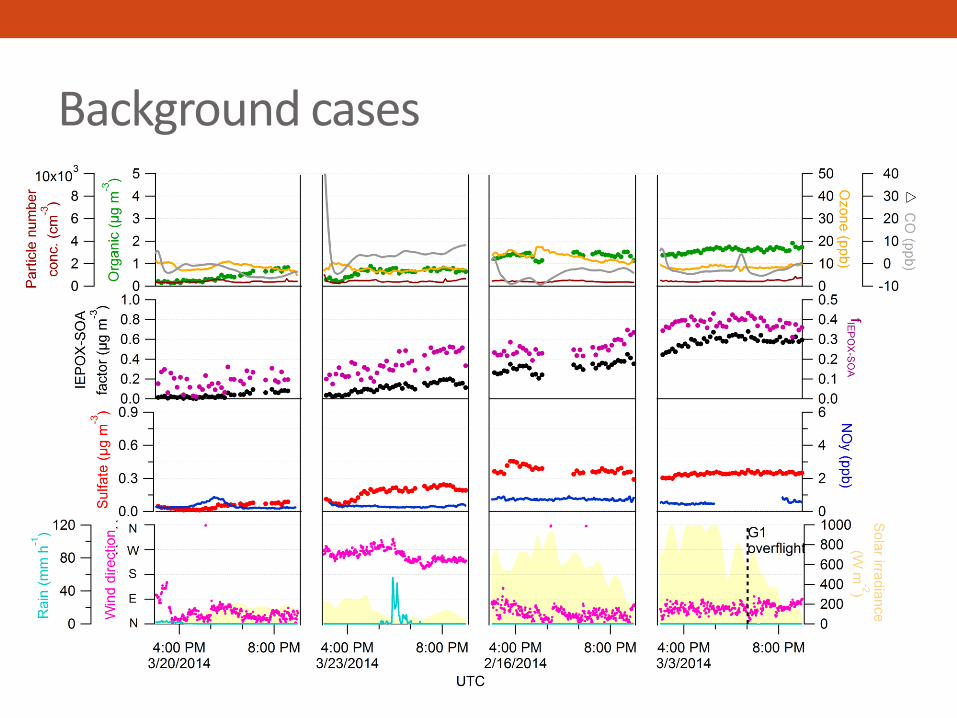
Background cases

Polluted cases

Other cases
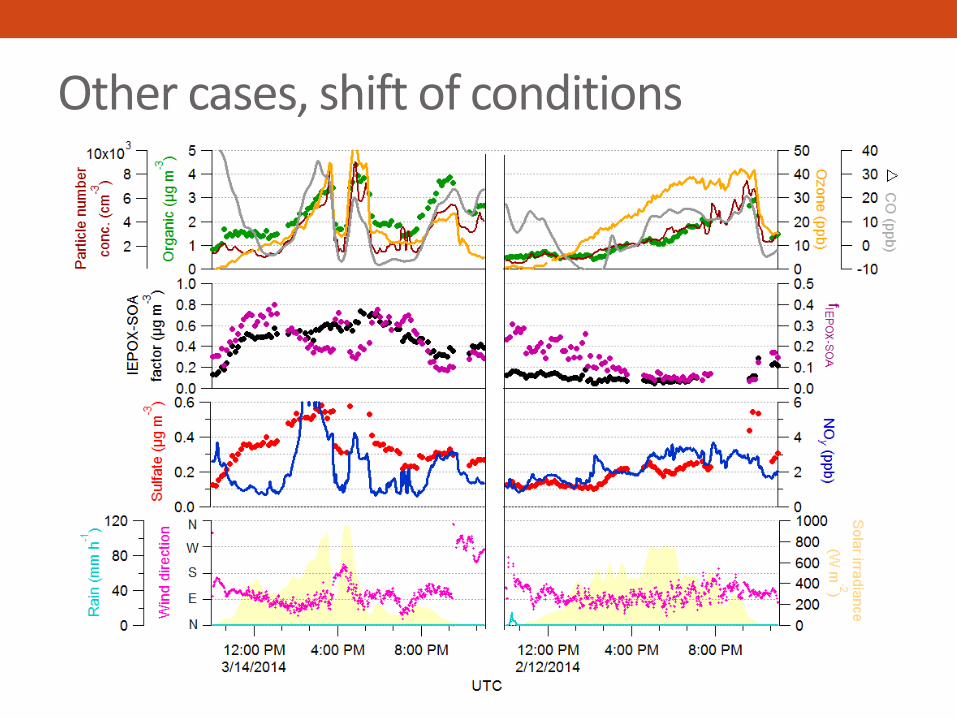
Other cases, shift of conditions
Quantifying the dependence on NOy
Considerable effect of NOy on IEPOX-SOA loadings and mass fraction of organic material (fIEPOX-SOA)• Decrease on order of 2-3x over the observed range of NOy.
Region of NOy < 1.5 ppb is most sensitive

Looking at extreme sulfate regimes…
Considerable effect of NOy on IEPOX-SOA loadings and mass fraction, especially for NOy < 1.5 ppb.

Summary of daytime 12-16h LT plots

Dependence on NOy…

PMF RESULTS

Particle composition at T3
79%
1%3%4%
13%
85%
1%3%
11%
IOP1(Wet season)
IOP2(Dry season)
OrganicSulfateAmmoniumNitrateChloride
PMF
PMF
Other factors83%
IEPOX-SOA17%
Other factors85%
IEPOX-SOA15%

IOP1: Factors profiles
HOA
91fac
BBOA
LO-OOA
MO-OOA
IEPOX-SOA 17.1%
30.0%
25.6%
9.1%
12.6%
5.8%
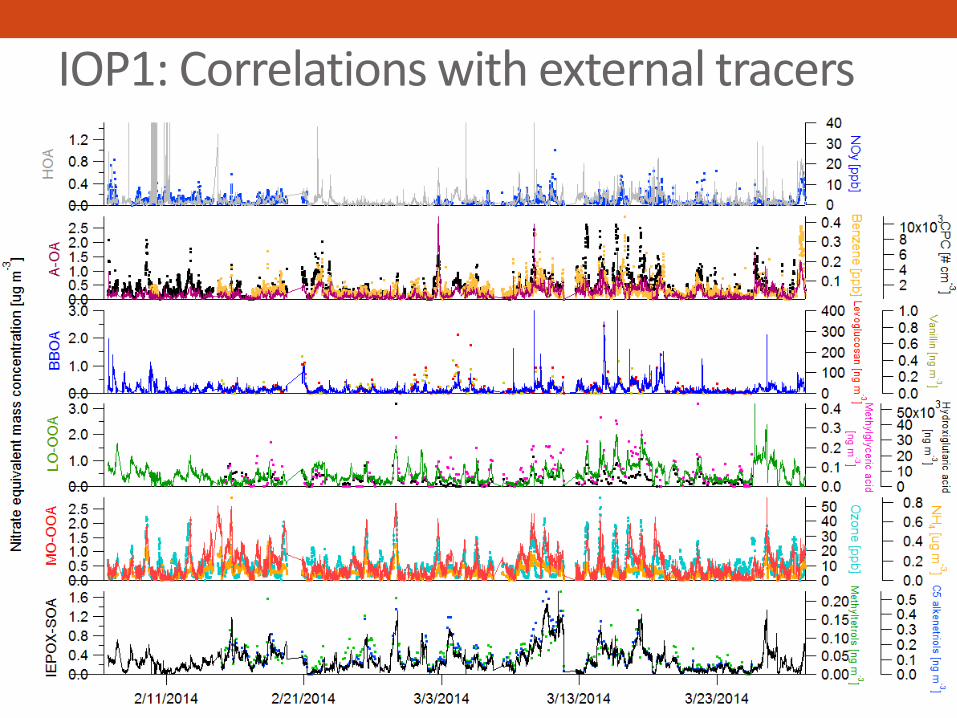
IOP1: Correlations with external tracers

IOP1: Diel patterns HOA
91fac (A-OA)
BBOA
LO-OOA
MO-OOA
IEPOX-SOA

OTHER POSSIBLE PREDICTORS FOR IEPOX-SOA?
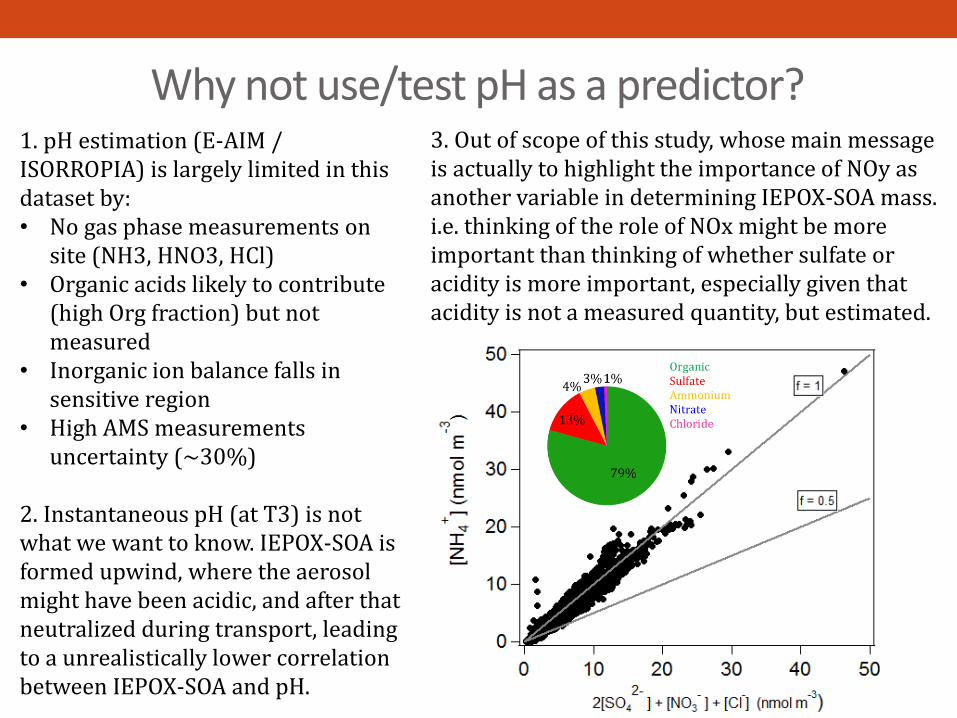
Why not use/test pH as a predictor?1. pH estimation (E-AIM / ISORROPIA) is largely limited in this dataset by:• No gas phase measurements on
site (NH3, HNO3, HCl)• Organic acids likely to contribute
(high Org fraction) but not measured
• Inorganic ion balance falls in sensitive region
• High AMS measurements uncertainty (~30%)
2. Instantaneous pH (at T3) is not what we want to know. IEPOX-SOA is formed upwind, where the aerosol might have been acidic, and after that neutralized during transport, leading to a unrealistically lower correlation between IEPOX-SOA and pH.
3. Out of scope of this study, whose main message is actually to highlight the importance of NOy as another variable in determining IEPOX-SOA mass. i.e. thinking of the role of NOx might be more important than thinking of whether sulfate or acidity is more important, especially given that acidity is not a measured quantity, but estimated.

IOP1, T3: Inorganic ion balance
79%
1%3%4%
13%
OrganicSulfateAmmoniumNitrateChloride
- Inorg ion balance falls in sensitive region
- No gas phase measurements on site (NH3, HNO3, HCl)
- Organic acids likely to contribute (high Org fraction)
- High AMS measurements uncertainty (~30%)

Looking at [H+] as a parameter

Looking at [H+] as a parameter
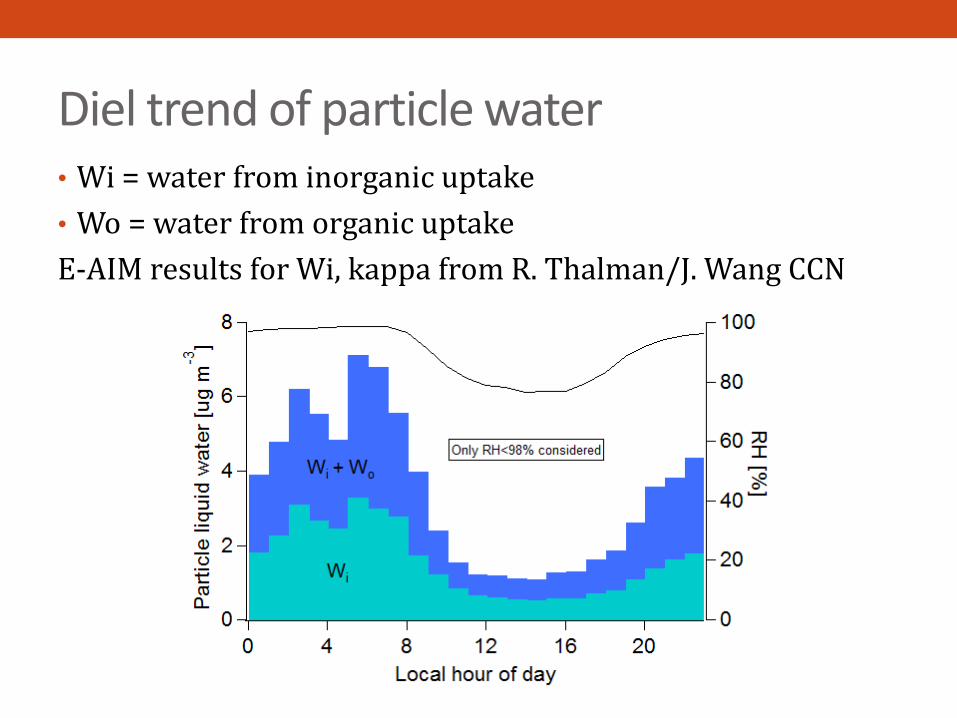
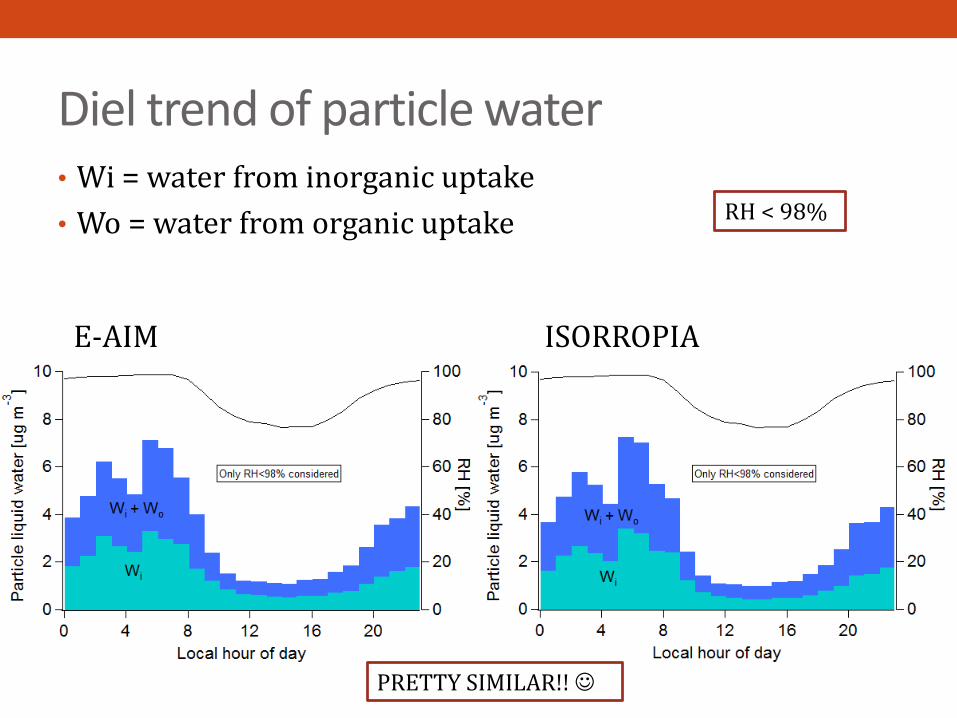
Diel trend of particle water• Wi = water from inorganic uptake
• Wo = water from organic uptake
E-AIM results for Wi, kappa from R. Thalman/J. Wang CCN
Diel trend of particle water• Wi = water from inorganic uptake
• Wo = water from organic uptake
E-AIM ISORROPIA
RH < 98%
PRETTY SIMILAR!!
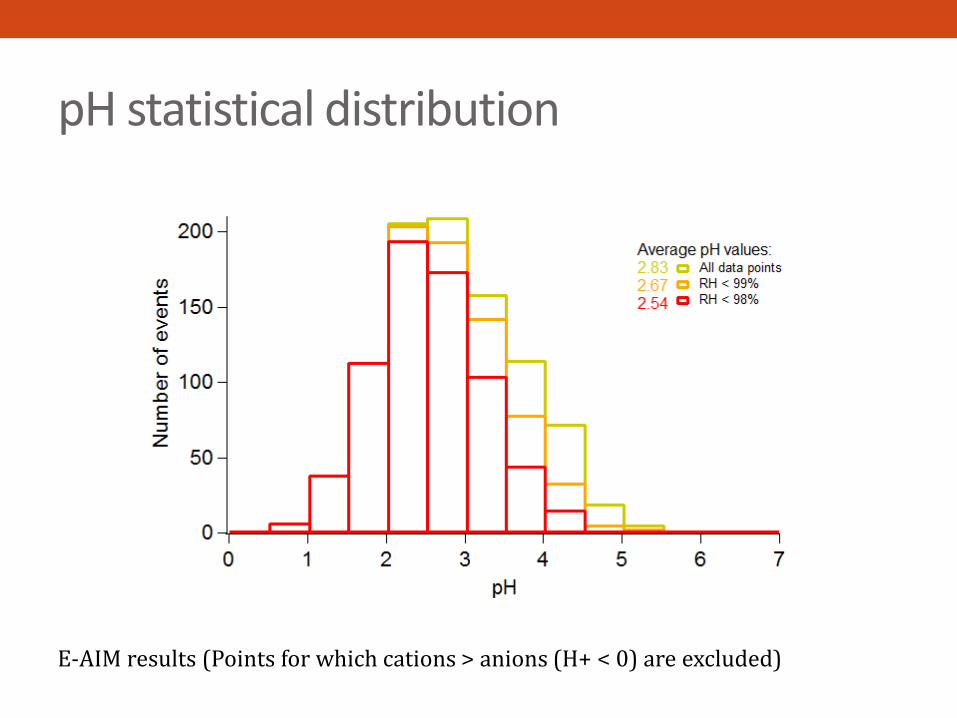
pH statistical distribution
E-AIM results (Points for which cations > anions (H+ < 0) are excluded)
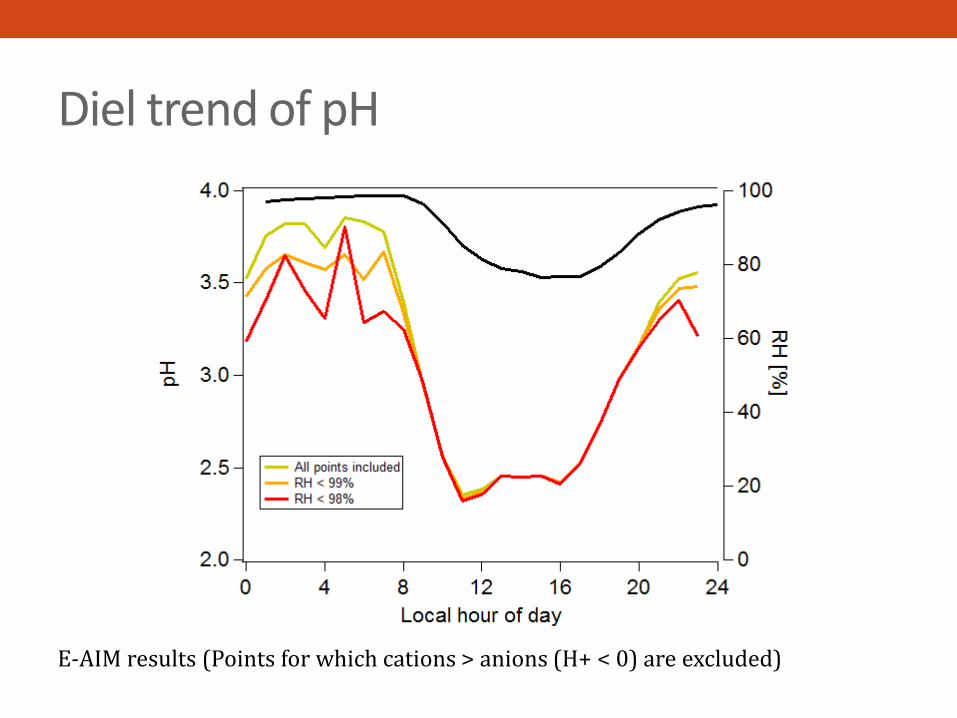
Diel trend of pH
E-AIM results (Points for which cations > anions (H+ < 0) are excluded)