Embed Size (px)
Citation preview
Researchjournali’s Journal of Finance
Vol. 5 | No. 2 May | 2017 ISSN 2348-0963 1
www.researchjournali.com
William Lekimankusi Ntalamia
Post Graduate Student, Department of Business and
Social Sciences, Jomo Kenyatta University of
Agriculture & Technology, P.O.BOX 84-00209,
Loitokitok, Kenya
Factors Influencing
Adoption Of Environmental
Management Accounting
(Ema) Practices Among
Manufacturing Firms In
Nairobi, Kenya
Researchjournali’s Journal of Finance
Vol. 5 | No. 2 May | 2017 ISSN 2348-0963 2
www.researchjournali.com
ABSTRACT
EMA is concerned with the accounting information needs of managers in relation to corporate activities that
affect the environment as well as the environment-related impacts on the corporation. It is an area that has tried
to link to innovative strategies and corporations have used it as an environmental performance indicator (EPI)
to measure environmental performance. The study sought to establish whether the financial status of a company
influences adoption of Environmental management accounting practices among manufacturing firms in Kenya.
The study is significant to the managers of corporate entities that operate in the manufacturing sector, Local
government and environmental regulatory agencies and the primary stakeholders to a firm. The researcher used
a mixed research design approach of both quantitative and qualitative research design. Demographic data of the
firms used in the survey was presented in tables and analyzed using descriptive statistics for data based on
scales and regression analysis for data relating to contextual variables influence on EMA adoption. Regression
of coefficients results show that Financial Status and Adoption of EMA are positively and significant related.
The study recommended that companies should always encourage EMA practices consistently to realize
increased financial performance as well as promoting the company’s portfolio image.
Keywords: Environmental management Accounting, Financial value, Manufacturing firms
1.0 INTRODUCTION
According to the United Nations Emissions Gap Report, the largest emitters of greenhouse gases (GHGs) are
companies that operate in environmentally sensitive industries such as oil and gas extraction, mining, chemical
manufacturing etc. (UNEP, 2012). In response to increased depletion of the environment, the Kyoto protocol
(which is an international agreement that sets emissions parameters for the member countries) was introduced
as an initiative of the United Nations Framework on Climate Change (UNFCC), aimed at decreasing the levels
of GHGs released into earth’s atmosphere (Ratnatunga & Balachandran,2007). International treaties such as the
Kyoto Protocol,statutes and regulations governing environmental mangement, public opinion and
environmental interest groups have placed corporations under pressure to releases into the ecosystem caused
by firms, that may adversely affect the natural environment (Environmental Information Regulations Act,
2004). The methods and policies adopted by companies to safeguard the environment and the expenditures and
benefits associated with doing so also form part of environmental information (Dascalu, et al., 2010).
Environmental disclosures in financial reports have also been used as a means to communicate with an entity’s
external stakeholders (Qian & Burritt, 2010).In some cases, certain groups of stakeholders may influence the
information disclosed in finacial reports. Jalaludin, Sulaiman& Ahmad (2011), similarly found that accountants
within their survey of manufacturing entities in Malaysia, were compelled by institutional stakeholders to
account for environmental activities.

Researchjournali’s Journal of Finance
Vol. 5 | No. 2 May | 2017 ISSN 2348-0963 3
www.researchjournali.com
It is clear that the role of accounting has extended beyond the conventional recording and reporting of financial
information, to managing environmental performance through the use of environmental accounting (EA)
(Hopwood, 2009). Managing environmental performance encompasses the means an entity uses to control the
environmental effects of its actions, products and services as well as their impact on the ecosystem (ISO
140001). Environmental accounting has two main centres: environmental financial accounting (EFA) which
involves the disclosure of environmental concerns in public financial reports; and the environmental
management accounting (EMA) that focuses on providing organization management with information to aid in
the proficient use of company assets, budgeting, formulation of business strategy and policy etc. (Bennett &
James, 2000;IFAC, 2005).
The United Nations on sustainable Development (UNSD) states that the adoption of environmental
management accounting (EMA) is vital for business to apply cleaner and more productive procedures such as
reduction of carbon emissions, efficient use of physical resources such as water, raw materials etc. (UNDSD,
2001.) EMA can also be harnessed by firms to make decisions pertaining to product pricing, investment
appraisals, calculation of costs associated with environmental projects, among others (UNDSD, 2001).
The main goal of EMA is to improve both economic and environmental performance of a corporation by
utilizing both financial and non-financial information. IFAC (2005) classifies financial and non-financial
information under EMA as physical information and monetary information respectively. Physical information
relates to an organization’s impact on the natural ecosystem expressed in terms of quantifiable units. For
example, carbon emissions are measured in tons. Monetary information refers to the costs incurred by
companies to prevent or lessen environmental degradation (Dascalu, et al., 2010; Schaltegger, Burritt, &
Peterson, 2003; IFAC, 2005).
Research studies such as those carried out by Burritt & Saka(2006); Masanet-LLodra(2006); Ferreira, Moulang,
& Hendro(2010) have shown that there are multiple advantages accruing to organizations that apply EMA. For
instance, a positive association was discovered between the use of EMA and process modernization implying
that firms that have implemented EMA are likely to have modified production processes and ultimately lower
costs of production (e.g. reduced input expenses resulting from recycling of raw materials) (Masanet-LLodra,
2006; Porter & Esty, 1998).Moreover, Hart & Ahuja (1996) concluded that environmental accounting practices
such as EMA have a positive influence on the economic performance of companies.
Furthermore, Schaltegger & Burritt (2010) emphasizes that there are two perspectives to EMA. EMA can be
seen as an instrument of reducing an entity’s negative environmental impact and also as an instrument that aids
in reducing costs of environmental protection (Jasch, 2001). For example, EMA provides an entity with a good
estimation of environmental costs incurred which will consequently lead to better managerial decision making
and ultimately increased profitability (Jalaludin, et al, 2011). The findings of these studies suggest that the
Researchjournali’s Journal of Finance
Vol. 5 | No. 2 May | 2017 ISSN 2348-0963 4
www.researchjournali.com
adoption of EMA is beneficial. The factors that lead to adoption of EMA practices however, vary. At this
juncture, it is important to draw a distinction between proactive and reactive businesses. Entities may apply
EMA solely to meet legal requirements and are termed as reactive companies whereas those that seek to manage
environmental performance beyond compliance are called proactive companies (Buysse & Verbeke, 2013).
In Kenya the use of EMA practices is not an express requirement of the law. Nonetheless, the government has
established an environmental regulatory institution known as the National Environmental Management
Authority (NEMA) to implement the laws listed under the Environmental Management and co-ordination Act.
NEMA conducts environmental impact assessments on proposed environmental projects, issues licenses such
as waste licenses, emissions licenses and effluent licenses to organizations whose activities contribute towards
environmental degradation. The Kenyan government also created the Kenya National Cleaner Production
Centre (KNPC) in collaboration with the United Nations Industrial Development Organization (UNIDO) to
encourage cleaner production processes among business enterprises by emphasizing on material, water &
energy efficiency as well as waste minimization. It is apparent that the Kenyan government has recognized the
significance of environmental well-being, yet the practice of EMA has not been encouraged directly.
2.0 RESEARCH OBJECTIVE
To establish whether the financial status of a company influences adoption of Environmental Management
Accounting Practices among Manufacturing firms in Nairobi, Kenya.
3.0 LITERATURE REVIEW
This chapter presents a review of literature pertaining to the adoption of Environmental Management
Accounting (EMA). It will comprise of theoretical framework, Conceptual framework and Empirical review in
relation to financial status of a company and Adoption of EMA.
3.1 RESOURCE BASED THEORY
The central proposition of the resource-based research is that firms are heterogeneous in terms of the strategic
resources they own and control. It is generally suggested that this heterogeneity is an outcome of resource-
market imperfections (Barney, 1991), resource immobility (Barney, 1991), and firms’ inability to alter their
accumulated stock of resources over time (Carroll, 1993).
The kind of resources for instance technical, human, and financial or others available to an organization for
completing specific tasks often directly impacts the success of EMA (Ray et al, 2004). According to this
perspective, each firm must possess a strength, or small number of strengths, that sets it apart from its
competitors over the long term in order to gain competitive advantage.
Researchjournali’s Journal of Finance
Vol. 5 | No. 2 May | 2017 ISSN 2348-0963 5
www.researchjournali.com
The most important resource when it comes to Environmental Management Accounting is the competency of
workers especially how to discharge the affluent in an environmentally safe and friendly way. Bartolomeo, et
al., (2000) emphasize on the importance of understanding environmental costs since they directly affect firm
profitability especially for manufacturing corporations since their activities significantly affect the environment.
Conventional cost accounting does not separate environmental costs from non-environmental costs and as such,
both may be recorded as general expenses. This means that environmental costs remain hidden from internal
management which hinders effective decision making (Bennett, et al., 2004). Using EMA to account for
environmental costs can be used by managers in decisions such as product pricing, budgeting, investment
appraisal, design of environmental management systems, etc. (UNDSD, 2001). This study therefore sought to
find out the influence of financial status of a manufacturing company on the adoption of Environmental
Management Accounting.
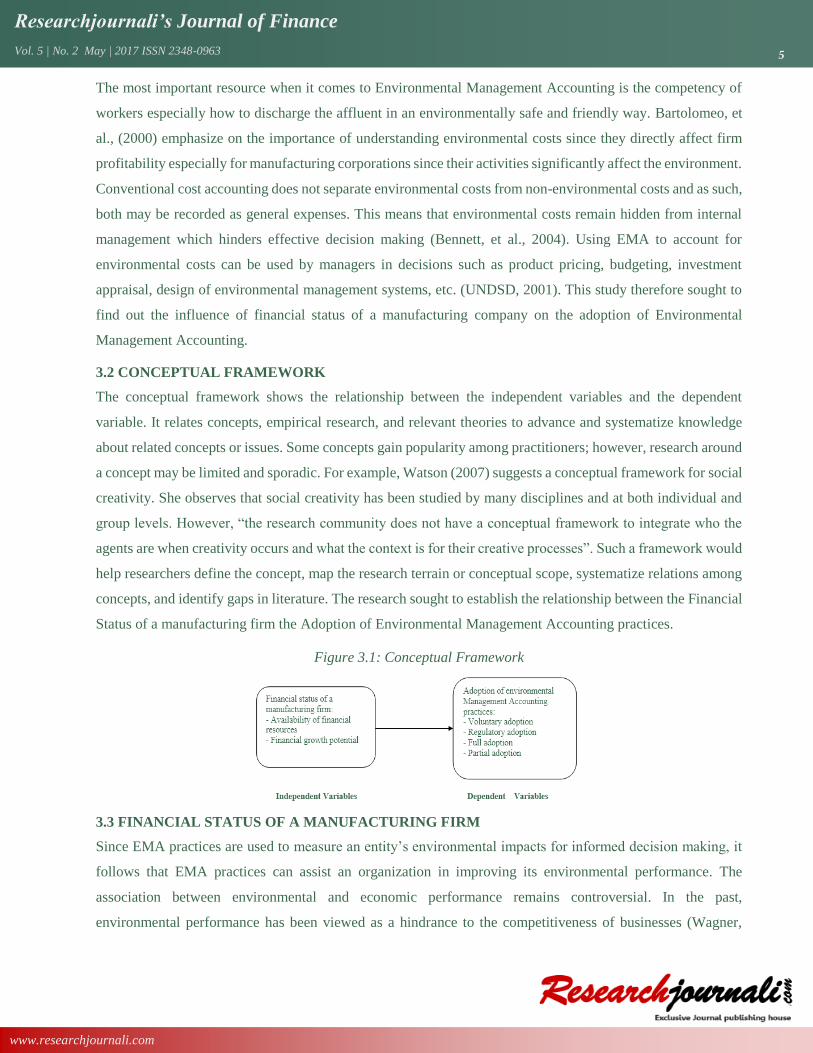
3.2 CONCEPTUAL FRAMEWORK
The conceptual framework shows the relationship between the independent variables and the dependent
variable. It relates concepts, empirical research, and relevant theories to advance and systematize knowledge
about related concepts or issues. Some concepts gain popularity among practitioners; however, research around
a concept may be limited and sporadic. For example, Watson (2007) suggests a conceptual framework for social
creativity. She observes that social creativity has been studied by many disciplines and at both individual and
group levels. However, “the research community does not have a conceptual framework to integrate who the
agents are when creativity occurs and what the context is for their creative processes”. Such a framework would
help researchers define the concept, map the research terrain or conceptual scope, systematize relations among
concepts, and identify gaps in literature. The research sought to establish the relationship between the Financial
Status of a manufacturing firm the Adoption of Environmental Management Accounting practices.
Figure 3.1: Conceptual Framework
3.3 FINANCIAL STATUS OF A MANUFACTURING FIRM
Since EMA practices are used to measure an entity’s environmental impacts for informed decision making, it
follows that EMA practices can assist an organization in improving its environmental performance. The
association between environmental and economic performance remains controversial. In the past,
environmental performance has been viewed as a hindrance to the competitiveness of businesses (Wagner,
Researchjournali’s Journal of Finance
Vol. 5 | No. 2 May | 2017 ISSN 2348-0963 6
www.researchjournali.com
Schaltegger, 2001). Manufacturing entities in particular, face a distinct disadvantage since their activities are
likely to lead to high environmental costs. Furthermore, costs for compliance to environmental regulations may
further cripple their financial performance.
There are studies that have determined a negative relationship exists between environmental management and
economic performance or derived inconclusive results about the nature of the relationship between the two
variables (Wagner et al, 2002; Gilley et al, 2000; Qian, 2012). Environmental performance may be measured
based on factors such as the quantity of water or energy used, amount of permitted air emissions, the level of
toxic substances released into the atmosphere etc. Financial performance can be quantified using measures such
as financial ratios, specifically Return on Assets ratio (ROA), Return on Equity (ROE) and profitability ratios
(Wagner et al, 2002)
Qian (2012), found that publicly listed companies were responsible for emitting the highest levels of carbon
into the atmosphere but at the same time still enjoyed higher financial returns than companies that took proactive
measures to cap their emissions. Thus, the relationship between financial and environmental performance was
negative. According to Qian (2012) the results of his research show that external stakeholders have not
pressurized such organizations to manage their pollution levels. Prior literature has attempted to show that a
positive relationship exists between environmental performance and financial performance (Mir, Rahaman,
2010). Judge, Douglas (1999) found that corporate entities that incorporated environmental issues into their
strategic planning found that doing so had a positive effect on financial performance. Sharma & Vrendeburg
(1998) also found that proactive environmental practices positively influenced financial performance. The
conclusions of the study can be summarized into two main arguments. Mmanufacturing orgaizations incur
higher environmental costs and as a result they have an incentive to look for production processes that may
reduce environmental expenditures. Furthermore, by investing in cleaner modes of production, the firm is able
to stay ahead of the competition, that is, to sustain competitive advantage. The capability to innovate and
discover new methods and/or technologies for greener production establish an entity’s competitiveness in the
long run (Porter, Van der Linde, 1995).
Previous studies have focused on the effect environmental strategies have on financial performance (Cohen et
al , 1997; Hart, Ahuja, 1996). The reverse may also be true. Economic performance may also influence
environmental management. A business that is finacially affluent may be in a better position to allocate more
resources towards environmental management and consequently score better in terms of environmental
performance.
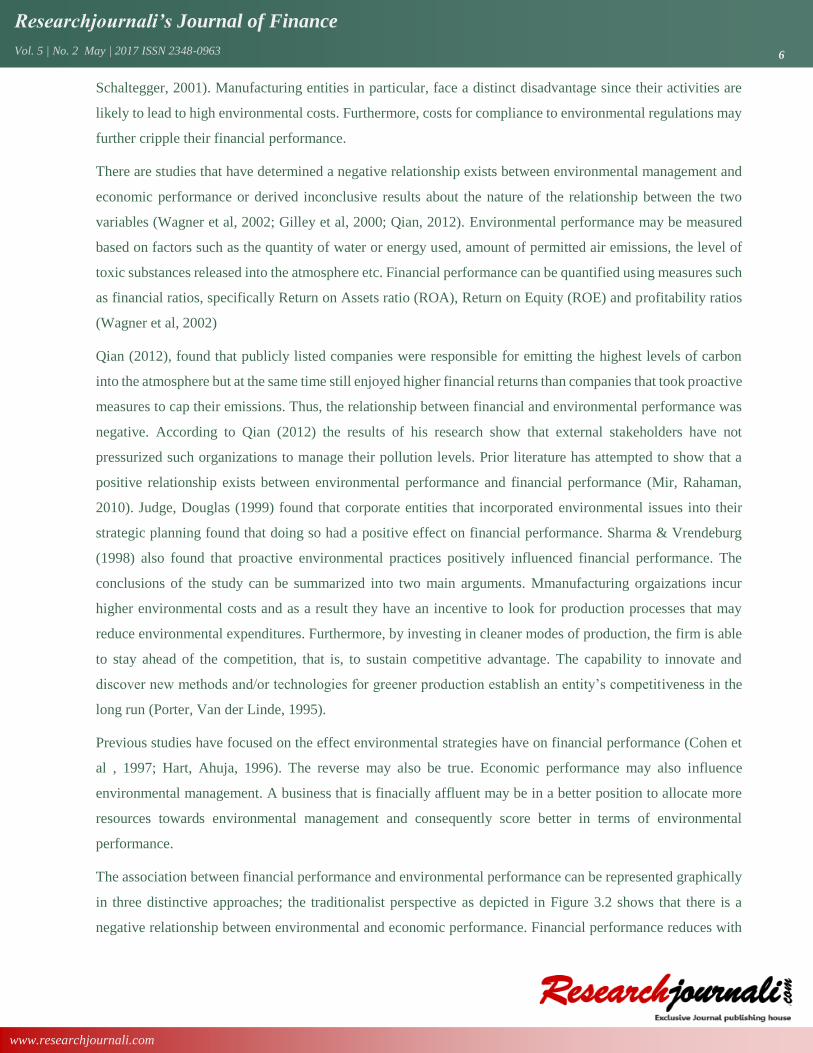
The association between financial performance and environmental performance can be represented graphically
in three distinctive approaches; the traditionalist perspective as depicted in Figure 3.2 shows that there is a
negative relationship between environmental and economic performance. Financial performance reduces with
Researchjournali’s Journal of Finance
Vol. 5 | No. 2 May | 2017 ISSN 2348-0963 7
www.researchjournali.com
increased environmental performance. The argument is that businesses that spend copious amounts of financial
resources on environmental management do so at the expense of financial well-being (Wagner & Schaltegger,
2001).
Figure 3.2: The traditionalist view
Eco
no
mic
Pe
rfo
rman
ce
Environmental performance
Source: (Wagner et al, 2001)
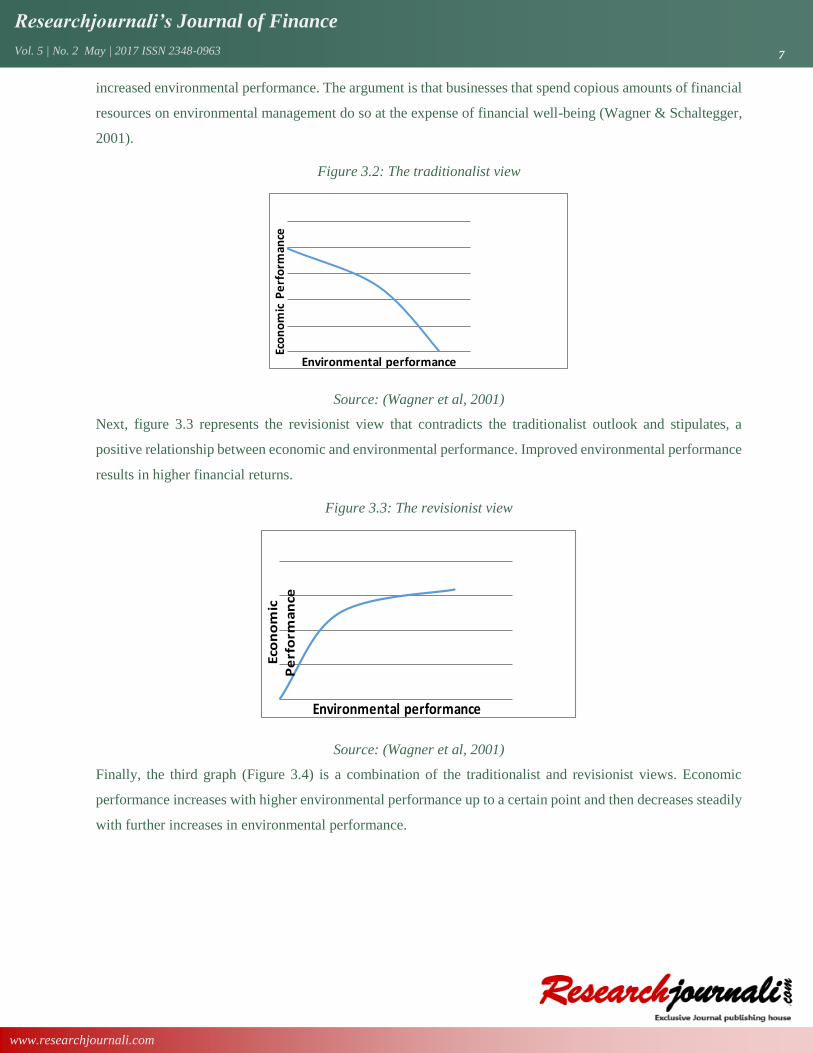
Next, figure 3.3 represents the revisionist view that contradicts the traditionalist outlook and stipulates, a
positive relationship between economic and environmental performance. Improved environmental performance
results in higher financial returns.
Figure 3.3: The revisionist view
Eco
no
mic
P
erf
orm
an
ce
Environmental performance
Source: (Wagner et al, 2001)
Finally, the third graph (Figure 3.4) is a combination of the traditionalist and revisionist views. Economic
performance increases with higher environmental performance up to a certain point and then decreases steadily
with further increases in environmental performance.

Researchjournali’s Journal of Finance
Vol. 5 | No. 2 May | 2017 ISSN 2348-0963 8
www.researchjournali.com
Figure 3.4: Combination of the traditionalist and revisionist perspectives
Eco
no
mic
P
erf
orm
an
ceEnvironmental performance
Source: (Wagner et al, 2001)
Schaltegger, Synnestvedt (2002), state that the best level of environmental performance (i.e. point before the
decline in economic performance) would be that recommended by environmental legislation. If their
proposition holds true, it means there would be no value in using proactive techniques or methods to improve
environmental performance beyond regulations.
3.4 ADOPTION OF ENVIRONMENTAL MANAGEMENT ACCOUNTING (EMA) PRACTICES
Though the use of EMA among manufacturing entities is not standardized, there are certain aspects that
characterize the adoption of EMA practices. Firstly, organizations that use EMA must be able to identify and
measure environmental costs (Debnath, Bose, & Dhalla, 2012). Studies describe EMA as environmental cost
accounting (ECA). Thus, for an organization to claim it has adopted EMA, it must separate environmental costs
from general overheads or operational costs (Holst, 1996; Schaltegger, Hahn, Burritt, 2000; Khalid, Dixon,
2012; UNDSD, 2001). Hence the first characteristic of adoption of EMA is the identification and categorization
of environmental expenditures.
According to Chang (2007), conventional management accounting techniques are inadequately designed to
assimilate environmental-related information such as environmental costs into accounting systems. However,
organizations that have adopted EMA practices still use common management accounting techniques such as
full cost accounting (FCA), life cycle assessment (LCA) and activity based costing (ABC) to measure both
current and potential environmental costs. LCA for example, was originally designed to determine the actual
costs of a product throughout its life cycle. In the same way, LCA can be used to establish specific
environmental externalities associated with producing a product (during its entire life) such as water effluents,
air emissions etc. This information can then be utilized by management to reduce the deteriorating effects such
production has on the environment.

Researchjournali’s Journal of Finance
Vol. 5 | No. 2 May | 2017 ISSN 2348-0963 9
www.researchjournali.com
Prior studies suggest that EMA practices are not homogeneously applied within the manufacturing industry
(Buysse & Verbeke, 2003; Jalaludin, Maliah, & Ahmad, 2011). The levels or degree of implementation of EMA
depend on the firm’s orientation towards environmental issues and its environmental strategies. The resource
based theory put forward by Hart (1995) explains this disparity in levels of adoption, by drawing a distinction
between businesses that have proactive environmental management strategies and those that take a reactive
stance towards environmental management. Businesses that are reactive are said to use an end of pipe approach
to solve environmental problems. Such entities assign limited resources to environmental activities and as such
their levels of adoption are low. Notably, research conducted by Setthasako (2010) and Qian, Burritt(2010)
concluded that reactive firms only used EMA to fulfill legal environmental requirements.
3.5 EMPIRICAL REVIEW
Multiple studies on environmental accounting have been done in order to establish the responsibility the
accounting profession has in supporting global efforts to conserve the earth’s ecosystem (Bennett, James, 2000;
Bartolomeo et al , 2000; Debnath, Bose et al, 2012). Determining the association between ecological problems
and the practice of accounting is complex, specifically because environmental impacts or effects are difficult to
measure and control (Maunders, Burritt, 1991). It is apparent that companies must develop deeper
comprehension of the costs and benefits arising from an entity’s interaction with the environment (Bartolomeo,
2000)
Consider the going concern assumption of accounting that assumes a business will be in operation in the
foreseeable future (IAS 1, 2011). Orthodox accounting methods are unable to provide for potential
environmental calamities and their consequent effects on a corporation’s capacity to remain in operation as a
going concern (Baumol, 1993) The Deepwater Horizon oil spill(or the British Petroleum oil spill) of 2010 for
instance, is taken to be the largest accidental oil spill ever to occur in the petroleum sector covering 68,000
square miles of sea (Deepwater Horizon Marine Casualty Investigation Report, 2011).The cost of cleaning up
the spill amounted to $40.9 billion and BP reported a $5 billion dollar loss during 2010. Though this incidence
was an extreme case, companies must be able to use accounting methods to estimate the potential contingencies
that may arise from their interaction with the natural ecosystem.
Information relating to the environment can serve both an ex-post and an ex-ante function. When accounting
methods are used to identify and provide measures to lessen contingent or future costs that may arise from
externalities such as oil spills, emissions of toxic gases into the atmosphere, etc., then such information serves
an ex-ante role. On the other hand, if accounting procedures are used to measure the costs incurred as a result
of negative environmental activities caused by the entity, then such information is ex-post e.g. carbon taxes
incurred as a direct result of air pollution (Maunders, K, et al, 2000).
Researchjournali’s Journal of Finance
Vol. 5 | No. 2 May | 2017 ISSN 2348-0963 10
www.researchjournali.com
The origin of environmental accounting (EA) can be traced back to the 1970s following elevated public
consciousness regarding the state of the environment (Hecht, 2000). It became clear that financial reports did
not provide detailed information related to an organization’s interaction with its surrounding environment.
Initially, EA leaned towards public disclosure of environmental information suggesting a bias to financial
accounting (Christmann, 2000). Perhaps the reason for the focus on financial reporting was because
organizations were anxious to prove their credibility to investors based on environmental-related information
disclosed in the financial statements (Medley, 1997).
Management accounting techniques, originally tailored to meet the needs of internal management, failed to
incorporate environmental issues embedded within the organization. Thus, EMA was developed out of
corporate EA to address the managerial accounting aspects surrounding environmental performance (Debnath,
et al, 2012). EMA could now be used by managers of corporations to isolate environmental expenses concealed
in accounting systems to achieve cost reductions and ultimately attain an edge over other businesses
(Setthasako, 2010).
Presently, there is no international agreement or uniform standard that outlines the scope or definition of EMA
(Setthasako, 2010). Nevertheless, the United Nations Division for Sustainable Development (UNDSD) has
published a document providing guidelines for EMA application for national governments interested in
environmental accountability (UNDSD, 2001). The International Federation of Accountants (IFAC) has also
published an international guidance document on EMA outlining the uses and benefits related to the adoption
of EMA practices (IFAC, 2005).
4.0 DATA ANALYSIS/ FINDINGS
4.1 INTRODUCTION
This chapter comprises of data analysis, findings and interpretation. Results are presented in tables and
diagrams. The analyzed data was arranged under themes that reflect the research objectives.
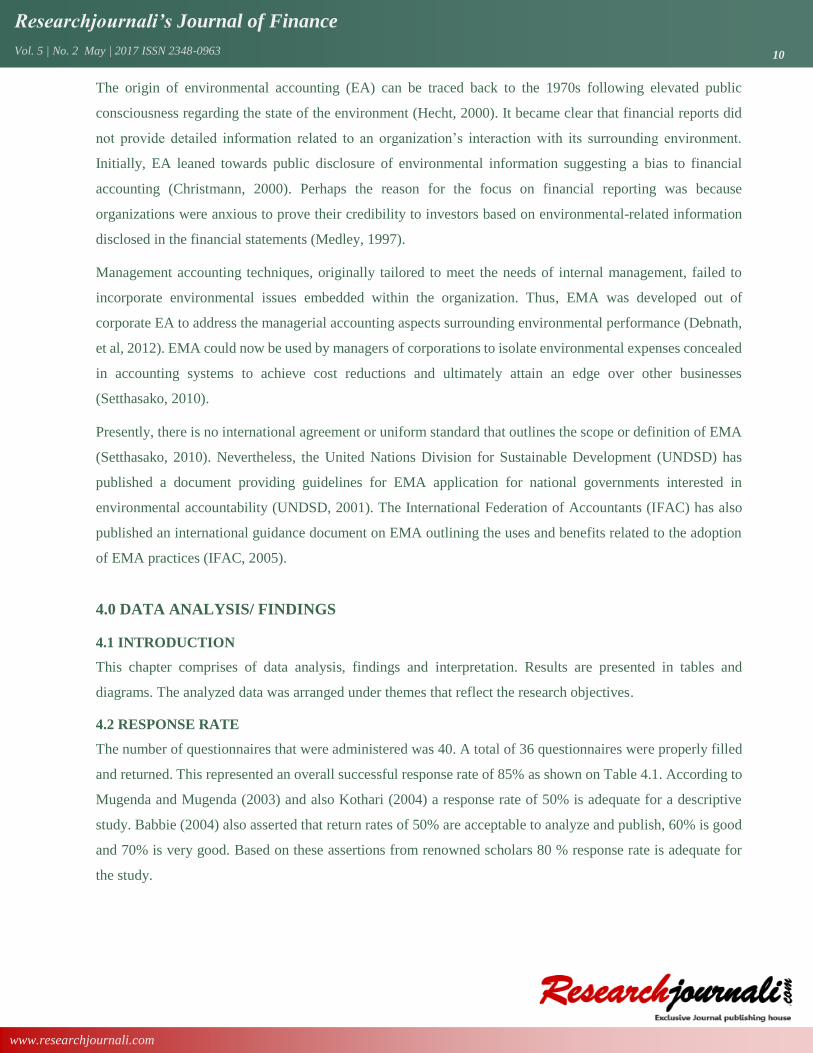
4.2 RESPONSE RATE
The number of questionnaires that were administered was 40. A total of 36 questionnaires were properly filled
and returned. This represented an overall successful response rate of 85% as shown on Table 4.1. According to
Mugenda and Mugenda (2003) and also Kothari (2004) a response rate of 50% is adequate for a descriptive
study. Babbie (2004) also asserted that return rates of 50% are acceptable to analyze and publish, 60% is good
and 70% is very good. Based on these assertions from renowned scholars 80 % response rate is adequate for
the study.
Researchjournali’s Journal of Finance
Vol. 5 | No. 2 May | 2017 ISSN 2348-0963 11
www.researchjournali.com
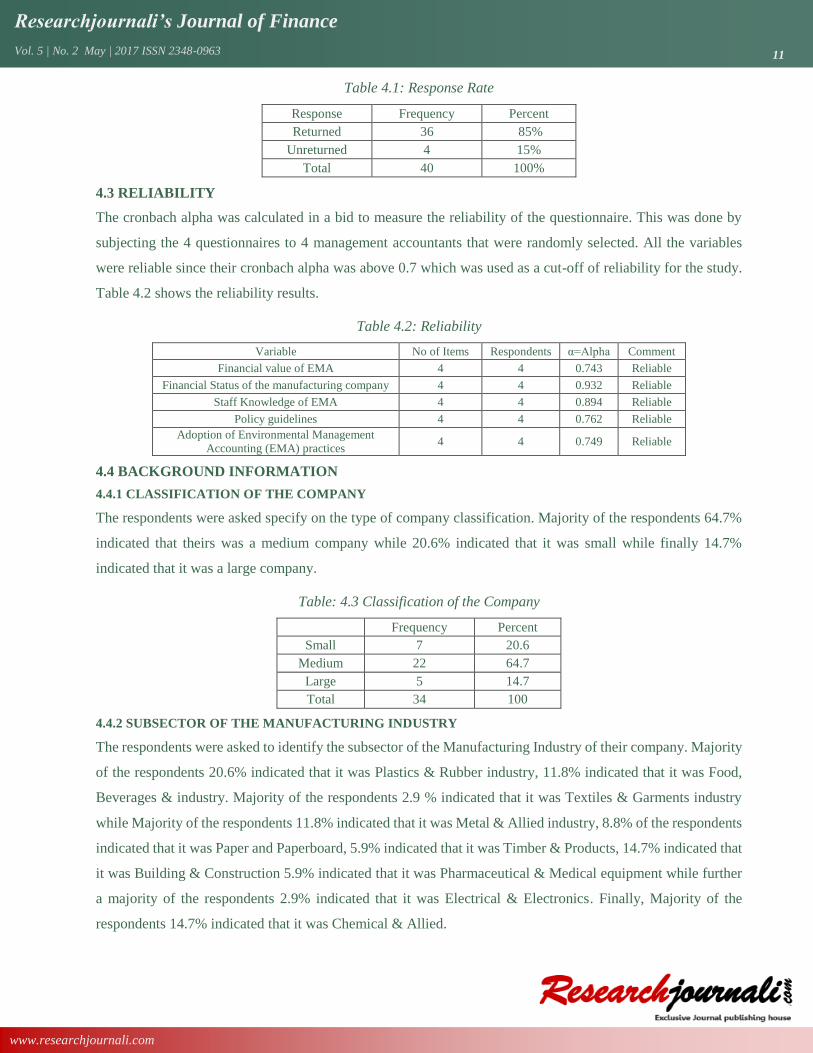
Table 4.1: Response Rate
Response Frequency Percent
Returned 36 85%
Unreturned 4 15%
Total 40 100%
4.3 RELIABILITY
The cronbach alpha was calculated in a bid to measure the reliability of the questionnaire. This was done by
subjecting the 4 questionnaires to 4 management accountants that were randomly selected. All the variables
were reliable since their cronbach alpha was above 0.7 which was used as a cut-off of reliability for the study.
Table 4.2 shows the reliability results.
Table 4.2: Reliability
Variable No of Items Respondents α=Alpha Comment
Financial value of EMA 4 4 0.743 Reliable
Financial Status of the manufacturing company 4 4 0.932 Reliable
Staff Knowledge of EMA 4 4 0.894 Reliable
Policy guidelines 4 4 0.762 Reliable
Adoption of Environmental Management
Accounting (EMA) practices 4 4 0.749 Reliable
4.4 BACKGROUND INFORMATION
4.4.1 CLASSIFICATION OF THE COMPANY
The respondents were asked specify on the type of company classification. Majority of the respondents 64.7%
indicated that theirs was a medium company while 20.6% indicated that it was small while finally 14.7%
indicated that it was a large company.
Table: 4.3 Classification of the Company
Frequency Percent
Small 7 20.6
Medium 22 64.7
Large 5 14.7
Total 34 100
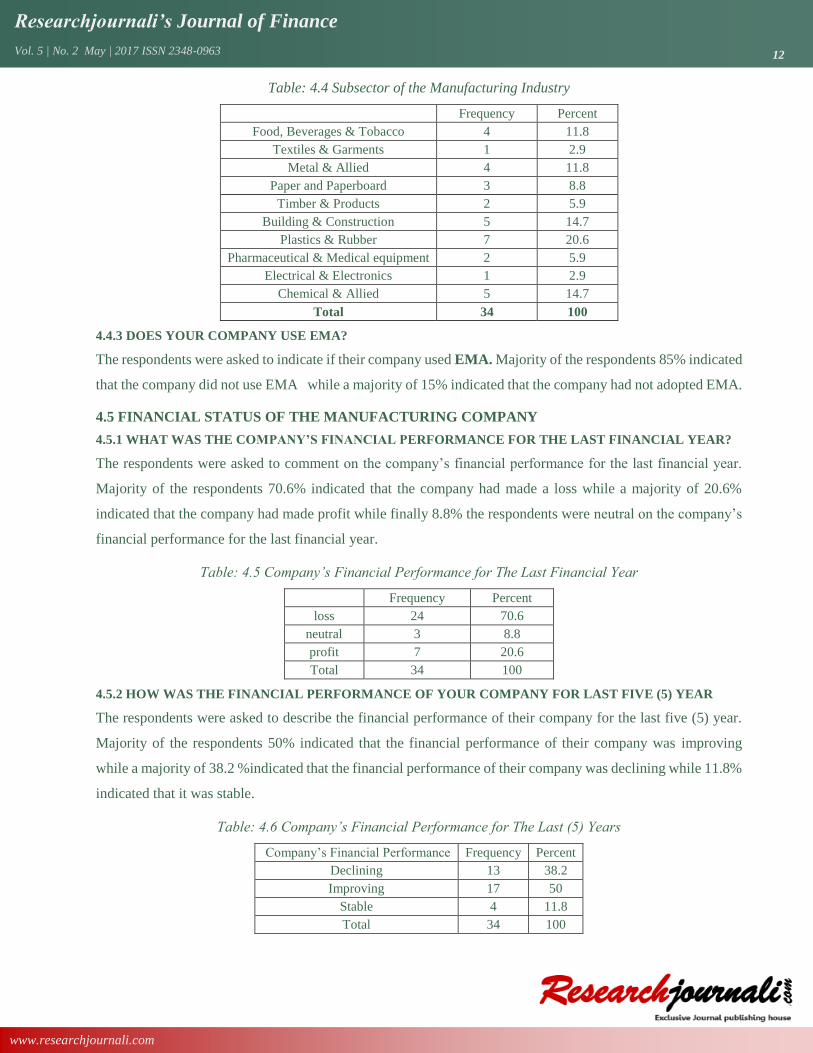
4.4.2 SUBSECTOR OF THE MANUFACTURING INDUSTRY
The respondents were asked to identify the subsector of the Manufacturing Industry of their company. Majority
of the respondents 20.6% indicated that it was Plastics & Rubber industry, 11.8% indicated that it was Food,
Beverages & industry. Majority of the respondents 2.9 % indicated that it was Textiles & Garments industry
while Majority of the respondents 11.8% indicated that it was Metal & Allied industry, 8.8% of the respondents
indicated that it was Paper and Paperboard, 5.9% indicated that it was Timber & Products, 14.7% indicated that
it was Building & Construction 5.9% indicated that it was Pharmaceutical & Medical equipment while further
a majority of the respondents 2.9% indicated that it was Electrical & Electronics. Finally, Majority of the
respondents 14.7% indicated that it was Chemical & Allied.
Researchjournali’s Journal of Finance
Vol. 5 | No. 2 May | 2017 ISSN 2348-0963 12
www.researchjournali.com
Table: 4.4 Subsector of the Manufacturing Industry
Frequency Percent
Food, Beverages & Tobacco 4 11.8
Textiles & Garments 1 2.9
Metal & Allied 4 11.8
Paper and Paperboard 3 8.8
Timber & Products 2 5.9
Building & Construction 5 14.7
Plastics & Rubber 7 20.6
Pharmaceutical & Medical equipment 2 5.9
Electrical & Electronics 1 2.9
Chemical & Allied 5 14.7
Total 34 100
4.4.3 DOES YOUR COMPANY USE EMA?
The respondents were asked to indicate if their company used EMA. Majority of the respondents 85% indicated
that the company did not use EMA while a majority of 15% indicated that the company had not adopted EMA.
4.5 FINANCIAL STATUS OF THE MANUFACTURING COMPANY
4.5.1 WHAT WAS THE COMPANY’S FINANCIAL PERFORMANCE FOR THE LAST FINANCIAL YEAR?
The respondents were asked to comment on the company’s financial performance for the last financial year.
Majority of the respondents 70.6% indicated that the company had made a loss while a majority of 20.6%
indicated that the company had made profit while finally 8.8% the respondents were neutral on the company’s
financial performance for the last financial year.
Table: 4.5 Company’s Financial Performance for The Last Financial Year
Frequency Percent
loss 24 70.6
neutral 3 8.8
profit 7 20.6
Total 34 100
4.5.2 HOW WAS THE FINANCIAL PERFORMANCE OF YOUR COMPANY FOR LAST FIVE (5) YEAR
The respondents were asked to describe the financial performance of their company for the last five (5) year.
Majority of the respondents 50% indicated that the financial performance of their company was improving
while a majority of 38.2 %indicated that the financial performance of their company was declining while 11.8%
indicated that it was stable.
Table: 4.6 Company’s Financial Performance for The Last (5) Years
Company’s Financial Performance Frequency Percent
Declining 13 38.2
Improving 17 50
Stable 4 11.8
Total 34 100
Researchjournali’s Journal of Finance
Vol. 5 | No. 2 May | 2017 ISSN 2348-0963 13
www.researchjournali.com
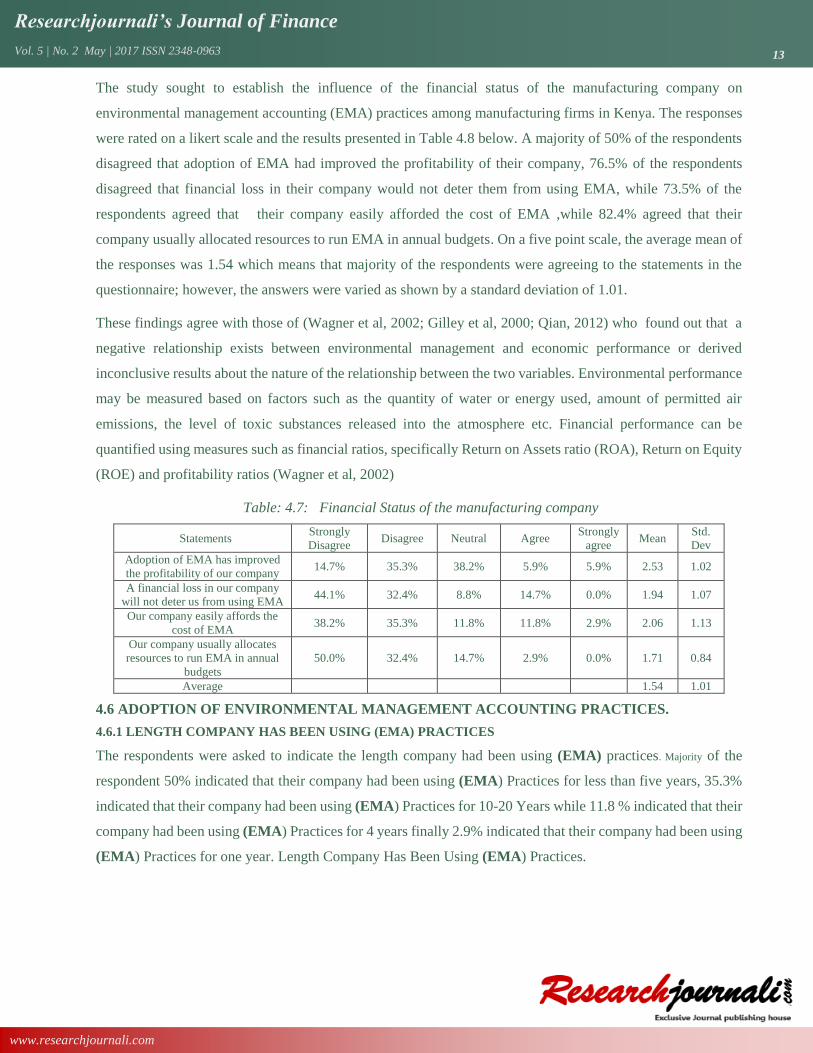
The study sought to establish the influence of the financial status of the manufacturing company on
environmental management accounting (EMA) practices among manufacturing firms in Kenya. The responses
were rated on a likert scale and the results presented in Table 4.8 below. A majority of 50% of the respondents
disagreed that adoption of EMA had improved the profitability of their company, 76.5% of the respondents
disagreed that financial loss in their company would not deter them from using EMA, while 73.5% of the
respondents agreed that their company easily afforded the cost of EMA ,while 82.4% agreed that their
company usually allocated resources to run EMA in annual budgets. On a five point scale, the average mean of
the responses was 1.54 which means that majority of the respondents were agreeing to the statements in the
questionnaire; however, the answers were varied as shown by a standard deviation of 1.01.
These findings agree with those of (Wagner et al, 2002; Gilley et al, 2000; Qian, 2012) who found out that a
negative relationship exists between environmental management and economic performance or derived
inconclusive results about the nature of the relationship between the two variables. Environmental performance
may be measured based on factors such as the quantity of water or energy used, amount of permitted air
emissions, the level of toxic substances released into the atmosphere etc. Financial performance can be
quantified using measures such as financial ratios, specifically Return on Assets ratio (ROA), Return on Equity
(ROE) and profitability ratios (Wagner et al, 2002)
Table: 4.7: Financial Status of the manufacturing company
Statements Strongly
Disagree Disagree Neutral Agree
Strongly
agree Mean
Std.
Dev
Adoption of EMA has improved
the profitability of our company 14.7% 35.3% 38.2% 5.9% 5.9% 2.53 1.02
A financial loss in our company
will not deter us from using EMA 44.1% 32.4% 8.8% 14.7% 0.0% 1.94 1.07
Our company easily affords the
cost of EMA 38.2% 35.3% 11.8% 11.8% 2.9% 2.06 1.13
Our company usually allocates
resources to run EMA in annual
budgets
50.0% 32.4% 14.7% 2.9% 0.0% 1.71 0.84
Average 1.54 1.01
4.6 ADOPTION OF ENVIRONMENTAL MANAGEMENT ACCOUNTING PRACTICES.
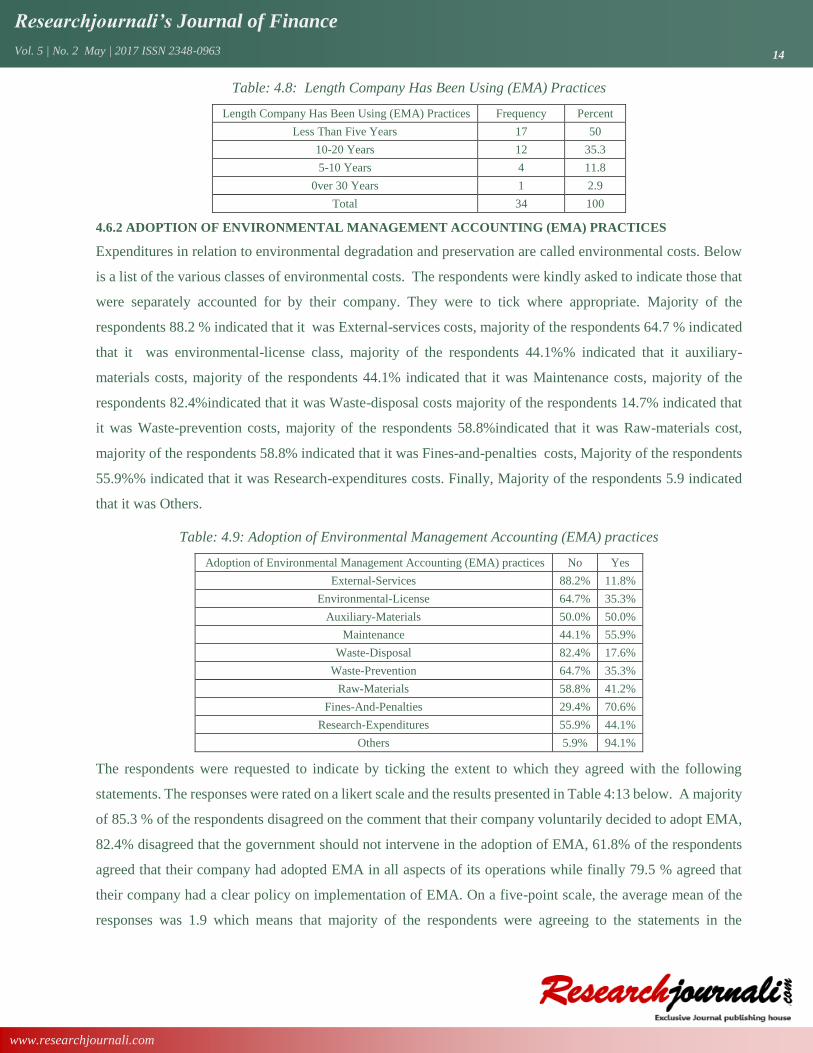
4.6.1 LENGTH COMPANY HAS BEEN USING (EMA) PRACTICES
The respondents were asked to indicate the length company had been using (EMA) practices. Majority of the
respondent 50% indicated that their company had been using (EMA) Practices for less than five years, 35.3%
indicated that their company had been using (EMA) Practices for 10-20 Years while 11.8 % indicated that their
company had been using (EMA) Practices for 4 years finally 2.9% indicated that their company had been using
(EMA) Practices for one year. Length Company Has Been Using (EMA) Practices.
Researchjournali’s Journal of Finance
Vol. 5 | No. 2 May | 2017 ISSN 2348-0963 14
www.researchjournali.com
Table: 4.8: Length Company Has Been Using (EMA) Practices
Length Company Has Been Using (EMA) Practices Frequency Percent
Less Than Five Years 17 50
10-20 Years 12 35.3
5-10 Years 4 11.8
0ver 30 Years 1 2.9
Total 34 100
4.6.2 ADOPTION OF ENVIRONMENTAL MANAGEMENT ACCOUNTING (EMA) PRACTICES
Expenditures in relation to environmental degradation and preservation are called environmental costs. Below
is a list of the various classes of environmental costs. The respondents were kindly asked to indicate those that
were separately accounted for by their company. They were to tick where appropriate. Majority of the
respondents 88.2 % indicated that it was External-services costs, majority of the respondents 64.7 % indicated
that it was environmental-license class, majority of the respondents 44.1%% indicated that it auxiliary-
materials costs, majority of the respondents 44.1% indicated that it was Maintenance costs, majority of the
respondents 82.4%indicated that it was Waste-disposal costs majority of the respondents 14.7% indicated that
it was Waste-prevention costs, majority of the respondents 58.8%indicated that it was Raw-materials cost,
majority of the respondents 58.8% indicated that it was Fines-and-penalties costs, Majority of the respondents
55.9%% indicated that it was Research-expenditures costs. Finally, Majority of the respondents 5.9 indicated
that it was Others.
Table: 4.9: Adoption of Environmental Management Accounting (EMA) practices
Adoption of Environmental Management Accounting (EMA) practices No Yes
External-Services 88.2% 11.8%
Environmental-License 64.7% 35.3%
Auxiliary-Materials 50.0% 50.0%
Maintenance 44.1% 55.9%
Waste-Disposal 82.4% 17.6%
Waste-Prevention 64.7% 35.3%
Raw-Materials 58.8% 41.2%
Fines-And-Penalties 29.4% 70.6%
Research-Expenditures 55.9% 44.1%
Others 5.9% 94.1%
The respondents were requested to indicate by ticking the extent to which they agreed with the following
statements. The responses were rated on a likert scale and the results presented in Table 4:13 below. A majority
of 85.3 % of the respondents disagreed on the comment that their company voluntarily decided to adopt EMA,
82.4% disagreed that the government should not intervene in the adoption of EMA, 61.8% of the respondents
agreed that their company had adopted EMA in all aspects of its operations while finally 79.5 % agreed that
their company had a clear policy on implementation of EMA. On a five-point scale, the average mean of the
responses was 1.9 which means that majority of the respondents were agreeing to the statements in the

Researchjournali’s Journal of Finance
Vol. 5 | No. 2 May | 2017 ISSN 2348-0963 15
www.researchjournali.com
questionnaire; however, the answers were varied as shown by a standard deviation of 1.0. These findings agree
with those Chang (2007), conventional management accounting techniques are inadequately designed to
assimilate environmental-related information such as environmental costs into accounting systems. However,
organizations that have adopted EMA practices still use common management accounting techniques such as
full cost accounting (FCA), life cycle assessment (LCA) and activity based costing (ABC) to measure both
current and potential environmental costs. LCA for example, was originally designed to determine the actual
costs of a product throughout its life cycle. In the same way, LCA can be used to establish specific
environmental externalities associated with producing a product (during its entire life) such as water effluents,
air emissions etc. This information can then be utilized by management to reduce the deteriorating effects such
production has on the environment.
Table: 4.10: Adoption of Environmental Management Accounting (EMA) practices
Statements Strongly
Disagree Disagree Neutral Agree
Strongly
agree Mean
Std.
Dev
Our company voluntarily decided
to adopt EMA 58.8% 26.5% 11.8% 2.9% 0.0% 1.6 0.8
I think the government should not
intervene in the adoption of EMA 47.1% 35.3% 11.8% 2.9% 2.9% 1.8 1.0
Our company has adopted EMA in
all aspects of its operations 32.4% 29.4% 23.5% 14.7% 0.0% 2.2 1.1
Our company has a clear policy on
implementation of EMA 47.1% 32.4% 5.9% 11.8% 2.9% 1.9 1.1
Average 1.9 1.0
Table 4.11: Correlation Analysis
Financial Status Pearson Correlation .516** 1 .584** .844** .805** Sig. (2-tailed) 0.002 0 0 0.00
The Table 4.15 presents the results of the correlation analysis. The results indicate that Financial Status and
Adoption of EMA are positively and significant related (r=0.256, p=0.019
These findings are consistent with those Research studies such as those carried out by Burritt & Saka(2006);
Masanet-LLodra(2006); Ferreira, Moulang, & Hendro(2010) which have shown that there are multiple
advantages accruing to organizations that apply EMA. For instance, a positive association was discovered
between the use of EMA and process modernization implying that firms that have implemented EMA are likely
to have modified production processes and ultimately lower costs of production (e.g. reduced input expenses
resulting from recycling of raw materials) (Masanet-LLodra, 2006; Porter & Esty, 1998).Moreover, Hart &
Ahuja (1996) concluded that environmental accounting practices such as EMA have a positive influence on the
economic performance of companies.
Researchjournali’s Journal of Finance
Vol. 5 | No. 2 May | 2017 ISSN 2348-0963 16
www.researchjournali.com
5. CONCLUSION
The regression results revealed that that Financial Status and Adoption of EMA are positively and significant
related (r=0.652 p=0.011). This means that a unitary increase in the Financial Status leads to an increase in
Adoption of EMA. Some of the empirical studies supporting our findings include (Porter, Van der Linde, 1995.
Prior literature has also attempted to show that a positive relationship exists between environmental
performance and financial performance (Mir, Rahaman, 2010). Judge, Douglas (1999) found that corporate
entities that incorporated environmental issues into their strategic planning found that doing so had a positive
effect on financial performance. Sharma & Vrendeburg (1998) also found that proactive environmental
practices positively influenced financial performance. The conclusions of the study can be summarized into two
main arguments. Firstly, manufacturing orgaizations incur higher environmental costs and as a result they have
an incentive to look for production processes that may reduce environmental expenditures. Furthermore, by
investing in cleaner modes of production, the firm is able to stay ahead of the competition, that is, to sustain
competitive advantage. The capability to innovate and discover new methods and/or technologies for greener
production establish an entity’s competitiveness in the long run.
The study recommended that a company should always encourage EMA practices consistently. This is because
continuous adoption of EMA leads to increased financial status thus promoting the company’s portfolio image.
6. REFERENCES
Jalaludin, D., Maliah, S., & Ahmad, N. N. (2011). Understanding environmental management accounting (EMA) adoption: a new
institutional sociology perspective. Social Responsibility Journal , 540-557.
Schaltegger, S., Burritt, R., & Peterson, H. (2003). An Introduction to Corporate Environmental Management; Striving for
Sustainability. Sheffield, UK: Greenleaf Publishing Limited.
Qian, W., & Burritt, R. (2010). Environmental management accounting in local management: A case of waste management. Accounting,
Auditing and Accountability Journal , 93-128.
Gadenne, D., Kennedy, J., & McKeiver, C. (2009). An Empirical Study of Environmental Awareness and Practices in SMEs. Journal
of Business Ethics , 45-63.
Buysse, K., & Verbeke, A. (2003). Proactive Environmental Strategies: A Stakeholder Management Perspective . Strategic Management
Journal , 453-470.