Embed Size (px)
Citation preview

FACTORS INFLUENCING TEACHER ATTRITION IN THE UNITED ARAB EMIRATES
by
Ali S. Al Kaabi
Bachelor in Education, United Arab Emirates University, 1996
Master’s Degree in Education, University of Pittsburgh, 2001
Submitted to the Graduate Faculty of
School of Education in partial fulfillment
of the requirements for the degree of
Doctor of Philosophy
University of Pittsburgh
2005

UNIVERSITY OF PITTSBURGH
This dissertation was presented
by
Ali Saeed Al Kaabi
It was defended on
April 21, 2005
and approved by
Dr. Eichelberger, R. Tony
Dr. McClure, Maureen
Dr. Pingel, Louis A.
Dr. Zullo, Thomas
Dr. Bickel, WilliamDissertation Director
ii

Factors Influencing Teacher Attrition In the United Arab Emirates
Ali S. Al Kaabi, PhD
University of Pittsburgh, 2005
The purpose of this study was to examine the factors associated with high attrition rate
among the UAE citizen teachers who teach in public schools grades 1-12. The factors that this
study investigated are: personal factors, economic factors, teacher preparation, employment
factors, and social-cultural factors. The study was guided by five research questions. Data for
this study was collected through two methods: a survey questionnaire that was sent to the sample
of this study was 594 UAE citizen teachers in the public schools, and a constructed interview
with five educational zone directors. To analyze the quantitative data descriptive statistics
(means, percentage, and standard deviations), and Chi-Square Test were applied to examine the
relation between the most important factors and teachers gender, qualifications, and years of
experience. Qualitative analysis was applied to interpret the data obtained from the interviews
with five educational zone directors and open-ended questions from the last part of the
questionnaire.
The result of this study indicated that the most important factors associated with teacher
attrition are: (a) The personal factors that have the highest effect on teacher attrition are “stress”
with mean (3.31), and "accountability" with mean (3.19). (b) The economic factor that has the
highest effect on teacher attrition is “incentives” with mean (3.23). (c) The employment factor
that has the highest effect on teacher attrition is “paperwork” with mean (3.07). (d) The social-
cultural factor that has the highest effect on teacher attrition is “social appreciation” with mean
iii

(3.07). The result indicated that teacher preparation factors are the least important factors
associated with teacher attrition with a very low mean (2.10).
iv

ACKNOWLEDGMENT
First and foremost to Allah, the creator of all things, for giving me the strength and ability
to conduct this study.
I would like to acknowledge, with sincere gratitude, the roles played by those persons
who assisted in making this dissertation a worthwhile experience. My profound thanks and
appreciation to my academic advisor and chairman of my doctoral committee, Dr. William
Bickel for his patience, guidance, excellent and efficient supervision, valuable advice,
suggestions, and encouragement.
I would like also to express my gratitude to other committee members for their beneficial
criticism and valuable suggestions. Great thanks are due to Dr. Tony Eichelberger for his
valuable comments and suggestions. A special thank also goes to Dr. Louis Pingel for his always
willingness to help and answering any question. Dr. Thomas Zullo will be always remembered
for his helpful comments and great suggestions. Other special thanks are due to Dr. Maureen
McClure for her help and support with work on this dissertation and during my graduate studies.
Great thanks are due to those who helped in collecting the data for this study. I am very
grateful to my brother Salem, my sister in law Afaf, my niece Nadia and my friend Saeed Hamad
for their help. Also, I would like to express my gratitude to my friend Husam Zaman for his
valuable comments and suggestions in analyzing the data.
Great thanks to my father and my family members for their help, support and love.
v

DEDICATION
This dissertation is lovingly dedicated to my mother who lost her fight against the illness while I was studying abroad. Your love, smile, and wisdom will never pass away.
To Noura- To whom I owe the leaping delight That quickens my senses in our wakingtime And the rhythm that governs the repose of our sleepingtime, The breathing in unison.
Of lovers whose bodies smell of each other Who think the same thoughts without need of speech, And babble the same speech without need of meaning...
No peevish winter wind shall chill No sullen tropic sun shall wither The roses in the rose-garden which is ours and ours only
But this dedication is for others to read: These are private words addressed to you in public.
"by T.S. Eliot"
vi

TABLE OF CONTENTS PREFACE......................................................................................Error! Bookmark not defined. 1. Chapter I.................................................................................................................................. 1
1.1. Introduction..................................................................................................................... 1 1.1.1. The Problem Background ....................................................................................... 1 1.1.2. Definitions of Attrition ........................................................................................... 2 1.1.3. Worldwide Problem................................................................................................ 2
1.2. Statement of the Problem................................................................................................ 4 1.3. Conceptual Framework................................................................................................... 4 1.4. The Purpose of the Study................................................................................................ 6 1.5. Research Questions......................................................................................................... 6 1.6. Thesis .............................................................................................................................. 7 1.7. Research Tradition .......................................................................................................... 7 1.8. Methodology................................................................................................................... 7 1.9. Significance of the Study................................................................................................ 8 1.10. Delimitation ................................................................................................................ 8 1.11. Limitation.................................................................................................................... 9 1.12. Term Definition .......................................................................................................... 9
2. Chapter 2............................................................................................................................... 11 2.1. Introduction:.................................................................................................................. 11 2.2. Section 1: Why some people leave their profession? ................................................... 11
2.2.1. Introduction........................................................................................................... 11 2.2.2. Why teach: The Appeals Theory .......................................................................... 12 2.2.3. Career Mobility Theory ........................................................................................ 14 2.2.4. Human Capital Theory.......................................................................................... 16
2.3. Section II: Previous Studies .......................................................................................... 18 2.3.1. Introduction........................................................................................................... 18 2.3.2. Model I: Three Major Factors............................................................................... 20 2.3.3. Model II: Four Major Factors (Human Capital) ................................................... 24 2.3.4. Model III: Four Major Categories......................................................................... 26
2.3.4.1. Monetary Factor............................................................................................ 26 2.3.4.2. Work Condition Factor ................................................................................. 30 2.3.4.3. Teacher preparation Factor ........................................................................... 32 2.3.4.4. Social Factor ................................................................................................. 33
2.3.5. Model IV: Multiple Studies, Multiple Factors...................................................... 35 2.3.5.1. Summary ....................................................................................................... 46
2.4. Section III: Factors of Teacher Attrition in the UAE ................................................... 47 2.4.1. Country Background............................................................................................. 47 2.4.2. Education in UAE................................................................................................. 48 2.4.3. Teacher Situation .................................................................................................. 49 2.4.4. Teacher: Power and Culture.................................................................................. 50 2.4.5. Teacher: Promotion Culture.................................................................................. 51 2.4.6. Factors of Teacher Attrition in UAE .................................................................... 52
2.4.6.1. Family Pressure............................................................................................. 52
vii
2.4.6.2. Prestige.......................................................................................................... 53 2.4.6.3. Workload....................................................................................................... 53
3. Chapter III............................................................................................................................. 54 Method .......................................................................................................................................... 54
3.1. Introduction................................................................................................................... 54 3.2. Research Questions....................................................................................................... 54 3.3. Research Design............................................................................................................ 55 3.4. Sample........................................................................................................................... 56 3.5. Instrumentation ............................................................................................................. 57 3.6. Data collection procedures............................................................................................ 58 3.7. Data entering................................................................................................................. 59 3.8. Data Analysis ................................................................................................................ 60 3.9. Validity ......................................................................................................................... 60 3.10. Pilot ........................................................................................................................... 61
4. CHAPTER IV ....................................................................................................................... 62 4.1. Introduction................................................................................................................... 62 4.2. Demographic Information about the Participants ......................................................... 63 4.3. Part I: Quantitative Part ................................................................................................ 67
4.3.1. Personal Factors .................................................................................................... 67 4.3.2. Economic Factors.................................................................................................. 73 4.3.3. Employment Factors ............................................................................................. 79 4.3.4. Teacher Preparation Factors ................................................................................. 87 4.3.5. Social-Cultural Factor........................................................................................... 93 4.3.6. Open-ended Question............................................................................................ 98
4.4. Part II: Constructed Interviews Analysis .................................................................... 100 4.4.1. Interview Question 1........................................................................................... 100 4.4.2. Interview Question 2:.......................................................................................... 100 4.4.3. Interview Question 3........................................................................................... 101
4.5. Summary ..................................................................................................................... 102 5. CHAPTER V ...................................................................................................................... 104
5.1. Summary of the study ................................................................................................. 104 5.2. Discussion and Conclusion ......................................................................................... 106
5.2.1. Personal Factors .................................................................................................. 106 5.2.2. Economic Factors................................................................................................ 106 5.2.3. Employment Factors ........................................................................................... 107 5.2.4. Teachers Preparation Factors................................................................................. 108 5.2.5. Social-Cultural Factors ....................................................................................... 109 5.2.6. Other Important Findings.................................................................................... 110
5.3. Suggestions and Implications ..................................................................................... 112 5.3.1. Personal Factors .................................................................................................. 112 5.3.2. Economic Factors................................................................................................ 112 5.3.3. Employment Factors ........................................................................................... 113 5.3.4. Teachers Preparation Factors.............................................................................. 113 5.3.5. Social-Cultural Factors ....................................................................................... 114 5.3.6. Other Important Findings.................................................................................... 114
5.4. Recommendations for Further Studies........................................................................ 115
viii

APPENDIX................................................................................................................................. 117 BIBLIOGRAPHY....................................................................................................................... 120
ix

1. Chapter I
1.1. Introduction
1.1.1. The Problem Background
The high incidence of teacher attrition is one of the most harmful situations occurring in
educational systems in recent years. Countries around the world (developed and developing
alike) are facing this problem. In some countries, the rate of attrition has reached a critical point.
In the USA, data indicate that the increasing rate of teacher attrition has become a real problem
for policy makers. For example, between the 1993-1994 and the 1994-1995 school years, six
percent of full-time public school teachers and 10 percent of full-time private school teachers left
teaching (Baker & Smith, 1997). According to Stinebrikner (2001), the need for public and
private classroom teachers will increase by 350,000 between 1995 and 2007, due to demographic
changes in the population. In the face of this rapidly increasing demand for teachers, attrition
will become even more destructive. Issues such as workload, social prestige, salary and working
individually or together, are the factors most commonly pushing teachers out of the classroom.
Attrition among teachers is also a significant problem in the United Arab Emirates
(UAE), a problem that limits the ambition of the country to develop its educational system. The
Ministry of Education (MoE) statistics (2004) show that there are fewer citizen teachers than
non-national teachers. For example, in the academic year 2000-2001, there were 23,459 teachers
among them only 8,138 citizen teachers. At the end of academic year 2002-2003, 497 teachers
resigned. Among them, 132 were national teachers (5 men and 127 women). According to
Khaleej Times newspaper (2003), the majority who had submitted their resignations had
completed nearly 10 years of service. The main reasons behind those teachers leaving their jobs
were new career prospects and difficulties being faced in teaching. Some of them resigned to
1

pursue post-graduate education and some were facing health problems. Teachers having
completed 15-20 years of service can retire to take care of their children or to change careers.
1.1.2. Definitions of Attrition
Grissmer and Kirby (1987) argue that there is “no single appropriate definition of
teachers’ attrition. Indeed, one cannot define teacher attrition until one defines the policy or
research context in which [a] particular definition will be used” (Grissmer & Kirby, quoted in
Billingsley, 1993, p. 138). Different studies use different terms for the action of teacher attrition.
Terms such as leaving, alienation, transferring, burnout, shortage, turnover, dropout, and others
are widely used in the literature in this regard. In this study, attrition is considered to include all
teachers who leave the classroom and do not continue teaching, whether for short or long periods
of time, whatever the reason behind it. In this definition, even those teachers who are promoted
to a higher position in a school (away from teaching), such as principal, are considered part of
the teacher attrition population.
1.1.3. Worldwide Problem Teacher attrition is an educational problem that is not confined to any particular country
or region; the literature in this regard shows that it is a worldwide problem (see Table 1). Titles
of articles convey a sense of how global this problem is: Stress, social support, and teacher
burnout in Macau (Asia); Stress and burnout among teachers in Italy and France (Europe). It
also exists in the Middle East, for example in UAE. This small country in the Arabian Gulf is
experiencing this problem despite its wealth and capacity to make teaching an attractive and
rewarding profession. Gardner’s article, Developing a quality teaching force for the United Arab
2

Emirates: Mission improbable (1995) explains some of the difficulties. Gardner argues that the
biggest obstacle to obtaining quality teaching is teacher attrition.
In the United States, the problem of teacher attrition is extensive, which can be seen in
the titles of some recent articles: Attrition in special education: Why teachers leave the
classroom and where they go (Brownell, McNellis, Miller, 1997); Why are experienced teachers
leaving the profession? (Tye & O’Brien, 2002). In the latter study, the authors quoted some of
the teachers who had left or were planning to leave teaching: “The love I had for my work is
gone.” “I never used to feel this way, but now it’s hard to drag myself to school each day” (Tye
& O’Brien, 2002, p. 1).
Teacher attrition as a problem is not a new phenomenon; in fact, it dates back to the 60s,
at least in the United States, as shown by the following quote from the November 16, 1962, issue
of Life magazine: “Too many will quit permanently because they are fed up. Their ambition and
self-respect will take them into business or other professions…. They leave behind an increasing
proportion of tired time-servers” (quoted in Tye & O’Brien, 2002, p. 1). Since that time, similar
words have been repeated by teachers repeatedly, but there is no one listening.
Table 1. (Teacher attrition rate in some countries and subjects with highest attrition rate)
Country Attrition rate Country Subjects with high attrition U.S.A public 5.5%
private 12% U.S.A. Science, Mathematics & Special
Education England & Wales
5% England & Wales
English, Music, Technology, Physical Education & Science
Australia 3-8% Australia Language, Science &MathematicsMalawi 8% Russia Language, Science &MathematicsCzech Republic
20% Yugoslavia Language, Science &Mathematics
Liberia 20-30% NA NA South Africa 6% NA NA Source: MacDonald. D (1999)
3

1.2.
1.3.
Statement of the Problem
Despite increasing numbers of graduated students from the College of Education1 in
United Arab Emirates (UAE), the number of citizens who work as a teacher is still low (about
33% of the total teachers). Depending on non-citizen teachers is not the only reason for this
phenomenon, in fact, one of the most important reasons is “teachers drop out.” As students in
college of education show enthusiasm to work as a teacher in the training period, as soon as they
can, they quit teaching the first chance they have.
Many factors contribute to teachers quitting their jobs and looking for another. The new
job may not necessarily be better economically, but it could be better for the “dropout teacher.”
Personal, social–cultural, employment, economic and teacher preparation are the most popular
factors that make teachers quit. The purpose of this research is to explore the factors and reasons
that make teachers quit teaching in UAE.
Conceptual Framework
Teaching is unique (Lortie, 1975), and it has some special features that make it attractive
for some people to choose as their profession. Teaching as a career offers “opportunities for
services and for personal satisfaction which are equaled by very few professions” (Gould
&Yoakam, quoted in Lester, 1986, p.7). The reasons for leaving teaching are closely related to
the original decision to become a teacher. Researchers such as Lortie (1975), in examining what
seems to attract people to teaching, have found some reasons for making this choice of
profession. Lortie called these reasons “appeals.”
Human capital theory as applied by Kirby and Grissmer (1993), posits that individuals
make systematic assessments of the benefits and costs of entering and staying in a profession:
1 It is the only college that has teacher education program in the UAE.
4

The fundamental tenet of the human capital theory of occupational choice is that individuals make systematic assessments of the net monetary and non-monetary benefits from different occupations and make systematic decisions throughout their career to enter, stay or leave an occupation (p. 10).
The human capital theory interprets the decisions of people whether to stay or to leave
their profession; for example, the greater the accumulation of specific human capital, the lower
the probability of attrition. According to this theory, younger teachers are more likely to leave,
and attrition is more likely to occur early in their career. The more complex the initial training
and the longer one has held a position, the less likely one is to see leaving it as a plausible option.
This is why a doctor, for example, is unlikely to change professions and why a teacher who
remains in the classroom past the initial years is less likely to leave the profession with each
additional year.
Billingsley (1993) found that the “available research results indicated that teachers’
career decision[s] are related to a wide variety of variables” (p. 146). By reviewing research
regarding teacher attrition, he came up with a conceptual model of influences on teachers’
attrition decisions. In his model, he found that there are three dependent variables (career
decisions) that include three options stay, transfer and/or exit. The independent variables are
external factors (e.g., societal, economic and institutional), employment factors (e.g.,
professional qualifications, work condition and commitment), and personal factors (e.g.,
demographic, family and cognitive/affective).
Darling-Hammond (2003) found that there are four major factors, which strongly
influence whether and when teachers leave specific schools or the education profession entirely.
5

These factors are salaries, working conditions, preparations and mentoring support in the early
years
1.4.
1.5.
The Purpose of the Study
The purpose of this study is to examine the factors associated with high attrition rate among
the UAE citizen teachers. Based on the previous study, the factors associated with teacher
attrition are those factors of employment, social, personal, economic and teacher preparation.
The factors that this study will investigate are personal factors, economic factors, teacher
preparation, employment factors and social-cultural factors.
Research Questions
This study aims to find answers to:
1. From the perspective of a teacher who is still in the profession, what personal factors are
associated with teacher attrition?
2. From the perspective of a teacher who is still in the profession, what economical factors are
associated with teacher attrition?
3. From the perspective of a teacher who is still in the profession, what employment factors are
associated with teacher attrition?
4. From the perspective of a teacher who is still in the profession, what teacher preparations
factors are associated with teacher attrition?
5. From the perspective of a teacher who is still in the profession, what social-cultural factors are
associated with teacher attrition?
6

1.6.
1.7.
1.8.
Thesis
Teaching is a very hard job physically and mentally that makes it a less attractive job for
many people. It is assumed that teachers quit their job for reasons such as workload, salary and
social status. It is assumed also that gender, age of teacher and educational zone of teacher as
well as the subject they teach play a significant role in making teachers quit.
Research Tradition
This study is based on a positivist paradigm. This paradigm believes that “If something
exists, it exists in quantity and we can measure it” (Eichelberger, 1989). In this study, variables
exist and the researcher will not interfere to change them. Moreover, variables such as age,
gender, workload and social status are already there and they have their effects on teacher
attrition as well.
Methodology
In order to gather data for this study, both qualitative and quantitative methods were used.
For the quantitative, a questionnaire was constructed and distributed to the teachers who are still
in the profession in October 2004. The same questionnaire was distributed to both females and
males. For the qualitative method, a personal interview was conducted with five educational
zone directors.
The participants in this study were all citizen teachers who work in public schools in
UAE (N=8185). By using the Table 4.2 (Gay & Airasian, 2000), the targeted sample was 594
participants, divided based on gender into two groups: the first group represented 360 female
participants and the second group represented 234 male participants. It was also divided based on
educational zones. There are nine educational zones in UAE and the sample of participants was
7

drawn from the number of teachers in each educational zone, which were 40 female teachers and
26 male teachers from each educational zone.
The participants in the interview method were five directors of the five largest
educational zones. Based on the Ministry of Education statistics (2001), the largest educational
zones and the number of teachers are as follows: Abu Dhabi, Al Ain, Al Sharjah, R.S.K. and
Dubai.
1.9.
1.10.
Significance of the Study
The Ministry of Education in UAE is trying to improve the quality of education in the
country, and one of its goals is to “Emirtize2” teaching (to reach at least 90 % citizen teachers by
year 2020). In order to reach this goal, the Ministry of Education must study the reasons that
push citizen teachers to leave teaching. By understand these reasons, the Ministry would find
appropriate solutions that will help to decrease teacher drop out and encourage new students to
work as teachers.
Delimitation
1. The study is delimited to public school teachers in the UAE who are still in the profession at
the time this study was conducted.
2. To increase precision, the validity of the Arabic version of the questionnaire was verified by
an Arabic language specialist and three doctoral students with research experience related to this
study.
3. A stratified design was adapted to increase the representativeness of the sample.
4. The survey instrument was used in one pilot study to operationalize the concepts, and to
minimize misinterpretation of the questions.
2 A national campaign that aims to make all professions to be occupied be UAE citizen if possible.
8

1.11.
1.12.
Limitation
1. The result will be limited to a small sample of the population of the teachers in the public
schools in the UAE.
2. The responses to the questions that will be received it might be influenced by frankness
and seriousness of the participants, that the researcher has no control on them.
Term Definition
Attrition: leaving, exiting turnover of teacher from the teaching profession. For this study,
promotion to principal is considered among teacher attrition.
Economic Factors: are those factors associated with the profession — salary, benefits and
allowances.
Personal Factors: are those factors associated with age, gender, marriage, children and family
responsibility.
Employment Factors: are those factors associated with work such as class size, students’
behavior, parents’ support, administrative support, work hours and subject taught.
Social-Cultural Factors: are those factors associated with the profession — prestige, customs and
traditions of the society that affect the teacher’s decision.
Teacher Preparation Factors: are those factors associated with the training that the pre-service
teacher received before he/she became a teacher.
Educational Zone: under the umbrella of the Ministry of Education and Youth, the educational
system in UAE has nine educational zones. Each educational zone represents the Ministry of
Education administratively in a determined geographic area.
9

Stress: feeling of overwhelming of work and obligations toward teaching, administration, and
family.
Incentives: such as house loans with no interests, allowances, and other job benefits.
10

2. Chapter 2
Literature Review
2.1. Introduction:
This chapter will consist three sections in which the teacher attrition problem will be
addressed from different perspectives.
Section 1: The first section will provide explanations for why some people leave their
professions and look for another job. In this section attention will be paid more to the key
theories that give some interpretations for the high rate of teacher attrition.
Section 2: The second section will focus on the teacher attrition factors in the identified
literature. In this section a review of the previous studies is done and the researcher tried to
categorize the previous studies into four deferent models of studies.
Section 3: The third section will focus on the teacher attrition in the United Arab Emirates which
is the context of this study. In this section the country background will be presented in order to
reveal the significance of this study in a country like UAE. In this section the schooling and the
teacher condition are also presented as well as the studies results.
2.2. Section 1: Why some people leave their profession?
2.2.1. Introduction
Many theories have been used to interpret or explain teacher attrition or attrition in the
professions in general. An attempt will be made here to shed some light on these theories and
how they could be used to interpret teacher attrition. Some of the examples of attrition deal
directly with teaching as a profession and others deal with professional attrition overall. The
researcher will test the applications of three of these theories to the problem of teacher attrition:
11

appeals theory, career mobility theory, and human capital theory. In following, a brief summary
will be given to each theory, and then each theory will be explained in detail.
Appeals theory
Lortie (1975) argues that in teaching there are certain inherent appeals to teaching that
attract people to work as teachers. He theorizes that when these “appeals” do not exist, teacher
attrition occurs. King (1993) also found in her study of African American teachers that there are
some attractions in teaching.
Career mobility theory
Sicherman and Galor (1990) base their theory of career mobility on the following
assumption: “occupational mobility is an outstanding characteristic of the American labor
market; very few workers perform the same task throughout their working lives”. They theorize
that individual change in career is based on the economic future of the career. In addition, they
argue that schooling affects the decision of individuals, whether to stay or to move to another
profession.
Human capital theory
Kirby and Grissmer (1993) have applied this theory to teachers and found that the
individual makes systematic assessments of the benefits and costs of entering and staying in the
profession.
2.2.2. Why teach: The Appeals Theory Teaching is unique, and it has some special features that make it attractive for some
people to choose as their profession (Lortie, 1975). Teaching as a career offers “opportunities for
12

services and for personal satisfaction which are equaled by very few professions” (Gould
&Yoakam, quoted in Lester, 1986, p.7)
The reasons for leaving teaching are closely related to the original decision to become a
teacher. Researchers such as Lortie (1975), in examining what seems to attract people to
teaching, have found some reasons for making this choice of profession. Lortie called these
reasons “appeals”.
• Interpersonal appeal: some individuals desire to work with young people who are not
ill or extremely disadvantaged.
• Service appeal: some teachers believe that teaching is not just a profession, but they
see it as a special mission for their society. Those teachers believe that they are doing
a valuable service to their country, participating in “protecting” the culture of the
society, and playing their role in helping mankind.
• Continuation appeal: some people enjoy the environment of the school and they
choose to remain in the environment they like.
• Material appeal: some people are attracted by the unique features that teaching offers,
compared to other professions, such as working hours and period of the school year
(e.g., no school in the summer). These are considered material benefits that attract
some people to teaching.
• Socioeconomic appeal: Lortie thinks that the socioeconomic constraints make
teachers’ college economically accessible for many, thereby increasing the number of
teachers.
• “Safety net” appeal: for those who cannot enter a more preferred line of work,
teaching provides a plausible choice without loss of status.
13

• Second career appeal: after working in another field, teaching appeals to some as a
second career in which there always seems to be positions available.
King (1993), in her study of African American teachers, found that there are major initial
attractions for those teachers to select teaching as a profession. These attractions are rank ordered
(from highest to lowest) as follows:
• The opportunity to work with young people
• The feeling that their abilities are well suited to teaching
• The belief that teaching contributes to the betterment of society
• The feeling that teaching provided one with the opportunity to be creative
• The perception that teaching provides the opportunity to work with students of
diverse backgrounds and with diverse needs
• The intellectual challenge that teaching provides
• The desire for a long vacation.
Teaching is unique, as Lortie (1975) said, and it will continue to be unique for some
people. There are some special attractions in teaching that do not exist in other professions, and
these attract some people to select it as a profession.
2.2.3. Career Mobility Theory
This study was done by Sicherman and Galor (1990) in order to analyze theoretically and
empirically the role and significance of occupational mobility. The importance of this study
comes from their assumption that “occupational mobility is an outstanding characteristic of the
14

American labor market; very few workers perform the same task throughout their working lives”
(p. 169).
Questions. This study examines the relationship between occupational mobility and
factors such as wages, promotion, and schooling.
Method and sample. In order to study the phenomenon of career mobility the authors
used a particular model. The sample of this study was 18 to 60-year-old males observed annually
over the period 1976-81. The participants reported their occupation at the time of the original
survey and the authors noted annually if there were any changes in occupation.
In their study, Sicherman and Galor (1990) revealed the importance of education in
providing individuals with human capital which allows them to increase their future earnings
through two channels, directly and indirectly. Earning can be increased directly through the
potential returns to schooling in certain occupation, and indirectly via the improvement of the
individuals in their career path.
Sicherman and Galor (1990) in this theory revealed that individuals’ optimal career path
may involve intra-occupation mobility as well as inter-occupation mobility.
• Intra-occupation mobility (promotion): This is subject to the employer’s decision.
The optimal quitting time for individuals who are not promoted occurs earlier than it
does for individuals who are promoted.
• Inter-occupation mobility: This is determined by individuals who choose the optimal
quitting time so as to maximize their expected lifetime earnings.
Schooling and career mobility
Depending on two factors, the type of career and the occupation the worker is in, the
effect of schooling on the probability of career mobility will vary (Sicherman & Galor, 1990).
15

The theory of career mobility predicts that the effects of schooling on career mobility can be
either negative or positive. Sicherman and Galor (1990) state that “more educated workers are
more likely to quit than to be laid off, but schooling increases the likelihood of upward mobility
in the case of both quits and layoffs” (p. 182).
Quitting and career mobility
Why do some people quit their jobs? Economic theory posits that an individual will quit
his job if the expected value of his future earnings if he stays where he is lower than if he leaves
(Sicherman & Galor, 1990). In their article, the authors hypothesize that “the higher the expected
probability of promotion a worker has, the larger the effect of not being promoted on the
decision to quit” (p. 185).
Duration effects on career mobility
The theory of career mobility predicts that “there exists a positive effect of tenure in
occupation on occupational mobility” (Sicherman & Galor, 1990, p.187). In order to move to
another profession easily, individuals must acquire some skills and experience from the previous
profession. On the other hand, specific human capital and job-matching theories predict a
negative effect of tenure on mobility. Sicherman and Galor (1990) stated that “the rate of career
mobility decreases with time in the labor market” (p. 188). This explains why teacher with long
time experience, keep their profession and do not move to another new profession.
2.2.4. Human Capital Theory
This theory of occupational choice, as applied by Kirby and Grissmer (1993), posits that
individuals make systematic assessments of the benefits and costs of entering and staying in a
profession:
16

The fundamental tenet of the human capital theory of occupational choice is that individuals make systematic assessments of the net monetary and nonmonetary benefits from different occupations and make systematic decisions throughout their career to enter, stay or leave an occupation. (p. 10)
Monetary benefits include the stream of likely income in that profession, promotion
opportunities, value of benefits, etc. Nonmonetary benefits include working conditions, support
of peers and superiors, compatibility of hours and schedules with family and leisure needs,
availability of adequate materials, learning attitudes of students, parental support, etc.
The human capital theory interprets the decisions of people whether to stay or to leave
their profession. For example, the greater the accumulation of specific human capital, the lower
the probability of attrition. According to this theory, younger teachers are more likely to leave,
and attrition is more likely to occur early in the career. The more complex the initial training and
the longer one has held a position, the less likely one is to see leaving it as a plausible option.
This is why a doctor, for example, is unlikely to quit to become something else and why a
teacher who remains in the classroom past the initial years is less likely to leave the profession
with every additional year.
Summary
The human capital theory has been used widely in researches attempting to interpret the
phenomenon of teacher attrition. Basically, this theory attributes teacher attrition to economic
decisions made by the teacher. A teacher decides whether to stay or to leave based on which is
better for him economically.
17

2.3. Section II: Previous Studies
2.3.1. Introduction By reviewing the literature, the researcher found that the studies can be classified into
four models or designs of study. Each model has different characteristics and different
perspectives in studying teacher attrition. Some models, like model 1 suggests that there are only
three major factors that affect teacher attrition and all other factors are included some way or
another in these three factors. On the other hand, model 2 suggests that there are four major
factors associated with teacher attrition.
Model 1: three major factors (Billingsley model): this model suggests that there are three major
factors affect teacher decision and all other variables and factors are categorized in one of them.
Model1 (Billingsley model)
External Factors
Model 2: Four factors ( Human Capital Theory): in this model as applied by Kirby and Grissmer
who have studied teacher attrition. They were the first to apply the Capital Theory to the issue of
teacher attrition and in their study, they suggest these four factors: gender, age, time, and subject
taught.
Personal Factors
Teacher Decision
Employment Factors
18

Model 2 (Human Capital)
Model 3: Four major categories: These four categories include the factors found to be most
important for teachers’ decision to leave the profession, and many studies have so classified
them. These four categories are: monetary, work conditions, teacher preparation, and social
factors.
Gender
Time
Age
Teacher decision
Subject
19

Model3 (Four Major Categories)
Model 4: Multiple factors: in this model different studies have investigated different factors of
teacher attrition.
Model 4: (Multiple factors)
2.3.2. Model I: Three Major Factors Billingsley’s Study
Social factors
Work Condition
Monetary
Teacher Decision
Teacher Preparation
Gender
Subject
Location
Salary
Marital Status
Children Parents’ attitudes
Administrative support
Prestige
Paper work
Students’ behavior
Age
Teacher preparation
Teacher Decision
20
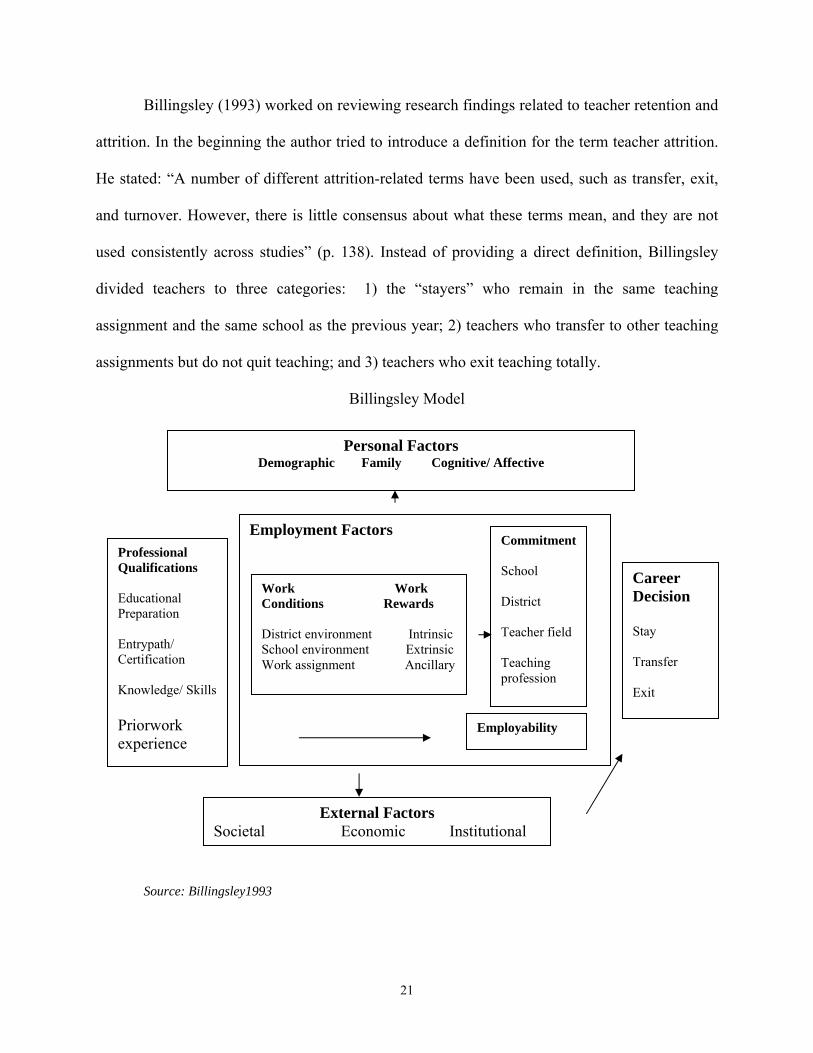
Billingsley (1993) worked on reviewing research findings related to teacher retention and
attrition. In the beginning the author tried to introduce a definition for the term teacher attrition.
He stated: “A number of different attrition-related terms have been used, such as transfer, exit,
and turnover. However, there is little consensus about what these terms mean, and they are not
used consistently across studies” (p. 138). Instead of providing a direct definition, Billingsley
divided teachers to three categories: 1) the “stayers” who remain in the same teaching
assignment and the same school as the previous year; 2) teachers who transfer to other teaching
assignments but do not quit teaching; and 3) teachers who exit teaching totally.
Billingsley Model
Personal Factors Demographic Family Cognitive/ Affective
External Factors Societal Economic Institutional
Career Decision Stay Transfer Exit
Employability
Commitment School District Teacher field Teaching profession
Work Work Conditions Rewards District environment Intrinsic School environment Extrinsic Work assignment Ancillary
Employment Factors Professional Qualifications Educational Preparation Entrypath/ Certification Knowledge/ Skills Priorwork experience
Source: Billingsley1993
21

Billingsley indicated that teachers’ career decisions are related to a wide variety of
variables. In his model, Billingsley defined the dependent variable “career decision” which
includes three options for the teachers (stay, transfer, or exit). He also, indicated that the
independent variables are those three kinds of factors that affect a teacher’s decision: external
factors, employment factors, and personal factors.
External Factors. These include factors that external to the teacher and school district
such as economic crisis. For example, studies found that during economic crises teachers are less
likely to have job opportunities elsewhere and therefore they stay in their job for longer time.
There is also, the societal factor which includes community characteristic and cultural norms and
values. Societal factor affects the teachers’ decision. For example, the lack of prestige associated
with teaching may cause some teachers to seek out employment alternatives.
Employment Factors. These factors comprise four major employment factors.
1. Professional qualifications
a. Educational Preparation: teachers who emerge from superior preparation
programs will be more likely to remain in teaching than those who emerge
from weaker programs.
b. Entry Path and Certification Status: studies reported higher levels of
attrition among uncertified special education teachers than among those
who were certified.
c. Teachers’ Knowledge and Skills: studies reported that teachers with
higher NTE scores are almost twice as likely to leave than their colleagues
with lower scores.
22

d. Prior Work Experience: studies found that inexperienced teachers are
more likely to leave teaching than those who are more experienced.
e. Initial Commitment: studies found that those who tended to exit less
frequently had higher levels of initial commitment to teaching.
2. Work conditions and work rewards:
a. District and School Environments: studies found districts with lower
levels of teacher attrition were small, had higher per student expenditures,
employed teachers with higher educational attainment from higher status
universities.
Administrative Support: studies found that lack of administrative
support was associated with attrition.
Collegial and Parent Support: studies found that collegial
interaction and support were associated with satisfaction and retention.
Teacher Autonomy and Decision Making: studies found that an
environment that allows for professional discretion bolsters
teachers’ motivation, commitment, and confidence, while a lack of
independence tends to lead to dissatisfaction and/or attrition.
b. Work Assignments: the teachers’ immediate work environemnt such as
classroom, as well as the daily activities and interaction.
Teaching Assignments: studies found that grade level has been
related to attition with secondary teachers leaving sooner than
elmentary teachers.
Role Demands: studies found that problems with role overload,
23

role conflict, and role ambiguity have been linked to teacher
attriton.
Class Size: studies found that class size is associated with teacher
attrition. Some studies reported that 58 percent of special educators
leave teaching, citing “too many students in a class” as a reason for
attrition.
Personal Factors:
a) Demographic Variables: studies found that there is a relation between
gender/age and attrition. It appears that younger women are more likely to
leave than younger men, and older women less likely to leave than older
men.
b) Family Factors: family background, family structue, and number of
dependents have been associated with teacher attrition. Some studies found
that women with children were more likely to stay in teaching than women
who were not married or did not have children.
2.3.3. Model II: Four Major Factors (Human Capital)
Kirby and Grissmer are among the very best known scholars who have studied teacher
attrition. They were the first to apply the Capital Theory to the issue of teacher attrition and in
their study, they came up with some very interesting finds.
Method. The database that the authors constructed and which forms the basis of the
analysis consists of a longitudinal record for all fulltime teachers in Indiana public schools from
1965-1987. These data allow the authors to track attrition and returns to the public school system
over time, as well as how these patterns differ by demographic, economic, and teaching-related
24

variables. They found that there were about 50,000 fulltime public school teachers in Indiana,
although that number, of course, has varied considerably over time.
In addition, the authors conducted a survey of about 1600 new hires in the 1988-89
school year. Of these, about 500 had participated in a new mentor program and they were asked
about their experience with this program. Returning teachers were asked about their break-in
service. In addition, the authors presented evidence from other teacher surveys, particularly
surveys of science and mathematics teachers, the group regarding which there is considerable
concern in the US.
Results
When do teachers leave? The study found that about 20 percent of the teachers left one
year after entering teaching. After the second year the percentage was still high but less than the
first year (13 percent). But by the end of the fourth year, those who had left the teaching were a
little over half of the original cohort. The study ended saying that the other half of the studied
cohort would leave within 10 years of teaching.
Who leaves: Men or women? The study found that women clearly had a much higher
rate of attrition than men, in general about 25 percent higher. Men also had a lower percentage of
attrition rates the second year of entry. For example, compared to the 28 percent of men who quit
teaching, about 35 percent of women quit teaching after the second year of entry. After the fourth
year, the percentage of men who left teaching rose to 43 percent, but the percentage of women
was still higher because more than half the women had left at least once by this time. The
researchers concluded that “women tend to drop out more frequently than men but tend to return
more frequently as well.” (p. 22).
25

Who leaves: Older or younger teachers? The study found that the younger teachers
tended to leave more than the older teachers. The authors state “Those who enter at age 24 or
younger appear to be at the greatest risk of leaving” (p. 23). After two years of entry, 20 percent
of the older teachers (over 30) had left teaching, but about a third of the younger teacher had left.
Teachers of which subjects leaves? The findings of the study revealed there were some
subjects with higher attrition rates than others. For example, the study found that the highest
rates of attrition were among physics/chemistry, English, and biology teachers. Seventy percent
of physics/chemistry teachers left by the end of the fifth year, and by the same time about 60
percent of English and biology teachers had left teaching. On the other hand, teachers of
mathematics had among the lowest rates of attrition. Kirby and Grissmer concluded that “science
teachers…have the highest rates, suggesting that they not only leave more frequently but also are
less likely to return than other types of teachers” (p. 24).
2.3.4. Model III: Four Major Categories
In the literature that has examined teachers’ issues, and particularly among those studies
focusing on attrition, there are many that attempt to identify what pushes teachers to leave the
teaching profession. Factors such as prestige, work load, work environment, wages, and others
are most commonly mentioned in these studies as causing attrition. They can be divided into
four categories: monetary, work conditions, teacher preparation, and social factors. These four
categories include the factors found to be most important for teachers’ decision to leave the
profession, and many studies have so classified them.
2.3.4.1. Monetary Factor Many studies have indicated that the question of compensation can be considered one of
the most important factors that pushes teachers to leave the profession. There are some
26

researchers who think that improving teachers’ financial status could solve the problem of
teacher attrition.
Darling-Hammond (2003) found that there are four major factors which strongly
influence whether and when teachers leave specific schools or the education profession entirely.
These factors are: salaries, working conditions, preparations and mentoring support in the early
years. Talking about salaries as one of the main factors that influences teacher attrition, Darling-
Hammond (2003) found that teachers’ salaries are about 20 percent below those of other
professionals with comparable education and training. For example, the average teacher’s salary
in 2001 was $44,040 which is below other professions such as registered nurses ($48,240),
accountants/auditors ($50,700), dental hygienists ($56,770) and computer programmers
($71,130)(NCTAF, 2003). She found also that teachers are more likely to quit when they work
in districts that offer lower wages and when their salaries are low relative to alternative wage
opportunities, especially teachers in such high demand fields as math and the sciences.
Ingersoll (2003) found that the 29 percent of the teachers in his study who listed job
dissatisfaction as a major reason for leaving, when he again gave them the option of listing up to
three reasons, more than three-fourths linked their quitting teaching to low salaries.
ILO (1991a, p. 98) argues that low salaries “ may be the root causes of brain drain” in
some less developed countries where salaries are too low to support a family and teachers feel it
necessary to take a second job. Macdonald (1999) also argues that in developed countries such as
the USA and Britain, 65 and 89 percent of teachers, respectively, cited pay as the primary
motivation for leaving the profession. Theobald (1996) found the same thing in his study. He
reported that in the USA all male teachers and more experienced female teachers’ decision to
27

remain in teaching was most influenced by the comparison of teaching with non-teaching
salaries.
Stinebrickner (2002) tried to examine in his research the timing of exits from the
teaching profession and the reasons for these exits. He found that there are many reasons why
teachers are pushed to leave teaching, the most important being wages. He justifies that teaching
is a profession that is “time consuming” and requires a fully involved/committed person. When
teachers juxtapose the work they do with the money they receive, they are often compelled to
rethink their decision to become teachers. He found that teachers with high wages were
significantly less likely to change occupations than those who were less well-paid.
King (1993) found that the participants in his study shared the same perspectives
regarding the salary issue. One of the participants stated that the low salaries push teachers out of
school: “I think minorities are not choosing teaching because many choose to work where they
can support themselves. Teaching is rewarding, but garbage men/women start at $31,000” (p.
485).
Kirby and Girissmer (1995), in their study which tracked teacher mobility for more than
20 years (1965 to 1987), found that former teachers did not believe that increase in salary would
have made a difference in their decision to leave teaching. Interestingly, when current
mathematics and science teachers were asked what factors would encourage them to stay in the
profession, the researchers found that over 50 percent mentioned salary as the first factor.
Chapman (1994) argues that increasing salaries is the “single most direct and effective
way to reduce attrition”. The study of Murnane and Olsen (1989) supports Chapman’s argument.
They found in their study that beginning teachers who are paid more stay in teaching longer. The
researchers concluded that an increase of US $1000 per increment resulted in an increase in the
28

median duration of two to three years service. The exact same thing was found by Grits and
Theobald (1996); that increasing salary was a very important factor in discouraging attrition.
They found that an increase in salary of US $3000 would reduce the attrition in a very obvious
way.
Macdonald (1999) stated that “monetary rewards and incentives to selected teachers on
the basis of location, hardship, qualifications, specialist areas, performance and over time appear
to be gaining credence in developed and less developed countries “(p. 843). Supporting this
finding, Thompson (1995) found that in Sierra Leone, the additional allowances paid to science
and mathematics teachers proved barely enough to retain those teachers in the profession. Metais
(1991) found the same thing in England and Wales where the local authorities have claimed to
successfully use monetary incentives for outstanding performance and those teaching in subjects
where there are teacher shortages.
On the other hand, some researchers do not see in the increased salary the perfect solution
to teacher attrition. For example, Macdonald (1999) argues that “there is little evidence that
increased salaries and monetary allowances alone can have a high and long-term impact on
attrition” (p. 844). In order to support her opinion, she gave Eritrea as an example. In this
country the government granted a 40 percent increase in allowances but teachers are still leaving
teaching.
Benham and O’Brien (2002), in their study of why experienced teachers leave the
profession, found that teachers who had already left the profession ranked the reasons in the
following order, number 1 being the most important and number 7 the least important:
1. accountability
2. increased paper work
29

3. student attitudes
4. no parent support
5. unresponsive administration
6. low status of the profession
7. salary considerations
But those teachers who are still in the profession (potential leavers) ranked the reasons for
leaving as follows:
1. salary
2. increased paperwork
3. accountability
4. low status of the profession
5. unresponsive administration
6. student attitudes
7. no parent support
The difference in the important factors between teachers who had left the profession and
those who were still in it illustrates that salary is the most important factor for those currently in
the profession.
2.3.4.2. Work Condition Factor
Darling-Hammond (2003) argues that “working conditions play a major role in teachers’
decision[s] to switch schools or leave the profession” (p. 9). She found that the high attrition of
teachers who work with students with low income or who are lower achieving appears to be
influenced by the poorer working conditions. Harris (2002) also found that teachers in high
minority, low income schools reported significantly worse working conditions, including poorer
30

facilities, less access to text books and supplies, less administrative support, and larger class
sizes.
Ingersoll (2003) found that the 29 percent of the teachers who listed job satisfaction as a
major reason for leaving, when pressed to be specific about their job satisfaction, listed the
following reasons, all of which come under the heading of working conditions: student discipline
problems, lack of support from the school administration, poor student motivation, and lack of
teachers’ influence schoolwide and in the classroom.
Macdonald (1999) stated that “In most countries, there is a strong sense that conditions
within schooling and those shaping schooling have deteriorated and consequently are causing
increasing levels of teachers[‘] dissatisfaction and stress, if not attrition” (p. 839). Talking about
stress, the ILO-UNESCO Joint Committee (1994) reported on an international survey which
revealed that 25 to 33 percent of teachers suffered significantly from stress and the report
concluded that stress was a major issue for teachers and attrition.
Benham and O’Brien (2002) found that teachers ranked the pressures of increased
accountability (such as high stakes testing, testing preparations and slander as their number-one
reason for leaving the profession. It is useful here to quote the words of an eight-year
experienced teacher: “I have too many hours, I have invested too much, I dream of [a] less
difficult job that ends at the end of the day, that does not give me the impression of having never
finished” (quoted in Huberman, 1993, p. 6).
Macdonald (1999) stated that “The substandard conditions in which many teachers work,
generally in less developed counties…. affect attrition” (p. 841). These include classroom
disrepair, poor sanitary facilities, lighting, and furniture. The same thing is seen by researchers
such as Huberman (1993) and Oliveria and Farrell (1993). These researches argue that schools
31

need to improve the work conditions of their teachers. This can be done by improving the
physical, social and professional dimensions of teaching, together with enhancing teachers’
living standards and relationships with the community. They included in this some issues that
relate to women, such as a shorter work day and flexible work hours.
Studies such as Theobold’s (1995) and Huberman’s (1989) found that work conditions
cause frustration for beginning teachers, specifically such factors as student management, lesson
planning, alienation, isolation, denigration of personal interest and dependence on outside
opinion and observation.
King (1993) in her study found that working conditions affect a teacher’s decision to stay
or leave the career. The participants in her study specified some of these factors relating to “work
condition” that make teaching not an attractive career: disciplinary problems, fear, inadequate
working conditions and materials, inadequate preparation time, and nonparticipation in decision
making.
In a study of attrition of special teachers, Brownell (1995) found that working conditions
often precipitated a disgruntled leaver’s decision to leave the special education classroom. She
found that teachers feel overwhelmed by class size, student behavior, insufficient administration
support, and a lack of personnel and material resources.
2.3.4.3. Teacher preparation Factor
There is a great deal of evidence that attrition rates are high among those teachers who
lack adequate preparation. According to a National Center for Education Statistics report (1997),
that 29 percent of new teachers who had not had any student teaching experience left within five
years, compared with only 15 percent of those who had done student teaching as part of their
teacher education programs.
32

Darling-Hammond (2003) found that in the year 2000, new teachers who had received
training in specific aspects of teaching, who experienced practice teaching, and who received
feedback on their teaching left the profession one-half as frequently as those who had no training
of this kind. In the same study, she found that both four-year and five-year teacher education
graduates enter and stay at higher rates than do teachers hired through alternative programs that
give them only a few weeks of training.
The studies found also that training has an influence on the attrition rate based on the
time of training. Schwab (1995) found that those who graduate from five-year teachers’
education programs enter and stay in teaching at much higher rates than do four-year teachers’
education graduates from the same initiation.
2.3.4.4. Social Factor
Ingersoll (2003) found that the highest percentage of those teachers who left teaching
(about 42 %) cited personal reasons as the main reason for them to quit. These personal reasons
include pregnancy, child rearing, health problems, and family moves. These factors have a
significant effect upon teachers’ decisions, especially the female teachers. Stinebrickner (2002)
indicated that women who were married were 1.94 times more likely to leave the workforce than
women who were not married. The same study found that the incidence of teacher attrition was
directly related to the birth of children.
One of the most important social factors that push teachers to leave teaching is social
prestige.
Prestige. Feelings regarding professional prestige are generally a direct result of teachers’
perceptions of how they are regarded by people outside the field of education. As Marlow and
Inman (1997) found in their study of beginning teachers that social pressure pushes teachers to
33

leave teaching. They wrote “…. teachers who do not feel supported by [the] community are
likely to become disillusioned with [their] chosen profession.” They added that “they [the
teachers] often feel pressure to improve in some undefined and sometimes unrealistic way[,] a
feeling that can contribute to the decision to leave teaching” (p. 3).
Macdonald (1999) stated that “the perceived decline in the status of teachers is of concern
in most countries from the perspective of how teachers are seen by others as well as how they see
themselves” (p. 839). Chapman (1994) argues that while teachers may have high expectations for
themselves and their profession, the recognition for teachers’ work by communities and
governments is poor. He also argues that for some, teacher education is a back door to the
university when few other opportunities for entrance exist. For example in India, where if
talented people “happens to join by accident, they quit it at the first opportunity”
(Ravindranadham, 1993, p. 3)
Thomson (1995) sees that in some countries teaching is a fall back position and is
abandoned when the bonded period expires or conditions are right to use their skills and
experience elsewhere.
Marlow and Leslie (1997) in their study about why beginning teachers leave the
profession found that reasons for leaving have less to do with insufficient salaries than with a
lack of professionalism, collegiality, and administrative support. In this study, the researchers
found that professional prestige is one of the most important factors that pushes teachers,
especially beginning teachers, to quit teaching and look for another job. About two-fifths of the
respondents in this study indicated that the lack of prestige was worse than they had expected.
Murphy (1993) thinks that teaching does not have real professional status. Teachers do
some jobs that make their work less prestigious than other jobs. For example, they must schedule
34

all breaks such as lunch and bathroom and they must sign in and out of the workplace. In
addition, they do not have access to the school building unless the children are there and must
conduct buses, playground, hall, and lunchtime duty. Also, only a few of them have private
offices or access to telephones for private calls.
King (1993) in her study to African American teachers found that there are some factors
related to social prestige associated with teacher attrition. The study found that only just over 50
percent of the teachers felt respected as a teacher in today’s society. One of the participants
commented on the issue of respect as follows:
In this society, teaching is not a respected field. The government does not value teachers, which makes the students not value them too. Therefore, minorities who are on the lower economic scale tend to seek or choose careers that are more respected, glamorous and richer. (p. 485)
2.3.5. Model IV: Multiple Studies, Multiple Factors
In this model, the studies tried to investigate the teacher attrition problem to see what the
roles of these factors on the teachers decision whether to stay or to leave their profession.
Different factors have been explored in these studies, and the researchers have used different
methodologies to study the factors of teacher attrition.
In her study, Keyeri (2002) tried to investigate if a difference exists between burnout
level in low and high socio-economic school districts. A secondary purpose of this study was to
examine the relationship of burnout to gender, years of experience, and grade taught. The third
purpose was to examine teachers’ perceptions of distress and ways to alleviate it.
Method. The sample of this study was 200 teachers from six elementary schools in two areas of
contrasted socio-economic status located in the northern suburbs of Chicago. The instruments
used to collect data were an MBI survey (used to measure the burnout among teachers), and a
35

qualitative interview to investigate teachers’ perceptions of distress within the school. There
were four research questions:
1. Is there a relationship between burnout and low and high socio-economic schools?
2. Is there a relationship between burnout and gender?
3. Is there a relationship between burnout and years of experience?
4. Is there a relationship between burnout and grade level taught?
Result. The most important results found in this study were:
1. There is a significant relationship between gender and emotional exhaustion ( high
level with females)
2. No relationship exists between years of experience and burnout.
3. Elementary grades have a significantly higher levels of emotional exhaustion than the
junior high grades.
4. Distress came from lack of support, school policy, time, money and student discipline
problems.
Lester (1986), designed his study to assess teacher job satisfaction in elementary and
secondary schools.
Method. The sample of this study was 620 teachers drawn from the teachers in New York City,
Westchester, Nassau, and Suffolk Counties. The instrument used was a questionnaire that
included items about nine factors that affect teacher job satisfaction: supervision, colleagues,
working conditions, pay, responsibility, work itself, advancement, security, and recognition. In
addition there were personal and demographic variables, including age, sex, marital status, total
years of experience, years in district, educational level, tenure, and union affiliation.
36

Result. The study found that teachers are dissatisfied with pay, advancement, and recognition,
but they are satisfied with supervision, colleagues, responsibility, the work itself, and security.
The purpose of Marlow and Inman’s (1997) study was to examine attitudes of beginning
teachers toward their current support systems and to compare those attitudes with factors
identified as predictors of attrition.
Method. The sample of this study was drawn from teachers in randomly selected schools in the
mid-southern and southern U.S. Of the1200 surveys distributed, 602 were returned of which 38
percent were classified as beginner teacher (i.e., less than 10 years of experience). The
researcher used a survey with 31 items as the instrument for gathering data. The survey
contained questions about demographics professional environment, teachers’ background, and
consideration of leaving.
Results. The most important finding of this study was that the beginning teachers were not
satisfied with the prestige of the profession. For example, 24 percent of the teachers in this study
felt that the prestige of their work was worse than they expected.
The purpose of Forey, Christensen, and England’s (1999) study was to examine how an
individual’s approach to life can enhance his or here opportunity to find belonging in the work
context.
Method. The sample of this study was 132 teachers: 57 from school A, 25 from school B, and 50
from school C (67 % females). To collect data for this study researches used a demographic data
sheet, the Maslach Burnout Inventory, and the Vocational Preference Inventory (VPI) in addition
to the Langenfeld Inventory of personality priorities (LIPP), and both order survey.
37

Results. The results of this study suggested that Holland Typologies have little relationship to
teacher burnout, while both the Adlerian constructs of birth order and personality priorities do
appear to relate to burnout.
The study of Ruhland (2001) was guided by six research questions:
1. What is the attrition and retention rate of secondary business teachers entering the
teaching profession?
2. Is there a statistically significant difference in commitment to teaching between
secondary business teachers who did not enter or chose to leave, and those who
remain n the teaching profession?
3. Did a mentoring experience influence a beginning secondary business teacher’s
attitude toward the teaching profession?
4. Are secondary business teachers satisfied with their current teaching position?
5. What reasons influence a secondary business teacher’s decision not to enter or to
leave the teaching profession?
6. Is there a statistically significant difference in the factors that are important to
determine a teacher’s interest to continue teaching between secondary business
teachers who did not enter or chose to leave, and those who remain in the teaching
profession?
Method: the target population for this study was the business education graduates who completed
a degree between 1996 and 2000 from NABTE institutions. Of the 475 surveys that were sent,
163 (38%) were returned. The survey consisted of four sections: educational preparation,
demographic, teaching experience, and skills and interest in teaching.
38

Result: the study found that the following factors were the most important for attrition: salary
(75%), lack of job advancement (30%), licenses requirements (26%), stress (28%).
The study of Theobald and Gritz (1995) tried to find answers to these questions:
1. How do differences in public district spending priorities affect the paths by which
beginning teachers exit their first teaching spell?
2. Does the level of teacher salaries also influence the likelihood that beginning teachers
will transfer to and other district or move into a non-teachers position?
3. Does the way in which districts spend the other 60 per cent of their budget affect
beginning teacher exit paths?
Method: The sample was 9,756 white teachers in Washington state public schools who began
their career in the period 1981-1990.
Result. The most important results in this study were:
1. Raising all teachers’ salaries by $ 3,000 decreased the percentage of teacher choosing
to leave from 59 percent to 54 percent in female and from 31 percent to 23 percent in
the males.
2. Lowering all teachers’ salaries by $3,000 increased the percentage of teachers
choosing to leave from 31% to 43 %.
This study of Murnane and Olsen(1990), tried to show how salaries affect teachers’
decisions to leave or stay in the teaching profession. The study was guided by this question:
What are the consequences of salary increases?
39

Method. The sample of this study was 13,890 white teachers who began their teaching career in
North Carolina public schools during the period 1975-84. The research was based on a new
longitudinal dataset providing information on the careers of teachers in North Carolina.
Result. Teaching specialty, NTE score and teaching salaries have important effects on the length
of time a teacher remains in the profession. For example:
- Teachers in high school stay a shorter time than those in elementary school.
- Teachers of subjects such as chemistry and physics stay a shorter time than those
teaching other subjects.
- Teachers of math stay for the longest time among other subjects’ teachers.
- Teachers with higher NTE scores stay a shorter time.
- A $1,000 increase in each step of the salary scale is associated with an increase in
duration of two to three years.
The purpose of Fox and Certo’s (2001) study, was to identify variables affecting teacher
retention and to identify effective strategies for retaining quality teachers for Virginia schools.
The study was guided by these questions:
1. What reason do teachers give for staying in their school division and in the
profession?
2. What are the perceptions of teachers regarding the reason their colleagues leave the
school division or the profession?
3. What are teachers’ perceptions regarding school division retention strategies?
4. What strategies do school divisions report for retaining teachers in the first five years
of their teaching careers?
40

5. What reasons do teachers give for leaving their divisions or the profession?
Method. The sample of this study was the teachers who left their schools in 1999-2000 or in the
middle of the 2000-2001 school year. To collect the data for this study, the researchers used both
qualitative method (survey) and quantitative method (interview).
Result. Teacher attrition and retention variables are highly interrelated, sometimes inverse. The
researchers found the following reasons to be the most important in relation to teacher attrition.
The reasons are listed hierarchically, the most important first and the least important tenth:
1. salary and benefits
2. external career opportunities
3. administration
4. professional development
5. autonomy
6. planning time
7. class size
8. standards of learning pressure
9. lack of parental support
10. resources and supplies.
The study of Murnane and Olsen (1990), was guided by this question: Why may duration
depend on opportunity costs and salaries?
Method. The sample of this study was the teachers in Carolina, Michigan, and North Carolina.
To collect the data the researches used a longitudinal history from the three states’ data sets.
41
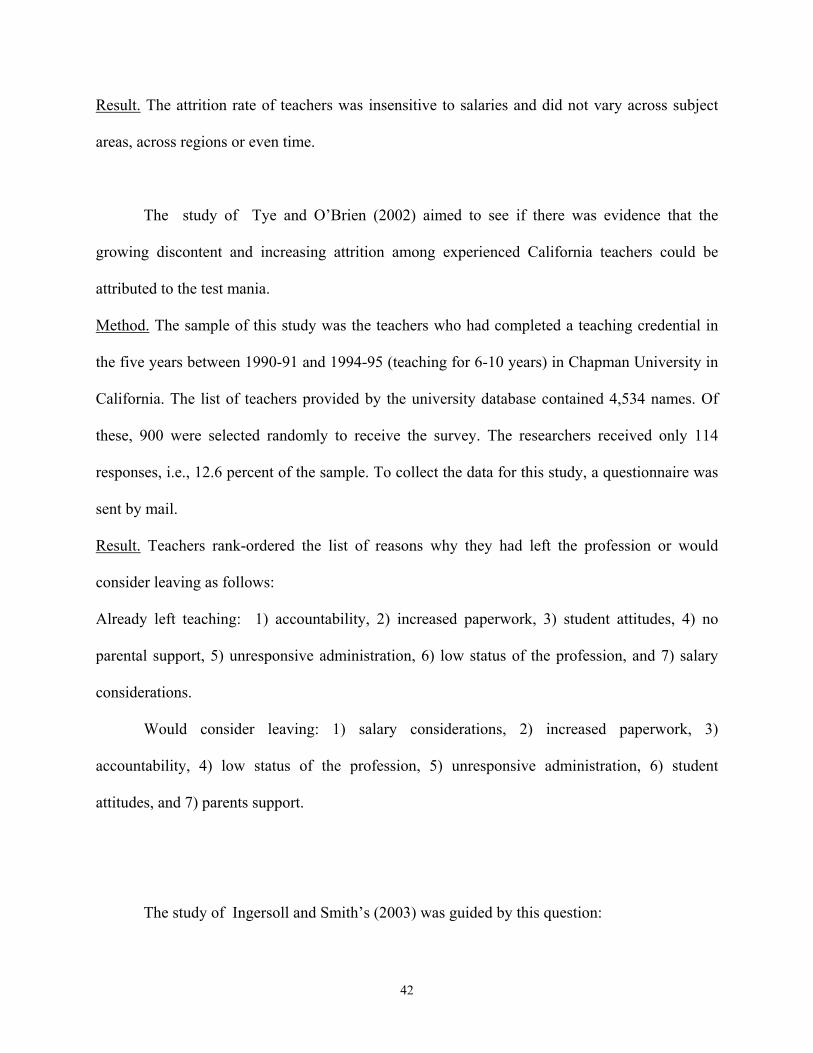
Result. The attrition rate of teachers was insensitive to salaries and did not vary across subject
areas, across regions or even time.
The study of Tye and O’Brien (2002) aimed to see if there was evidence that the
growing discontent and increasing attrition among experienced California teachers could be
attributed to the test mania.
Method. The sample of this study was the teachers who had completed a teaching credential in
the five years between 1990-91 and 1994-95 (teaching for 6-10 years) in Chapman University in
California. The list of teachers provided by the university database contained 4,534 names. Of
these, 900 were selected randomly to receive the survey. The researchers received only 114
responses, i.e., 12.6 percent of the sample. To collect the data for this study, a questionnaire was
sent by mail.
Result. Teachers rank-ordered the list of reasons why they had left the profession or would
consider leaving as follows:
Already left teaching: 1) accountability, 2) increased paperwork, 3) student attitudes, 4) no
parental support, 5) unresponsive administration, 6) low status of the profession, and 7) salary
considerations.
Would consider leaving: 1) salary considerations, 2) increased paperwork, 3)
accountability, 4) low status of the profession, 5) unresponsive administration, 6) student
attitudes, and 7) parents support.
The study of Ingersoll and Smith’s (2003) was guided by this question:
42

Why is the attrition rate of beginning teachers so high?
Method. the researchers based their study on the School and Staffing Survey (SASS) and on the
Teacher Follow-up Survey (TFS). Both are considered the largest and most comprehensive data
sources available on teachers and on staffing.
Result: the study found these important results:
1. Of the leavers, 19 percent left because of school staffing action such as a
cutback, layoff, termination, school reorganization, or school closing.
2. About 39 percent left for better jobs.
3. About 29 percent left because they felt dissatisfied with teaching (more than
three-fourths linked it with low salary).
The purpose of Cheuk and Wong’s (1995) study was to document the difficulties that
teachers in Macau encountered in their work, the extent to which the job-related difficulties
would induce burnout, and whether or not social support could buffer the adverse effects of
stress on burnout.
Method. The sample of this study was 80 pre-service teachers who were enrolled in a teacher
program at the University of Macau agreed to participate. To collect the data the researchers used
survey as instrument’
Result. The study found that the support of peer teachers, supervisor, or family may have a
positive impact on teacher burnout.
The purpose of Pedrabissi, Rolland and Santinello’s (1991) study was to show
differences between culture-bound stress levels in two samples of elementary and junior high
school teachers in Italy and France.
43

Method. The sample of this study was 299 Italian teachers with a mean age of 36.34 years
(79.3% female), 217 French teachers with a mean age 38.14 years (57.6% female). To collect the
data for this study the researchers used Maslach Burnout Inventory, a questionnaire of 22 items.
Result. The most important result was that different cultural and professional contexts exerted a
greater influence on stress indicators in subjects who did the same job and that these variables
were more significant than age or gender.
The purpose of Stinebrickner’s (2001) study was to examine the effect that personal
factors and wages had on a teacher’s decision to enter and leave the teaching profession after the
certification decision had been made.
Method. The sample of this study was 450 individuals who became certified to teach at some
point between 1975 and 1985. to collect the data for this study, the researcher use a questionnaire
that asked questions about the teachers’ experiences.
Result.
1. The proportion of individuals who choose to teach decreased significantly over time
after certification, even after controlling for geographical mobility and multiple spells
in teaching.
2. Marital status and number of children were very important predictors of exits out of
the workforce for women.
44

The purpose of Stinebrickner’s (2002) study was to examine both the timing of exits from
the teaching profession and the reasons for these exits. This research was guided by these
questions:
1. What is the relative importance of different exit reasons in the determination of
overall teacher attrition rates?
2. Do different types of teachers leave teaching for different reasons?
3. To what extent are marital and fertility variables related to teaching duration and the
reason that individuals leave teaching?
4. To what extent do higher teaching wages have different effects on different types of
exits?
5. To what extent do teachers who leave their first teaching spell return in the near
future and how do return rates vary with the exit reason?
6. How do the attrition rates of teachers compare with attrition rates of nonteachers with
similar levels of educational attainment?
Method. The sample of this study was 22,652 students who were expected to graduate from high
school in the year 1972. to collect the data for this study the researcher use follow-up surveys in
1973, 1974, 1976, 1979, and 1986. The survey contained items about work experience,
education, marriage, and fertility.
Result.
1. Teachers with higher wages were significantly less likely to change occupations.
2. Family variables had a significant effect, for example, married women were two
times as likely to leave the work force as unmarried women. Also, a woman with a
45

newborn child was eight times as likely to leave the work force as a woman without
one.
3. Most of the teacher attrition was not because of other job attractions but was related
to individual family reasons.
2.3.5.1. Summary Table (2) Summary of the Major Studies
Study Factors
Keyri(2002) socio-economic school status, gender, years of experience, grade, lack of support, school policy, time, money, student discipline problems
Lester (1986) pay advancement recognition
Marlow and Inman(1997) prestige Ruhland(2001) Salary, lack of job advancements, licenses
requirements, stress Theobald and Gritz (1995) salary Murnane and Olsen(1990) Subject, grade, NTE scores, salary Fox, and Certo (2001) Salary and benefits, external career
opportunities, administration, professionals development, autonomy, planning time, class size, standard of learning pressure, lack of parental support, resources and supplies
Tye and O’Brien (2002) Accountability, increased paperwork, student attitudes, parents support, unresponsive administration, low status of the profession, salary
Ingersoll and Smith (2003) better job, salary Cheuk and Wong(1995) Support of peer teachers, supervisor, family Stinebrickner (2001) Training, marital status Stinebrickner (2002) Salary, family ( marriage, number of children,
newborn child), other job attraction.
46

2.4. Section III: Factors of Teacher Attrition in the UAE
2.4.1. Country Background
The United Arab Emirates (UAE) is a relatively new nation, born in December 2, 1971
through a union of seven existing emirates. Until fairly recent times, these emirates were
characterized by long –standing disputes feuds, rebellions, and, often, open warfare between and
within tribes. The impetus for putting aside internecine quarrels and forming a union was the
commercial development of profitable oil fields and the realization by the several sheikhs of the
great dangers inherent in small, separate, oil rich emirates attempting to survive in a tough
neighborhood and the corollary value of creating a union to keep the “bullies at bay.” (ECSSR,
2002).
The exploitation of oil fueled an incredible modernization process in the UAE. In just a
generation’s time, the nation was transformed from a sleepy desert backwater dependent on
fishing, pearling, trading, and wadi agriculture to a complex, consumer economy supported by
modern transportation and communication systems. All types of businesses: banking, insurance,
agriculture, hotels, and particularly, trade expanded rapidly after oil exploitation began. The
UAE’s major cities Dubai, Abu Dhabi, and Sharjah, have developed both a merchant class and
an extensive international trade. While oil remains the life blood of the economy, efforts to
diversify have met with considerable success, and non oil share of GDP has been rising steadily
(Taifour, 1994)
The tremendous economic expansion has been greatly beneficial to UAE’s citizens, but it
has been also due to the importation of foreign workers who had the needed skills and were
attracted by the “oil boom” prices that expatriates workers could demand. The result has been
47
that UAE relies almost entirely on expatriates in all sectors of the economy except government.
Overall, nationals total about 10 per cent of the workforce. (ECSSR, 2002)
The twin dominance of both the workforce and the total population by not nationals has
caused considerable anxiety among the nation’s leaders because too much of the nation’s future
is in the hands of a foreign population. Periodically, the government has launched campaigns to
get larger numbers of nationals to enter the workforce and to play increasingly significant roles, a
process called “Emeritization” (Shouly, 1995) since the supply of foreigners cannot easily be
curtailed or eliminated, the next best alternative is to try to upgrade the quality of national
workers and make them more competitive in the job market. This effort has put great pressure on
the educational system to produce larger number of nationals who are ready, willing, and able to
enter the work force and on the Ministry of Education (MoE) to find ways to get more national
teachers into schools.
2.4.2. Education in the UAE
At the nation’s funding, education was viewed as an integral part of the UAE’s
development plans, and the nation’s leaders were early converts to the concept of human
resource development and the idea that investment in “population quality and in the knowledge
in large part determines the future of mankind” (ECSSR, 2002) They have since instituted a
system of schooling that is universal and free to all citizens from kindergarten though university.
The overwhelming majority of citizen had no experience with formal schooling and 90 per cent
of them were illiterate: There were no school buildings, no books, no curriculum, and, of course,
no teachers. Nowadays, UAE’s education official can point with justifiable pride to a
comprehensive system of education spanning the range from kindergarten though high school
48

free and open to all citizens. The UAE achieved universal primary education in just 25 years, a
feat that took much longer in the United State and Western Europe. (Gardner, 1995)
2.4.3. Teacher Situation
The Ministry of Education’s (MoE) teachers supply policy has had three major goals (MoE,
2002):
1. to provide enough teachers for schools
2. to increase the number and percentage of national teachers
3. to increase the level of qualification and training for teachers generally.
Various strategies have been used to meet the MoE’s goals of employing national
teachers. One is to accept the bare minimum in the way of teaching qualifications. Nationals
have never been required to complete a teacher training course or a college degree to qualify
for a teaching profession. Gardner (1995), who noticed this phenomena, wrote “… thousands
have entered classrooms without formal training of any kind. Even today there is no specified
training level for national to get a teaching job, and nothing like a teaching certificate exists
in the UAE”( p. 294)
Another recruitment device is the prospect of rapid advancement. Once in they system,
nationals are quickly promoted into administrative posts, a policy that has put most of the
schools under national leadership. Currently according to the ministry of Education data,
more than 70 per cent of all principals and vice principals are nationals. (MoE, 2002)
Initially, the MoE had responsibility for teacher education, but this began to shift to the
College of Education when the University of United Arab Emirates (UAEU) opened its doors
in 1977. Although the MoE continues to play an important role in in-service education, the
UAEU became the major provider of pre-service teacher education to nationals. The College
49

of Education program currently consists of standard four years training model. Planning
efforts have projected a fifth year program that will stress stronger academic education and
more rigorous overall training program for prospective teachers (Gardner, 1995). This fifth
years plus one year as required period for “Basic Education Skills” made teacher students
study extend to at least 6 years, which caused that students tend to avoid entering the college
of education. To encourage student to be teachers, the Consult of Ministers decided in 2002
to introduce monthly income for all students in College of Education.
2.4.4. Teacher: Power and Culture
According to the statistics (ECSSR, 2002), the UAE national people are presenting less
than the half of the total population of the country. The government in UAE is racing with the
time to make the percentage of nationals and foreigners equal to each other, at least, since to
make nationals the majority is improbable mission in the near future. There are many reasons for
making the UAE people like a minority in their own homeland. First of all, the land before the
oil exploitation was one of the poorest counties, and it had historically few numbers of people
were willing to challenge the harsh nature and settle. So, in the time of oil exploitation the
nationals numbers were few, and the “oil” brought modernity and economic explosion that the
nationals are not able to deal with it alone. Since that, the government on order to “reform” the
population structure has two options with no third. The first option is to increase the national
numbers by encouraging them to get married and have children. But this option is not
guaranteed, and it also needs a very long time, since the citizenship is restricted on the real
national and no way to increase the number by “emiretize” immigrants. The second option is to
decrease the number of foreigners, which is a very hard decision to make for many reasons. One
50

reason is the fast developing of the country in every aspect of the life, which needs to be handled
by qualified people who are not available in sufficiently among the nationals. Because of that,
the government tries to control the foreigners’ number in order to make the balance between
nationals and foreigners.
In UAE all kinds of schooling in the country is laying under the Ministry of Education
(MoE) umbrella. The recent statistics (MoE, 2002) show the numbers of teachers and it appears
clearly in these statistics that the number of national teachers is less than their foreigners
colleagues. Despite that, the increasing numbers of nationals teachers is remarkable during the
last 30 years. But, this increasing does not achieve the goal of government that aims to reach
100 per cent of nationals teachers. Without going into the argument about “100% national
teachers” and its advantages and disadvantages, it seems that reaching this percentage cannot be
accomplished, at least in the near future. There are many factors building up this hypothesis. The
most important one is the naturally increasing number of students every year, which is larger
than the number of graduated students of colleges of education in UAE. For example, the
statistic of UAE University (1998) show that the number of student enrollment in the College of
Education is 186 male, while the male students who enroll in the kindergartens every year are
about 3389 (MoE, 2002). This reveals how this problem will continue at least in the male
schools.
2.4.5. Teacher: Promotion Culture
Not only in the Ministry of Education, but also it is the norm among all governmental
sectors in UAE that national employees are promoted fast and easy. Government, by offering
“easy promotion” tries to eradicate the steps to reach their goal. There is a strong belief in
51

UAE that a “national” has the right as a citizen to have a better position than others “foreigners”
employees in the same sector. Putting a national in powerful position means for many people an
important step toward “Emeritization”. Better position means more power for nationals over
foreigners, which is on one perspective, would bring more experience to promoted person, as
well as will encourage more nationals to enter into this sector.
The idea or the view of “power over” has created a kind of new culture among nationals.
A culture that could be “promotion culture” which makes nationals think of “fast promoting or
fast leaving”. Working in governmental sectors, teaching is among them, means easily and fast
promotion for nationals, but in teaching the opportunities for promotion are less than other
sectors because of the nature of the profession.
2.4.6. Factors of Teacher Attrition in the UAE
2.4.6.1. Family Pressure
This factor is related to women more than men teachers. Despite teaching is considered,
culturally, one of the most appropriate profession for women in UAE, it is suffering from high
rate leaving of women. Culturally, UAE women get married at an early age (20-25), it is
culturally also to have more than one child, and 5-7 children are a very common number of
children in UAE. Women with more children and a new baby are most likely leaving the
profession. Especially that a culture of daycare center and babysitting is not very common in the
UAE society. According to Gardner( 1995) that “ About 95% of the FoE [Faculty of Education]
enrollment is female, and many female graduates marry and stay at home with their families or
enter another occupation in social service fields rather than take teaching positions” ( p. 295)
52

2.4.6.2. Prestige Males teachers are more affected by this factor than females. Teaching in UAE, for long
time, has been known as a work for the foreigners. Those foreigners historically have a low
status socially and economically. This “image” of foreign teachers still exists strongly among the
people of UAE. The social pressure pushes the national teachers, especially men teachers, to
leave the profession, and to discourage new teachers to make a decision to become a teacher.
Gardner (1995) found that that the major and growing problem in increasing numbers of national
especially the males is “... the lack of interest by national male to enter teaching “ ( p.295)
2.4.6.3. Workload Teaching is a very demanding job. Number of periods, paper works, testing preparation,
grading, and others all these make teachers busy the whole day. Comparing to other job, teaching
it seems to be the only profession that keeps teachers busy after the work hours. Many teachers
feel that they do not have break or afternoon off; even their weekends are busy with teaching
work, like grading and lessons preparations. In UAE the schools day starts at eight AM and ends
by two P.M. everyday like other professions in public sectors. The difference between teaching
profession and other profession is that teaching work keeps going after the schooling hours,
when most of other professions are free by the end of the work hours. Those who are in others
professions rather than teaching use this opportunity to improve their income by doing some
business during the afternoon time. Many people in UAE gain from afternoon business more
than what they gain from their profession, but they keep their profession for many reasons such
as fixed monthly income, secure job for any unexpected circumstances. On the other hand,
teachers do not have the time to do afternoon business which pushes them to think again in their
decision of being a teacher.
53

3. Chapter III
Method
3.1.
3.2.
Introduction
The purpose of this study was to examine the factors associated with the high attrition
rate among UAE citizen teachers. Based on previous studies, the factors associated with teacher
attrition are employment, sociocultural, personal, economic, and teacher preparation. In order to
conduct this study, both quantitative and qualitative research methods were used.
In the quantitative method, descriptive research was utilized as it “determines and
describes the way things are” (Gay & Airasian, 2000. p. 275). This kind of research method, also
called survey research, is commonly used in many fields of research; a high percentage of
research studies are descriptive in nature. The descriptive method also is considered very useful
for investigating a variety of educational problems. It is used with the assessment of attitudes,
opinions, preferences, demographics, practices, and procedures.
In the qualitative method, a positivistic approach was used; this explores how phenomena
are experienced by participants. Compared to the quantitative method, which uses numbers and
statistics, the qualitative method is based on the collection and analysis of non-numerical data,
such as interviews. This approach seeks to probe deeply into the research setting in order to
understand the way things are, why they are that way, and how the participants in the context
perceive them (Gay & Airasian, 2000).
Research Questions
1. From the perspective of a teacher who is still in the profession, what personal factors are
associated with teacher attrition?
54

2. From the perspective of a teacher who is still in the profession, what economical factors are
associated with teacher attrition?
3. From the perspective of a teacher who is still in the profession, what employment factors are
associated with teacher attrition?
4. From the perspective of a teacher who is still in the profession, what teacher preparations
factors are associated with teacher attrition?
5. From the perspective of a teacher who is still in the profession, what social-cultural factors are
associated with teacher attrition?
3.3. Research Design
Both qualitative and quantitative methods were used in conducting this study. For the
quantitative method, a questionnaire was built to gather data from teachers regarding teacher
attrition. The questionnaire contains five groups of questions, each representing one of the five
factors that this study aims to explore. These five factors are derived from previous studies. The
literatures suggest these five factors for teacher attrition: personal, economic, employment,
socio-cultural, and teacher preparation (Billingsley, 1993; Darling-Hammond, 2003;
Macdonald, 1999). The survey instrument was sent to teachers still in the profession in UAE
public schools. The purpose of the survey instrument is to collect data from teachers about
factors that affect their decision to stay or to leave teaching.
The qualitative part of the study collected data using personal interviews with participants
in order to determine from their experiences the factors associated with UAE citizen teacher
attrition.
55

3.4. Sample
The sample in this study was drawn from all UAE citizen teachers (males and females)
who still are in the profession as teachers in public schools in UAE at the time that this study was
conducted. It is assumed that teachers still in the profession would have a better understanding of
some factors, such as stress, students’ attitudes, and school environment. The teachers in the
profession also would be more willing to provide information about what they think would affect
their decisions to stay or to leave teaching.
Based on the Ministry of Education statistics (2001), the total number of teachers in the
public schools was 23,459; the citizen teachers represent one-third of the whole teacher number
( N=8158). Among those 8158 teachers, the number of female teacher is 7,480, whereas the
number of male teachers is 678. By using Table 4.2 (Gay & Airasian, 2000), to determine the
sample size, it is found that the appropriate sample was 594 teachers. Since there is a big gap
between the numbers of female and male teachers, the same technique was used in determining
the sample size of each gender. Based on that technique, the female teachers sample size was
360, and the males sample size was 234. Although the number of female teachers is remarkably
higher than the male teachers' number, this technique suggested appropriate sample for each
group that relatively are closed to each other. The sample is also divided based on the
educational zones. There are nine educational zones in UAE, and the researcher aimed to find 66
participants from each zone (26 male and 40 female).
The qualitative part of this study used a personal interview approach to collect data from
five selected participants whose educational zones have a high number of teachers. The purpose
of interviewing the directors of educational zones is to know their opinions about teacher
attrition. The directors would provide information in depth about what they think are the most
important factors associated with teacher attrition. They would be a very good resource in
56
providing data about teachers who had already left teaching. The directors also have access to the
data about the reasons for the resignations of the teachers who left.
These participants are five directors of the largest educational zones. Based on the Ministry
of Education statistics (2001), the largest educational zones, based on the number of teachers, are
Abu Dhabi, Al Ain, Al Sarjah, R.S.K, and Dubai. The directors were asked questions to gather
more in-depth information about teacher attrition from their perspective. These are the main
questions that were asked:
1. How do you describe the teacher attrition rate in your educational zone?
2. From your experience, what are the most important factors of teacher attrition in
your educational zone?
3. How would you respond to this statement:
Sociocultural factors are the most important reason for teacher attrition in the UAE?
3.5. Instrumentation
Two kinds of collecting data instrument were used in conducting this study. For the
quantitative research questions, a survey instrument was constructed to collect data from the
teachers still in their profession regarding the factors that they think affect their decision to stay
or to leave teaching. By reviewing the related literature, the researcher came up with the most
important factors that affect the decision of teachers whether to stay or to leave their profession.
Based on previous studies, five mean factors contribute to the high rate of teacher attrition. The
survey was divided into six parts, each of which asks questions about how particular factors
contribute to teacher attrition (See appendix).
57

• The first part aims to gather demographic information about the participant, such as age,
gender, and the educational zone that the participant works in.
• The second set of questions aims to collect data about how the personal factors contribute
to teacher attrition.
• The third set of questions aims to collect data about how economic factors contribute to
teacher attrition.
• The fourth set of questions aims to collect data about how employment factors contribute
to teacher attrition.
• The fifth set of questions aims to collect data about how sociocultural factors contribute
to teacher attrition.
• The sixth set of questions aims to collect data about how the teacher preparation factor
contributes to teacher attrition.
3.6. Data collection procedures
The first step in collecting data for this study was to contact the Cultural Division of the
UAE Embassy in Washington, D.C., to get a letter that explains the nature of this study and ask
for support from the Ministry of Education and Youth. Upon arriving in the UAE, a permission
request was submitted to the MoE to allow the researcher to gather data from the teachers in the
public schools. Once the permission was obtained, the principals of the randomly-selected
schools were contacted by telephone to explain to them the nature of the study, and asked for
their help. Since there was no available data in the Ministry of Education about the schools that
have more citizen teachers, the researcher had to ask the school principals about the number of
citizen teachers in their schools. Most of the schools had fewer then ten citizen teachers,
58

especially the male schools. Based on the information obtained from the schools principals, the
researcher found out what schools have the highest number of citizen teachers. For every
educational zone, four female schools and four male schools were selected, based on the number
of the citizen teachers in them. To make the samples more representative, for each educational
zone, four schools were selected from the rural areas and another four from the suburban areas.
Based on the scheduled times with principals of the schools with ten or more citizen teachers, the
researcher visited some of these schools to distribute the questionnaires and asked friends to
distribute others. The time of collecting data varied from one school to another: some school
returned the questionnaires same day while the researcher waited; other school took from one
week to ten days.
After finishing collecting data from the teachers, the researcher started interviewing the
directors of five educational zones. The first step was to contact their offices through the
telephone and ask for an appointment with the director. Based on the scheduled appointment, the
researcher visited the director office and interviewed the directors face to face. The researcher
asked questions that were prepared earlier. All the interviews were conducted in the directors'
offices and last for about one hour.
3.7. Data entering
After the date was obtained from teachers, it was coded and entered to the SPSS program.
Each response was given a value number from 1 to 4. For example, the values of these
responses are:
Response No Effect Little Effect Medium Effect High Effect
Code 1 2 3 4
59

3.8. Data Analysis
These steps were followed to analyze the data for this study:
a. Steps to analyze quantitative data
• The data was coded and entered.
• The SPSS program was used to measure the descriptive statistics. Frequency,
means, percentage, and standard deviation were utilized.
• Chi-Square Test was used to determine if there is a significant relation between the
most important factor of each category and the obtained demographic data.
Although it is not necessary, the researcher looks at how significant is the relation
between gender, qualification, and years of experience on one side, and the most
important factor of each category as perceived by participants.
b. Steps to analyze qualitative data
• The directors’ interviews were read to get a sense of the data.
• The issues that seemed important were underlined.
• Data were broken down and organized through a process of classification.
• Data were interpreted based on the connections, common aspects, and linkages
among them.
3.9. Validity
In order to ensure that the instrument measures what it is supposed to, the researcher
followed these procedures: First, by reviewing the related literature, it found that most of the
studies indicated the importance of these five elements: economic, employment, personal,
60

teacher preparation, and sociocultural factors. Second, the instrument was checked by three
doctoral students with research experience related to this study. Third, the instrument was
revised based on the feedback. Fourth the instrument was translated to Arabic language. To
increase precision, the validity of the Arabic version of the questionnaire was verified by an
Arabic language specialist and three doctoral students with research experience related to this
study.
3.10. Pilot
The instrument was used in one pilot study to operationalize the concepts, and to minimize
misinterpretation of the questions. The group included five female and five male teachers. The
pilot study was done in the first week of September and the teachers were from the Sharjah
educational zone. This group was not a part of the study sample, but its feedback is used in
adding, deleting, and/or replacing some words to ensure the clarity of the instrument.
61

4. CHAPTER IV
ANALYSIS OF DATA
4.1. Introduction
This chapter consists of a description and analysis of the data collected from the
participants of the study through the use of a questionnaire and interview. The chapter is
subdivided into four parts. The first part presents demographic information regarding the
participant teachers (e.g., gender, age, educational zone, years of experience, highest obtained
degree, grade taught, and subject taught.) The second part of this chapter provides statistical
analyses concerning the answers obtained from teachers regarding their opinions about factors
associated with teacher attrition. The third part of this chapter provides a summary and analysis
of the data collected from two open-ended questions. The last part includes a summary and
analysis of data collected from structured interviews with five educational directors.
The questionnaire was divided into three parts. The first part asks demographic questions
about the participant teachers, who were asked to provide information about their gender, age,
years of experiences, qualification, grade they teach, subject they teach, and educational zone
they teach in. The second part of the questionnaire asks the participants to rate the importance of
five categories of teacher attrition factors: personal, economic, employment, teacher preparation,
and social-cultural. The third part of the questionnaire allowed the participant teachers to provide
their opinions about what they think are the most important reasons why teachers stay in the
profession, and conversely what would make them leave.
The purpose of the constructed interview was to collect in-depth data about teacher attrition
factors from five educational zone directors. The directors were asked to provide their opinions
62

about the attrition rate in their educational zone, the factors that are highly associated with
teacher attrition, and the importance of the social-culture factors.
4.2. Demographic Information about the Participants
Table 4.1 displays the frequencies and percentages of the completed questionnaires by the
participants. As shown, 445 questionnaires were completed out of 594 questionnaires sent out for
a 75% response rate. The highest percentage of completed questionnaires was obtained from the
Sharjah Educational Zone with 66 (14.8%) participants. Sixty-one questionnaires (13.7%) were
completed by Fujeerah teachers, while 58 (13%) and 55 (12.4%) were completed by Al Ain and
Ras Alkaima educational zones respectively. The completed questionnaires returned from Umm
Alquin, Abu Dhabi, and Ajman were 53 (11.9%), 49 (11%) and 47 (10.5) respectively. The
lowest percentages of completed questionnaires were obtained from the Western and Dubai
Educational Zones, with only 22 (4.9%) participants from Western and 34 (7.6%) participants
from Dubai. the low percentages of participants from the Western and Dubai educational zones
can be understood by looking to the nature of these two zones. Dubai is a very big city with
many jobs opportunities that attract citizens to work in other professions rather than teaching.
Whereas, Western is mainly a desert with some smalls towns and the number of its population is
relatively low comparing to other educational zones.
63

Table 4.1 Frequencies and Percentages of Questionnaires Completed by the Participants
Educational Zone
Distributed Questionnaires Completed Questionnaires Percent Abu Dhabi 66 49 11.0 Alain 66 58 13.0 Dubai 66 34 7.6 Sharjah 66 66 14.8 Ajman 66 47 10.5 Umm Alquin 66 53 11.9 Ras AlKaima 66 55 12.4 Fujeera 66 61 13.7 Western 66 22 4.9 Total 594 445 100.0
Table 4.2 displays the location of the participants as being in either a suburban or an
urban area. As shown, the highest percentage of the participant was from the urban areas. In this
study there were 271 (60.9%) participants from the urban areas compared to 174 (39.1%)
participants from suburban areas.
Table 4.2 Frequencies and Percentage of Participant’s Location
Location Frequency Percent Suburban 174 39.1 Urban 271 60.9 Total 445 100.0
Table 4.3 displays the gender of the participants. As shown, the highest percentage of the
participants are female. In this study there were 312 (70.1%) female teachers and 133
(29.9%) male teachers.
64

Table 4.3 Frequency and Percentage of the Participants’ Gender
Gender of the Participants Frequency Percent Male 133 29.9 Female 312 70.1 Total 445 100.0
Table 4.4 displays the age of the participants. As shown, the highest percentage of the
participants is those aged 26-30. This age group represents approximately 38.4% (N=171) of the
total participants. Those aged 31-35 represent 29.7% (N=132) of the total participants. Sixty-four
participants were 25 years or fewer, while 49 (11%) participants were 36-40 years. Only 29
(6.5%) of the participants were more than 40 years old.
Table 4.4 Frequency and Percentage of the Participants’ Age
Age of Participants Frequency Percent 25 or less 64 14.4 26-30 171 38.4 31-35 132 29.7 36-40 49 11.0 more than 40 29 6.5 Total 445 100.0
Table 4.5 displays the participants’ qualifications. As shown, the highest percentage of
the participants is those with a Bachelor in Education. They represent 46.3 % (N=206) of the
total participants, while 43.1% (N=192) of the participants are those with a Bachelor’s in a non-
education major. Participants with Diplomas represent 6.1 % (N=27), whereas people with other
qualifications represent 4.5% (N=20).
65

Table 4.5 Frequency and Percentages of the Participants’ Qualifications
Qualifications Frequency Percent Diploma 27 6.1 Bachelor in Education 206 46.3 Bachelor in non Education 192 43.1 Others 20 4.5 Total 445 100.0
Table 4.6 displays the frequency and percentage of the participants’ educational stages.
As shown the highest percentage of the participants are those who teach in the middle stage, who
represent 40.9 % (N=182) of the total. One hundred forty eight (33.3%) of the participants teach
in the elementary stage while 115 (25.8%) teach in the secondary stages.
Table 4.6 Frequency and Percentages of Participants’ Educational Stage
Educational Stages Frequency Percent Elementary 148 33.3 Middle 182 40.9 Secondary 115 25.8 Total 445 100.0
Table 4.7 displays the frequency and percentage of the participants’ years of experience.
As shown, the highest percentage of the participants are those with five years or less of
experience who represent 42.5% (N=189) of the total. One hundred forty-six (32.8 %) of the
participants have 6-10 years of experience, while 110 (24.7%) have more than 10 years of
experience.
66

Table 4.7 Frequency and Percentage of the Participants’ Years of Experience
Years of Experience Frequency Percent 5 or less 189 42.5 6-10 146 32.8 more than 10 110 24.7 Total 445 100.0
4.3. Part I: Quantitative Part
To analyze the quantitative data, the researcher followed several steps. First, the obtained
data was coded and entered into the SPSS file. Second, the SPSS program was utilized
throughout the statistical analysis. For each research question there are three kinds of tables:
a- Tables displaying the means of the different items’ frequencies based on the participants’
responses.
b- Tables for each item illustrating in percentages the frequencies of the participants’
responses.
c- Tables illustrating in percentages the relationship between variables (gender, qualification,
and years of experience) with the most important factor of each category of factors. The Chi-
Square Test was utilized to test whether the relation is significant or not.
4.3.1. Personal Factors Research Question 1 : From the perspective of a teacher who is still in the profession,
what personal factors are associated with teacher attrition?
67

Table 4.8 reveals the means of personal factors associated with teacher attrition. As
shown in the table, teachers rated the statement “Teaching is a stressful job” as the highest
personal factor effect with a mean score of 3.31. The teachers rated the statements “Teaching
requires accountability” and “Teaching is a social mission” as the second and the third personal
factor effects with mean scores of 3.19 and 3.11 respectively. The statement “Student discipline
is a big problem” was rated as the least effect factor with a mean score of 2.84.
Table 4.8 Means and Standard Deviations of Personal Factors
Teaching is a
Social Mission
Teaching requires
accountability Teaching is a stressful job
Student discipline is a big problem
Valid 445 445 445 445 N
Missing 0 0 0 0 Mean 3.11 3.19 3.31 2.84 Std. Deviation 1.050 .987 .907 .988
As shown in Table 4.8.1, the highest percentage of the teachers (50.1%) rated “teaching
is a social mission” as having a high factor effect. Whereas 11% of the teachers rated it as
having “no effect,” 17.1% and 21% of the teachers rated it as having a “little” or “medium”
effect respectively.
Table 4.8.1 Frequency and Percentage of Personal Factor: Social Mission
Frequency Percent Cumulative
Percent Valid No effect 49 11.0 11.0 Little effect 76 17.1 28.1 Medium
effect 97 21.8 49.9
High effect 223 50.1 100.0 Total 445 100.0
68

As shown in Table 4.8.2, the highest percentage of the teachers (50.8%) rated “Teaching
requires accountability” as a high factor effect, whereas 9% of the teachers rated it as having “no
effect” and 13.9% and 26.3% of the teachers rated it as having “little” and “medium” effect
respectively.
Table 4.8.2 Frequency and Percentage of Personal Factor: Accountability
Frequency Percent Cumulative
Percent Valid No effect 40 9.0 9.0 Little effect 62 13.9 22.9 Medium
effect 117 26.3 49.2
High effect 226 50.8 100.0 Total 445 100.0
As shown in Table 4.8.3, the highest percentage of the teachers (56%) rated “Teaching is
a stressful job” as a high factor effect. Whereas 5.6% of the teachers rated it as having “no
effect,” 13.5% and 24.9% of the teacher rated it as having “little” and “medium” effect
respectively.
Table 4.8.3 Frequency and Percentage of Personal Factor: Stressful Job
Frequency Percent Cumulative
Percent Valid No effect 25 5.6 5.6 Little effect 60 13.5 19.1 Medium
effect 111 24.9 44.0
High effect 249 56.0 100.0 Total 445 100.0
69

As shown in Table 4.8.4, the highest percentage of the teachers (35.1 %) rated “Student
discipline is a big problem” as a “medium effect” factor. Whereas 30.3% of the teachers rated it
as a “high effect,” 11.7% and 22.9% of the teacher rated it as “no effect” or “little effect”
respectively.
Table 4.8.4 Frequency and Percentage of Personal Factor: Student Discipline
Frequency Percent Cumulative
Percent Valid No effect 52 11.7 11.7 Little effect 102 22.9 34.6 Medium
effect 156 35.1 69.7
High effect 135 30.3 100.0 Total 445 100.0
As shown in Table 4.8.5, the highest percent of male teachers (34.6%) think “Stress” is
the most important personal factor. The lowest percentages of male teachers (16.5%), think
“student discipline” is the most important factor. For the female teachers, the highest percent of
female teachers (36.5%), think “Accountability” is the most important personal factor while the
lowest percent of them (6.7%) think “Student Discipline” is the most important factor.
The Pearson Chi-Square Test for the relationship between gender and the most important
personal factor was significant, χ2 =18.451, p < .0005. There are 16.5 percent of the male
teachers think that Students Discipline is the most important factors, while there are only 6.7
percent of the female teachers think that this factor is the most important one for them.
70

Table 4.8.5 Gender * Most Important Personal Factor Cross-tabulation
Most Important Personal Factor
Social Mission Accountability Stress Student
Discipline Total
Count 38 27 46 22 133Male
% within Gender 28.6% 20.3% 34.6% 16.5% 100.0%
Count 90 114 87 21 312
Gender
Female
% within Gender 28.8% 36.5% 27.9% 6.7% 100.0%
Count 128 141 133 43 445Total
% within Gender 28.8% 31.7% 29.9% 9.7% 100.0%
As shown in Table 4.8.6, the highest percentage of teachers (33.9%) with experience of
five years or less think “Accountability” is the most important personal factor. The lowest
percentages of the same group of teachers (11.1%), think “student discipline” is the most
important factor. For the teachers with 6-10 years of experience, the highest percentage (32.9%)
think “Stress” is the most important personal factor while the lowest percentage (9.6%) think
“Student Discipline” is the most important factor. The same percentage (30.9%) of teachers with
experience of more than ten years think “social mission”, “Accountability”, and “Stress” are the
most important factors, while 7.3% of the same group think “Student Discipline” is the most
important factor.
The Pearson Chi-Square Test for the relationship between years of experience and the
most important personal factor was not significant, χ2 =2.837, p = .829. This indicates that years
of experience do not affect the teachers' opinion about the most important personal factors.
71

Table 4.8.6 Years of Experience * Most Important Personal Factor Cross-tabulation
Most Important Personal Factor Total
Social
Mission Accountability Stress Student
Discipline Years of Experience 5 or less Count 53 64 51 21 189 % within Years of
Experience 28.0% 33.9% 27.0% 11.1% 100.0%
6-10 Count 41 43 48 14 146 % within Years of
Experience 28.1% 29.5% 32.9% 9.6% 100.0%
more than 10 Count 34 34 34 8 110 % within Years of
Experience 30.9% 30.9% 30.9% 7.3% 100.0%
Total Count 128 141 133 43 445 % within Years of
Experience 28.8% 31.7% 29.9% 9.7% 100.0%
As shown in Table 4.8.7, the highest percentage of teachers (48.1%) with a Diploma
think “Social Mission” is the most important personal factor. The lowest percentages of the
same group of teachers (7.4%) think “student discipline” is the most important factor. For the
teachers with a Bachelor’s degree in education, the highest percentage (32.5%) think
“Accountability” is the most important personal factor while the lowest percentage (11.2%)
think “Student Discipline” is the most important factor. The highest percentage of the
teachers (31.3%) with a Bachelor’s in a non- educational major think “Accountability” is the
most important factor while the lowest percentage (8.9%) think “Student Discipline” is the
most important factor. The highest percentage of the teachers (45%) with other qualifications
think “Stress” is the most important factor while the lowest percentage (5%) think “Student
Discipline” is the most important factor.
The Pearson Chi-Square Test for the relationship between teachers’ qualifications and the
most important personal factor was not significant, χ2 =9.763, p =.370. This indicates that
72

teachers qualifications do not affect the teachers' opinion about the most important personal
factors.
Table 4.8.7 Qualifications * Most Important Personal Factor Cross-tabulation
Most Important Personal Factor Total
Social
Mission Accountability Stress Student
Discipline Qualification Diploma Count 13 7 5 2 27 % within
Qualifications 48.1% 25.9% 18.5% 7.4% 100.0%
Bachelor in Education Count 54 67 62 23 206 % within
Qualifications 26.2% 32.5% 30.1% 11.2% 100.0%
Bachelor in non- Education
Count 58 60 57 17 192
% within Qualifications 30.2% 31.3% 29.7% 8.9% 100.0%
Others Count 3 7 9 1 20 % within
Qualifications 15.0% 35.0% 45.0% 5.0% 100.0%
Total Count 128 141 133 43 445 % within
Qualifications 28.8% 31.7% 29.9% 9.7% 100.0%
4.3.2. Economic Factors Research Question 2: From the perspective of a teacher who is still in the profession,
what economic factors are associated with teacher attrition?
Table 4.9 reveals the means of economic factors associated with teacher attrition. As
shown, teachers rated “Incentives” as the highest personal factor effect, with a mean score of
3.23. The teachers rated “Salary” and “Benefits” as second and third with mean scores of 2.76
and 2.68 respectively, whereas “Doing other business” was rated as the least factor effect, with a
mean score of 2.15.
73

Table 4.9 Means & Standard Deviations of Economic Factors Contributing to Teacher Attrition
Salary Benefits Doing other
Business Incentives Valid 445 445 445 445 N
Missing 0 0 0 0 Mean 2.76 2.68 2.15 3.23 Std. Deviation 1.124 1.088 1.183 1.005
As shown in Table 4.9.1, the highest percentage of the teachers (33%) rated “Salary” as a
“high effect” factor. Whereas 30.8% of the teachers rated it as “medium effect,” 20.9% and
15.3% of the teachers rated it as “no effect” or “little effect” respectively.
Table 4.9.1 Frequency and Percentage of Economic Factor: Salary
Frequency Percent Cumulative
Percent Valid No effect 93 20.9 20.9 Little effect 68 15.3 36.2 Medium
effect 137 30.8 67.0
High effect 147 33.0 100.0 Total 445 100.0
As shown in Table 4.9.2, the highest percentage of the teachers (30.8%) rated “Salary” as
a “medium effect” factor. Whereas 28.3% of the teachers rated it as a “high effect,” 19.8% and
21.1% of the teachers rated it as “no effect” or “little effect” respectively.
Table 4.9.2 Frequency and Percentage of Economic Factor: Benefits
Frequency Percent Cumulative
Percent Valid No effect 88 19.8 19.8 Little effect 94 21.1 40.9 Medium
effect 137 30.8 71.7
High effect 126 28.3 100.0 Total 445 100.0
74

As shown in Table 4.9.3, the highest percentage of the teachers (43.4%) rated “Doing
other Business” as a “no effect" factor. Whereas 20.2% of the teachers rated it as a “high effect,”
18.9% and 17.5% of the teachers rated it as “little effect” or “medium effect” respectively.
Table 4.9.3 Frequency and Percentage of Economic Factor: Doing Other Business
Frequency Percent Cumulative
Percent Valid No effect 193 43.4 43.4 Little effect 84 18.9 62.2 Medium
effect 78 17.5 79.8
High effect 90 20.2 100.0 Total 445 100.0
As shown in Table 4.9.4, the highest percentage of the teachers (55.1%) rated
“Incentives” as a “high effect” factor. Whereas 9.4% of the teachers rated it as a “no effect”
factor, 13.3% and 22.2% of the teachers rated it as “little effect” or “medium effect” factor
respectively.
Table 4.9.4 Frequency and Percentage of Economic Factor: Incentives
Frequency Percent Cumulative
Percent Valid No effect 42 9.4 9.4 Little effect 59 13.3 22.7 Medium
effect 99 22.2 44.9
High effect 245 55.1 100.0 Total 445 100.0
As shown in Table 4.9.5, the highest percentage (48.1%) of male teachers think “Incentives”
is the most important economic factor while the lowest percentage (6%) think “Doing other
75

Business” is the most important factor. For the female teachers, the highest percentage (60.9%)
think “Incentives” is the most important economic factor while the lowest percentage (9%) think
“Doing other Business” is the most important factor.
The Pearson Chi-Square Test for the relationship between gender and the most important
economic factor was significant, χ2 =14.430, p = .002. There are 60.9 percent of the female
teachers think that Incentives is the most important economic factor, while there are about 48
percent of the male teachers think so about the same economic factor. On the other hand, there
are 34.6 percent of the male teachers think that Salary is the most important economic factor,
while about the half of this percent of female teachers think that Salary is the most important
factor. This indicates that teachers gender affect their opinion about the most important economic
factor.
Table 4.9.5 Gender * Most Important Economic Factor Cross-tabulation
Most Important Economic Factor
Salary Benefits Doing other
Business Incentives Total
Count 46 15 8 64 133 Male
% within Gender 34.6% 11.3% 6.0% 48.1% 100.0%
Count 57 37 28 190 312
Gender
Female
% within Gender 18.3% 11.9% 9.0% 60.9% 100.0%
Count 103 52 36 254 445 Total
% within Gender 23.1% 11.7% 8.1% 57.1% 100.0%
As shown in Table 4.9.6, the highest percentage of teachers (57.1%) with experience of
five years or less think “Incentives” is the most important economic factor while the lowest
percentage (10.1%) think “Doing other Business” is the most important factor. For teachers
76
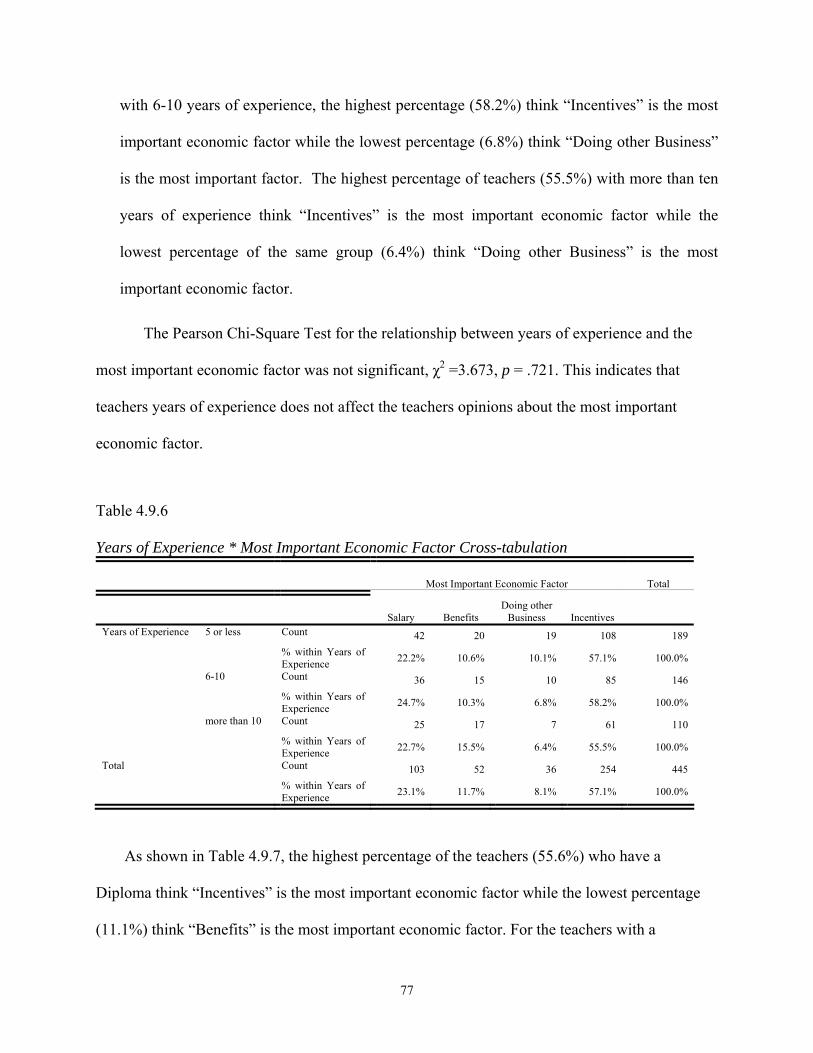
with 6-10 years of experience, the highest percentage (58.2%) think “Incentives” is the most
important economic factor while the lowest percentage (6.8%) think “Doing other Business”
is the most important factor. The highest percentage of teachers (55.5%) with more than ten
years of experience think “Incentives” is the most important economic factor while the
lowest percentage of the same group (6.4%) think “Doing other Business” is the most
important economic factor.
The Pearson Chi-Square Test for the relationship between years of experience and the
most important economic factor was not significant, χ2 =3.673, p = .721. This indicates that
teachers years of experience does not affect the teachers opinions about the most important
economic factor.
Table 4.9.6 Years of Experience * Most Important Economic Factor Cross-tabulation
Most Important Economic Factor Total
Salary Benefits Doing other
Business Incentives Years of Experience 5 or less Count 42 20 19 108 189 % within Years of
Experience 22.2% 10.6% 10.1% 57.1% 100.0%
6-10 Count 36 15 10 85 146 % within Years of
Experience 24.7% 10.3% 6.8% 58.2% 100.0%
more than 10 Count 25 17 7 61 110 % within Years of
Experience 22.7% 15.5% 6.4% 55.5% 100.0%
Total Count 103 52 36 254 445 % within Years of
Experience 23.1% 11.7% 8.1% 57.1% 100.0%
As shown in Table 4.9.7, the highest percentage of the teachers (55.6%) who have a
Diploma think “Incentives” is the most important economic factor while the lowest percentage
(11.1%) think “Benefits” is the most important economic factor. For the teachers with a
77

Bachelor’s degree in education, the highest percentage (57.8%) think “Incentives” is the most
important economic factor while the lowest percentage (5.3%) think “Doing other Business” is
the most important factor. The highest percentage of the teachers (55.2%)with a Bachelor’s in a
non- educational major think “Incentives” is the most important economic factor while the
lowest percentage(9.9%) think “Benefits” is the most important economic factor. The highest
percentage of the teachers (70%) with other qualifications think “Incentives” is the most
important economic factor while the lowest percentage (0%) think “Doing other Business” is the
most important economic factor.
The Pearson Chi-Square Test for the relationship between teachers’ qualifications and the
most important economic factor was not significant, χ2 =9.324, p = .408. This indicates that
teachers' qualifications do not affect the teachers' opinions about the most important economic
factor.
Table 4.9.7 Qualifications * Most Important Economic Factor Cross-tabulation
Most Important Economic Factor Total
Salary Benefits Doing other
Business Incentives Qualification Diploma Count 5 3 4 15 27 % within Qualifications 18.5% 11.1% 14.8% 55.6% 100.0% Bachelor
in Education
Count 48 28 11 119 206
% within Qualifications 23.3% 13.6% 5.3% 57.8% 100.0% Bachelor
in non- Education
Count 46 19 21 106 192
% within Qualifications 24.0% 9.9% 10.9% 55.2% 100.0% Others Count 4 2 0 14 20 % within Qualifications 20.0% 10.0% .0% 70.0% 100.0% Total Count 103 52 36 254 445 % within Qualifications 23.1% 11.7% 8.1% 57.1% 100.0%
78

4.3.3. Employment Factors Research Question 3: From the perspective of a teacher who is still in the profession,
what employment factors are associated with teacher attrition?
Table 4.10 reveals the means of employment factors associated with teacher attrition. As
shown in the table, teachers rated “Paperwork” as the highest effect employment factor with a
mean score of 3.07. The teachers rated “Taught Grade” as the second highest effect factor with a
mean score of 2.93. “Taught Subject” and “Number of Periods” were rated third with the same
mean, 2.91. Teachers rated “Class Size” fourth, with a mean score of 2.72. While
“Administration Support” and “Parent Involvement” were rated fifth and sixth, with mean scores
of 2.68 and 2.67 respectively, “Colleague Support” was rated the least employment factor with a
mean score of 2.24.
Table 4.10 Means & Standard Deviations of Employments Factors & Standard Deviation
Factors N Mean Std. Deviation Administration Support 445 2.68 1.064 Class Size 445 2.72 1.082 Number of Periods 445 2.91 1.088 Colleague Support 445 2.24 .963 Parent Involvement 445 2.67 1.082 Paperwork 445 3.07 1.010 Taught Subject 445 2.91 1.097 Taught Grade 445 2.93 1.074 Valid N (listwise) 445
As shown in Table 4.10.1, the highest percentage of the teachers (31%) rated
“Administration Support” as being a “little effect factor.” Whereas 15.5% of the teachers rated it
as “no effect factor,” 23.4% and 30.1% of the teachers rated it as a “medium” and “high” effect
factor respectively.
79

Table 4.10.1 Frequency and Percentage of Employment Factor: Administration Support
Frequency Percent Cumulative
Percent Valid No effect 69 15.5 15.5 Little effect 138 31.0 46.5 Medium
effect 104 23.4 69.9
High effect 134 30.1 100.0 Total 445 100.0
As shown in Table 4.10.2, the highest percentage of the teachers (30.3%) rated
“Administration Support” as a “high effect” factor. Whereas 18.5% of the teachers rated it as “no
effect” factor, 22.5% and 29.2% of the teachers rated it as a “little” and “medium” effect factor
respectively.
Table 4.10.2 Frequency and Percentage of Employment Factor: Class Size
Frequency Percent Cumulative Percent Valid No effect 80 18.0 18.0 Little effect 100 22.5 40.4 Medium
effect 130 29.2 69.7
High effect 135 30.3 100.0 Total 445 100.0
As shown in Table 4.10.3, the highest percentage of the teachers (39.1%) rated “Number
of Periods” as a “high effect” factor. Whereas 28.3% of the teachers rated it as a “medium
effect” factor, 15.7% and 16.9% of the teachers rated it as a “no effect” and “little effect” factor
respectively.
80

Table 4.10.3 Frequency and Percentage of Employment Factor: Number of Periods
Frequency Percent Cumulative
Percent Valid No effect 70 15.7 15.7 Little effect 75 16.9 32.6 Medium
effect 126 28.3 60.9
High effect 174 39.1 100.0 Total 445 100.0
As shown in Table 4.10.4, the highest percentage of the teachers (36%) rated “Colleague
Support” as a “little effect” factor. Whereas 11.5% of the teachers rated it as a “high effect”
factor, 25.6% and 27% of the teachers rated it as a “no effect” and “medium effect” factor
respectively.
Table 4.10.4 Frequency and Percentage of Employment Factor: Colleague Support
Frequency Percent Cumulative
Percent Valid No effect 114 25.6 25.6 Little effect 160 36.0 61.6 Medium
effect 120 27.0 88.5
High effect 51 11.5 100.0 Total 445 100.0
As shown in Table 4.10.5, the highest percentage of the teachers (29.4%) rated “Parent
Involvement” as a “high effect” factor. Whereas 18% of the teachers rated it as “no effect”
factor, 26.1% and 26.5% of the teachers rated it as a “little” and “medium effect” factor
respectively.
81

Table 4.10.5 Frequency and Percentage of Employment Factor: Parent Involvement
Frequency Percent Cumulative
Percent Valid No effect 80 18.0 18.0 Little effect 116 26.1 44.0 Medium
effect 118 26.5 70.6
High effect 131 29.4 100.0 Total 445 100.0
As shown in Table 4.10.6, the highest percentage of the teachers (44.7%) rated “Paperwork”
as a “high effect” factor. Whereas 10.1% of the teachers rated it as “no effect” factor, 17.1% and
28.1% of the teachers rated it as a “little” and “medium effect” factor respectively.
Table 4.10.6 Frequency and Percentage of Employment Factor: Paperwork
Frequency Percent Cumulative
Percent Valid No effect 45 10.1 10.1 Little effect 76 17.1 27.2 Medium
effect 125 28.1 55.3
High effect 199 44.7 100.0 Total 445 100.0
As shown in Table 4.10.7, the highest percentage of the teachers (40.7%), rated “Taught
Subject” as a “high effect” factor. Whereas 15.3% of the teachers rated it as “no effect” factor,
19.1% and 24.9% of the teachers rated it as a “little” and “medium effect” factor respectively.
82

Table 4.10.7 Frequency and Percentage of Employment Factor: Taught Subject
Frequency Percent Cumulative
Percent Valid No effect 68 15.3 15.3 Little effect 85 19.1 34.4 Medium
effect 111 24.9 59.3
High effect 181 40.7 100.0 Total 445 100.0
As shown in Table 4.10.8, the highest percentage of the teachers (40.7%) rated “Taught
Grade” as a “high effect” factor. Whereas 13.7% of the teachers rated it as “no effect” factor,
20% and 25.6% of the teacher rated it as a “little” and “medium” effect factor respectively.
Table 4.10.8 Frequency and Percentage of Employment Factor: Taught Grade
Frequency Percent Cumulative
Percent Valid No effect 61 13.7 13.7 Little effect 89 20.0 33.7 Medium
effect 114 25.6 59.3
High effect 181 40.7 100.0 Total 445 100.0
As shown in Table 4.10.9, the highest percentage of male teachers (33.8%) think
“Paperwork” is the most important employment factor while the lowest percentage (3%) think
“Taught Grade” is the most important factor. For the female teachers, the highest percentage
(27.9%) think “Paperwork” is the most important employment factor while the lowest percentage
(2.6%) think “Colleague Support” is the most important factor.
83

The Pearson Chi-Square Test for the relationship between gender and the most important
employment factor was not significant, χ2 =13.743, p = .056. This indicates that the teaches
gender does not affect the teachers opinions about the most important employment factor.
Table 4.10.9 Gender * Most Important Employment Factor Cross-tabulation
Most Important Employment Factor Total
Adminis Support
Class Size
Number of Periods
Colleagues Support
Parents Involvement
Paper Work
Taught Subject
Taught Grade
Gender Male Count 27 8 19 5 13 45 12 4 133 %
within Gender
20.3% 6.0% 14.3% 3.8% 9.8% 33.8% 9.0% 3.0% 100.0%
Female Count 45 16 48 8 27 87 44 37 312 %
within Gender
14.4% 5.1% 15.4% 2.6% 8.7% 27.9% 14.1% 11.9% 100.0%
Total Count 72 24 67 13 40 132 56 41 445 %
within Gender
16.2% 5.4% 15.1% 2.9% 9.0% 29.7% 12.6% 9.2% 100.0%
As shown in Table 4.10.10, the highest percentage of teachers (62.5%) with experience
of five years or less think “Parent Involvement” is the most important employment factor while
the lowest percentage (25%) think “Class Size” is the most important factor. For the teachers
with 6-10 years of experience, the highest percentage (41.7%) think “Class Size” is the most
important employment factor while the lowest percentage (7.7%) think “Colleagues Support” is
the most important employment factor. The highest percentage of teachers (33.3%) with more
than ten years of experience think “Class Size” is the most important employment factor, while
the lowest percentage of the same group (16.4%) think that “Number of Periods” is the most
important employment factor.
The Pearson Chi-Square Test for the relationship between years of experience and the
most important employment factor was not significant, χ2 =22.531, p = .068. This indicates that
84

teachers years of experience does not affect the teachers opinions about the most important
employment factor.
Table 4.10.10 Most Important Employment Factor * Years of Experience Cross-tabulation
Years of Experience Total
5 or less 6-10 more than 10 Most Important Employment Factor
Administration Support Count 33 26 13 72
% within Most Important Employment Factor
45.8% 36.1% 18.1% 100.0%
Class Size Count 6 10 8 24 % within Most
Important Employment Factor
25.0% 41.7% 33.3% 100.0%
Number of Periods Count 29 27 11 67 % within Most
Important Employment Factor
43.3% 40.3% 16.4% 100.0%
Colleague Support Count 7 1 5 13 % within Most
Important Employment Factor
53.8% 7.7% 38.5% 100.0%
Parent Involvement Count 25 8 7 40 % within Most
Important Employment Factor
62.5% 20.0% 17.5% 100.0%
Paperwork Count 51 44 37 132 % within Most
Important Employment Factor
38.6% 33.3% 28.0% 100.0%
Taught Subject Count 19 20 17 56 % within Most
Important Employment Factor
33.9% 35.7% 30.4% 100.0%
Taught Grade Count 19 10 12 41 % within Most
Important Employment Factor
46.3% 24.4% 29.3% 100.0%
Total Count 189 146 110 445 % within Most
Important Employment Factor
42.5% 32.8% 24.7% 100.0%
85
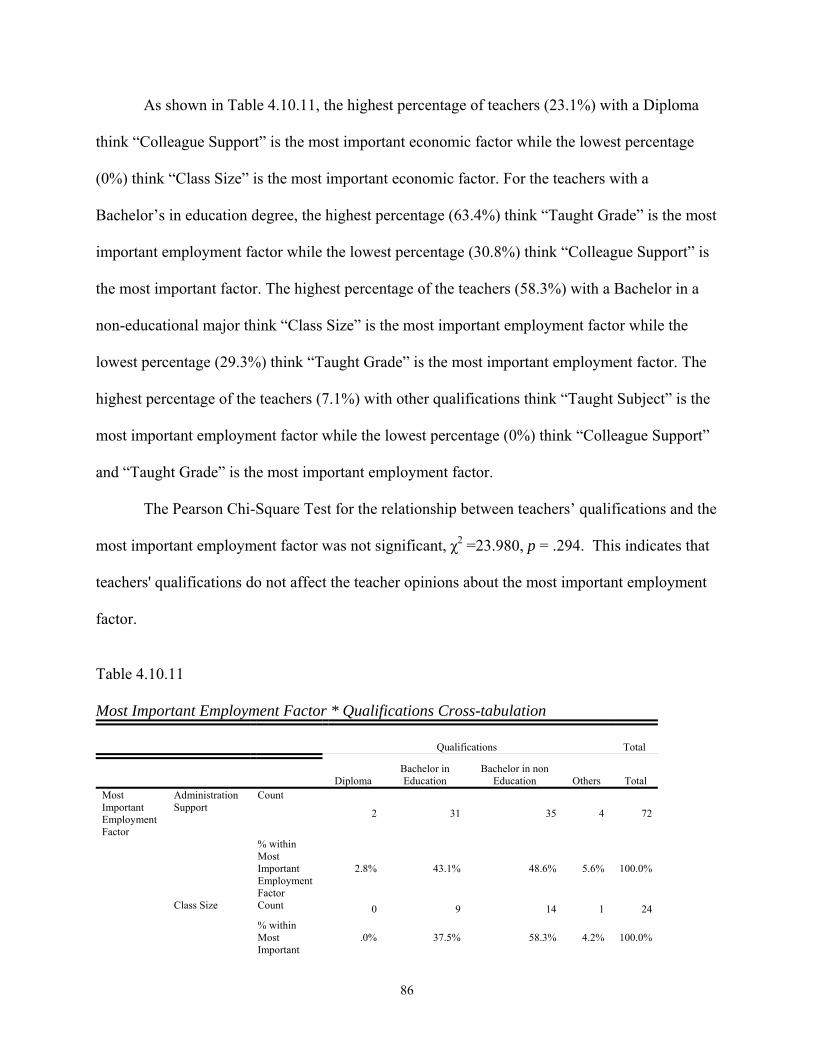
As shown in Table 4.10.11, the highest percentage of teachers (23.1%) with a Diploma
think “Colleague Support” is the most important economic factor while the lowest percentage
(0%) think “Class Size” is the most important economic factor. For the teachers with a
Bachelor’s in education degree, the highest percentage (63.4%) think “Taught Grade” is the most
important employment factor while the lowest percentage (30.8%) think “Colleague Support” is
the most important factor. The highest percentage of the teachers (58.3%) with a Bachelor in a
non-educational major think “Class Size” is the most important employment factor while the
lowest percentage (29.3%) think “Taught Grade” is the most important employment factor. The
highest percentage of the teachers (7.1%) with other qualifications think “Taught Subject” is the
most important employment factor while the lowest percentage (0%) think “Colleague Support”
and “Taught Grade” is the most important employment factor.
The Pearson Chi-Square Test for the relationship between teachers’ qualifications and the
most important employment factor was not significant, χ2 =23.980, p = .294. This indicates that
teachers' qualifications do not affect the teacher opinions about the most important employment
factor.
Table 4.10.11 Most Important Employment Factor * Qualifications Cross-tabulation
Qualifications Total
Diploma Bachelor in Education
Bachelor in non Education Others Total
Most Important Employment Factor
Administration Support
Count
2 31 35 4 72
% within Most Important Employment Factor
2.8% 43.1% 48.6% 5.6% 100.0%
Class Size Count 0 9 14 1 24 % within
Most Important
.0% 37.5% 58.3% 4.2% 100.0%
86

Employment Factor
Number of Periods
Count 2 36 26 3 67
% within Most Important Employment Factor
3.0% 53.7% 38.8% 4.5% 100.0%
Colleague Support
Count 3 4 6 0 13
% within Most Important Employment Factor
23.1% 30.8% 46.2% .0% 100.0%
Parent Involvement
Count 3 17 19 1 40
% within Most Important Employment Factor
7.5% 42.5% 47.5% 2.5% 100.0%
Paperwork Count 10 58 57 7 132 % within
Most Important Employment Factor
7.6% 43.9% 43.2% 5.3% 100.0%
Taught Subject Count 4 25 23 4 56 % within
Most Important Employment Factor
7.1% 44.6% 41.1% 7.1% 100.0%
Taught Grade Count 3 26 12 0 41 % within
Most Important Employment Factor
7.3% 63.4% 29.3% .0% 100.0%
Total Count 27 206 192 20 445 % within
Most Important Employment Factor
6.1% 46.3% 43.1% 4.5% 100.0%
4.3.4. Teacher Preparation Factors Research Question 4: From the perspective of a teacher who is still in the profession,
what teacher preparation factors are associated with teacher attrition?
Table 4.11 reveals the means of teacher preparation factors associated with teacher
attrition. As shown in the table, teachers rated the statement “Adequate in-service training” as the
87

highest teacher preparation factor effect with a mean score of 2.10. The teachers rated the
statements “Adequate pre-service training” and “Adequate Knowledge and Skills in pre-service
preparation” as second and third with mean scores of 2.04 and 2.09 respectively, whereas the
statement “Adequate pre-service training in Managing Classrooms” was rated as the least effect
factor, with a mean score of 1.84.
Table 4.11 Means and Standard Deviations of Teacher Preparation Factors
N Mean Std. Deviation Adequate pre-service training in Managing Classrooms 445 1.84 1.012
Adequate pre-service training 445 2.04 1.079
Adequate Knowledge and Skills in pre-service preparation 445 2.09 1.070
Adequate in-service training 445 2.10 1.034
Valid N (listwise) 445
As shown in Table 4.11.1, the highest percentage of the teachers (51.2%) rated “pre-
service training in Managing Classrooms” as a “no effect” factor. Whereas 9.2% of the teachers
rated it as a “high effect” factor, 22.9% and 16.6% of the teachers rated it as a “little” and
“medium effect” factor respectively.
Table 4.11.1 Frequency and Percentage of Teacher Preparation Factor: Managing Classrooms
Frequency Percent Cumulative
Percent Valid No effect 228 51.2 51.2 Little effect 102 22.9 74.2 Medium
effect 74 16.6 90.8
High effect 41 9.2 100.0 Total 445 100.0
88

As shown in Table 4.11.2, the highest percentage of the teachers (41.8%) rated
“Adequate pre-service training” as a “no effect” factor. Whereas 14.2% of the teachers rated it as
a “high effect” factor, 26.1% and 18% of the teachers rated it as a “little” and “medium effect”
factor respectively.
Table 4.11.2 Frequency and Percentage of Teacher Preparation Factor: Pre-service Training
Frequency Percent Cumulative
Percent Valid No effect 186 41.8 41.8 Little effect 116 26.1 67.9 Medium
effect 80 18.0 85.8
High effect 63 14.2 100.0 Total 445 100.0
As shown in Table 4.11.3, the highest percentage of the teachers (38.4%) rated
“Adequate Knowledge and Skills in pre-service preparation” as a “no effect” factor. Whereas
14.4% of the teachers rated it as a “high effect” factor, 28.1% and 19.1% of the teachers rated it
as a “little” and “medium effect” factor respectively.
Table 4.11.3 Frequency and Percentage of Teacher Preparation Factor: Knowledge and Skills in Pre-service Preparation
Frequency Percent Cumulative Percent Valid No effect 171 38.4 38.4 Little effect 125 28.1 66.5 Medium
effect 85 19.1 85.6
High effect 64 14.4 100.0 Total 445 100.0
89

As shown in Table 4.11.4, the highest percentage of the teachers (36.4%) rated
“Adequate in-service training” as a “no effect” factor. Whereas 12.4% of the teachers rated it as
a “high effect” factor, 29.4% and 21.8% of the teachers rated it as a “little” and “medium effect”
factor respectively.
Table 4.11.4 Frequency and Percentage of Teacher Preparation Factor: In-service Training
Frequency Percent Cumulative Percent Valid No effect 162 36.4 36.4 Little effect 131 29.4 65.8 Medium
effect 97 21.8 87.6
High effect 55 12.4 100.0 Total 445 100.0
As shown in Table 4.11.5, the highest percentage of male teachers (39.4%) think “Adequate
in- service Training” is the most important teacher preparation factor. The lowest percentage of
male teachers (14.4%) think “Managing Classroom” is the most important factor. For the female
teachers, the highest percentage (43.6%) think “Adequate In-service Training” is the most
important teacher preparation factor while the lowest percentage (10.3%) think “Managing
Classroom” is the most important factor.
The Pearson Chi-Square Test for the relationship between gender and the most important
teacher preparation factor was not significant, χ2 =1.769, p= .622. This indicates that the
teachers gender does not affect the teacher opinions about the most important teacher preparation
factor.
90

Table 4.11.5
Gender * Most Important Preparation Factors Cross-tabulation
Most Important Preparation Factors
Managing Classroom
Adequates Pre-service
training
Adequate Knowledge and
Skills Adequate in-service
training Total
Count 19 26 35 52 132Male
% within Gender 14.4% 19.7% 26.5% 39.4% 100.0%
Count 32 61 83 136 312
Gender
Female
% within Gender 10.3% 19.6% 26.6% 43.6% 100.0%
Count 51 87 118 188 444Total
% within Gender 11.5% 19.6% 26.6% 42.3% 100.0%
As shown in Table 4.11.6, the highest percentage of teachers (37.6%) with experience of
five years or less think “Adequate In-service Training” is the most important teacher preparation
factor while the lowest percentage (14.3%) think “Managing Classroom” is the most important
factor. For the teachers with 6-10 years of experience, the highest percentage of them (40.7%)
think “Adequate In-service Training” is the most important teacher preparation factor while the
lowest percentage (9.7%) think “Managing Classroom” is the most important factor. The highest
percentage of teachers (52.7%) with more than ten years of experience think “Adequate In-
service Training” is the most important teacher preparation factor while the lowest percentage
(9.1%) think “Managing Classroom” is the most important teacher preparation factor.
The Pearson Chi-Square Test for the relationship between years of experience and the
most important teacher preparation factor was not significant, χ2 =10.276, p = .113. This
indicates that teachers years of experience does not affect the teaches opinions about the most
important teacher preparation factor.
91

Table 4.11.6 Years of Experience * Most Important Preparation Factors Cross-tabulation
Most Important Preparation Factors Total
Managing Classroom
Adequate pre-service training
Adequate Knowledge and
Skills
Adequate in-service training
Years of Experience
5 or less Count 27 35 56 71 189
% within Years of Experience 14.3% 18.5% 29.6% 37.6% 100.0%
6-10 Count 14 30 42 59 145 % within Years
of Experience 9.7% 20.7% 29.0% 40.7% 100.0%
more than 10 Count 10 22 20 58 110 % within Years
of Experience 9.1% 20.0% 18.2% 52.7% 100.0%
Total Count 51 87 118 188 444 % within Years
of Experience 11.5% 19.6% 26.6% 42.3% 100.0%
As shown in Table 4.11.7, the highest percentage of teachers (44.4%) with a Diploma
think “Adequate In-service Training” is the most important teacher preparation factor while the
lowest percentage (11.1%) think “Managing Classroom” is the most important teacher
preparation factor. For the teachers with a Bachelor’s degree in education, the highest percentage
(44.2%) think “Adequate In-service Training” is the most important teacher preparation factor
while the lowest percentage (9.2%) think “Managing Classroom” is the most important factor.
The highest percentage (38.7%) of the teachers with a Bachelor’s in a non- educational major
think “Adequate In-service Training” is the most important teacher preparation factor while the
lowest percentage of the same group (14.7%) think “Managing Classroom” is the most important
teacher preparation factor. The highest percentage of the teachers (55%) with other qualifications
think “Adequate In-service” is the most important teacher preparation factor while the lowest
percentage (5%) think “Managing Classroom” is the most important teacher preparation factor.
The Pearson Chi-Square Test for the relationship between teachers’ qualifications and the
most important teacher preparation factor was not significant, χ2 =7.615, p = .573. This indicates
92

that the teachers' qualifications do not affect the teacher opinions about the most important
teachers preparation factor.
Table 4.11.7 Qualifications * Most Important Preparation Factors Cross-tabulation
Most Important Preparation Factors Total
Managing Classroom
Adequate pre-service training
Adequate Knowledge and Skills
Adequate in-service training
Qualifications Diploma Count 3 7 5 12 27 % within
Qualifications 11.1% 25.9% 18.5% 44.4% 100.0%
Bachelor in Education
Count 19 36 60 91 206
% within Qualifications 9.2% 17.5% 29.1% 44.2% 100.0%
Bachelor in non- Education
Count 28 40 49 74 191
% within Qualifications 14.7% 20.9% 25.7% 38.7% 100.0%
Others Count 1 4 4 11 20 % within
Qualifications 5.0% 20.0% 20.0% 55.0% 100.0%
Total Count 51 87 118 188 444 % within
Qualifications 11.5% 19.6% 26.6% 42.3% 100.0%
4.3.5. Social-Cultural Factor Research Question 5: From the perspective of a teacher who is still in the profession,
what social-cultural factors are associated with teacher attrition?
Table 4.12 reveals the means of social-cultural factors associated with teacher attrition.
As shown, teachers rated “Social Appreciation” as the highest effect social-cultural factor with a
mean score of 3.07. The teachers rated “Appropriateness of Teaching for my Gender” as the
second high effect social-cultural factor. “Social Prestige” was rated the least social-cultural
factor with a mean score of 1.42.
93

Table 4.12 Means and Standard Deviation of Social-Cultural Factors
N Mean Std. Deviation Social Appreciation 445 3.07 1.098 Appropriateness of Teaching for my Gender 445 1.42 .811
Social Prestige 445 2.42 1.249 Valid N (listwise) 445
As shown in Table 4.12.1, the highest percentage of the teachers (49.9%) rated “Social
Appreciation” as a “high effect” factor. Whereas 21.6% of the teachers rated it as “medium
effect” factor, 14.2% and 14.4% of the teachers rated it as a ” no effect” and “little effect” factor
respectively.
Table 4.12.1 Frequency and Percentage of Social–Cultural Factors: Social Appreciation
Frequency Percent Cumulative Percent Valid No effect 63 14.2 14.2 Little effect 64 14.4 28.5 Medium effect 96 21.6 50.1 High effect 222 49.9 100.0 Total 445 100.0
As shown in Table 4.12.2, the highest percentage of the teachers (75.1%) rated
“Appropriateness of Teaching to my Gender as a “no effect” factor. Whereas 12.4% of the
teachers rated it as “little effect” factor, 8.5% and 4.0% of the teachers rated it as a “medium”
and “high effect” factor respectively.
94

Table 4.12.2 Frequency and Percentage of Social-Cultural Factors: Appropriateness for my Gender
Frequency Percent Cumulative Percent Valid No effect 334 75.1 75.1 Little effect 55 12.4 87.4 Medium effect 38 8.5 96.0 High effect 18 4.0 100.0 Total 445 100.0
As shown in Table 4.12.3, the highest percentage of the teachers (36.0%) rated “Social
Prestige” as a “no effect” factor. Whereas 29.7% of the teachers rated it as a “high effect” factor,
15.5% and 18.9% of the teachers rated it as a “little” and “medium effect” factor respectively.
Table 4.12.3 Frequency and Percentage of Social–Cultural Factors: Social Prestige
Frequency Percent Cumulative Percent Valid No effect 160 36.0 36.0 Little effect 69 15.5 51.5 Medium effect 84 18.9 70.3 High effect 132 29.7 100.0 Total 445 100.0
As shown in Table 4.12.4, the highest percentage of male teachers (68.9%) think “Social
Appreciation” is the most important social-cultural factor while the lowest percentage (0.8%)
think “Appropriateness for my Gender” is the most important factor. For the female teachers, the
highest percentage (80.3%) think “Social Appreciation” is the most important social-cultural
factor while the lowest percentage (3.9%) think “Appropriateness for my Gender” is the most
important factor.
95

The Pearson Chi-Square Test for the relationship between gender and the most important
social-cultural factor was significant, χ2 =14.171, p = .001. There are about 16 percent of the
female teachers think that Social Prestige is the most important social-cultural factor, while there
about the double of this percentage of male teachers think that Social Prestige is the most
important factor.
Table 4.12.4 Gender * Most Important Social-Cultural Factors Cross-tabulation
Most Important Social-Cultural Factors
Social Appreciation
Appropriateness for my Gender Social Prestige Total
Count 91 1 40 132 Male
% within Gender 68.9% .8% 30.3% 100.0%
Count 248 12 49 309
Gender
Female
% within Gender 80.3% 3.9% 15.9% 100.0%
Count 339 13 89 441 Total
% within Gender 76.9% 2.9% 20.2% 100.0%
As shown in Table 4.12.5, the highest percentage of teachers (82%) with experience of
five years or less think “Social Appreciation” is the most important social-cultural factor while
the lowest percentage (2.6%) think “Appropriateness for my Gender” is the most important
factor. For the teachers with 6-10 years of experience, the highest percentage (69.7%) think
“Social Appropriation” is the most important teacher preparation factor while the lowest
percentage (3.5%) think “Appropriateness for my Gender” is the most important factor. The
highest percentage of teachers (77.3%) with more than ten years of experience think “Social
Appropriation” is the most important social-cultural factor while the lowest percentage (2.7%)
think “Appropriateness for my Gender” is the most important social-cultural factor.
96
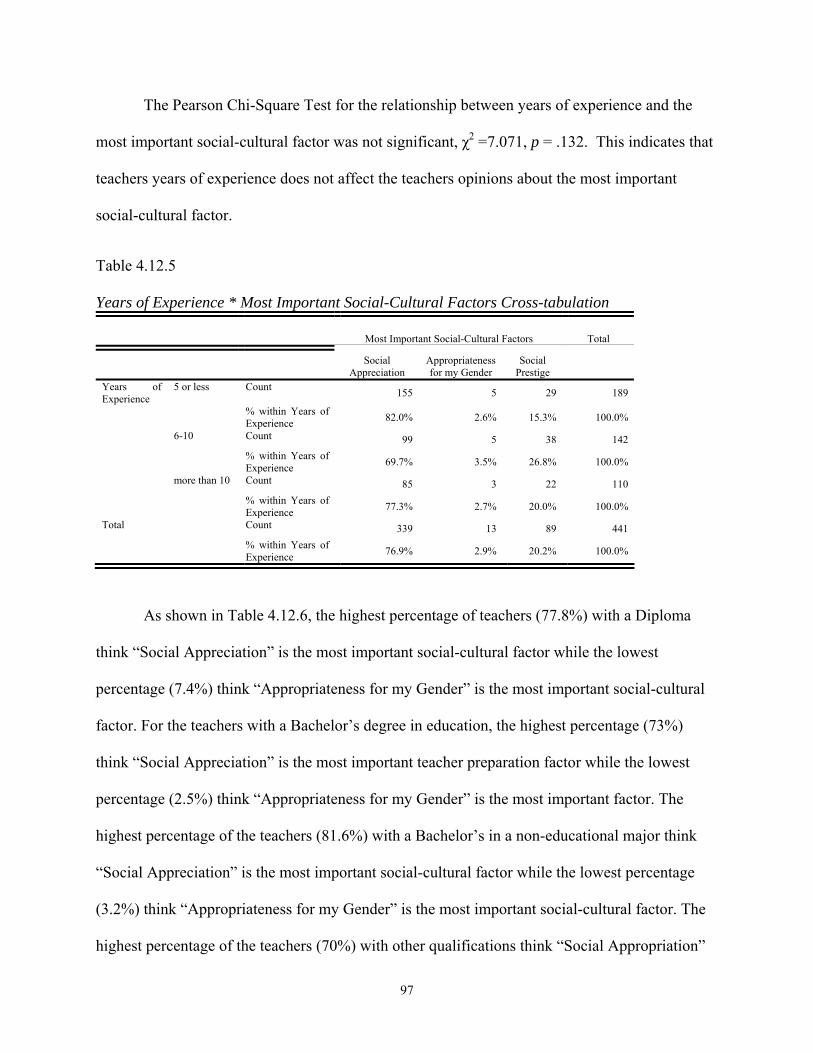
The Pearson Chi-Square Test for the relationship between years of experience and the
most important social-cultural factor was not significant, χ2 =7.071, p = .132. This indicates that
teachers years of experience does not affect the teachers opinions about the most important
social-cultural factor.
Table 4.12.5 Years of Experience * Most Important Social-Cultural Factors Cross-tabulation
Most Important Social-Cultural Factors Total
Social
Appreciation Appropriateness for my Gender
Social Prestige
Years of Experience
5 or less Count 155 5 29 189
% within Years of Experience 82.0% 2.6% 15.3% 100.0%
6-10 Count 99 5 38 142 % within Years of
Experience 69.7% 3.5% 26.8% 100.0%
more than 10 Count 85 3 22 110 % within Years of
Experience 77.3% 2.7% 20.0% 100.0%
Total Count 339 13 89 441 % within Years of
Experience 76.9% 2.9% 20.2% 100.0%
As shown in Table 4.12.6, the highest percentage of teachers (77.8%) with a Diploma
think “Social Appreciation” is the most important social-cultural factor while the lowest
percentage (7.4%) think “Appropriateness for my Gender” is the most important social-cultural
factor. For the teachers with a Bachelor’s degree in education, the highest percentage (73%)
think “Social Appreciation” is the most important teacher preparation factor while the lowest
percentage (2.5%) think “Appropriateness for my Gender” is the most important factor. The
highest percentage of the teachers (81.6%) with a Bachelor’s in a non-educational major think
“Social Appreciation” is the most important social-cultural factor while the lowest percentage
(3.2%) think “Appropriateness for my Gender” is the most important social-cultural factor. The
highest percentage of the teachers (70%) with other qualifications think “Social Appropriation”
97
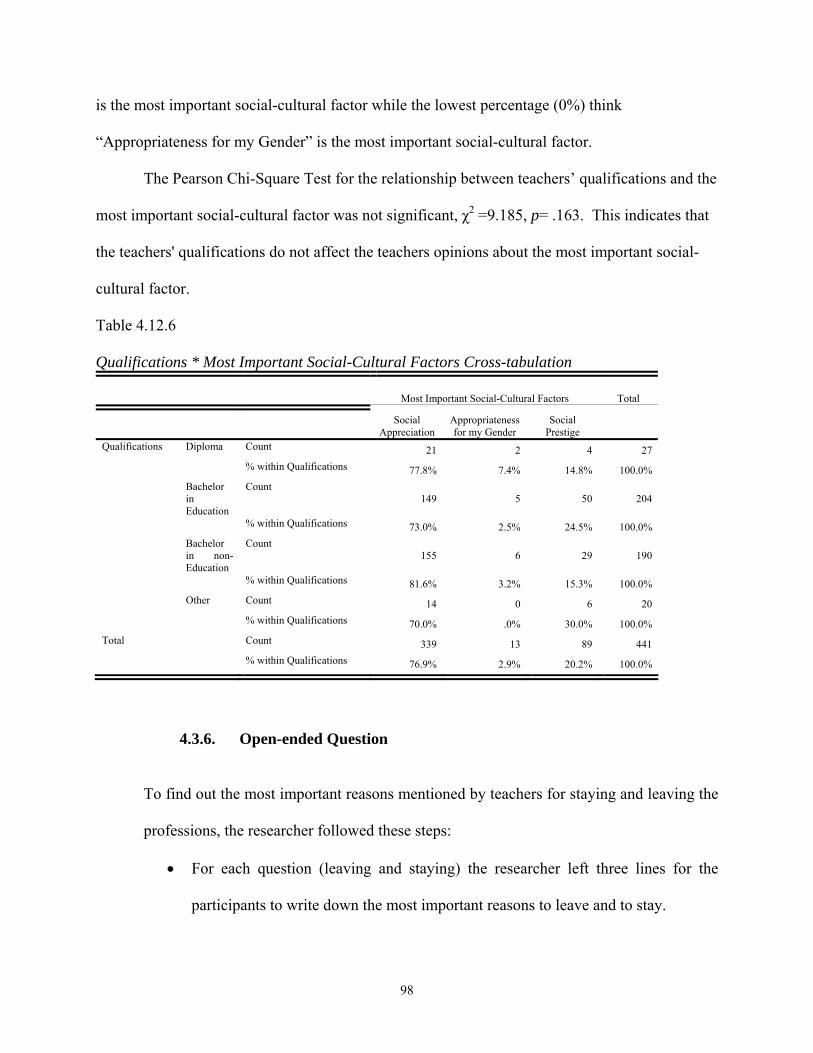
is the most important social-cultural factor while the lowest percentage (0%) think
“Appropriateness for my Gender” is the most important social-cultural factor.
The Pearson Chi-Square Test for the relationship between teachers’ qualifications and the
most important social-cultural factor was not significant, χ2 =9.185, p= .163. This indicates that
the teachers' qualifications do not affect the teachers opinions about the most important social-
cultural factor.
Table 4.12.6 Qualifications * Most Important Social-Cultural Factors Cross-tabulation
Most Important Social-Cultural Factors Total
Social
Appreciation Appropriateness for my Gender
Social Prestige
Qualifications Diploma Count 21 2 4 27 % within Qualifications 77.8% 7.4% 14.8% 100.0% Bachelor
in Education
Count 149 5 50 204
% within Qualifications 73.0% 2.5% 24.5% 100.0% Bachelor
in non- Education
Count 155 6 29 190
% within Qualifications 81.6% 3.2% 15.3% 100.0% Other Count 14 0 6 20 % within Qualifications 70.0% .0% 30.0% 100.0% Total Count 339 13 89 441 % within Qualifications 76.9% 2.9% 20.2% 100.0%
4.3.6. Open-ended Question
To find out the most important reasons mentioned by teachers for staying and leaving the
professions, the researcher followed these steps:
• For each question (leaving and staying) the researcher left three lines for the
participants to write down the most important reasons to leave and to stay.
98

• The participants' answers were categorized in common themes. The researcher
found that there are about forty themes mentioned as the most important reasons.
• These themes were computed to find out the percentage and the frequency.
1- If you decided to stay in teaching, what would be the most important reasons?
As shown in Table 4.13.1, the highest percentage of teachers (20.9%) think the most
important reason for them to stay in the profession is a “great social mission.” In addition 15.9 %
of the teachers think “I like teaching” is the most important factor for them to stay while 11.7%
think “I need the salary” is the most important.
Table 4.13.1 Reason for Staying Reason Frequency Percent Great social mission 130 20.9 I like teaching 99 15.9 I need the salary 73 11.7 2- If you decided to leave teaching, what would be the most important reasons?
As shown in Table 4.13.2, the highest percentage of the teachers (15.2%) think “too
much work “is the most important reason for them to leave teaching. In addition 11.6 % of the
teachers think “low salary” is the most important reason and while 11.3% of the teachers cite “no
allowances” as the most important one.
Table 4.13.2 Reason for Leaving Reason Frequency Percent Too much work 153 15.2 Low salary 117 11.6 No allowances 114 11.3
99

4.4. Part II: Constructed Interviews Analysis
4.4.1. Interview Question 1
How do you describe the teacher attrition in your educational zone?
The directors described “teacher attrition” in their educational zone as a significant
problem and a highly noticeable phenomenon. The directors think the number of national
teachers is few compared to the international teachers in their educational zones. There is also a
noticeable difference between the number of male teachers and female teachers, with a smaller
percentage of male teachers compared to female teachers. The following phrases are cited from
the teachers’ answers on this question:
“There is a low percentage of citizens working in the Abu Dhabi zone compared to the
international teachers. Although we have the highest number of local male teachers in the
UAE, still the number is too low and not even close to the female numbers. We can’t say that
there is attrition in female teachers, despite the number being low compared to the intentional
teachers. In fact, the number of females is increasing gradually every year. On the other hand,
the male teachers number around 350, most who came from the nearby educational zones
because they were looking for better salaries, but the number is unfortunately decreasing
instead of increasing.”
“It is really an obvious problem, as there is only a very small number of citizens who
work in the teaching field. In some schools, we don’t even have a single local teacher.”
4.4.2. Interview Question 2: From your experience, what are the most important factors of teacher attrition in your
educational zone?
100

Four out of five educational zones’ directors think the “economic factor” is the most
important one that leads a teacher to leave school. Of the economic factors, they believe salary,
incentives, lack of promotion, and attractions of other jobs are the most important ones. The
following phrases are cited from the directors’ answers on this question:
“Of course they leave for a better salary, but not just the salary, --people in other jobs
receive allowances, houses, medical insurance and many other things...”
“They look at their friends in other jobs; how they came to be in better positions than
them... those friends who have graduated with them and started working at the same
time”
On the other hand, the five directors think “teacher preparation” is the least important factor.
They also believe the “social-cultural factor” is the second most important factor, of which social
prestige and social appreciation are the most important social-cultural factors. These were some
of their words:
“Unfortunately, there is no social prestige for teacher in our society, as the image of a
teacher is still lower than that of a foreigner with a low economical and social status”
The directors think the “employment factor” is the third most important factor. They believe
the number of periods, class preparation, paperwork, and the ministry’ rules and regulations are
the most important employment factors.
“No doubt, it is a very hard job -- they teach 20 to 24 periods weekly, correcting the
students’ work…they continue working for hours after their work; preparing for the next
day’s classes”
4.4.3. Interview Question 3 How would you respond to this statement: The social-cultural factor is the most important
factor for teacher attrition in the UAE”?
101

The five directors agree with this statement but they think it is truer in the case of male
teachers than of female teachers. The directors believe the teachers in the UAE society have low
social prestige compared to other jobs, especially in the army or other governmental sectors.
Four directors out of five think the low social prestige associated with teaching as a profession in
the UAE society is a result of the historical image of teacher who was, for a good period of time,
one of those expatriates with a low social and economic status. One out of five directors thinks
the low social prestige came from the low economic status of the profession compared to other
professions.
Here are some of their words:
“No one looks to the teaching as an attractive job….once I made a visit to an elementary
school and asked the students (all males) who of them wanted to be a teacher in the future.
Not one of the students raised his hand, but when I asked who of them wanted to work in the
army, 90% of them raised their hands….it is in our culture and it will be hard to change this
image of the teacher”.
“ Many things have been changing in our society…..teaching was a female’s job a few
years ago… but even the girls now like to find a job in Etisalat (a phone company) or other
sectors even if it is a mixed sector”
4.5. Summary
Chapter IV presented discussion and analysis of the findings obtained from the study.
Both quantitative (questionnaire) and qualitative (interview) methods were used in gathering data
for this study. The results for the questionnaire were presented in three parts. The first part
included the demographic information about the teachers who participated in this study. They
102

were asked to provide some personal information such as their gender, age, qualification, years
of experience, educational zone they teach in, location (urban or suburban), subject they teach,
and grade they teach. The second part included closed questions that were categorized into five
groups. The first group posed questions about the personal factors, the second group posed
questions about the economic factors, while the third group posed questions about the
employment factor. The fourth group posed questions about the teacher preparation factors while
the last group posed questions about the social-cultural factors. The finding of these questions
were analyzed and displayed in three different kinds of table: a) Tables that display the means
and standard deviation of each group of questions; b) Tables that display the frequency and
percentage of each item in each group of questions; and. c) Tables that display the frequency and
percentages of the most important factor of each group according to the gender, qualification,
and years of experience of the participants. Part three of the questionnaire presented two open-
ended questions where the teachers were asked to list reasons why they would stay or leave the
profession.
In the last section, a report on structured interviews with five educational zone directors
was presented to determine their views about factors influencing teacher attrition in their
educational zone in particular, and in the UAE in general. The results of these interviews were
analyzed qualitatively.
103

5. CHAPTER V
SUMMARY, CONCLUSION AND RECOMMENDATION
In Chapter IV, data were presented regarding which factors are associated with teacher
attrition in UAE public schools. This chapter presents a summary of the study, conclusion and
recommendations.
5.1. Summary of the study
The purpose of this study was to examine the factors associated with the high attrition rate
among UAE citizen teachers. Based on previous studies, the factors associated with teacher
attrition are composed of personal, economic, employment, teacher preparation, and socio-
cultural factors. The factors investigated in this study investigated are, similarly personal factors,
economic factors, teacher preparation, employment factors, and socio-cultural factors.
The study was guided by five research questions:
1. From the perspective of a teacher who is still in the profession, what personal
factors are associated with teacher attrition?
2. From the perspective of a teacher who is still in the profession, what economical
factors are associated with teacher attrition?
3. From the perspective of a teacher who is still in the profession, what employment
factors are associated with teacher attrition?
4. From the perspective of a teacher who is still in the profession, what teacher
preparation factors are associated with teacher attrition?
5. From the perspective of a teacher who is still in the profession, what socio-cultural
factors are associated with teacher attrition?
104

Two kinds of data collecting methods were used in conducting this study. For the
quantitative method, a questionnaire was constructed and distributed to UAE teaches in the
public schools. 594 questionnaires were distributed to the nine educational zones and 445
completed questionnaires were obtained with a 75% reply rate. The survey was divided into
three parts (See appendix A):
• The first part asks questions about the demographic information of the participant, such
age, gender, qualifications, years of experience, and the educational zone that the
participant works in.
• The second part has five sets of questions that are categorized based on five attrition
factors. These factors are: personal, economic, employment, teacher preparation, and
socio-cultural factors.
• The third part of the questionnaire has two open-ended questions that aim to find out
what reasons make teachers stay and what reasons make them leave the profession.
For the qualitative method, a personal interview method was used to collect data from five
educational zone directors.
The finding of these questions were analyzed and displayed in three different kinds of table:
a) A table that displays the mean and standard deviation of each group of questions. b) Tables
that display the frequency and percentage of each item in each group of questions. c) Tables that
display the frequency and percentages of the most important factor of each group according to
their gender, qualification, and years of experience of the participants. The results of these
interviews were analyzed qualitatively.
105

5.2. Discussion and Conclusion
5.2.1. Personal Factors
Although the largest number of the teachers in this sample that think “teaching is a
stressful job” has the highest effect on their decision to leave the profession with a mean valued
at 3.31, “teaching requires accountability” and “teaching is a social mission” seemed to have a
high effect on teachers’ decisions as well, with a score mean valued at 3.19 and 3.11
respectively. A statistical significant relation (p< .0005) was found between gender and the most
important personal factor perceived by teachers in this study. Whereas the highest percentage of
male teachers felt that “teaching is a stressful job”, the highest percentage of female teachers felt
“teaching requires accountability” to be the most important factor. In contrast, no statistical
significant relation was found between the most important personal factor and the variables of
teachers’ years of experience and teachers’ qualifications.
The answers obtained from the directors suggested that there are relationships between
teachers’ decisions to leave and personal factors, such as the stressful feelings of responsibility
and accountability for teaching the children of others.
The related literature supports the findings of this study. For example, the ILO-UNESCO
Joint Committee (1994) report concluded, regarding an international survey which revealed that
25 to 33 percent of teachers suffered significantly from stress, that stress was a major factor
affecting teacher attrition. Benham and O’Brien (2002) also found that teachers ranked the
pressures of increased accountability as their primary reason for leaving the profession.
5.2.2. Economic Factors Although the largest numbers of the teachers taken from this sample think that
“Incentive” has the highest effect on their decision, with a mean valued at 3.23, “Salary” and
106

“Benefits” seemed to have a high effect with score means valued at 2.76 and 2.68 respectively.
A statistical significant relation (p=.002) was found between gender and the most important
economic factor perceived by teachers in this study. Despite the fact that the highest percentage
of both male and female teachers feel that “Incentive” is the most important economic factor, the
percentage of female teachers is noticeably higher than the percentage of male teachers. In
contrast, the percentage of male teachers who felt that “Salary” is the most important economic
factor is higher than the percentage of female teachers. On the other hand, no statistical
significant relation was found between the most important economic factor and the variables of
teachers’ years of experience and teachers’ qualifications.
The answers obtained from the directors suggested that economic factors have the
strongest effect on teachers’ decisions to leave the profession. Salary, allowance, houses, medical
insurance and other job attractions were suggested as the most economic important factors.
The related literature supports the findings of this study. For example, Macdonald (1999)
argues that in developed countries such as the USA and Britain, 65 and 89 percent of teachers
respectively think that salary is the most important reason for leaving the profession.
Furthermore, Chapman (1994) thinks that increasing salary is the “single most direct and
effective way to reduce attrition”. Theobald (1996) also found that, in the USA, male teachers
and the majority of experienced female teachers’ decisions to remain in teaching was most
influenced by the comparison of teaching- with non-teaching salaries.
5.2.3. Employment Factors Although the largest numbers of the teachers in this sample think that “paperwork” has
the highest effect on their decision for leaving the profession, with a mean valued at 3.07, “grade
107
taught”, “subject taught” and “number of periods” seemed to have a high effect on teachers’
decisions too, with a score mean valued at 2.93, 2.91 and 2.91 respectively. Apparently, no
statistical significant relation (p=.056) was found between gender and the most important
employment factor perceived by teachers in this study. The highest percentage of both male and
female teachers felt that “paperwork” is the most important employment factor. Whereas male
teachers think that “grade taught” is the least important employment factor, female teachers felt
that “colleagues’ support” is the least important employment factor. On other hand, no statistical
significant relation was found between the most important employment factor and the variables
of teachers’ years of experience and teachers’ qualifications.
The answers obtained from the directors suggested that employment factors such as
number of periods, class preparation, paperwork, and the Ministry’s rules and regulations are the
most important factors that affect the teachers’ decisions.
The related literature supports the findings of this study. For example, in the study of Tye
and O’Brien (2002), increased paperwork was found as the second most important factor for
leaving teaching as perceived by teachers who had already left teaching. Also, the study of Kirby
and Grissmer (1995), found that some subjects have a higher attrition rate than others. For
example, the attrition rate was found to be the highest among physics, chemistry, English and
biology’s teachers, and the lowest among mathematics teachers. On the other hand, Billingsley
(1993) argues that grade level is related to teacher attrition. It is found that secondary teachers
leave sooner than elementary teachers.
5.2.4. Teachers Preparation Factors Although the largest numbers of the teachers in this sample think that “Adequate in
service training” has the highest effect on their decision for leaving the profession, with a mean
108
valued at 2.10, “Adequate knowledge and skills in pre-service training” and “Adequate pre-
service training” also seemed to have a high effect on teachers’ decisions, with a score mean
valued at 2.09 and 2.04 respectively. Apparently, no statistically significant relation was found
between gender, teachers’ years of experience and teachers’ qualification on one hand, and the
most important teacher preparation factor perceived by teachers in this study on the other hand.
This suggests that gender, qualifications, and years of experience have no effect on teachers’
preparation factors.
The answers obtained from the directors’ interviews suggested that teachers’ preparation
is an important factor, but they do not think that it has a strong affect on teachers’ decisions to
leave the profession. They justified this by pointing out that there are many in-service workshops
and training that could help teachers to overcome his/her lack of teaching preparation.
The related literature supports the findings of this study. For example, Schwab (1995)
found that those teachers who have graduated from a five-year teacher’s education program, stay
in teaching much longer than do those who undergo the four-year teacher’s program.
Furthermore, Darling-Hammond (2003) argues that one half the teachers who had received
training in teaching, who practiced teaching, and who received feedback on their teaching left the
profession in comparison to those who had no training.
5.2.5. Social-Cultural Factors
Although the largest numbers of the teachers in this sample think that “Social
appreciation” has the highest effect on their decision for leaving the profession, with a mean
valued at 3.07, “Social prestige” also seemed to have a high effect on teachers’ decisions, with a
score mean valued at 2.4. A statistical significant relation (p=.001) was found between gender
and the most important socio-cultural factor perceived by teachers in this study. Despite the fact
109
that the highest percentage of both male and female teachers feel that “Social appreciation” is the
most important socio-cultural factor, the percentage of female teachers is noticeably higher than
that of the male teachers. In contrast, the percentage of male teachers who felt that “Social
prestige” is the most important social-cultural factor is higher than the percentage of female
teachers. On the other hand, no statistical significant relation was found between the most
important socio–cultural factor and the variables of teachers’ years of experience and teachers’
qualifications.
The answers obtained from the interviews with the directors of the educational zones
suggested that the socio-cultural factor is the second most important factor affecting the teachers’
decisions. The job prestige and the social appreciation were mentioned as the most important
socio-cultural factors.
The related literature supports the findings of this study. For example, Marlow and Inman
(1997), in talking about social appreciation, wrote:” Teachers who do not feel supported by [the]
community are likely to become disillusioned with [their] chosen profession…they often feel
pressure to improve in some undefined and sometimes unrealistic way, a feeling that can
contribute to the decision to leave teaching”(p.3). Furthermore, Murphy (1993) thinks that
teaching does not have a real professional status. He thinks that teachers do some jobs that make
their work less prestigious than other jobs.
5.2.6. Other Important Findings
• The answers obtained from the interviews with the directors of the educational zones
suggest that there is a high rate of teacher attrition in the UAE, especially among male
teachers. From their perspective, this high rate of teacher attrition is occurring because
110

there is no national strategic plan to keep teachers in the profession, and to attract others
to become teachers.
• About 21 % of the participant teachers in this study think that the reason that would make
them stay in teaching is that “teaching is a great social mission”. Lortie (1975) called it
“service appeal”. He thinks that some teachers believe that teaching is not just a
profession, but see it as a special mission for their society. Those teachers believe that
they are doing a valuable service to their country, participating in “protecting” the culture
of the society.
• About 16 % of the participant teachers in this study think that the reason that would make
them stay in teaching is that “they like teaching”. According to King’s study (1993),
some people get attracted to working with young people, and they feel that their abilities
are well suited to teaching. Lortie (1975) called it “continuation appeal”. He thinks that
some people enjoy the school environment, and that they choose to remain in an
environment they like.
• About 12% of the participant teachers in this study think that the reason that would make
them stay is that “they need the salary”. Lorite (1975) called it “second career appeal”.
He thinks that for some people, although it is not a job they like, teaching is a second
career in which there always seems to be positions available.
• About 15% of the participant teachers in this study think that the most important reason
that would make them leave the profession is “too much work”.
• About 12% of the participant teachers in this study think that the most important reason
that would make them leave the profession is “low salary”. According to the study of
111

Theobald and Gritz (1995), lowering teachers’ salaries by $ 3000 increased the
percentage of teachers choosing to leave from 31% to 43%.
• About 11% of the participant teachers in this study think that the most important reason
that would make them leave the profession is “no allowances”. According to Thompson
(1995), the additional allowances paid to science and mathematics teachers prove that
this has worked very well in keeping those teachers in the profession.
5.3. Suggestions and Implications
These are some suggestions and implications the researcher thinks that it would be helpful
to be considered by the educational policy makers in the UAE. Most of these suggestions are
based on the data obtained from teachers and the educational zones directors, other suggestions
are based on the researcher personal experience.
5.3.1. Personal Factors
Since the highest percentage of teachers in this study think that teaching is a stressful job,
it is suggested that policy makers spend more effort to make teaching a less stressful job. This
can be done by many different means. For example, the role of the supervisor should be changed
to be more supportive and co-operative rather than only remaining an administrative and
observational role.
5.3.2. Economic Factors
• It is suggested that the policy makers should increase the teachers’ salaries to an amount
that encourages the current teachers to stay, and attract others to the profession of
teaching. .
112

• It is suggested that the policy makers should keep the annual allowance continuous, and
that it should not be stopped for any reason while the teacher is still in the profession.
This strategy was used in some countries in the region, and it worked very well in making
teaching an attractive job.
• It is suggested that the policy makers should make teaching a profession with attractive
incentives. These can be done though many things such as medical insurance, housing or
long-term loans with no interest for building a house.
5.3.3. Employment Factors
• It is suggested that the policy makers should reduce the amount of paperwork for
teachers. This can be done through computerizing grading, reports and the “daily lesson
preparation”.
• It is suggested that the policy makers should reduce the workload of teachers. The
number of periods should not exceed 18 per week.
• It is suggested that teachers of some subjects with many branches have a smaller
workload than other teachers. For example, those who teach Arabic, which has more than
four different branches, should teach a smaller number of periods than those who teach
geography.
5.3.4. Teachers Preparation Factors
• It is suggested that the policy makers should pay more attention to the in-service training
for teachers. This can be done through constantly providing workshops and training.
113

• It is suggested that teachers should continue taking university courses every five to seven
years. That would keep teachers in touch with the developments occurring in his/her
specialization and in the field of education field in general.
• It is suggested that teacher education programs should be opened in other universities.
5.3.5. Social-Cultural Factors
• It is suggested that the policy makers should work on improving the professional prestige
of teaching. This can be done by differing means, such as national awards, opportunities
to participate and attend conferences in and out of the country. It can also be done
through improving the work conditions of teachers in schools, such as providing an office
with a telephone line, and a personal computer for every single teacher.
• It is suggested that the policy makers should work on improving the social appreciation
aspect of teaching. This can be done by differing means, such as media, where the role of
teachers could be presented through the creation of a decent and respectable image.
5.3.6. Other Important Findings
• National Vision: It is suggested that a strategic plan should be developed to “emertize3”
the teaching profession. It is important to reach at least an acceptable percentage of
national teachers within the coming years for many reasons. One important reason is to
protect national identity, since the numbers of citizens are very small compared to the
number of non-citizens in the total population.
3 Emeritezation is a national campaign that aims to make all jobs to be occupied be UAE citizen when it is possible.
114

• It is suggested that the policy makers should work in increasing the numbers of the
citizen male teachers as it is very few comparing to the female teachers. This can be
achieved initially by increasing the males' numbers in the teachers education colleges.
Some special attractions ideas would increase the number of males in the university such
as monthly allowance.
5.4. Recommendations for Further Studies
• The sample for this study was drawn from teachers who are still in the profession.
Therefore, it would be recommended for future studies to be done on those teachers who
have already left teaching. It is expected to be very difficult to find teachers who left the
profession and most of the time they are not interested in participating in any study
related to their previous profession. It would be helpful for the Ministry of Education to
ask every resigned teacher to fill out a survey about why he/she is leaving. Filling out a
prepared survey about the reasons behind leaving the profession should be a condition for
the resigned teacher to receive his/her final check.
• The instrument that was used to collect data from teachers was a questionnaire.
Therefore, it would be recommended for future studies to use another data collection
method, such as by means of interviews.
• It would also be recommended for future studies to be done within the group of pre-
service teachers, to gauge their perspectives on teaching.
• It is recommended for future studies to be done on males teachers to see why the leave
more than females do.
115

• It is recommended for future studies to focus on the relation between subject and teacher
attrition.
116

APPENDIX Teacher Attrition Factors Survey
I. Demographic information: 1 Age 25 or
less 26-30 31-36 36-40 More than 40
2 Years of experience Less than 5 6-10 More than 10 3 Gender Female Male 4 Subject you teach 5 Stage you teach Elementary Middle Secondary 5 Educational zone ---------------------- 6 Educational degree Bachelor in
education Bachelor in non- education
Diploma other
II. Personal factors Please indicate the degree to which the following items affect your decision to leave teaching. No. Factor Not at all Little
Effect Medium Effect
High Effect
1 A mission more than just a job 2 Accountability 3 Stressful job 4 Students’ discipline Other personal factors ………………………………………………………………….. From the above please indicate the most important personal factor that you think would your decision to leave teaching: Item number: .............. III. Economic Factors: Please indicate the degree to which the following items affect your decision to leave teaching. No. Factor Not at
all Little Effect
Medium Effect
High Effect
1 Salary 2 Teaching benefits (e.g. housing, long
holiday)
3 Personal business after work hours 4 Teaching incentives (e.g. annual
increasing salary, rewards)
Other economic factors……………………………………………………………………. From the above please indicate the most important economic factor that you think would affect your decision to leave teaching. Item number: ..............………
117

IV. Employment factors: Please indicate the degree to which the following items affect your decision to leave teaching. No. Factors Not at all Little Effect Medium
Effect High Effect
1 Administration’s support 2 Class size 3 Number of periods 4 Colleagues’ support 5 Parents involvement 6 Paperwork 7 Subject that I teach 8 Grade that I teach Other employment factors……………………………………………………………. From the above please indicate the most important employment factor that you think would affect your decision to leave teaching: Item number: ..............……… V. Teacher preparation factors: Please indicate the degree to which the following items affect your decision to leave teaching. No. Factors Not at all Little
Effect Medium Effect
High Effect
1 Managing classroom 2 Pre-service training 3 Pre-service skills and knowledge 4 In-service training Other teachers preparation factors……………………………………………………….. From the above please indicate the most important teacher preparation factor that you think would affect your decision to leave teaching:. Item number: ..............……… VI. Social-cultural factors: Please indicate the degree to which the following items affect your decision to leave teaching. No. Factors Not at all Little Effect Medium
Effect High Effect
1 Social Appreciation 2 Appropriate job for my gender 3 Prestige Other social –cultural factors……………………………………………………………. From the above please indicate the most important social-cultural factor that you think would affect your decision to leave teaching: Item number: ..............……… VII. If you decided to leave teaching, the most important reasons would be:
118

• …………………………….. • …………………………….. • …………………………….
VIII. If you decided to stay in teaching, the most important reason would be: • …………………………….. • …………………………….. • ……………………………..
IX. Please add any other suggestions or comments that you think are important to teacher attrition: ……………………………………………………………………………………………… ……………………………………………………………………………………………… ……………………………………………………………………………………………… ……………………………………………………………………………………………… ……………………………………………………………………………………………… ……………………………………………………………………………………………… ……………………………………………………………………………………………… ……………………………………………………………………………………………… ……………………………………………………………………………………………… ……………………………………………………………………………………………… End of the survey. Thank you very much.
119

BIBLIOGRAPHY
Anderson, W., (2001). Factors that motivate teachers to remain in the teaching profession in North Carolina. A dissertation submitted to the faculty of the University of North Carolina. Charlotte.
Baker, D., & Smith, T. (1997). Trend 2: Teacher turnover and teachers quality: Refocusing the
issue. Teachers College Record, 99(1). pp. 29-35. Billingsley, B. (1993). Teachers retention and attrition in special and general education: A
critical review of the literature. Journal of Special Education, 27(2). pp.137-174. Brownell, M. T.; McNellis, J. R; Miller M.D (1997). Attrition in special education: Why teachers leave the classroom and where they go. Exceptionality, 7(3), 143-155 Carnton, P., & Knoop, R. (1991). Incorporating job satisfaction into a model of instructional effectiveness. New Directions of Teaching and Learning, 48. Chapman, D. W., & Green, M. S. (1986). Teacher retention: A further examination. Journal of
Educational Research, 79, 273-279. Chapman, D.W (1994). Reducing teacher absenteeism and attrition: Cause, consequences and responses. Paris: UNISCO, Institute for Education Planning. Cheuk, W., & Wong, K. (1995). Stress, social support, and teachers burnout in Macau. Current Psychology, 14 (1).42-45 Darling-Hammond, L (2003). Keeping good teachers: Why it matters, what leaders can do. Association for Supervision and Curriculum Development Psychology, 14(1). 42-45. Eggen, B. (2001). Teacher attrition in South Carolina public schools. A dissertation submitted to the College of Education. University of South Carolina. Friedman, I., & Farber, B. (1992). Professional self-concept as a predictor of teacher burnout.
Journal of Educational Research. 86(1). 28-35. Forey. W; Christensn. O; England J. (1994). Teacher burnout: a relationship with Holland
and Adlerian typologies. Individual Psychology, 50(1).pp. 3-17
Fox J. E; Certo J. L (2001) Retaining quality teachers. Virginia Commonwealth University. Gardner, W. (1995). Developing a quality teaching force for the United Arab Emirates: Mission
improbable. Journal of Education for Teaching, 21(3), 289-301 Grissmer, D., & Kirby, S.N. (1987). Teacher attrition: The uphill climb to staff the
120

nation’s schools (Report No. 0-8330-0869-2). Santa Monica, CA: The Rand Corporation. (ERIC Document Reproduction Service No. ED 291 735).
Gritz, R. M., & Theobold, N.D (1996). The effects of school district spending priorities on length of stay in teaching. Journal of Human Resources, 31(3), 477-512
Gruenberger, B. (1980). The unhappy worker: An analysis of educational and occupational differences in the determinants of job satisfaction. American Journal of Sociology, 86, (1) 247-271.
Hanson, F., Martin, J., & Tuch, S. (1987). Economic sector and job satisfaction. Work and
Occupation, 14,(1) 286-305. Harris P (2002) Survey of California teachers. Rochester, NY: Peter Harris Research Group. Herzberg, F. (1987, September-October). One more time: How do you motivate employees?
Harvard Business Review, 14, (1)109-120. Herzberg F. (1964). The motivation-hygiene concept and problems of manpower. Personal Administration, 17, (1) 3-7. Huberman, M. (1993). Burnout in teaching careers [A]. European Education, 25(3), 47-70.
Huberman, M. (1989). The professional life cycle of teachers. Teacher College Record, 91(1), 31-57. ILO/UNESCO Joint Committee of Experts on the Application of the Recommendation Concerning the Status of Teacher (1994). Report, Geneva, July 12-20. Ingersoll, R; Smith, T. (2003) The wrong solution to the teacher shortage. Educational
Leadership. 60. (8) 30-33.
International Labour Office (1991). Teacher: Challenges of the 1990s. Geneva: 1LO Kalleberg, A. (1977). Work value and job rewards: A theory of job satisfaction. American
Sociological Review, 42, 124-143. King, S. (1993). Why did we choose teaching careers and what will enable us to stay? Insight
from one cohort of the African American teaching pool. Journal of Negro Education, 62(4), 475-492.
Kirby, S. N., & Grissmer, D. W. (1993). Teacher attrition: Theory, evidence, and suggested
policy options. Santa Monica, CA: Rand. Lawler, E. (1973). Motivation in work organizations. Monterrey, CA: Brooks-Cole.
121

Lawler, E., (1995).Foundations of job satisfaction. In Staw (Ed.), Psychological
dimensions of organizational behavior. (pp. 79-96). Englewood Cliffs, NJ: Prentice Hall.
Lester, P. (1986, February). Teacher job satisfaction: A perspective. Paper presented at the meeting of the Association of Teachers Educators, Atlanta, GA.
Liacque, J., & Schumacher. (2000). Factors contributing to job satisfaction in higher education. Education, 116 (1). 51-62. Lortie, D. (1975). School-teacher: A sociological study. Chicago: University of Chicago Press. Macdonald, D. (1995). The role of proletariazation in physical education teacher attrition
Research Quarterly for Exercise and Sport, 66 (2), 129-141.
Macdonald, D. (1999). Teacher attrition: a review of literature. Teaching and Teacher Education, 15, 853-848.
Marlow, L., & Inman, D. (1997). Beginning teachers: Are they still leaving the profession? Clearing House, 70(4). 211-215.
Marshall, I. (2002). A study of the factors contributing to the attrition rate of public school teachers in Texas. A dissertation submitted to the College of Graduate Studies. Texas A&M University-Kingsville and Texas A&M-Corps Christi.
Mashow, A. (1954). Motivation and personality. New York: Harper and Row. Metais, J. (1991) Teacher mobility in the European Community: Recruitment and management issues. Brussels: European Unit of EURYDICE. Murnane, R., & Olsen, R. (1990). The effects of salaries and opportunity cost on length of stay in
teaching. Journal of Human Resources, 25(1), 106-124. National Center for Education Statistics (NCES). (1997) America’s teachers: Profile of a Profession, 1993-94. Washington, DC: US. Department of Education. Oliveira, J., & Farrell, J. (1993). Teacher costs and teacher effectiveness in developing countries. In Oliveira, J., & Farrell, J., Teacher in developing countries: Improving effectiveness and managing costs (pp.7-24). Washington: The World Bank. Pedrabissi, L., Rolland, J., & Santinello, M. (1991). Stress and burnout among teachers in Italy
and France. Journal of Psychology, 127(5). 529-535.
122
Plascak, F. (1988). The factors and cognitive processes of university faculty job satisfaction: An empirical comparison of four cognitive models. Unpublished doctoral dissertation, Indiana University, Bloomington.
Shen, J. (1997). Teacher retention and attrition in public school: Evidence from SASS91. The
Journal of Educational Research.. 81-88. Sicherman, N., & Galor, O. (1990). A theory of career mobility. Journal of Political Economy,
98(1), 169-192. Stinebrickner, T. R. (2001). A dynamic model of teacher labor supply. Journal of Labor
Economics, 19(1), 196-230. Stinebrickner, T. R. (2002). An analysis of occupational change and departure from the labor
force. Journal of Human Resources, 37(1), 192-225. Shouly, E. (1995, June 19). 16,000 nationals apply for jobs. Gulf News, 3.
Taifour, M. (1994, January 3). UAE gearing up for 21st century. Gulf News, 18.
Theobald, N. D. (1990). An examination of the influences of personal, professional, and school district characteristics on public school teacher retention. Economics of Education Review, 9, 241-250.
Tye, B., & O’brien, L. (2002). The teachers shortage: Why are experienced teachers leaving the profession? Phi Delta Kappa, 84(1),1-9.
Wanous, J., & Lawler, E. (1972). Measurement and meaning of job satisfaction. Journal of Applied Psychology, 56, 95-105.
123