Embed Size (px)
Citation preview
Injury Prevention 1997; 3: 183- 189 183
Factors affecting the severity of motor vehicletraffic crashes involving young drivers in Ontario
Yang Mao, Jun Zhang, Glenn Robbins, Kathy Clarke, Miu Lam, William Pickett
AbstractObjectives-To assess the factors affectingthe severity of motor vehicle trafficcrashes involving young drivers in Ontar-i0.
Population-Ontario young drivers, aged16 to 20, involved in traffic crashes result-ing in injury, between 1 January 1988 and31 December 1993, on public roads inOntario.
Methods-Population based case-controlstudy. Cases were fatal injury, majorinjury, and minor injury crashes involvingyoung drivers. Controls were menmalinjury crashes involving young drivers.Cases and controls were obtained retro-spectively from the Canadian Traffic Ac-cident Information Databank. Uncondi-tional logistic regression was used for dataanalysis.
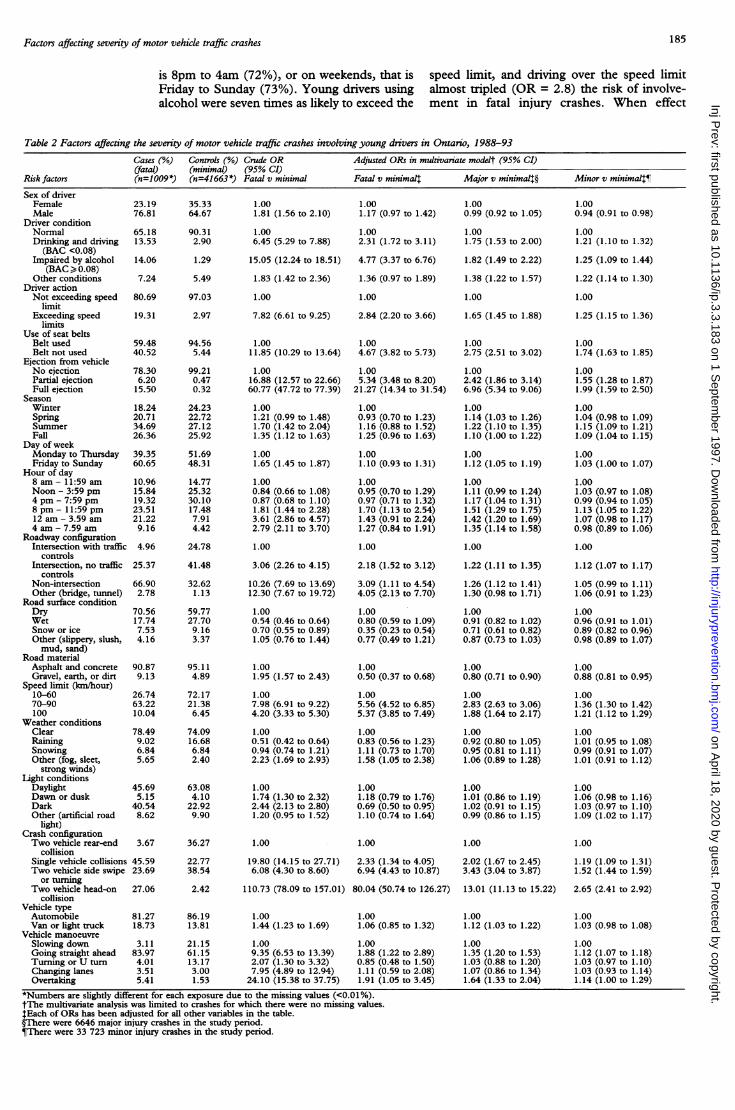
Results-Factors significantly increasingthe risk of fatal injury crashes include:drnking and driving (odds ratio (OR)2.3), impairment by alcohol (OR 4.8),exceeding speed limits (OR 2.8), not usingseat belts (OR 4.7), full ejection fromvehicle (OR 21.3), intersection withouttraffic control (OR 2.2), bridge or tunnel(OR 4.1), road with speed limit 70-90 km/hour (OR 5.6) or 100 kmlhour (OR 5.4),bad weather (OR 1.6), head-on collision(OR 80.0), and overtaking (OR 1.9).Results of the same model applied tomajor and minor injury crashes demon-strated consistent but weaker associationswith decreasing levels of crash severity.
Conclusions-A causal relationship be-tween crash severity and the risk factorslisted above was proposed. Risk factorsrecommended for preventive interventioninclude: alcohol consumption, speeding,and use of seat belts. Head-on collisionsare of primary concern.(Injury Prevention 1997; 3: 183- 189)
Keywords: motor vehicle traffic crashes; young driver;risk factor; case-control study.
Fourteen per cent of driver fatalities associatedwith motor vehicle traffic crashes in theprovince of Ontario involve drivers betweenthe age of 16 and 20 even though only 7% ofmotor vehicle drivers are in this age group.'
Risk factors for motor vehicle traffic crasheshave been documented in previous studies,'-8including driver characteristics and behaviors,environmental factors, crash characteristics,and type of vehicles involved. Studies havefocused on young male drivers,9 drinking anddriving,o"' speeding,"" not using seat
belts,'4 '5 and driving on weekends and atnight,'6 17 all of which are positively associatedwith increased risk of fatal injury. The role ofcrash type,'8 vehicle type,'9 and manoeuvre,however, has not been studied extensively. Theeffect of posted road speed limits'02' andweather conditions" 23 on the probability ofinjury or mortality is controversial.
Unlike previous reports, this epidemiologicstudy quantifies the strength of associationbetween potential risk factors and crash sever-ity-fatal, major, or minor-compared withminimal crash severity (for definitions, seetable 1). It also examines how these risk factorsare inter-related.
Materials and methodsDATABASEThe Canadian Traffic Accident InformationDatabank (TRAID, version 3), operated andmanaged by Transport Canada, compilessurveillance data from police reports of trafficcrashes. It includes crash, vehicle, and personaldata for individuals involved in collisions thatoccur on Canadian public roads and result ininjury.24
Crash data include time (month, day, hour),conditions (road, weather, light), and crashconfiguration (for example head-on). Vehicledata describe the type of vehicle and man-oeuvres involved. Personal data include roaduser (for example driver, passenger), age, sex,use of seat belts, alcohol involvement (drinkingand driving, that is blood alcohol concentra-tion (BAC) < 0.08%, or impaired, that is BAC> 0.08%), speeding, and severity of injuries(fatal, major, minor, and minimal) for indivi-duals involved in the crash. (BAC is deter-mined by various means including blood test,breath test, urine test, or police observationalone.)
Injury severity data are provided throughpolice observations at the scene and follow upthrough hospital records at 30 days if theinjured person was admitted to hospital. Fatalinjury is defined by police as death occurring
Table 1 Levels of crash severityFatal injury At least one person (driver or passenger)
crash killed (within 30 days) by injuriessustained in the crash
Major injury At least one person injured and admittedcrash to hospital but no fatalities
Minor injury At least by one person requiring medicalcrash care but no fatalities or injuries requir
ing hospitalization
Minimal injury At least one person injured (for examplecrash minor abrasions/bruises) but no medical
attention required and no other moresevere injuries
Cancer Bureau,Laboratory Centrefor Disease Control,Health Canada,Tunney's Pasture,Ottawa, Ontario,Canada KIA OL2Y MaoJ ZhangK Clarke
Road Safety andMotor VehicleRegulations, Trans-port CanadaG Robbins
Queen's University,Kingston, Ontario,Canada: Departmentof CommunityHealth andEpidemiologyM Lam
Departments ofCommunity Healthand Epidemiologyand EmergencyMedicineW Pickett
Correspondence to:Dr Mao.
on April 18, 2020 by guest. P
rotected by copyright.http://injuryprevention.bm
j.com/
Inj Prev: first published as 10.1136/ip.3.3.183 on 1 S
eptember 1997. D
ownloaded from
Mao, Zhang, Robbins, Clarke, Lam, Pickett
within 30 days from injuries sustained in thecrash. Major injury includes injury that re-quires medical treatment in hospital. Minorinjury includes injury that requires medicalattention (for example in emergency room) butnot hospitalization. Minimal injury refers toinjury such as abrasions and bruises that do notrequire medical attention.
CASE-CONTROL STUDYA population based case-control study wasconducted using all motor vehicle trafficcrashes involving drivers aged 16 to 20 andassociated with automobiles, vans, or lighttrucks in Ontario between 1988 and 1993.Crashes involving pedestrians, cyclists, largetrucks, buses, motorcycles, and other types ofvehicle were excluded. Crashes that involvedno injury and/or property damage alone werenot included because such data were notavailable for this study.
Case and control status was determined bycrash severity, that is cases were fatal, major, orminor injury crashes and controls were mini-mal injury crashes (see table 1). The outcome,crash severity, reflects the most severe injurysustained by any individual involved in thecrash. Environmental, crash, and vehicle riskfactors are also related to the crash; personalrisk factors, however, describe young drivercharacteristics and behaviors (for exampleBAC or speeding).A primary analysis compared cases, that is
fatal injury crashes involving young drivers,and controls, that is minimal injury crashesinvolving young drivers. Secondary analysesthen compared major and minor injury crashesto minimal injury crashes. A total of 1009 fatalinjury crashes and 41 663 minimal injurycrashes involving young drivers aged 16 to 20were identified from TRAID during the studyperiod. In addition, 6646 major injury crashesand 33 723 minor injury crashes were used forsecondary analyses.
This exploratory study included all potentialrisk factors available in TRAID: age, sex,drinking and driving, impaired by alcohol,speeding, use of seat belts, crash time andconditions at the crash site, crash configura-tion, and vehicle type and manoeuvre (seetable 2).
STATISTICAL ANALYSESIn the primary analysis, the crude odds ratio(OR) with 95% confidence interval (CI) werecalculated for each of these risk factors,comparing fatal injury crashes to controls.For each variable under study (for exampleroad surface condition), the risk of fatality foreach subcategory (for example wet, snow orice, and other) was compared with the refer-ence category for that variable (for example drysurface), denoted by OR= 1 in table 2. Re-lationships between the risk factors for thepopulation in the primary analysis (that is fatalcases and controls) were also tabulated usingcontingency tables.
Although the literature shows that driver
characteristics, environment, crash type, andvehicle type are all associated with fatalinjuries, it is not clear which of these factorsplay the most important parts in predicting afatal injury crash. For this reason, we adoptedan exploratory approach using a stepwiseprocedure to select the significant variablesfrom all potential risk factors available inTRAID, rather than developing a model basedon specific hypotheses. Unconditional multi-variate logistic regression analysis was used togenerate an exploratory model and to calculatepoint and 95% CI estimates of ORs.5 26The multivariate analysis was limited to
crashes for which there were no missing values.Potential interaction between risk factors, forexample, between gender and drinking, genderand speeding, and drinking and speeding werealso investigated using the log likelihood test.
In the secondary analyses, the same modeldeveloped in the primary analysis was appliedto compare associations for major and minorinjury crashes to minimal injury crashes.
ResultsWith the exception of driver age and roadcategory, all risk factors considered in thisstudy were significantly associated with the riskof fatal injury crashes in the bivariate analysis.After adjusting for potential risk factors in themultivariate logistic regression model, theserisk factors were still significant with theexception of the sex of young drivers. Overall,the relationships held, but less strongly, formajor injury crashes and minor injury crashes.Table 2 presents the ORs for risk factors forvarious levels of crash severity. Selected resultsof the inter-relationships between risk factorsare described in the text below.
DRIVER CHARACTERISTICSIn the bivariate analysis, we observed thatcrashes involving young male drivers werealmost twice as likely to be fatal as thoseinvolving young female drivers. However, thisassociation was not significant after controllingfor other potential factors, suggesting thatother factors contribute to the differences inseverity of crash betwen males and females. Inthe study population used for the primaryanalysis (that is fatal cases and controls), 6.3%ofyoung male drivers were using alcohol, 4.3%were exceeding the speed limit, and 7.2% werenot using seat belts, compared with 1.8%,1.6%, and 4.5%, respectively, of young femaledrivers. We found that there was no significanteffect modification between gender and alco-hol use or gender and speeding (change in loglikelihood 1.5, degree of freedom (df) = 3, p =0.68 and 2.8, df = 1, p = 0.10, respectively),that is young females and males who weredrinking or speeding had an equal risk of beinginvolved in a fatal crash.
Alcohol consumption increased the risk offatality in crashes by a factor of 2.3 for drinkingand driving and 4.8 for impairment, andalmost doubled the risk of major injury. Mostalcohol related crashes occurred at night, that
184
on April 18, 2020 by guest. P
rotected by copyright.http://injuryprevention.bm
j.com/
Inj Prev: first published as 10.1136/ip.3.3.183 on 1 S
eptember 1997. D
ownloaded from
Factors affecting severity of motor vehicle traffic crashes
is 8pm to 4am (72%), or on weekends, that isFriday to Sunday (73%). Young drivers usingalcohol were seven times as likely to exceed the
Table 2 Factors affecting the sevCases(fatl)
Risk factors (n=10C
Sex of driverFemale 23.19Male 76.81
Driver conditionNormal 65.18Drinking and driving 13.53(BAC <0.08)
Impaired by alcohol 14.06(BAC > 0.08)
Other conditions 7.24Driver actionNot exceeding speed 80.69
limitExceeding speed 19.31
limitsUse of seat belts
Belt used 59.48Belt not used 40.52
Ejection from vehicleNo ejection 78.30Partial ejection 6.20Full ejection 15.50
SeasonWinter 18.24Spring 20.71Summer 34.69Fall 26.36
Day of weekMonday to Thursday 39.35Friday to Sunday 60.65
Hour of day8 am- 11:59 am 10.96Noon - 3:59 pm 15.844 pm - 7:59 pm 19.328 pm- 11:59 pm 23.5112 am - 3.59 am 21.224am-7.59am 9.16
Roadway configurationIntersection with traffic 4.96
controlsIntersection, no traffic 25.37
controlsNon-intersection 66.90Other (bridge, tunnel) 2.78
Road surface conditionDry 70.56Wet 17.74Snow or ice 7.53Other (slippery, slush, 4.16mud, sand)
Road materialAsphalt and concrete 90.87Gravel, earth, or dirt 9.13
Speed limit (km/hour)10-60 26.7470-90 63.22100 10.04
Weather conditionsClear 78.49Raining 9.02Snowing 6.84Other (fog, sleet, 5.65
strong winds)Light conditions
Daylight 45.69Dawn or dusk 5.15Dark 40.54Other (artificial road 8.62
light)Crash configurationTwo vehicle rear-end 3.67
collisionSingle vehicle collisions 45.59Two vehicle side swipe 23.69
or turningTwo vehicle head-on 27.06
collisionVehicle typeAutomobile 81.27Van or light truck 18.73
Vehicle manoeuvreSlowing down 3.11Going straight ahead 83.97Turning or U turn 4.01Changing lanes 3.51Overtaking 5.41
speed limit, and driving over the speed limitalmost tripled (OR = 2.8) the risk of involve-ment in fatal injury crashes. When effect
verity of motor vehicle traffic crashes involvingyoung drivers in Ontario, 1988-93(%) Controls (%) Crude OR Adjusted ORs in multivariate modelt (95% CI)
(minimal) (95% CI)09*) (n=41663*) Fatal v minimal Fatal v minimall Major v minimal$§ Minor v minimal¶f
35.3364.67
90.312.90
1.29
5.49
97.03
2.97
94.565.44
99.210.470.32
24.2322.7227.1225.92
51.6948.31
14.7725.3230.1017.487.914.42
24.78
41.48
32.621.13
59.7727.709.163.37
95.114.89
72.1721.386.45
74.0916.686.842.40
63.084.10
22.929.90
36.27
22.7738.54
2.42
86.1913.81
21.1561.1513.173.001.53
1.001.81 (1.56 to 2.10)
1.006.45 (5.29 to 7.88)
15.05 (12.24 to 18.51)
1.83 (1.42 to 2.36)
1.00
7.82 (6.61 to 9.25)
1.0011.85 (10.29 to 13.64)
1.0016.88 (12.57 to 22.66)60.77 (47.72 to 77.39)
1.001.21 (0.99 to 1.48)1.70 (1.42 to 2.04)1.35 (1.12 to 1.63)
1.001.65 (1.45 to 1.87)
1.000.84 (0.66 to 1.08)0.87 (0.68 to 1.10)1.81 (1.44 to 2.28)3.61 (2.86 to 4.57)2.79 (2.11 to 3.70)
1.00
3.06 (2.26 to 4.15)
10.26 (7.69 to 13.69)12.30 (7.67 to 19.72)
1.000.54 (0.46 to 0.64)0.70 (0.55 to 0.89)1.05 (0.76 to 1.44)
1.001.95 (1.57 to 2.43)
1.007.98 (6.91 to 9.22)4.20 (3.33 to 5.30)
1.000.51 (0.42 to 0.64)0.94 (0.74 to 1.21)2.23 (1.69 to 2.93)
1.001.74 (1.30 to 2.32)2.44 (2.13 to 2.80)1.20 (0.95 to 1.52)
1.00
19.80 (14.15 to 27.71)6.08 (4.30 to 8.60)
110.73 (78.09 to 157.01)
1.001.44 (1.23 to 1.69)
1.009.35 (6.53 to 13.39)2.07 (1.30 to 3.32)7.95 (4.89 to 12.94)
24.10 (15.38 to 37.75)
1.001.17 (0.97 to 1.42)
1.002.31 (1.72 to 3.11)
4.77 (3.37 to 6.76)
1.36 (0.97 to 1.89)
1.00
2.84 (2.20 to 3.66)
1.004.67 (3.82 to 5.73)
1.005.34 (3.48 to 8.20)
21.27 (14.34 to 31.54)
1.000.93 (0.70 to 1.23)1.16 (0.88 to 1.52)1.25 (0.96 to 1.63)
1.001.10 (0.93 to 1.31)
1.000.95 (0.70 to 1.29)0.97 (0.71 to 1.32)1.70 (1.13 to 2.54)1.43 (0.91 to 2.24)1.27 (0.84 to 1.91)
1.00
2.18 (1.52 to 3.12)
3.09 (1.11 to 4.54)4.05 (2.13 to 7.70)
1.000.80 (0.59 to 1.09)0.35 (0.23 to 0.54)0.77 (0.49 to 1.21)
1.000.50 (0.37 to 0.68)
1.005.56 (4.52 to 6.85)5.37 (3.85 to 7.49)
1.000.83 (0.56 to 1.23)1.11 (0.73 to 1.70)1.58 (1.05 to 2.38)
1.001.18 (0.79 to 1.76)0.69 (0.50 to 0.95)1.10 (0.74 to 1.64)
1.00
2.33 (1.34 to 4.05)6.94 (4.43 to 10.87)
80.04 (50.74 to 126.27)
1.001.06 (0.85 to 1.32)
1.001.88 (1.22 to 2.89)0.85 (0.48 to 1.50)1.11 (0.59 to 2.08)1.91 (1.05 to 3.45)
1.000.99 (0.92 to 1.05)
1.001.75 (1.53 to 2.00)
1.82 (1.49 to 2.22)
1.38 (1.22 to 1.57)
1.00
1.65 (1.45 to 1.88)
1.002.75 (2.51 to 3.02)
1.002.42 (1.86 to 3.14)6.96 (5.34 to 9.06)
1.001.14 (1.03 to 1.26)1.22 (1.10 to 1.35)1.10 (1.00 to 1.22)
1.001.12 (1.05 to 1.19)
1.001.11 (0.99 to 1.24)1.17 (1.04 to 1.31)1.51 (1.29 to 1.75)1.42 (1.20 to 1.69)1.35 (1.14 to 1.58)
1.00
1.22 (1.11 to 1.35)
1.26 (1.12 to 1.41)1.30 (0.98 to 1.71)
1.000.91 (0.82 to 1.02)0.71 (0.61 to 0.82)0.87 (0.73 to 1.03)
1.000.80 (0.71 to 0.90)
1.002.83 (2.63 to 3.06)1.88 (1.64 to 2.17)
1.000.92 (0.80 to 1.05)0.95 (0.81 to 1.11)1.06 (0.89 to 1.28)
1.001.01 (0.86 to 1.19)1.02 (0.91 to 1.15)0.99 (0.86 to 1.15)
1.00
2.02 (1.67 to 2.45)3.43 (3.04 to 3.87)
13.01 (11.13 to 15.22)
1.001.12 (1.03 to 1.22)
1.001.35 (1.20 to 1.53)1.03 (0.88 to 1.20)1.07 (0.86 to 1.34)1.64 (1.33 to 2.04)
1.000.94 (0.91 to 0.98)
1.001.21 (1.10 to 1.32)
1.25 (1.09 to 1.44)
1.22 (1.14 to 1.30)
1.00
1.25 (1.15 to 1.36)
1.001.74 (1.63 to 1.85)
1.001.55 (1.28 to 1.87)1.99 (1.59 to 2.50)
1.001.04 (0.98 to 1.09)1.15 (1.09 to 1.21)1.09 (1.04 to 1.15)
1.001.03 (1.00 to 1.07)
1.001.03 (0.97 to 1.08)0.99 (0.94 to 1.05)1.13 (1.05 to 1.22)1.07 (0.98 to 1.17)0.98 (0.89 to 1.06)
1.00
1.12 (1.07 to 1.17)
1.05 (0.99 to 1.11)1.06 (0.91 to 1.23)
1.000.96 (0.91 to 1.01)0.89 (0.82 to 0.96)0.98 (0.89 to 1.07)
1.000.88 (0.81 to 0.95)
1.001.36 (1.30 to 1.42)1.21 (1.12 to 1.29)
1.001.01 (0.95 to 1.08)0.99 (0.91 to 1.07)1.01 (0.91 to 1.12)
1.001.06 (0.98 to 1.16)1.03 (0.97 to 1.10)1.09 (1.02 to 1.17)
1.00
1.19 (1.09 to 1.31)1.52 (1.44 to 1.59)
2.65 (2.41 to 2.92)
1.001.03 (0.98 to 1.08)
1.001.12 (1.07 to 1.18)1.03 (0.97 to 1.10)1.03 (0.93 to 1.14)1.14 (1.00 to 1.29)
*Numbers are slightly different for each exposure due to the missing values (<0.01%).tThe multivariate analysis was limited to crashes for which there were no missing values.lEach of ORs has been adjusted for all other variables in the table.§There were 6646 major injury crashes in the study period.TThere were 33 723 minor injury crashes in the study period.
185
on April 18, 2020 by guest. P
rotected by copyright.http://injuryprevention.bm
j.com/
Inj Prev: first published as 10.1136/ip.3.3.183 on 1 S
eptember 1997. D
ownloaded from
Mao, Zhang, Robbins, Clarke, Lam, Pickett
modification between alcohol and speedingwas examined in the multivariate model,however, it was not statistically significant(change in log likelihood 3.0, df = 3, p =0.39). Of crashes involving speeding, 63%were single vehicle collisions, compared with22% of those not involving speeding.
Drivers who were not wearing seat beltswere 4.7 times as likely to be involved in fatalcrashes as those who were wearing seat belts.Seat belt use was also significantly associatedwith crashes of less severity. Ejection from thevehicle was a strong risk factor for fatal injuryand was found to be related to not using a seatbelt. The log likelihood test used in the logisticregression model indicated that ejection in-creased the risk of fatal injury crashes inde-pendent of seat belt use (change in loglikelihood 268, df = 2, p<0.0001). Both riskfactors were used in the final model.
ENVIRONMENTCrashes occurring between the hours of 8 pmand midnight were 1.7 times as likely to be fatalcrashes after controlling for all potential riskfactors in the logistic model. In addition, majorinjury crashes were more likely to occur insummer months, on weekends, or during nighthours (ORsfrom 1.1 to 1.5,p < 0.05, seetable 2).
Crashes at intersections without traffic con-trols were twice as likely to be fatal as those atintersections with controls and crashes occur-ring on roads away from intersections werethree times as likely to be fatal as those atintersections with controls.
Slippery, slushy, or other bad road surfacesdid not increase the risk of fatal injury crashes;in fact, crashes on roads with snowy or icysurfaces were less likely to be fatal than thoseon dry roads. This does not necessarily meanthat traffic crashes are less likely to happen onsnowy or icy roads, but that collisions occur-ring on such roads tend to be less severe.Similarly, fatal injury crashes were less likely tooccur on gravel or dirt roads. On the otherhand, bad weather, such as fog, sleet, or strongwinds, did increase the risk of fatal crashesslightly and significantly, even after controllingfor other risk factors.
After controlling for all risk factors includingspeeding, crashes on roads with speed limitsover 70 km/hour had a significantly increasedrisk of fatality compared with roads with limitsbelow 70 km/hour. Roads with speed limits of100 km/hour did not have an increased risk offatality compared with those with speed limitsbetween 70 and 90 km/hour. Moreover, analy-sis of the inter-relationship of risk factorsindicates that crashes on roads with higherspeed limits (that is > 70 km/hour) were 2.4times as likely to involve exceeding of speedlimits as those on roads with lower speed limits.
CRASH CHARACTERISTICSHead-on collisions increased the risk of fatalityby a factor of 80. Two vehicle side swipe andsingle vehicle collisions were also at higher riskof fatality compared with two vehicle rear-end
collisions (see table 2). Further examination ofthe inter-relationship of crash figuration andother risk factors indicated that head-on colli-sions were more likely to involve alcoholconsumption (6.9%), speeding (3.4%), dark-ness (31.7%), and bad weather conditions(that is fog, sleet and strong wind, 6.0%)compared with rear-end collisions (1.6%,1.4%, 14.8%, and 1.7%, respectively). Vehi-cles going straight ahead or overtaking anothervehicle were more likely to be fatal than thosewhere vehicles were slowing down. Makingturns (right; left, U) and changing lanes werenot statistically associated with increased riskof fatality.The crude OR showed that involvement of
vans or light trucks was significantly associatedwith an increased risk of fatality. However, therisk was not significant after controlling forconfounding factors in the multivariate analy-s1s.
DiscussionThis study supplements the current litera-ture -2' by quantifying the relationship be-tween driver, environment, and crash andvehicle characteristics and the severity of thecrash. Risk factors that increased or decreasedthe risk of fatal and/or major, minor injurycrashes compared with minimal injury crashesare documented in table 2.
This study uses crash data to examine therelationship between risk factors and theseverity of crashes in which an injury occurred.The unit of observation is the crash involving ayoung driver, not the young driver. The out-come of the crash is determined by the mostsevere injury sustained by any individualinvolved in the crash. Note that this studyexamines risk factors based on involvement in acrash and not responsibility for crash initiation.
DRIVER CHARACTERISTICSBoth the primary and secondary analysesindicated that fatal and major injury crashesare strongly and directly related to three riskfactors-alcohol use, speeding, and not usingseat belts.
Previous studies have shown that youngmale drivers have a higher risk of involvementin traffic crashes than young female dri-vers.7 6 27 Our results indicate, however, nodifference between young male drivers andyoung female drivers in terms of the severity ofthe crash given involvement in a crash invol-ving injury. Young male drivers are reported inmany Canadian studies to be more likely toengage in risky behaviors than young femaledrivers, and male drivers are generally morelikely to drive daily, drive after drinking, driveover the speed limit, drive through yellowlights, and change lanes more frequently thanfemale drivers.28 -30 They are also less likely touse seat belts. A recent report notes, however,that young women are driving more, areengaging in more risky behaviors, and areinvolved in an increasing proportion of crashesthan in the past.3'
186
on April 18, 2020 by guest. P
rotected by copyright.http://injuryprevention.bm
j.com/
Inj Prev: first published as 10.1136/ip.3.3.183 on 1 S
eptember 1997. D
ownloaded from
Factors affecting severity of motor vehicle traffic crashes
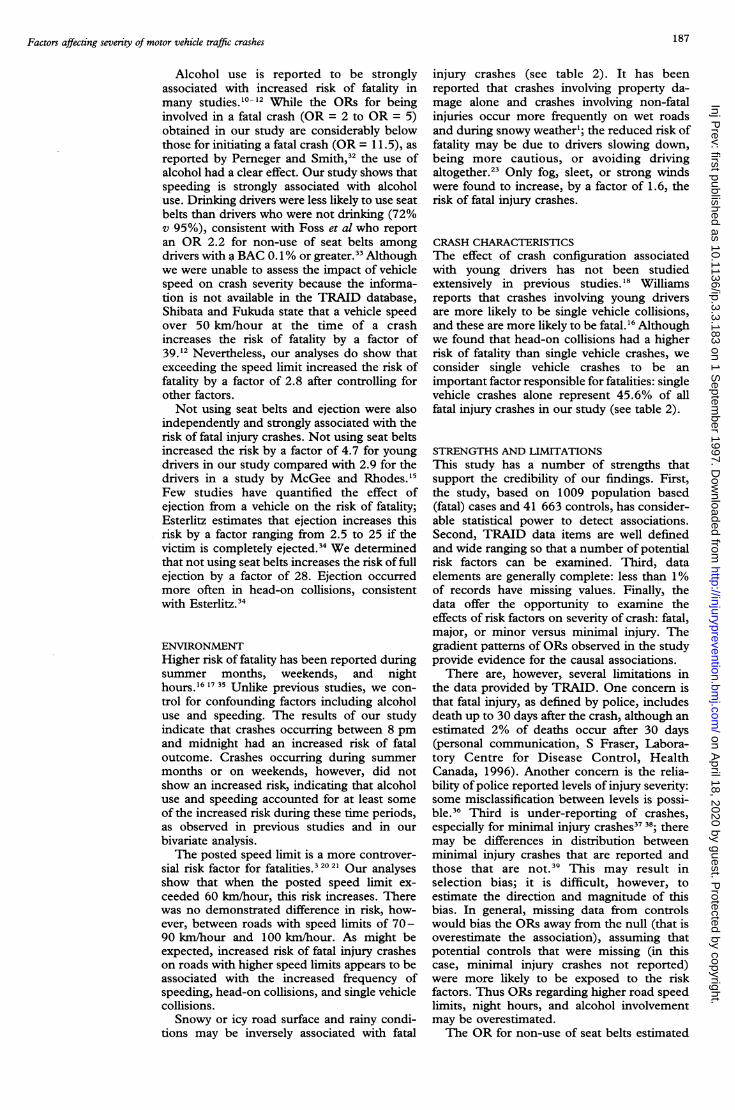
Alcohol use is reported to be stronglyassociated with increased risk of fatality inmany studies.'0-l" While the ORs for beinginvolved in a fatal crash (OR = 2 to OR = 5)obtained in our study are considerably belowthose for initiating a fatal crash (OR = 11.5), asreported by Perneger and Smith,32 the use ofalcohol had a clear effect. Our study shows thatspeeding is strongly associated with alcoholuse. Drinking drivers were less likely to use seatbelts than drivers who were not drinking (72%v 95%), consistent with Foss et al who reportan OR 2.2 for non-use of seat belts amongdrivers with a BAC 0. 1% or greater.33 Althoughwe were unable to assess the impact of vehiclespeed on crash severity because the informa-tion is not available in the TRAID database,Shibata and Fukuda state that a vehicle speedover 50 km/hour at the time of a crashincreases the risk of fatality by a factor of39.12 Nevertheless, our analyses do show thatexceeding the speed limit increased the risk offatality by a factor of 2.8 after controlling forother factors.Not using seat belts and ejection were also
independently and strongly associated with therisk of fatal injury crashes. Not using seat beltsincreased the risk by a factor of 4.7 for youngdrivers in our study compared with 2.9 for thedrivers in a study by McGee and Rhodes.'5Few studies have quantified the effect ofejection from a vehicle on the risk of fatality;Esterlitz estimates that ejection increases thisrisk by a factor ranging from 2.5 to 25 if thevictim is completely ejected.34 We determinedthat not using seat belts increases the risk of fullejection by a factor of 28. Ejection occurredmore often in head-on collisions, consistentwith Esterlitz.34
ENVIRONMENTHigher risk of fatality has been reported duringsummer months, weekends, and nighthours.'6 1735 Unlike previous studies, we con-trol for confounding factors including alcoholuse and speeding. The results of our studyindicate that crashes occurring between 8 pmand midnight had an increased risk of fataloutcome. Crashes occurring during summermonths or on weekends, however, did notshow an increased risk, indicating that alcoholuse and speeding accounted for at least someof the increased risk during these time periods,as observed in previous studies and in ourbivariate analysis.The posted speed limit is a more controver-
sial risk factor for fatalities.3 2021 Our analysesshow that when the posted speed limit ex-ceeded 60 km/hour, this risk increases. Therewas no demonstrated difference in risk, how-ever, between roads with speed limits of 70-90 km/hour and 100 km/hour. As might beexpected, increased risk of fatal injury crasheson roads with higher speed limits appears to beassociated with the increased frequency ofspeeding, head-on collisions, and single vehiclecollisions.Snowy or icy road surface and rainy condi-
tions may be inversely associated with fatal
injury crashes (see table 2). It has beenreported that crashes involving property da-mage alone and crashes involving non-fatalinjuries occur more frequently on wet roadsand during snowy weather'; the reduced risk offatality may be due to drivers slowing down,being more cautious, or avoiding drivingaltogether.'3 Only fog, sleet, or strong windswere found to increase, by a factor of 1.6, therisk of fatal injury crashes.
CRASH CHARACTERISTICSThe effect of crash configuration associatedwith young drivers has not been studiedextensively in previous studies.'8 Williamsreports that crashes involving young driversare more likely to be single vehicle collisions,and these are more likely to be fatal. 6 Althoughwe found that head-on collisions had a higherrisk of fatality than single vehicle crashes, weconsider single vehicle crashes to be animportant factor responsible for fatalities: singlevehicle crashes alone represent 45.6% of allfatal injury crashes in our study (see table 2).
STRENGTHS AND LIMITATIONSThis study has a number of strengths thatsupport the credibility of our findings. First,the study, based on 1009 population based(fatal) cases and 41 663 controls, has consider-able statistical power to detect associations.Second, TRAID data items are well definedand wide ranging so that a number of potentialrisk factors can be examined. Third, dataelements are generally complete: less than 1%of records have missing values. Finally, thedata offer the opportunity to examine theeffects of risk factors on severity of crash: fatal,major, or minor versus minimal injury. Thegradient patterns of ORs observed in the studyprovide evidence for the causal associations.
There are, however, several limitations inthe data provided by TRAID. One concern isthat fatal injury, as defined by police, includesdeath up to 30 days after the crash, although anestimated 2% of deaths occur after 30 days(personal communication, S Fraser, Labora-tory Centre for Disease Control, HealthCanada, 1996). Another concern is the relia-bility of police reported levels of injury severity:some misclassification between levels is possi-ble.36 Third is under-reporting of crashes,especially for minimal injury crashes37 38; theremay be differences in distribution betweenminimal injury crashes that are reported andthose that are not.39 This may result inselection bias; it is difficult, however, toestimate the direction and magnitude of thisbias. In general, missing data from controlswould bias the ORs away from the null (that isoverestimate the association), assuming thatpotential controls that were missing (in thiscase, minimal injury crashes not reported)were more likely to be exposed to the riskfactors. Thus ORs regarding higher road speedlimits, night hours, and alcohol involvementmay be overestimated.The OR for non-use of seat belts estimated
187
on April 18, 2020 by guest. P
rotected by copyright.http://injuryprevention.bm
j.com/
Inj Prev: first published as 10.1136/ip.3.3.183 on 1 S
eptember 1997. D
ownloaded from
Mao, Zhang, Robbins, Clarke, Lam, Pickett
in this study may be affected by the followingtwo factors. Unlike other exposures, seat beltdata were missing for 12% of cases and 8% ofcontrols. In general, missing data for caseswould bias the OR toward the null (that isunderestimate the association) if a greaterproportion of missing cases had the exposureof interest than those for which exposure datawere available. For instance, it is possible thatsome data would be missing for a person whowas killed immediately; it is also more likleythat this person would not be wearing a seatbelt. On the other hand, seat belt use is a selfreported variable, and controls, those involvedin minimal injury crashes, may over-report seatbelt use: 95% of controls reported using seatbelts compared with 85% observed in anothersurvey conducted in Ontario.40 This wouldlead to overestimation of the OR.The reliability of police reporting for alcohol
use has been documented by Kim et al.5 Theproportion ofBACs determined by blood tests,breath tests, urine tests, or by observationalone is not available. Alcohol use may beunder-reported in police reports, particularlywhere those involved were severely injured andtaken to hospital. Similarly, evidence of speed-ing is not based on instrumentation, but onobservations by police and/or statements by thedriver or witnesses.5 However, it is unlikely thatthe direction or strength of the associationswere affected substantially: measurementmethods were comparable among cases andcontrols and the pattern of ORs for alcohol useand speeding was consistent for differing levelsof severity.
This study was unable to consider otherpotential risk factors suggested in the litera-ture2 41 42 such as driver's license status, drivereducation, or emergency medical responsebecause these data were not available inTRAID. Moreover, information about druguse is incomplete.The ORs estimated in this study reflect risk
of fatality or major injury given that there is acrash and that there are injuries and do notnecessarily represent risk of fatality or majorinjury among the general population of youngdrivers in Ontario. The ORs, however, providequantitative evidence of risk factors for crashseverity and indicate directions for examiningthese factors in the general population.
Implications for preventionPrevention strategies for reducing fatalitiesfrom traffic collisions must focus on behaviorsthat place drivers in high risk circumstances.The primary targets for injury prevention arealcohol use, speeding, and seat belt use, whichare shown here to be independent risk factorsfor severe crashes. Alcohol use and speedingcontribute not only to the risk of initiating orbeing involved in crashes, as demonstrated inother studies, but also to an increased risk offatality given that a crash has occurred, asdemonstrated in this study.
In addition, the inter-relationship betweenrisk factors should be considered. Reducingalcohol use, for instance, would reduce speed-
ing and encourage seat belt use. Strategies toencourage responsible alcohol use should focuson young males and also on weekend and nighttime driving. Similarly, speeding should betargeted to reduce fatalities on roads with highspeed limits and single vehicle collisions. Theuse of seat belts, which prevents ejection fromvehicle, can substantially affect the risk of deathor major injury.Head-on collisions, most significant of all
single risk factors, are clearly an importantfocus in preventing fatalities and major injuriesin motor vehicle crashes. In addition tobehaviors such as not drinking, not speeding,and using seat belts, drivers can be taught tochose lowest risk options to minimize theseverity of a potential crash, for example,turning onto the road shoulder to avoid head-on collision.
Current prevention stratagies in the provinceof Ontario and elsewhere are targeting thesebehaviors. However, as demonstrated by Mun-ro et al,43 legislation and regulatory control maybe more effective than education alone. Onesuch legislative strategy is the graduated licen-sing system instituted in Ontario in 1994,which incorporates restrictions on new driverssuch as zero tolerance for alcohol use. Grad-uated licensing in other jurisdictions appears tohave a significant effect on reducing crashinjuries for young drivers44 45; this study pro-vides baseline data for the period precedingimplementation of such legislation.
The authors thank Dr Catherine McCourt of the Bureau ofReproductive and Child Health for financial support and usefulcomments on the manuscript. We also thank the staff of theOntario Ministry of Transportation for providing data.
1 Ontario Ministry of Transportation. Ontario road safetyannual report. Downsview, ON: Safety Research Office,Ontario Ministry of Transportation, 1990.
2 Levy DT. Youth and traffic safety: the effects of driving age,experience, and education. Accid Anal Prev 1990; 22:327-34.
3 Zlatoper TJ. Determinants of motor vehicle deaths in theUnited States: a cross-sectional analysis. Accid Anal Prev1991; 23: 431-6.
4 Chipman ML, MacGregor CG, Smiley AM, Lee-GosselinM. The role of exposure in comparisons of crash riskamong different drivers and driving environments. AccidAnal Prev 1993; 25: 207- 1 1.
5 Kim K, Nitz L, Richardson J, Li L. Personal and behavioralpredictors of automobile crash and injury severity. AccidAnal Prev 1995; 27: 469-81.
6 Millar WJ, Last JM. Motor vehicle traffic accident mortalityin Canada, 1921 - 1984. Am Jf Prev Med 1988; 4: 220-30.
7 Massie DL, Campbell KL, Williams AF. Traffic accidentinvolvement rates by driver age and gender. Accid AnalPrev 1995; 27: 73-87.
8 Robertson LS. Injury epidemiology. New York: OxfordUniversity Press, 1992.
9 Robertson LS. Patterns of teenaged driver involvement infatal motor vehicle crashes: implications for policy choice.J Health Polit Policy Law 1981; 6: 303 - 14.
10 Simpson HM, Mayhew DR, Warren RA. Epidemiology ofroad accidents involving young adults: alcohol, drugs andother factors. Drug Alcohol Depend 1982; 10: 35 - 63.
11 Mounce NH, Pendleton OJ. The relationship betweenblood alcohol concentration and crash responsibility forfatal injury drivers. Accid Anal Prev 1992; 24: 201 - 10.
12 Shibata A, Fukuda K. Risk factors of fatality in motorvehicle traffic accidents. Accid Anal Prev 1994; 26: 391 -7.
13 Moore VM, Dolinis J, Woodward AJ. Vehicle speed and riskof a severe crash. Epidemiology 1995; 6: 258-62.
14 Evans L. The effectiveness of safety belts in preventingfacilities. Accid Anal Prev 1986; 18: 229-41.
15 McGee DL, Rhodes P. Estimating trends in the effective-ness of seat belts in saving lives, 1975-1985. Stat Med1989; 8: 379-85.
16 Williams AF. Nighttime driving and fatal crash involvementof teenagers. Accid Anal Prev 1985; 17: 1 - 5.
188
on April 18, 2020 by guest. P
rotected by copyright.http://injuryprevention.bm
j.com/
Inj Prev: first published as 10.1136/ip.3.3.183 on 1 S
eptember 1997. D
ownloaded from
Factors affecting severity of motor vehicle traffic crashes
17 Kraus JF, Anderson CL, Arzemanian S, Salatka M,Hemyari P, Sun G. Epidemiologic aspects of fatal andsevere injury urban freeway crashes. AccidAnal Prev 1993;25: 229-39.
18 Karpf RS, Williams AF. Teenage drivers and motor vehicledeath. Accid Anal Prev 1983; 15: 55-63.
19 Evans L, Frick MC. Mass ratio and relative driver fatalityrisk in two-vehicle crashes. Acrid Anal Prev 1993; 25:213-24.
20 Wagenaar AC, Streff FM, Schultz RH. Effects of the 65mph speed limit on injury morbidity and mortality. AccidAnal Prev 1990; 22: 571 - 85.
21 Lave C, Elias P. Did the 65 mph speed limit save lives? AccidAnal Prev 1994; 26: 49- 62.
22 Satterthwaite SP. An assessment of seasonal and weathereffects on the frequency of road accidents in California.Accid Anal Prev 1986; 8: 87-96.
23 Brodsky H, Hakkert AS. Risk of a road accident in rainyweather. Accid Anal Prev 1988; 20: 161-76.
24 Robbins G. Traffic accident information database (TRAID)user's guide. Ottawa, ON: Road Safety, Transport Canada,1993.
25 Hosmer DW, Lemeshow S. Applied logistic regression. NewYork: John Wiley and Son, 1989.
26 SAS Institute Inc. SASISTAT software: changes and enhance-ments, release 6.10. Cary, NC: SAS Institute Inc, 1994.
27 Jonah BA. Accident risk and risk-taking behaviour amongyoung drivers. Accid Anal Prev 1986; 18: 255 - 271.
28 Ministry of National Health and Welfare. National survey ondrinking and driving 1988, overview report. Ottawa, ON:Ministry of National Health and Welfare, 1989.
29 Transport Canada. Concern for road safety: a national surveyof drivers. Ottawa, ON: Road Safety, Transport Canada;1987.
30 Ontario Ministry of Health. Ontario health survey 1990.Toronto, ON: Ontario Ministry of Health, 1993.
31 Wylie SJ. Young female drivers in New Zealand. Accid AnalPrev 1995; 27: 797-805.
32 Pemeger T, Smith GS. The driver's role in fatal two-carcrashes: a paired 'case-control' study. Am J Epidemiol
1991; 134: 1138-45.33 Foss RD, Beimess DJ, Sprattler K. Seat belt use among
drinking drivers in Minnesota. Am J Public Health 1994;84: 1732-7.
34 Esterlitz JR. Relative risk of death from ejection by crashtype and crash mode. Accid AnalPrev 1989; 21: 459-68.
35 Waters C, Gibbons L, Robert S, Semenciw R, Mao Y.Motor vehicle traffic accidents in Canada, 1978-87 bytime of occurrence. Can Jf Public Health 1993; 84: 58 - 9.
36 Austin K. The identification of mistakes in road accidentrecords: part 2 casualty variables. Accid Anal Prev 1995;27: 277-82.
37 Rosman DL, Knuiman MW. A comparison of hospital andpolice road injury data. Accid Anal Prev 1994; 26: 215-22.
38 Bull JP. Data sources for accident modelling. Accid AnalPrev 1986; 18: 79-83.
39 Hauer E, Hakkert AS. Extent and some implications ofincomplete accident reporting. Transportation ResearchRecord 1988; 1185: 1 - 10.
40 Andersen J. 1991 Ontario roadside seat belt survey results.Downsview, ON: Research and Evaluation, OntarioMinistry of Transportation, 1992.
41 Jones AP, Bentham G. Emergency medical service acces-sibility and outcome from road traffic accidents. PublicHealth 1995; 109: 169 - 77.
42 Ray WA, Fought RL, Decker MD. Psychoactive drugs andthe risk of injurious motor vehicle crashes in elderlydrivers. AmJEpidemiol 1992; 136: 873-83.
43 Munro J, Coleman P, Nicholl J, Harper R, Kent G, Wild D.Can we prevent accidental injury to adolescents? Asystematic review of the evidence. Injury Prevention1995; 1: 249-55.
44 Ferguson SA, Leaf WA, Williams AF, Preusser DF.Differences in young driver crash involvement in stateswith varying licensure practices. AccidAnal Prev 1996; 28:171-80.
45 Langley JD, Wagenaar AC, Begg DJ. An evaluation of theNew Zealand graduated driver licensing system. AccidAnal Prev 1996; 28: 139 - 46.
$35 million for ATV injuries
A jury in Alabama issued a judgment against Yamaha Motor Co for compensatory damagesof $35 million. The award is to a 20 year old who suffered severe brain damage after thefour wheel all terrain vehicle he was driving overturned on a dirt road (Baltimore Sun, 1 June1996).
Boy kills brother with revolver
A 15 year old shot and killed his 2 year old brother with a revolver; he has pleaded guilty todelinquent behaviour. The youth was smoking marijuana and drinking beer when theincident occurred (D Martelli, Boston Globe, 6 June 1996).
Another dog versus child paradox
In New Hampshire (whose motto is 'Live Free or Die') it is now illegal to transport dogs inthe back of a pickup truck unless they are safely restrained. This law does not apply tochildren!!
Helmet damages pick-up truck
An 8 year old bicyclist in Lancaster, MA, who was struck by a truck that had skidded morethan 75 feet, survived because of his helmet. 'The impact from the helmet put a hole in thegrille of the pick-up truck', police observed. The child's own comment: 'Better wear ahelmet. It hurts a lot if you don't' (A Brockelman, Fitchburg Sentinel Enterprise, 31 May1996).
189
on April 18, 2020 by guest. P
rotected by copyright.http://injuryprevention.bm
j.com/
Inj Prev: first published as 10.1136/ip.3.3.183 on 1 S
eptember 1997. D
ownloaded from