Embed Size (px)
Citation preview
N 8 4 - 2 6 0 29
NASA Technical Memorandum 83608
Factors That Affect the Fatigue Strengthof Power Transmission Shafting andTheir Impact on Design
Stuart H. LoewenthalLewis Research CenterCleveland, Ohio
Prepared for theFourth International Power Transmission and Gearing Conferencesponsored by the American Society of Mechanical EngineersCambridge, Massachusetts, October 8-12, 1984
NASA
https://ntrs.nasa.gov/search.jsp?R=19840017961 2018-02-11T12:20:45+00:00Z
FACTORS THAT AFFECT THE FATIGUE STRENGTH OF POWER TRANSMISSION SHAFTING
AND THEIR IMPACT ON DESIGN
Stuart H. LoewenthalNational Aeronautics and Space Administration
Lewis Research CenterCleveland, Ohio
ABSTRACT
A long-standing objective In the design of power transmission shafting Isto eliminate excess shaft material without compromising operational relia-bility. A shaft design method Is presented which accounts for variable ampll-tude loading histories and their Influence on limited life designs. Theeffects of combined bending and torslonal loading are considered along with anumber of application factors known to Influence the fatigue strength of shaft-Ing materials. Among the factors examined are surface condition, size, stressconcentration, residual stress and corrosion fatigue.
INTRODUCTION
The reliable design of power transmitting shafts 1s predicated on severalmajor elements. First, the fatigue (stress-life) characteristics of the givenshaft 1n Its expected service environment must be established. This can beaccomplished from full-scale component fatigue test data or approximated, usingtest specimen data. Some of the Influencing factors to be considered are thesurface condition of the shaft, the presence of residual stress or points ofstress concentration and certain environmental factors such as temperature or acorrosive atmosphere. Secondly, the expected load-time history of the shaftmust be obtained or assumed from field service data and then properly simulatedanalytically. The effects of variable amplitude loading, mean stress and loadsequence are potential Important factors to Include 1n a description of theloading history. Finally, a reliable mathematical model 1s needed which ra-tionally considers both the fatigue characteristics of the shaft and Its load-Ing history to arrive at the proper shaft diameter for the required servicelife and reliability. One last step 1s to check shaft rigidity and criticalspeed requirements, since these and other nonstrength factors can occasionallydictate an Increase 1n shaft diameter. This 1s often the case for lightweight,high speed machinery.
While the above considerations have often been addressed In fatigue anal-ysis of structural members [1 to 5], their application to the design of powerstransmission shafting has only been partially accomplished. Traditional shaftdesign methods [6 and 7] do consider the effects of combined stress loading,usually through the distortion energy theory of failure, but rarely take Intoaccount the effects of variable amplitude loading, mean stresses or limitedlife design. More recent approaches [8 and 9] adapt traditional methods tocomputer-aided design procedures but still neglect some of these other Import-ant factors.
The principal objective of this present Investigation 1s to develop a morecomplete approach to shaft design from a strength standpoint. The proposedmethod will emphasize the Influence of these aforementioned operating variables

on shaft diameter and life. Other application factors such as surface con-dition, stress concentration and size will also be addressed.
NOMENCLATURE
b slope of the S-N curve on log-log coordinates or fatigue strengthexponent (taken as positive value)
d shaft diameter m (1n.)
dp relative diameter, defined 1n Eq. (23)
FS factor of safety
K^ theoretical stress concentration factor
k-factor product of fatigue life modifying factors, defined 1n Eq. (7)
ka surface factor
kj, size factor
kc reliability factor
kg- temperature factor
ke fatigue stress concentration factor
kf press-fitted collar factor
kg residual stress factor
kn corrosion factor
k^ miscellaneous effects factor
LR relative life, defined 1n Eq. (12)
M bending moment, N-H (1n.-lb)
NL total shaft life 1n cycles
Nf number of cycles to failure at of
NI number of cycles to failure under load 1
n shaft speed, rpm
n^ number of loading cycles under load 1
q notch sensitivity
T torque, N-m (1n.-lb)
o bending stress, N/m2 (lb/1n2)
oef effective nominal stress, N/m2 (lb/1n.2)
of corrected bending fatigue limit of shaft, N/m2 (lb/1n.2)
of bending or tensile fatigue limit of polished, unnotched testspecimen without mean stress, N/m2 (lb/1n.2)
ofm bending or tensile fatigue limit of polished, unnotched testspecimen with mean stress, N/m2 (lb/1n.2)
of true cyclic fracture strength or fatigue strength coefficient,N/m2
ou ultimate tensile strength, N/m2 (lb/1n.2)
oy yield strength, N/m2 (lb/1n.2)
T shear stress, N/m2 (lb/1n.2)
TU ultimate shear strength, N/m2 (lb/1n.2)
Ty yield shear strength, N/m2 (lb/1n.2)
Subscripts:
a alternat1ng=(max-m1n)/2
m mean=(max+m1n)/2
max maximum
m1n minimum
r fully-reversing
FATIGUE FAILURE
Ductile machine elements subjected to repeated fluctuating stresses abovetheir endurance strength but below their yield strength will eventually fallfrom fatigue. The Insidious nature of fatigue Is that 1t occurs without visualwarning at bulk operating stresses below plastic deformation. Shafts sized toavoid fatigue will usually be strong enough to avoid elastic failure, unlesssevere transient or shock overloads occur.
Failure from fatigue 1s statistical 1n nature Inasmuch as the fatigue lifeof a particular specimen cannot be precisely predicted but rather the likeli-hood of failure based on a large population of specimens. For a group ofspecimens or parts made to the same specification the key fatigue variableswould be the effective operating stress, the number of stress cycles and volumeof material under stress. Since the effective stresses are usually the highestat points along the surface where discontinuities occur, such as keyways,splines, and fillets, these are the points from which fatigue cracks are most

likely to emanate. However, each volume of material under stress carries with1t a finite probability of failure. The product of these elemental probabili-ties (the "weakest link" criterion) yields the likelihood of failure for theentire part for a given number of loading cycles.
At present there 1s no unified, statistical failure theory to predictshafting fatigue. However, reasonable accurate life estimates can be derivedfrom general design equations coupled with bench-type fatigue data and materialstatic properties. Fatigue test data are often obtained on either a rotatlng-beam tester under the conditions of reversed bending or on an axial fatiguetester. The data generated from these machines are usually plotted 1n the formof stress-life (S-N) diagrams. On these diagrams the bending stress at whichthe specimens did not fall after some high number of stress cycles, usually106 to 107 cycles for steel, 1s commonly referred to as the fatigue limit,of. For mild steels 1t 1s the stress at which the S-N curve becomes nearlyhorizontal. This seems to Imply that operating stresses below the fatiguelimit will lead to "Infinite" service life. However, this Is misleading sinceno part can have a 100 percent probability of survival. In fact, fatigue limitvalues determined from S-N diagrams normally represent the mean value of thefailure distribution due to test data scatter. Statistical corrections must beapplied for designs requiring high reliabilities as will be discussed.Furthermore, many high strength steels, nonferrous materials and even mildsteel 1n a corrosive environment do not exhibit a distinct fatigue limit [1].In view of this, 1t 1s best to consider that the fatigue limit represents apoint of very long life (>10& cycles).
APPROACH
Traditional shaft analysis generally considers that the nominal loads act-Ing on the shaft are essentially of constant amplitude and that the shaft life1s to exceed 10& or 10? cycles [6]. Sometimes shock or overload factorsare applied. However, most shafts 1n service are generally exposed to a spec-trum of service loads. Occasionally, shafts are designed for lives that areless than 106 cycles for purposes of economy. Both of these requirementscomplicate the method of analysis and Increase the uncertainty of the predic-tion. Under these conditions, prototype component fatigue testing under sim-ulated loading becomes even more Important.
Short life design. - Local yielding of notches, fillets, and other pointsof stress concentration are to be expected for shafts designed for shortservice lives, less than about 1000 cycles. Since fatigue cracks Inevitablyoriginate at these discontinuities, the plastic fatigue behavior of the mate-rial dictates Us service life. Most materials have been observed to eithercycllcly harden or soften, depending upon Its Initial state, when subjected tocyclic plastic strain. Therefore, the cyclic fatigue properties of the mate-rial, which can be significantly different than Its static or monotonlcstrength properties, need to be considered 1n the analysis. For short, lowcycle life designs, the plastic notch strain analysis, discussed 1n detail 1n[3, 5, and 10] 1s considered to be the most accurate design approach. Thismethod, used widely 1n the automotive Industry, predicts the time to crackformation based on an experimentally determined relationship between localplastic and elastic strain and the number of reversals to failure.
Intermediate and long life designs. - For Intermediate and long lifedesigns both total strain-life and nominal stress-life (S-N curve) methodshave been successfully applied [3 and 10]. Although both methods provide

reasonable fatigue life predictions, only the nominal stress-life method willbe outlined here.
Obviously, the key to accurate fatigue life prediction 1s obtaining a gooddefinition of stress-life, S-N, characteristics of the shaft material. Meanbending and/or torslonal stress effects should be taken Into account 1f pre-sent. Furthermore, a good definition of the loading history Is also required.Even when these requirements are met, the accuracy of the prediction 1s approx-imate with today's state-of-knowledge. As an example, an extensive cumulativefatigue damage test program was conducted by the SAE to assess the validity ofvarious fatigue life prediction methods [10]. Numerous simple geometry,notched steel plate specimens were fatigue tested 1n unaxlal tension. Testswere conducted under constant amplitude loading and also under a variableamplitude loading that closely simulated the service loading history. The testspecimens' material fatigue properties and the actual force-time history werevery well defined. Under these well controlled conditions, predicted mean lifefrom the best available method was within a factor of 3 (1/3 to 3 times) of thetrue experimental value for about 80 percent of the test specimens while someof the other methods were considerably less accurate [10]. Under less Idealconditions, such as when the loading history and material properties are not aswell known or when a multlaxlal stress state 1s Imposed, a predictive accuracywithin a factor of 10 of the true fatigue life would not be unacceptable withtoday's state-of-knowledge.
S-N CURVE
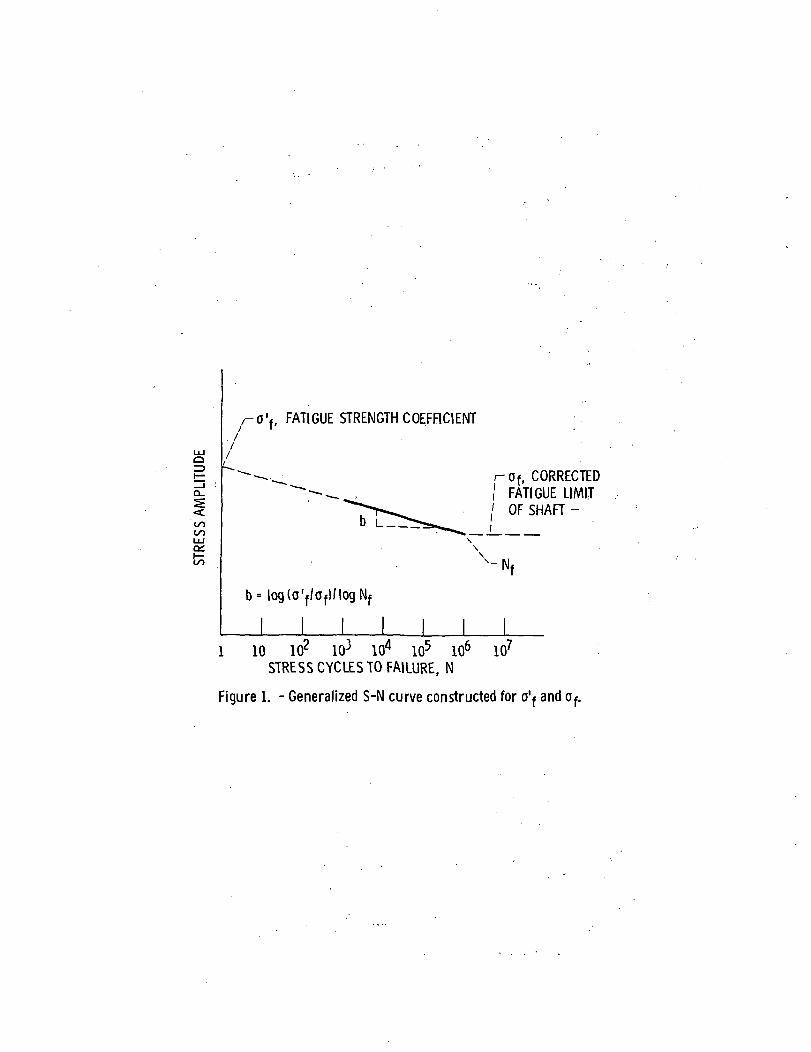
In order to determine the proper shaft size for a given number of stresscycles under a variable amplitude loading situation It 1s necessary to con-struct an S-N curve for the shaft under the proper mean loading condition. Ifan experimentally determined S-N curve for the shaft 1s available then, ofcourse. It Is to be used. However, 1f actual test data Is not available, 1t Isstill possible to generate a reasonable estimate of the S-N characteristics ofthe shaft as shown In Fig. 1. In F1g. 1, a straight line connects the fatiguestrength coefficient of at 1 cycle with the shaft's corrected fatigue limitof at 106 stress cycles((or 107 cycles If applicable) on log-log coordinates[3]. The coefficient of 1s the true stress (considering necking) requiredto cause fracture on the first applied bending stress reversal. It Is normallygreater than the nominal tensile strength of the material ou.
This method assumes that the fracture strength of the shaft 1s not appre-ciably affected by the presence of any mean bending or torslonal stresses orthe presence of a notch. The reason for this 1s that 1n a bending or torslonalstrength test, the outer fibers fracture first. Any Initial mean or residualstress or notch effect will be lost to local yielding as the load 1s applied.This Is not the case for an axial strength test, since the whole cross sectionof the specimen rather than the outer fibers must carry the mean load [3].
Values for of are not commonly available 1n the open literature.Table 1 [11 and 12] lists representative values of of and of along withother strength properties for several steel compositions. For steels notlisted 1n Table 1 with hardnesses less than approximately 500 BHN, reference(5) recommends the following rough approximation:
o « o + 345 HPa (1)

or
of * o * 50 000 ps1
where ou = ultimate tensile strength.The parameter b appearing 1n Table 1 1s commonly referred to as the
fatigue strength exponent [11]. It 1s the slope of the S-N line .on log-logcoordinates, taken as a positive value here, where b = log (of/of)/6 for afatigue limit based on Nf = 106 cycles or
b = log (<̂ /of)/7 for Nf = 107 cycles (2)
Thus, 1f of and of are known or approximated, slope b can be foundand an S-N curve can be constructed from the relation:
of (3)"1 \"1/ f
3where 10 < N. < Nf and where o, 1s the alternating failure stress corre-1 f a1spending to N^ cycles to failure and of 1s the fatigue limit strengthcorresponding to Nf cycles to failure.
As shown 1n F1g. 2, Eq. (3) together with the simple approximation forof given 1n Eq. (1) provides a reasonably good correlation with reversedbending fatigue data of different strength steels appearing 1n [13]. The wellknown approximation that the fatigue limit of 1s about half of the tensilestrength ou seems to hold reasonably well for all the steel test dataappearing 1n F1g. 2, except for that 1n the 0 to 483 HPa tensile strengthrange. The reason for this descrepancy 1s not clear. It does, however Illus-trate the Importance of obtaining actual fatigue life properties rather thanrelying on simple approximations. Furthermore the high degree of scatter ofthe test data 1n F1g. 2 1s not uncommon 1n fatigue testing. The S-N curverepresents the mean or average strength characteristics of a population ofcomponents. Working stress levels must be reduced to assure higher reliabili-ties than this 50 percent survival rate as will be discussed next.
FATIGUE LIFE MODIFYING FACTORS
It should be stressed that the fatigue limit of value to be used 1nconstructing the S-N curve 1n F1g. 1 1s that for the shaft to be designed andnot that of the test specimen material. The fatigue of the shaft 1s almostalways different from fatigue limit of the highly polished, notch-free fatiguetest specimen, listed 1n material property tables such as 1n Table 1. A numberof service factors that are known to affect fatigue strength have been Identi-fied. These factors can be used to modify the uncorrected fatigue limit of thetest specimen, of*, as follows:
°f ' kakbkckdkekfkgkhk1°f

where
af corrected bending fatigue limit of shaft
of bending or tensile fatigue limit of polished, unnotched test specimenwithout mean stress
ka surface factor
((5 size factor
kc reliability factor
k<j temperature factor
ke fatigue stress concentration factor
kf press-fitted collar factor
kg residual stress factor
kn corrosion factor
kj miscellaneous effects factor
Design data for factors ka through ke are relatively available 1nthe open literature [1, 2, and 6] and thus they will be only briefly discussedhere. However, factors kf through k^, although lesser known and docu-mented, are often quite Important to shafting fatigue and therefore willreceive greater attention. A more thorough examination of all these factorscan be found 1n [14 and 15].
Surface factor. ka. - Since the surface of the shaft 1s the most likelyplace for fatigue cracks to start. Its surface finish and any Irregularitiessuch as oxide and scale defects or surface decarburlzatlons can have a majorImpact on fatigue life. Typical values of ka range from about 0.9 forturned, ground and polished shafts of low tensile strength (400 HPa) to as lowas 0.1 for high strength, forged shafts with significant surface defects [2 and14].
Size factor, kjj. - Large shafts tend to have lower fatigue strength thensmall shafts. This 1s primarily due to the great volume of material understress and the attendant greater Hkelyhood of encountering a potential fatigueInitiating defect 1n the material's mlcrostructure. Also the metallurgicalstructure of large parts tends to be coarser and less uniform than small parts.Since the diameter of fatigue specimens tend to be small, typically 8 mm 1ndiameter, a strength reduction factor should be applied for larger shafts.Values of k^ typical range from about 0.9 for 500 mm diameter shafts toapproximately 0.65 for shafts 250 mm 1n diameter [14 and 15].
Reliability factor. kc. - As previously discussed, published fatiguelimit data usually represent an average value of the endurance strength of thesample of test specimens. In the absence of specific test data, the failuredistribution of steel specimens 1s often assumed to follow a Normal or Gaussiandistribution with a standard deviation of about 8 percent of the mean. Thusfor a 90 percent nominal reliability, kc 1s approximately 0.9 and for a 99percent reliability kc Is approximately 0.8 [14 and 15],

Temperature factor, kj. - The fatigue limit of carbon and alloy steel1s relatively unaffected by operating temperatures between approximately -70°to 300° C. At lower temperatures the bending fatigue strength of steelIncreases while at temperatures above about 400° C, some steels begin to loosestrength [14 and 15].
Fatigue stress concentration factor, ke. - Experience has shown thatshafts almost always fall at a notch, hole, keyway, shoulder or other dis-continuity where the effective stresses have been amplified. Fatigue dataIndicate that low strength steels, due to their ductility, are far less sen-sitive to the effects of a stress raiser than high strength steels. This 1sreflected by the notch sensitivity parameter q which 1s used to modify thetheoretical (static) stress concentration factor K^ as follows:
e Uq(Kt - 1)
Reference [16] 1s an excellent source of design values for both K^.and q.
Press-fitted collar factor, kf. - A common method of attaching gears,bearings, couplings, pulleys, and wheels to shafts and axles 1s through the useof an Interference fit. The change 1n section creates a point of stress con-centration at the face of the collar. This stress concentration coupled withthe fretting action of the collar as the shaft flexes 1s responsible for manyshaft failures 1n service. A limited amount of fatigue test data have beengenerated for steel shafts having press-fitted, plain (without grooves ortapers) collars 1n pure bending. Based on this data from several sources,typical fatigue life reductions range from about 50 to 70 percent [16 and 17].Therefore, approximate range of press-fitted collar factors:
kf * 0.3 to 0.5Larger shafts having diameters greater than about 75 mm (3 1n.) tend to
have kf values less than 0.4 when the collars are loaded. Smaller shaftswith unloaded collars tend to have kf values greater than 0.4. The effectof Interference pressure over a wide range between collar and shaft has beenfound to be small, except for very light fits (less than about 28 MPa or 4000ps1) which reduces the penalty to fatigue strength [16]. Surface treatmentsproducing favorable compresslve residual stresses and hardening processes suchas cold rolling, peenlng, Induction or flame hardening can often fully restorefatigue strength (kf = 1) [1]. Stepping the shaft seat with a generaousshoulder fillet radius or providing stress relieving grooves on the bore ofthe collar can also provide substantial strength Improvements.
Residual stress factor. kg. - The Introduction of residual stressthrough various mechanical or thermal processes can have significant harmfulor beneficial effects on fatigue strength. Residual stresses have the sameeffect on fatigue strength as mean stresses of the same kind and magnitude.Thus residual tensile stresses behave as static tensile loads that reducestrength while residual compresslve stresses behave as static compresslvestresses which are beneficial to fatigue strength. Table 2 lists many of themost common manufacturing processes and the type of residual stress they arelikely to produce. The extent that the residual tensile stresses from theseprocesses reduce or benefit fatigue strength 1s dependent on several factorsIncluding the severity of the loading cycle and the yield strength of thematerial 1n question. Since the maximum residual stress (either compresslveor tensile) that can be produced 1n a part can be no greater than the yieldstrength of the material minus the applied stress, harder, higher strength
8
materials can benefit more or be harmed more by residual stresses [3 and 18].This coupled with an Increase 1n notch sensitivity makes 1t Important to stressrelieve welded parts made from stronger steels and Increases the need to coldwork critical areas. For low cycle fatigue applications 1t usually does notpay to shot peen or cold roll mild steel parts with relatively low yieldstrengths since much of the beneficial residual compresslve stress can be"washed-out" with the first applications of a large stress.
Cold working of parts or the other means listed 1n Table 2 to Instillresidual compresslve stress 1s most often applied to minimize or eliminate thedamaging effect of a notch, fillet, or other defect producing high stressconcentration or residual tensile stresses. This Is clearly Illustrated 1nF1g. 3 where shot peenlng the notched region of the test specimen has almostentirely eliminated the notch effect. Cold working processes not only generatefavorable compresslve stresses but also work harden the surface of the partleading to Increased fatigue strength. Typical design Information and data onthe effects of cold working and many of the other residual stress can be found1n [1, 3, and 18].
Corrosion fatigue factor. kn. The formation of pits and crevices onthe surface of shafts due to corrosion, particularly under stress, can cause amajor loss 1n fatigue strength. Exposed shafts on outdoor and marine equip-ment as well as those 1n contact with corrosive chemicals are particularlyvulnerable. Corrosion fatigue cracks can even be generated 1n stainless steelparts where there may be no visible signs of rusting [1]. Furthermore, designsstrictly based on the fatigue limit may be Inadequate for lives much beyond10^ or 107 cycles 1n a corrosive environment. Metals fatigue tested even1n a mildly corrosive liquid like fresh water rarely show a distinct fatiguelimit [1]. For example, the S-N curve for mild carbon steel tested 1n a saltwater spray shows a very steep downward slope, even beyond TO8 cycles.Corrosion fatigue strength has also been found to decrease with an Increase 1nthe rate of cycling so both the cycling rate and number of stress cycles shouldbe specified when quoting fatigue strengths of metals 1n a corrosive environ-ment. Reference [1] contains a wealth of Information on the corrosive fatiguestrength of metals. Typically, the bending fatigue strength of chromium steelsat 10' cycles range from about 60 to 80 percent of the air tested fatiguelimit when tested 1n a salt water spray [1]. Surface treatments such a galvan-izing, sherardlzlng, zinc or cadmium plating, surface rolling or n1tr1d1ng cannormally restore the fatigue strength of carbon steels tested 1n fresh water orsalt spray to approximately 60 to 90 percent of the normal fatigue limit 1nair [1].
Miscellaneous effects factor, k^. - Since fatigue failures nearlyalways occur at or near the surface of the shaft, where the stresses are thegreatest, surface condition strongly Influences fatigue life. A number offactors that are often overlooked but are known to affect the fatigue strengthof a part are listed below:
(1) fretting corrosion(2) thermal cycle fatigue(3) electro-chemical environment(4) radiation(5) shock or vibration loading(6) ultra-high speed cycling(7) welding(8) surface decarburlzatlon

Although only limited quantitative data has been published for thesefactors [1 and 2], they should, nonetheless, be considered and accounted for 1fapplicable.
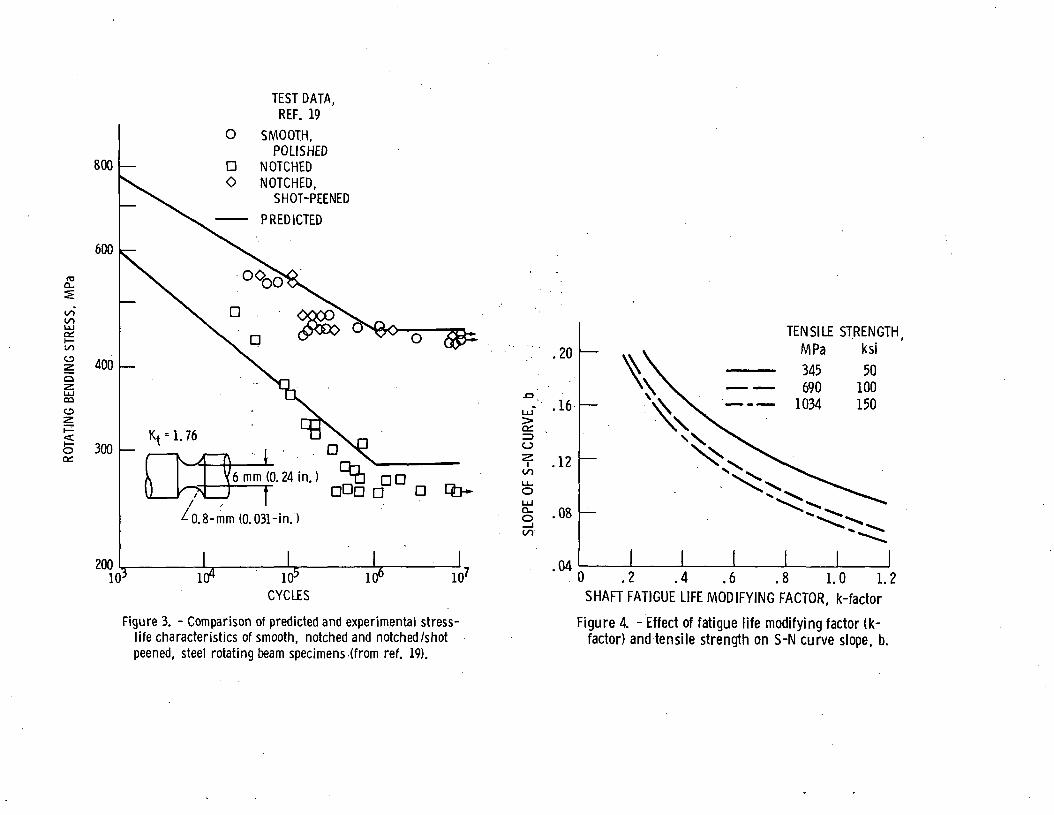
S-N prediction. - Figure 3 Illustrates the effects that the above fatiguelife modifying factors (k-factor) have on the stress-life relation of Eq. (4).A comparison was made with rotating beam fatigue data generated 1n [19] forsmooth, notched, and notched, shot-peened steel specimens having a tensilestrength ou of 897 MPa.
From the approximation given 1n Eq. (1), of at 1 cycle was estimatedto be 1241 MPa. The fatigue limit of the test specimens of at 106 cycleswas estimated to be 0.5 ou or 449 MPa. In the case of the smooth, polishedtest specimen all of the k-factor = 1 , so the upper line appearing 1n F1g. 3can be drawn.
In the case of the notched specimen having the geometry shown 1n F1g. 3,Kt = 1.76 and q = 0.79 according to (16). From Eq. (5), the fatiguestress concentration factor, ke = 0.63 and the fatigue limit of the notchedspecimen = 0.63 (449) or 283 MPa as shown In F1g. 3.
It 1s Instructive to note from F1g. 3, that the compresslve residualstress and work hardening provided by shot peenlng virtually eliminated thedetrimental notch effect almost entirely. Secondly, the slope of the S-N curve1s steeper, that 1s b 1s larger, for the notched shaft. Since shaft life 1sInversely proportional to stress raised to the 1/b power, where 1/b »13.6 forthe smooth shaft versus 1/bw 9.3 for the notch shaft, the notched shaft'slife, although lower, 1s less sensitive to stress amplitude changes than thatof the smooth shaft. In fact, slope b Increases with a decrease 1n k-factoror a decrease 1n tensile strength. This 1s shown In F1g. 4 where b Is plot-ted from the following approximation derived from Eqs. (1), (2), and (4):
l / % * 345
b 6 - 1 o 9 o . 5 o \ k - f a c t o r f o r * 1n HPa
where
k-factor = k k.k k.k k,k k .k. (7)a b c d e f g h l
It should be pointed out that the presence of a mean stress, eitherapplied or residual, will cause a change 1n endurance strength and thereforeaffect slope b. Mean torlsonal, bending or tensile stresses will decreaseOf and thus Increase b while compresslve stresses will have the oppositeeffect. The effect of mean stresses will be discussed later.
VARIABLE AMPLITUDE LOADING
The following 1s a greatly simplified approach to estimate the requiredshaft diameter for either a limited or unlimited number of stress cycles undera variable amplitude loading history. It assumes that the loading history canbe broken Into blocks of constant amplitude loading and that the sum of theresulting fatigue damage at each block loading equals one at the time of fail-ure 1n accordance with Palmgren-M1ner linear damage rule. Great care must beexercised 1n reducing a complex, Irregular loading history Into a series ofconstant amplitude events 1n order to preserve the fidelity of the prediction.Reference [4] discusses the merits of several cycle counting schemes that arecommonly used 1n practice for prediction purposes.
10

A shortcoming of Miner's rule 1s that It assumes that damage occurs at alinear rate without regard to the sequence of loading. There 1s ample experi-mental evidence that a virgin material will have shorter fatigue life, that 1sMiner's sums less than one, when first exposed to high cyclic stress before lowcyclic stress [1 and 4]. This "overstresslng" 1s thought to create submicro-scoplc cracks In the material structure that can accelerate the damage rate.On the other hand, test specimens exposed first to stresses just below thefatigue limit are often stronger 1n fatigue than when new. This "coaxing" or"understralnlng" effect which can produce Miner's sums much larger than one 1sbelieved due to a beneficial strain aging phenomena. While Miner's sums atthe time failure can range from 0.25 to 4 depending on loading sequence andmagnitude, the experimental range shrinks to approximately 0.6 to 1.6 when theloading 1s 1n a more random manner [19]. This 1s often acceptable for failureestimates. More complicated cumulative damage theories have been devised toaccount for "sequencing" effects. In fact reference [19] discusses sevendifferent ones, but none of them have been shown to be completely reliable forall practical shaft loading histories. In most cases, Miner's rule servesalmost as well and because of Its simplicity 1t 1s still preferred by many.
Assuming that the shaft 1s exposed to a series of 3, 1n this case,alternating bending moments of constant amplitude M acting for n,, loading
1 '1
cycles, M. for n_ cycles, and M for n_ cycles, then according to
Miner's rule:
N N(8)
l 2 3where N, 1s the number of cycles to failure at bending moment M , N Is
lthe cycles to failure at M , etc.
From the straight line on the log-log S-N plot of F1g. 1, 1t 1s clear that
^ M'f = \N3/
(9)
where a 1s the alternating bending stress at bending moment M , N. 1sa1 ai f
the number of stress cycles corresponding to the fatigue limit of of theshaft (usually 10&+10? cycles) and b is the slope of the S-N curvetaken as a positive quantity.
Substituting Eq. (9) back Into Eq. (8), noting a = 32 M Ard3 (solida1 a1
circular shaft) and simplifying yields, the following expression forcalculating shaft diameter, d:
d3 _ 32 (FS)iro.
1/b • ? (%) 1/b * 5? 1/b (10)
where the factor of safety term (FS) has been Introduced.
11

Equation (10) can also be rearranged to find the life ML of a shaft ofgiven diameter for a prescribed operating duty cycle. Multiplying both sides
bn~of Eq. (10) by i
and solving for
I \
^ \where
gives:
N. = total shaft life 1n cycles =
NL =
/bird
i32(FS)n 1/b
n3, etc.
(11)
nwhere the terms rr-
n2 n3rp- , and rp are the fraction of time spent at eachNL NL
bending load M , M , and M , respectively.al a2 a3
Effect of duty cycle. - Equation (11) can be used to Illustrate the largedetrimental effects that high loads have on shaft life. Consider the casewhere a shaft 1s exposed to two blocks of alternating bending moments, where abending moment of amplitude M acts for n /N fraction of the time and Ma, I L a«acts for the remainder according to the schematic appearing 1n F1g. 5.Defining relative life L_, to be shaft life when M * M divided by shaft
life when M M
L , to be shaft life whenR a_ a,then from Eq. (11) L 1s found to be:
K
=M
1 -
(12)
N
Plotting Eq. (12) in F1g. 5 1t is clear that even a 20 percent overload/M = 1.2\ acting only 20 percent of the time (n /N = 0.8) will cause ai«j d -i i i L
30 percent life reduction for b = 0.16 or a 64 percent life reduction forb = 0.08 relative to a shaft with only constant amplitude loading. In prac-tice, the life reduction would be closer to 30 rather than 64 percent since ab - value of 0.16 1s more representative of a machined, mild steel shaft withstress concentration while b = 0.08 would be representative of a smooth, notchfree (k-factorw 1), high strength shaft, (see F1g. 4). However, 1n any case,this example points out that the high fluctuating loads acting on a structuralelement, such as a shaft, tend to dictate its service life.
EFFECT OF MEAN STRESSES
The analysis presented 1s predicated on the knowledge of the S-N charac-teristics of the shaft under the anticipated loading conditions. Modifyingfactors have been Identified 1n Eq. (4) to correct specimen fatigue data for
12

certain geometric and envlromental factors that can affect fatigue strength.The effects of mean stresses will be addressed next.
Since most shafts transmit power and rotate with gear, sprocket or pulleyloads, mean torslonal stresses are Invariably present. Also mean bendingstresses can be developed such as those due to rotating unbalance forces.These mean stresses cause a reduction In fatigue strength. Residual stresses,Induced deliberately or unattentlonally (see Table 2) behave like mean stressesand can either benefit or reduce strength depending on whether they are com-presslve or tensile [3 and 18].
The effects of mean stresses on long term fatigue strength are sometimesavailable 1n the form of experimentally determined constant life diagrams [20].In these diagrams the amplitude of the fluctuating stress 1s plotted versusthe magnitude of the mean stress at 104, 10$, etc. cycles to failure. Some-times notched specimen data 1s Included. When specific data 1s unavailable,mean stress effects are often approximated by certain mathematical failurerelations, such as Soderberg, Gerber and Modified Goodman failure lines [2, 3,and 6]. When specific test data 1s available then, obviously, this 1s prefer-red. However, the following discussion outlines how mean stresses can bereasonably accounted for by knowing only the fatigue limit, yield and ultimatestrengths of the material.
Mean bending stress. - For the case when only bending loads are acting onthe shaft, that 1s zero torque, the loading 1s considered to be "simple" sinceonly one kind of stress 1s present. For simple loading several failurerelations have been proposed, but the modified Goodman line 1s, perhaps, themost widely used. It 1s given by:
a o-J «-*=,! (13)
°f °u
where oa and om are, respectively, the alternating and mean components ofthe simple bending stress, ou 1s the ultimate tensile strength and of 1sthe fatigue limit of the shaft material as determined from specimen fatiguetests with no mean stress present.
Since oa = of when om = 0 according to Eq. (13), oa can beInterpretted to be the bending fatigue limit strength 1n the presence of a meanbending stress, say ofm. The asterUk 1s used to denote test specimenrather than shaft fatigue properties. Thus the reduction of fatigue strengthwith mean strength takes the form:
(14)
°f °u
In other words, the bending fatigue strength of the material decreaseslinearly with mean bending stress, becoming zero when the ultimate strength 1sreached (Immediate fracture failure).
Combined stress. - Host power transmitting shafts are not simply loaded,but are subjected to combined stresses. The most common situation 1s a com-bination of reversed bending stress (a rotating shaft with constant momentloading) and steady or nearly steady torslonal stress. Although a large bodyof test data has been generated for the simple stress condition, such as puretensile, flexural or torslonal stress, little Information has been publishedfor the combined bending and torslonal stress condition. However, some cyclicbending and steady torslonal fatigue test data for alloy steel analyzed 1n [21]
13

shows a reduction 1n reversed bending fatigue strength with mean torslonalstress according to the elliptical relation:
(15)
where or 1s the reversed bending stress, that 1s, the alternating bendingstress component with no mean bending stress present, and where Tm and TVare, respectively, the applied mean shear stress and yield shear strength ofthe test specimen. Since or = of at tm = 0, Eq. (15) represents thereduction of reversed bending fatigue strength with mean torslonal stress or,1n other words.
(16)
where ofm has been Introduced, as before, to represent the fatigue limit 1nthe presence of a mean stress.
Superimposing the effects of both mean bending and torslonal stresses onfatigue strength, that 1s combining Eqs. (14 and 16), results 1n
°fm = °f (17)
In the case of solid, circular shafts, the mean stress levels are
32 Mm 16 Tand
irdvTm =
m
trdv
and since, for steels.
(18)
(19)
then substituting Eqs. (18 and 19) back Into (17) yields:
°fm = °f V1 - 77.8 - 10.2
(20)
Thus, 1f a mean bending moment Mm and/or mean torslonal load Tm arepresent, the fatigue limit of the specimen ofm can be found from Eq. (20)and the fatigue limit of the shaft of 1s then:
"f = kakbkckdkekfkgkhk1°fm (21)
The above value of of can then be substituted back Into Eqs. (10 and 11) to;f1nd shaft diameter and/or life.
14

The Appendix contains an example to Illustrate how the proposed method Isto be applied. As a precautionary note, 1t Is good practice to check 1f theshaft diameter calculated from Eq. (10) 1s sufficiently large to withstandstatic failure considering the combination of peak bending moment, Ma + Mm,and mean transmitted torque Tm. Standard, static strength equations found1n [2, 6, 14, and 15] and elsewhere can be used.
Unlimited life design. - For the special case of an unlimited life designof a shaft having a constant amplitude bending moment Ma with both meanbending and torslonal stresses present, the required shaft diameter d can befound by substituting Eq. (20) back Into Eq. (10) and setting n-j = Nf and
a1 =M . This gives:
32(FS)
Eq. (22) with Mm = 0 1s the basicthe soon-to-be-issued ASHE Standard 8106.[21].
(22)
shaft design equation proposed for1 M, Design of Transmission Shafting
DISCUSSION OF RESULTS
As previously discussed, F1g. 5 shows the effects of a duty cycle consist-Ing of two blocks of cyclic bending moments on relative shaft life. In asimilar manner, Eq. (11) can be used to study the Influence of duty cycle onrelative shaft diameter. This 1s Illustrated 1n F1g. 6. A representativeslope, b, value of 0.13 was selected which approximately corresponds to asteel shaft of about 690 MPa (100 000 psl) tensile strength with k-factor =0.5 according to F1g. 4. It 1s clear from F1g. 6 that a relatively smallIncrease 1n shaft diameter 1s needed to accommodate a modest overload withoutsacrificing shaft life. Furthermore, the relative constancy of this Increase1n diameter, particularly at the higher overload values. Indicates that shaftsize 1s basically dictated by the highest bending load, even 1f 1t 1s onlypresent for a relatively small percentage of the duty cycle.
The effect of a mean torslonal load Tm and cycles to failure onrelative shaft diameter Is Illustrated 1n F1g. 7. To normalized this data,relative shaft diameter has been arbitrarily set equal to 1.0 at 10& cyclesto failure and Tm = 0. These predicted curves were derived by substitutingEq. (20) back Into Eq. (10) and considering that only a single cyclic bendingmoment load of amplitude Ma 1s present. When this 1s done, the followingexpression for relative shaft diameter dp results:
2b
+ 7 k-factor4
1/6
(23)
For purposes of Illustration, a representative case was selected whereou = 690 MPa (100 000 ps1), k-factor = 0.5, b * 0.13, of * 0.5 (ou)and 0.85
15
Several general observation can be made about the trends appearing 1nF1g. 7. First, the savings 1n shaft diameter for a limited life design at10^ cycles to failure versus that for an unlimited life (fatigue limit)design at 10& cycles becomes smaller as the transmitted or mean torque 1sIncreased. For example, a 26 percent smaller shaft can be used at Tm = 0while a diameter reduction of just 12 percent 1s possible at Tm = 3 Ma.Secondly, the required Increase 1n shaft diameter to accommodate an Increase1n transmitted torque at constant shaft life Is relatively modest for highcycle fatigue life designs. For example, an Increase shaft diameter of only 8percent 1s needed to accommodate a transmitted torque that 1s 3 times the bend-Ing moment amplitude (Tm = 3 Ma) at 10& cycles. However, at lowercycles to failure, this Increase 1n diameter with transmitted torque becomesgreater, being about 28 percent at 103 cycles for Tm = 3 Ma.
Finally, the sensitivity of shaft diameter to changes In the requiredcycles-to-fa1lure, Nf, although not shown 1n F1g. 7, 1s greater for highervalues of slope b according to Eq. (23). Thus the diameter of highly notched(low k-factor), low strength steel shafts (see F1g. 4) will exhibit a greaterreduction with a decrease 1n design life than will those of smooth, highstrength shafts. Also, highly notched, high strength shafts (low k-factor,high ay) will exhibited a smaller Increase 1n diameter with an Increase Intransmitted torque than will smooth, low strength shafts according to Eq. (23).
SUMMARY AND CONCLUSIONS
A shaft design method 1s presented which can be used to estimate thediameter required to survive a specified number of stress cycles under a vari-able amplitude loading history. The analysis 1s based on a nominal stress-lifemethod In which a straight line connects the true fracture strength at 1 cycleto the fatigue limit of the shaft at 106 or 10? cycles-to-fa1lure on log-log coordinates. A number of fatigue life modifying factors have been Identi-fied to correct test specimen fatigue strength data for geometric and envlro-mental conditions which the actual shaft will likely encounter 1n service.Among such factors are surface condition, size, reliability, temperature,stress concentration, press-fitted collars, residual stress and corrosionfatigue. The effects of varU^le amplitude loading were Incorporated Into theanalysis using a Palmgren-M1ner linear damage approach. Mean bending stresseswere accounted for using a Modified Goodman failure relationship. The In-fluence of a steady transmitted torque was considered through a ellipticalreduction 1n reversed bending fatigue strength with mean torslonal stressexhibited by previously published fatigue test data.
The method presented was used to determine the effects of certain keymaterial and operating variables on shaft diameter and fatigue life. Thefollowing results were obtained:
(1) The amplitude of the peak cyclic bending moment from a variableamplitude loading history, even briefly applied, has a large Influence onshaft diameter and/or fatigue life.
(2) The sensitivity of shaft fatigue life to bending stress 1s primarilya function of tensile strength and the value of the fatigue life modifyingfactor. For example, life typically varies with stress to about the -14 powerfor small, smooth, high strength shafts and to the -5 power for large, rough,heavily notched, low strength shafts.
/ (3) The sensitivity of shaft diameter to the presence of a mean or steadytransmitted torque 1s relatively small for high cycle fatigue life designs butsteadily Increases as the desired cycle life 1s reduced.
16
(4) The savings In shaft diameter from a reduction 1n the required numberof cycles to failure Is greater at lower transmitted torque levels. Thissavings becomes relatively small for shafts that carry a relatively highamount of torque.
17

APPENDIX - APPLICATION EXAMPLE
To Illustrate application of the proposed method consider that a shaft 1sto be designed with safty factor of 2 from SAE 1045 steel, quenched and tem-pered Q&T (225 BHN, ou = 724 MPa and ay =
634 Mpa from Table ]) for 10°000 cycles under a steady torque of 3000 N-M and the following variable bend-Ing moment schedule:
Ma •a1N-M
200015001000
Percenttime
153550100
Number of cycles,n1
15 00035 00050 000100 000
Fraction of Nf
VNf0.015.035.050
The fatigue limit of a smooth 1045 steel specimen without mean stressof 1s listed as 323 MPa at Nf = 106 cycles 1n Table 1. (Note this1s somewhat smaller than the approximation 0.5 <*u or 362 MPa.)
Start with an Initial shaft diameter guess of d = 0.055 m (a good start-Ing point 1s to calculate d from Eq. (10) assuming that no mean load Ispresent). The effect of the mean torque of 3000 N-M on of can be foundfrom Eq. (20) as follows:
a*m = 323xl06^/ 1 - 77.8 3000
,0.0553 634xl06
= 313x1O6 N/m2
Let's assume that 1n this example that the product of all the k-factorsdescribed by Eq. (4) 1s equal to 0.4, so the shaft's corrected bending fatiguelimit according to Eq. (21) 1s
of = 0.4 (313xl06)
= 125xl06 N/m2
For this material of 1s given as 1227xl06 N/m2, so the S-N curveslope 1s
b = log (1227/125)/6
= 0.165 or 1/b = 6.05
Finally, for a FS = 2.0, the required shaft diameter d can be found fromEq. (10) to be:
,3 32 (2.0)= l
w 125x10*[o.015 (2000)6-05 t 0.035 (1500)6'05 + 0.05 (1000)6'05]
0.165
= 1.71xlO~4 m3
18
or
d = 0.056 m or 2.2 Inch
It 1s Instructive to note that 1f the calculation were repeated consideringthat only the maximum bending moment of 2000 N-H acted 15 percent of the timeand that If the shaft ran unloaded the rest of the time, that 1s
then
d = 0.054 m or 2.1 Inch
The Insignificant reduction 1n shaft diameter from Ignoring the lower loadsclearly Illustrates the dominant effect that peak loads have on fatigue life.This 1s also apparent from Eq. (3) where life 1s Inversely proportional to the1/b power of stress amplitude. The exponent 1/b typically ranges from about 5for heavily notched shafts to about 14 for some polished, unnotched steel testspecimens without mean stresses (see Table 1). Even at a modest 1/b value of6, 64 times more fatigue damage 1s caused by doubling the alternating bendingmoment or bending stress amplitude. This underscores the necessity of payingclose attention to overload conditions In both shaft and structural elementfatigue designs.
19

REFERENCES
1. Forrest, P. G., Fatigue of Metals, Pergamon Press, New York, 1962.2. Juvlnall, R. C., Engineering Considerations of Stress and Strain, and
Strength. McGraw-Hill, New York, 1967.3. Fuchs, H. 0. and Stephens, R. I., Metal Fatigue 1n Engineering. Wiley,
New York, 1980.4. Collins, J. A., Failure of Materials 1n Mechanical Design: Analysis.
Prediction Prevention. John Wiley and Sons, New York, 1981.5. Graham, J. A., ed.t Fatigue Design Handbook. SAE, New York, 1968.6. Deutschman, A. 0., Mlchels, W. J., and Wilson, C. E., Machine Design:
Theory and Practice. MacMlllan, Inc., New York, 1975. pp. 331-360.7. Borchardt, H. A., "Shortcuts for Designing Shafts," Machine Design. Vol.
45, Feb. 8., 1973, pp. 139-141.8. Bagel, C., "Computer-Aided Fatigue Design of Power Transmission Shafts with
Strength Constraints using a Finite Line Element Technique arid a ProposedFatigue Failure Criterion," ASME Paper 79-DET-103, 1979.
9. Maschlno, S. and Kaftanoglu, B., "Computer-Aided Design of Power Shafts,"ASME Paper No. 83-DET-63, 1983.
10. Wetzel, R. M., ed., Fatigue Under Complex Loading: Analyses andExperiments. Vol. 6, Society of Automotive Engineers, Warrendale, Pa.,1977.
11. "SAE Information Report Technical Report on Fatigue Propert1es-SAEJl099,"SAE Handbook. Pt. 1, Society of Automatlve Engineers, Warrendale, Pa.,1978, p 4.44.
12. "SAE Information Report: Estimated Mechanical Properties and Mach1nab1l1tyof Hot Rolled and Cold Drawn Carbon Steel Bars-SAE J414," SAE Handbook.Pt. 1, Society of Automotive Engineers, Warrendale, Pa., 1978, p. 3.14.
13. Heywood, R. B., Designing Against Fatigue of Metals, Relnhold, New York,1962, p. 30.
14. Loewenthal, S. H., and Orthweln, W. C., Shafts, Couplings, Keys, etc.,Mechanical Design and Systems Handbook. H. A. Rothbardt, ed., 2nd editionMcGraw-Hill Book Co., New York, 1984.
15. Loewenthal, S. H., Design of Power Transmitting Shafts. NASA ReferencePublication to be published, 1984.
16. Peterson, R. E., Stress Concentration Factors. Wiley, New York, 1974.17. "Shafts with Interference-Fit Collars, Part IV: Fatigue Strength of Plain
Shafts," ESDU-68005-Pt. 4, Engineering Sciences Data Unit, London, 1968.18. Almen, J. 0. and Black, P. H., Residual Stresses and Fatigue 1n Metals.
McGraw-Hill, New York, 1963.19. Harris, W. J., Metallic Fatigue. Pergamon Press, New York, 1961, p. 48.20. "Metallic Materials and Elements for Flight Vehicle Structures," M11 -
Handbook 5, Department of Defense, Washington, D.C., 1962.21. Loewenthal, S. H., "Proposed Design Procedure for Transmission Shafting
Under Fatigue Loading," NASA TM-78927, 1978.
20

TABLE 1. - REPRESENTATIVE STRENGTH AND FATIGUE PROPERTIES OF SELECTED STEELS
BASED ON TEST SPECIMEN DATA WITHOUT MEAN STRESSES FROM REFERENCES 11 AND 12
SAE spec
1005-10091005-100910151018102010221040104010451045104510451050114011441541F4130413041404142414241424340434043405160
BHn
1259080
126108137170225225390500595197170305290258365310310380450243409350430
Processdescription
Cd SheetHR SheetNormalizedCD BarHR PlateCD BarCD BarAs ForgedQ & TQ&TQ&TQ&TCD BarCD BarDrawn at TempQ&T ForgingQf tTQ&TQ&T Drawn at TempDrawn at TempQ & TQ&T and DeformedHR AnnealedQ&TQ & TQ & T
°uUlt Str.
ksl (MPa)
60 (414)50 (345)60 (414)64 (441)64 (441)69 (476)85 (586)90 (621)
105 (724)195 (1344)265 (1827)325 (2241)100 (690)88 (607)
150 (1034)138 (951)130 (896)
207 (1427)156 (1076)154 (1062)205 (1413)280 (1931)
120 (827)213 (1469)180 (1241)242 (1669)
°yYield Str,ksl (MPa)
58 (400)38 (262)33 (228)54 (372)38 (262)58 (400)71 (490)50 (345)92 (634)
185 (1276)245 (1689)270 (1862)
84 (579)74 (510)
148 (1020)129 (889)113 (779)
197 (1358)140 (965)
152 (1048)200 (1379)270 (1862)
92 (634)199 (1372)170 (1172)222 (1531)
1
*fFat Str Cof,ksl (NPa)
78 (538)93 (641)
120 (827)
130 (896)
223 (1538)178 (1227)230 (1586)330 (2275)395 (2723)
230 (1586)185 (1276)185 (1276)246 (1696)265 (1827)210 (1448)265 (1827)305 (2103)174 (1200)290 (1999)240 (1655)280 (1931)
b
Fat Str,Exp
0.0730.1090.11
0.12
0.140.0950.0740.080.081
0.090.0760.0830.0810.080.100.080.090.0950.0910.0760.071
*°f
106 cycles,ksl (MPa)
35 (244)29 (202)27 (186)
30 (208)
33 (233)47 (323)79 (547)
104 (715)122 (843)
66 (454)63 (435)59 (404)77 (532)90 (619)53 (366)83 (574)83 (572)49 (337)80 (550)82 (567)
103 (709)
Note: Values listed are typical. Specific values should be obtained from the steel producer.
Symbols:
CO = cold drawnHR = hot rolled
Q&T = quenched and tempered
TABLE 2. - MANUFACTURING PROCESSES THAT PRODUCE RESIDUAL STRESSES
Beneficial residualcompress We stress
Harmful residualtensile stress
Pre-stresslng or overstrainingShot or hammer peenlngSand or grit blastingCold surface rollingCoiningTumblingBurnishingFlame or Induction hardeningCarburlzlng or nltrldlng
Cold straighteningGrinding or machiningElectro-discharge machining (EON)WeldingFlame cuttingChrome, nickel, or zinc plating
COCO
FATIGUE STRENGTH COEFFICIENT
r-Of, CORRECTED| FATIGUE LIMIT' OF SHAFT -
_ j\\
^-N,b= log(a'f/Of)MogNf
I I I I I I
1 10 102 103 104 105 106 107
STRESS CYCLES TO FAILURE, N
Figure 1. - Generalized S-N curve constructed for o'f and Of.

200
8x
| 100UJee.
o2ooUJ
oi—
CSzQ
LLjOQ
50
20
\\/-TENSILE STRENGTH
/ 241 MPa (35 ksi)
L-TENSILE STRENGTH1030 MPa (159 ksi)-
TENSILESTRENGTH,MPa. (ksi)
D 0-483(0-70)O 483-690 (70 - 100)A 690-1030 (100 - 150)O 1030+ (150+)
—- PREDICTED
I I I I
TEST DATA, REF. 13
1 10 102 103 104 105 106 107 108 109
CYCLES TO FAILURE
Figure 2. - Predicted and measured effect of tensile strength onthe stress-life characteristics of steels in reversed bending(from ref. 13).
o
oCM
-2
^0
,-•?
o £
o •!>"~J
t z
oo 2
; -S
i•
o t/>
o
e _S
<u o
fc =
£«
«
•&W
.J C
J^ Q
)
•̂ _i
° .•=t->
V
I
s « s
O
3=
-^
!«
^ "=C
M
u£
<"
U_
QJ
O
c/0 .2*
o
u_
'3Ayno N-S jo 3dois
i/j -5
^O
J O
<u -o o
CL
C
1_
x ro ̂
«5 ^J g
•o o
.5
^| I^S
^ "
2f
o E
o
°- 2
TO
"S
in -5
r- ••-
en
o ° .E
10 t/>
^_«•—
o
co
O
CD
CD
(_) t>
S
i 2
•". T
O -
0>
—
Cl_
CD
CD
8oo8
'C
M
'SS
3N1S
9NiaN
39 ON
I1V10U

,0
t
CM
. ._.
CM
CD
i . i ^T
C
O
r-4to
tUJ g
T
ii m _ / »
•
§ / / /
/ '
/
/ /
/*
-
•
II
1
i
|
avoiONiQNsa /
/ j
&"
• ̂
/ '
/o-S
i i
/—
O 5
j -S: O
ir» O
O
I 1
I
*t 5
P
CO
^
'̂ -*
CM
C
A
1
j 1
oi DO -• ̂
/ ;
1~
~
I
•
1
i '
1
iI 1
1
i ( i
I J 1
III
——
8
t/l C
C*
Q)
o "£
•̂•̂
^n
Q)
1w
^~
«̂
Sd>
r—,„
« S
Q>
E *-
co ti
„
Q
<^ £ ^i
<t
c
<-> "-*O
0 .S
n
9 Q
>, *
> C
H
§
=* J=
°*
h™
*O
*ca <~>
"^
i -
r* m
LU
O
l/>
Q
.
g
S "g
—
CVI
J31
^ «r«
~sl
O
*^
° -
en ca
y313WVIQ
JJVHS 3AI1V13U
1 1
-18
V
CM
1
vr--/v\\
Z \\
\\\
\\\
Of
^5O
QV01 O
NIQ
N38
ii
Ooa>o
§
"Jo
o>«J
oo
evj uj
•r
OO
3JH

ot
>
5
1.1
1.0
.9
.8
103 104 105
SHAFT LIFE IN STRESS CYCLES
'mMs
10C
Figure 7. - Effect of transmitted torque and life on shaftdiameter (notched shaft hawing k-factor = 0.5, tensilestrength = 690 MPa, slope b = 0.13, FS = 1).

1. Report No.
NASA TM-83608
2. Government Accession No. 3. Recipient's Catalog No.
4. Title and Subtitle 5. Report Date
Factors That Affect the Fatigue Strength of PowerTransmission Shafting
6. Performing Organization Code
505-40-427. Authors)
Stuart H. Loewenthal
8. Performing Organization Report No.
E-198410. Work Unit No.
9. Performing Organization Name and Address
National Aeronautics and Space AdministrationLewis Research CenterOeveland, Ohio 44135
11. Contract or Grant No.
12. Sponsoring Agency Name and Address
National Aeronautics and Space AdministrationWashington, D.C. 20546
13. Type of Report and Period Covered
Technical Memorandum
14. Sponsoring Agency Code
15. Supplementary Notes
Prepared for the Fourth International Power Transmission and Gearing Conferencesponsored by the American Society of Mechanical Engineers, Cambridge,Massachusetts, October 8-12, 1984.
16. Abstract
A long-standing objective in the design of power transmission shafting is toeliminate excess shaft material without compromising operational reliability. Ashaft design method is presented which accounts for variable amplitude loadinghistories and their influence on limited life designs. The effects of combinedbending and torsional loading are considered along with a number of applicationfactors known to influence the fatigue strength of shafting materials. Among thefactors examined are surface condition, size, stress concentration, residualstress and corrosion fatigue.
7. Key Words (Suggested by Author(s))
Shafts.ShaftingDesignTransmission shafting
18. Distribution Statement
Unclassified - unlimitedSTAR Category 37
9. Security Classif. (of this report)
Unclassified20. Security Classif. (of this page)
Unclassified21. No. of pages 22. Price"
*For sale by the National Technical Information Service, Springfield, Virginia 22161

National Aeronautics andSpace Administration
Washington. D.C.20546
OflicWlPenalty for Pfiian Ut». $300
SPECIAL FOURTH
*M*gt and F«« paidNation* Aeronautic* vid
NASA451
(WNSA rOSTM ASTER: If Undclhrcritilc (Srction IS*PcwUI Manual) IV. Nul Return