Embed Size (px)
Citation preview
Louisiana State UniversityLSU Digital Commons
LSU Doctoral Dissertations Graduate School
2009
Factors that influence college students who chooseengineering as their major to presist in that major totheir fifth semesterKelli Elaine WildmanLouisiana State University and Agricultural and Mechanical College, [email protected]
Follow this and additional works at: https://digitalcommons.lsu.edu/gradschool_dissertations
Part of the Human Resources Management Commons
This Dissertation is brought to you for free and open access by the Graduate School at LSU Digital Commons. It has been accepted for inclusion inLSU Doctoral Dissertations by an authorized graduate school editor of LSU Digital Commons. For more information, please [email protected].
Recommended CitationWildman, Kelli Elaine, "Factors that influence college students who choose engineering as their major to presist in that major to theirfifth semester" (2009). LSU Doctoral Dissertations. 1934.https://digitalcommons.lsu.edu/gradschool_dissertations/1934
FACTORS THAT INFLUENCE COLLEGE STUDENTS
WHO CHOOSE ENGINEERING AS THEIR MAJOR TO
PERSIST IN THAT MAJOR TO THEIR FIFTH SEMESTER
A Dissertation
Submitted to the Graduate Faculty of the
Louisiana State University and
Agricultural and Mechanical College
in partial fulfillment of the
requirements for the degree of
Doctor of Philosophy
in
The School of Human Resource Education and
Workforce Development
by
Kelli Elaine Wildman
B.A., Louisiana State University, 1996
M.A., Louisiana State University, 1997
December 2009

ii
© Copyright 2009
Kelli Elaine Wildman
All Rights Reserved
iii
Dedication
I would like to dedicate this work to my parents who allowed me to ask why and never
said, ―Because I said so.‖ As I moved through my education, Mom and Dad, you supported me,
telling me that I could do all things through Christ who strengthened me. I thank you for
everything, and I hope I‘ve made you proud. I also want to dedicate this to Steven Douglas.
Although I began this journey solo, I could not have finished it without his love and support. I
share my success and dedicate this dissertation to him. Steve, thank you for walking through this
leg of the journey with me; I look forward to what is in store for us!
iv
Acknowledgements
John Donne‘s quote, ―No man is an island,‖ accurately expresses my sentiments
regarding this dissertation and PhD. I was not alone in this process. I did not do this on my own.
I have many people to thank for helping me make it through the journey.
I believe that the steps of a good man are ordered by the Lord and he delighteth in his
way, and so I must thank God for ordering some pretty amazing steps for me. When I graduated
from LSU with my Master‘s in Curriculum and Instruction in 1997, I thought I would be a high
school teacher until retirement. Although I loved teaching secondary English, God had
something else in mind. He has blessed me beyond my expectations, and I thank Him for it. I
hope to use my life to bring Him glory.
I am fortunate to not be taking those steps alone. Steven Douglas Hefner, thank you for
being my best friend and partner. You see me as I am, and you love me. You complete my life,
and it is because of you that I am here…now. When I wanted to give up, you encouraged me.
When I wanted to delay, you helped me weigh the pros and cons; there were so many more pros
to finishing now. You were my loudest cheerleader, driving me back and forth to LSU to
complete the work, cooking me dinner, mowing my yard, and allowing me to vent my
frustration. You brush me off when I say that I could not have done this without you. Maybe I
could, but I am so grateful that I did not have to do it; you were always there. I love you.
I am blessed to have wonderful parents who helped me get where I am. Mom, I
appreciate the ―Anything boys can do girls can do better‖ t-shirt you bought me in the late 70‘s.
That belief that I could do anything to which I put my mind propelled me forward. Dad, thank
you for asking me if I was sure I wanted to do education and not law; you told me that you
believed I could do whichever I wanted, and you supported me when I said that education was
v
my mission field. Mom and Dad, I am grateful you valued education, both formal and informal,
books and experiences. Mom, thank you for opening up Janice‘s Inn this past year and a half,
providing a place for me to stay, allowing me to take over the dining room (my desk), and
feeding me. Dad and Brenda, thanks for opening your home to me when I needed a quiet retreat
to get work done. I am blessed to have you all in my corner.
Next, I want to thank Christian Brothers University for the support they have given me as
I finished my PhD. When I accepted the position as dean of Academic Services, I knew that I
had a challenge ahead of me; I moved 400 miles away from campus, learned a new job, and
attempted to finish a PhD. Former President H. Lance Forsdick, thank you for saying, ―Do what
you have to do to get this done.‖ Frank Buscher, my boss and vice president for Academic
Affairs, thank you for calling me ―Dr. Wildman‖ every time you saw me; you constantly
reminded me of my goal. Eric Welch, dean of Engineering, thank you for coming to me in my
first month of employment and saying, ―We need to talk about retention.‖ Now that we have
data, we can move forward with a plan! Susan Bittenbender, the I.T. goddess of CBU, you were
wonderful to create a query for me, pulling data from everywhere! I want to thank Lisa Schultz
for being an assistant extraordinaire. When I needed one more article, she was on the task, and I
thank her. There are so many others who stepped in when I had to be away from my office to be
at LSU; thank you. For the words of encouragement when I passed in the hall or that were sent
through an email, thank you. I am proud to be a part of the Buccaneer family.
I am grateful to the E. J. Ourso College of Business for the three and a half years I spent
in the Dean‘s Office as an advisor, coordinator for Freshman Year Experience, associate rector
for the Business Residential College, and instructor of BADM 1000. It is the work that I started
there that lead to my current position and the research I share in this dissertation. Dr. Andrea
vi
Houston, thank you for being a friend and mentor. You saw potential in me, lobbied on my
behalf, and encouraged me when I took the leap to CBU. Former MBA Director, Dr. David
Crary, thank you for saying, ―Start your PhD now; you‘d waste that money on shoes.‖ He was
probably right. For my countless colleagues who supported me then and continue to believe in
me now, I thank you. To Dr. Sonja Wiley-Patton, I am grateful the Graduate School chose you
to serve as my Dean‘s Representative. Your feedback and emotional support were such assets to
this experience.
My relationship with the School of Human Resource Education and Workforce
Development began in August 1980. My mother was hired as the departmental secretary for the
School of Vocational Education. Over the years, ―Voc Ed‖ became ―SHREWD,‖ and my
mother moved on to other career opportunities. That initial introduction was what drew me back
to Old Forestry when it was time for me to pursue my PhD. I am grateful to Dr. Mike Burnett,
my major professor, for allowing me to finish long distance. It caused additional stress for us
both, as well as some tears on my part; however, we made it through with some research of
which I am proud. Drs. Satish Verma, Earl Johnson, and Geraldine Johnson, thank you for
sharing your wisdom through coursework and as members of my committee. You all taught me
so much inside and out of the classroom. Dr. Ed Holton, I want to thank you for allowing me to
work with you on the Chancellor‘s Summit on Workforce Development in May 2007. I was
honored to be a part of something that will hopefully continue and make a positive change for
my home state. For the other faculty members from whom I have taken classes, thank you for
sharing your expertise with me. Finally, Karen Jones and Ann Harrington, I am grateful for your
patience and for being my legs when I was in Memphis. I am proud to graduate from SHREWD,
as you all mentor your students and relish in their success. Thank you for everything.

vii
There are countless other friends and family members who allowed me to be M.I.A. over
the last year, as I have been busy finishing up. Thank you for your patience and encouragement.
Knowing you all were in supporting me made this process possible, and I thank you. I am
blessed beyond measure.
viii
Table of Contents
Dedication. . . . . . . . . . . . . . . . . . . . . . . . . . . . . . . . . . . . . . . . . . . . . . . . . . . . . . . . . . . . . . . . . iii
Acknowledgments . . . . . . . . . . . . . . . . . . . . . . . . . . . . . . . . . . . . . . . . . . . . . . . . . . . . . . . . . . iv
List of Tables . . . . . . . . . . . . . . . . . . . . . . . . . . . . . . . . . . . . . . . . . . . . . . . . . . . . . . . . . . . . . . . x
Abstract . . . . . . . . . . . . . . . . . . . . . . . . . . . . . . . . . . . . . . . . . . . . . . . . . . . . . . . . . . . . . . . . . . xiii
Chapter 1: Introduction to the Study. . . . . . . . . . . . . . . . . . . . . . . . . . . . . . . . . . . . . . . . . . . . . . 1
Higher Education Is Business. . . . . . . . . . . . . . . . . . . . . . . . . . . . . . . . . . . . . . . . . . . . . . . 1
Purpose of the Study . . . . . . . . . . . . . . . . . . . . . . . . . . . . . . . . . . . . . . . . . . . . . . . . . . . . . 6
Research Objectives . . . . . . . . . . . . . . . . . . . . . . . . . . . . . . . . . . . . . . . . . . . . . . . . . . . . . .6
Significance of the Study. . . . . . . . . . . . . . . . . . . . . . . . . . . . . . . . . . . . . . . . . . . . . . . . . .11
Chapter 2: A Review of Relevant Literature . . . . . . . . . . . . . . . . . . . . . . . . . . . . . . . . . . . . . . .12
Introduction. . . . . . . . . . . . . . . . . . . . . . . . . . . . . . . . . . . . . . . . . . . . . . . . . . . . . . . . . . . .12
Start with a Few Definitions. . . . . . . . . . . . . . . . . . . . . . . . . . . . . . . . . . . . . . . . . . . . . . .13
A History Lesson. . . . . . . . . . . . . . . . . . . . . . . . . . . . . . . . . . . . . . . . . . . . . . . . . . . . . . . 15
The Theories on Which the Current Framework Is Built . . . . . . . . . . . . . . . . . . . . . . . . 18
What Makes Students Stay. . . . . . . . . . . . . . . . . . . . . . . . . . . . . . . . . . . . . . . . . . . . . . . .23
Engineering Retention. . . . . . . . . . . . . . . . . . . . . . . . . . . . . . . . . . . . . . . . . . . . . . . . . . . 33
Summary. . . . . . . . . . . . . . . . . . . . . . . . . . . . . . . . . . . . . . . . . . . . . . . . . . . . . . . . . . . . . .36
Chapter 3: Methodology. . . . . . . . . . . . . . . . . . . . . . . . . . . . . . . . . . . . . . . . . . . . . . . . . . . . . .38
Population. . . . . . . . . . . . . . . . . . . . . . . . . . . . . . . . . . . . . . . . . . . . . . . . . . . . . . . . . . . . .38
Instrumentation. . . . . . . . . . . . . . . . . . . . . . . . . . . . . . . . . . . . . . . . . . . . . . . . . . . . . . . . .38
Data Collection. . . . . . . . . . . . . . . . . . . . . . . . . . . . . . . . . . . . . . . . . . . . . . . . . . . . . . . . 40
Data Analysis. . . . . . . . . . . . . . . . . . . . . . . . . . . . . . . . . . . . . . . . . . . . . . . . . . . . . . . . . . 40
Chapter 4: Results. . . . . . . . . . . . . . . . . . . . . . . . . . . . . . . . . . . . . . . . . . . . . . . . . . . . . . . . . . .46
Objective One Results. . . . . . . . . . . . . . . . . . . . . . . . . . . . . . . . . . . . . . . . . . . . . . . . . . . .47
Objective Two Results . . . . . . . . . . . . . . . . . . . . . . . . . . . . . . . . . . . . . . . . . . . . . . . . . . .58
Objective Three Results . . . . . . . . . . . . . . . . . . . . . . . . . . . . . . . . . . . . . . . . . . . . . . . . . .69
Objective Four Results . . . . . . . . . . . . . . . . . . . . . . . . . . . . . . . . . . . . . . . . . . . . . . . . . . 77
Predictive Equation. . . . . . . . . . . . . . . . . . . . . . . . . . . . . . . . . . . . . . . . . . . . . . . . . . . . . 85
Chapter 5: Conclusions and Recommendations. . . . . . . . . . . . . . . . . . . . . . . . . . . . . . . . . . . .86
Summary of Purpose and Specific Objectives. . . . . . . . . . . . . . . . . . . . . . . . . . . . . . . . . .86
ix
Summary of Methodology . . . . . . . . . . . . . . . . . . . . . . . . . . . . . . . . . . . . . . . . . . . . . . . . 90
Summary of Major Findings . . . . . . . . . . . . . . . . . . . . . . . . . . . . . . . . . . . . . . . . . . . . . . 92
Conclusions, Implications, and Recommendations . . . . . . . . . . . . . . . . . . . . . . . . . . . . . 97
References. . . . . . . . . . . . . . . . . . . . . . . . . . . . . . . . . . . . . . . . . . . . . . . . . . . . . . . . . . . . . . . 105
Appendix A – IRB Exemption Approval. . . . . . . . . . . . . . . . . . . . . . . . . . . . . . . . . . . . . . . . 109
Appendix B – Concordance Between the ACT Composite and the SAT Total Scores. . . . . 110
Appendix C – Concordance Between the ACT Math and the SAT Quantitative Scores. . . . 111
Vita . . . . . . . . . . . . . . . . . . . . . . . . . . . . . . . . . . . . . . . . . . . . . . . . . . . . . . . . . . . . . . . . . . . . .112
x
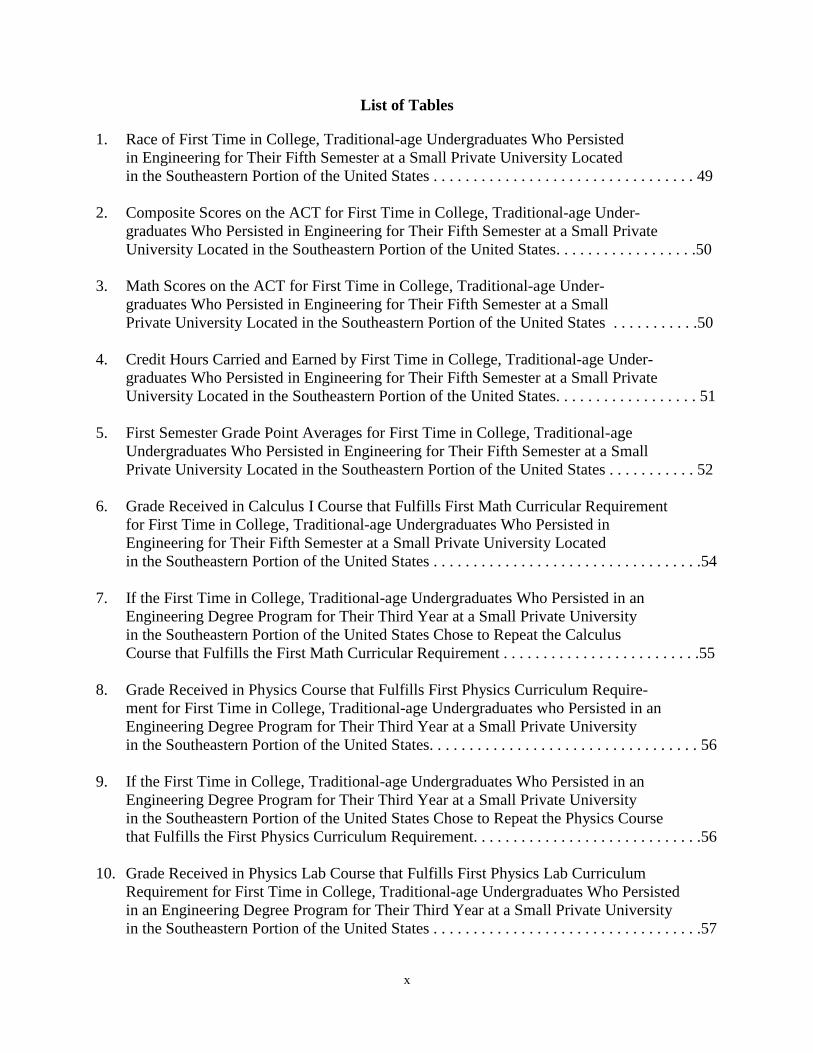
List of Tables
1. Race of First Time in College, Traditional-age Undergraduates Who Persisted
in Engineering for Their Fifth Semester at a Small Private University Located
in the Southeastern Portion of the United States . . . . . . . . . . . . . . . . . . . . . . . . . . . . . . . . . 49
2. Composite Scores on the ACT for First Time in College, Traditional-age Under-
graduates Who Persisted in Engineering for Their Fifth Semester at a Small Private
University Located in the Southeastern Portion of the United States. . . . . . . . . . . . . . . . . .50
3. Math Scores on the ACT for First Time in College, Traditional-age Under-
graduates Who Persisted in Engineering for Their Fifth Semester at a Small
Private University Located in the Southeastern Portion of the United States . . . . . . . . . . .50
4. Credit Hours Carried and Earned by First Time in College, Traditional-age Under-
graduates Who Persisted in Engineering for Their Fifth Semester at a Small Private
University Located in the Southeastern Portion of the United States. . . . . . . . . . . . . . . . . . 51
5. First Semester Grade Point Averages for First Time in College, Traditional-age
Undergraduates Who Persisted in Engineering for Their Fifth Semester at a Small
Private University Located in the Southeastern Portion of the United States . . . . . . . . . . . 52
6. Grade Received in Calculus I Course that Fulfills First Math Curricular Requirement
for First Time in College, Traditional-age Undergraduates Who Persisted in
Engineering for Their Fifth Semester at a Small Private University Located
in the Southeastern Portion of the United States . . . . . . . . . . . . . . . . . . . . . . . . . . . . . . . . . .54
7. If the First Time in College, Traditional-age Undergraduates Who Persisted in an
Engineering Degree Program for Their Third Year at a Small Private University
in the Southeastern Portion of the United States Chose to Repeat the Calculus
Course that Fulfills the First Math Curricular Requirement . . . . . . . . . . . . . . . . . . . . . . . . .55
8. Grade Received in Physics Course that Fulfills First Physics Curriculum Require-
ment for First Time in College, Traditional-age Undergraduates who Persisted in an
Engineering Degree Program for Their Third Year at a Small Private University
in the Southeastern Portion of the United States. . . . . . . . . . . . . . . . . . . . . . . . . . . . . . . . . . 56
9. If the First Time in College, Traditional-age Undergraduates Who Persisted in an
Engineering Degree Program for Their Third Year at a Small Private University
in the Southeastern Portion of the United States Chose to Repeat the Physics Course
that Fulfills the First Physics Curriculum Requirement. . . . . . . . . . . . . . . . . . . . . . . . . . . . .56
10. Grade Received in Physics Lab Course that Fulfills First Physics Lab Curriculum
Requirement for First Time in College, Traditional-age Undergraduates Who Persisted
in an Engineering Degree Program for Their Third Year at a Small Private University
in the Southeastern Portion of the United States . . . . . . . . . . . . . . . . . . . . . . . . . . . . . . . . . .57
xi
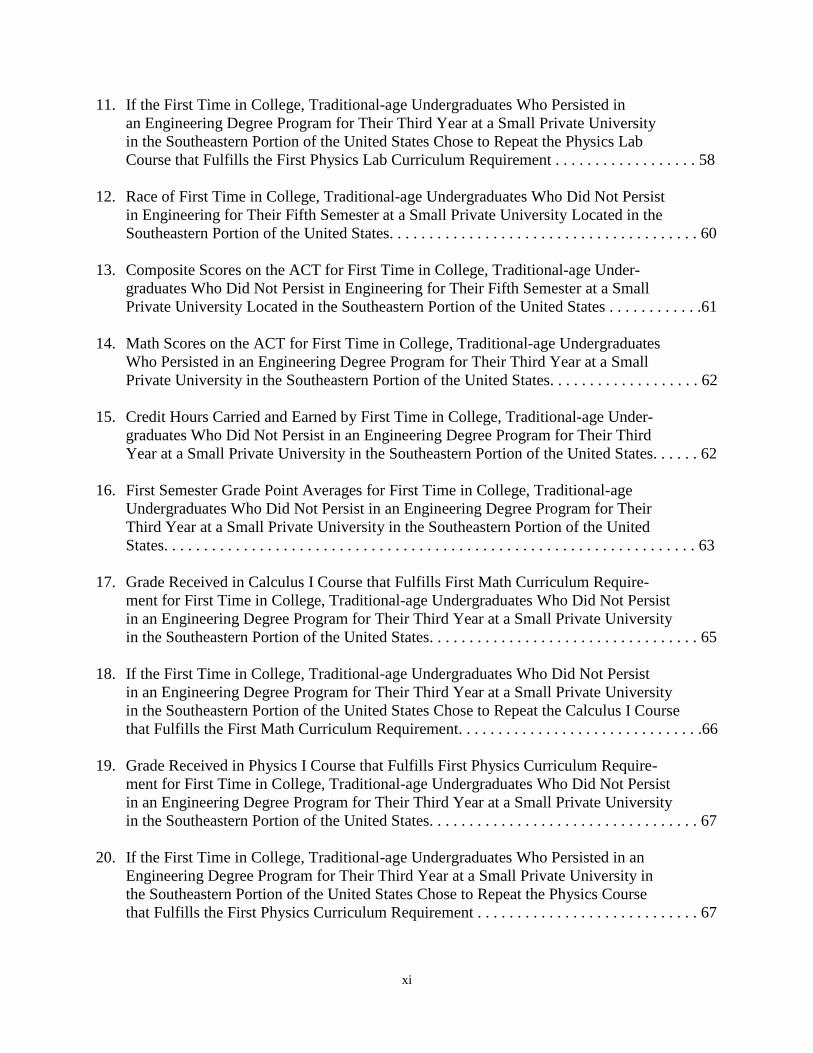
11. If the First Time in College, Traditional-age Undergraduates Who Persisted in
an Engineering Degree Program for Their Third Year at a Small Private University
in the Southeastern Portion of the United States Chose to Repeat the Physics Lab
Course that Fulfills the First Physics Lab Curriculum Requirement . . . . . . . . . . . . . . . . . . 58
12. Race of First Time in College, Traditional-age Undergraduates Who Did Not Persist
in Engineering for Their Fifth Semester at a Small Private University Located in the
Southeastern Portion of the United States. . . . . . . . . . . . . . . . . . . . . . . . . . . . . . . . . . . . . . . 60
13. Composite Scores on the ACT for First Time in College, Traditional-age Under-
graduates Who Did Not Persist in Engineering for Their Fifth Semester at a Small
Private University Located in the Southeastern Portion of the United States . . . . . . . . . . . .61
14. Math Scores on the ACT for First Time in College, Traditional-age Undergraduates
Who Persisted in an Engineering Degree Program for Their Third Year at a Small
Private University in the Southeastern Portion of the United States. . . . . . . . . . . . . . . . . . . 62
15. Credit Hours Carried and Earned by First Time in College, Traditional-age Under-
graduates Who Did Not Persist in an Engineering Degree Program for Their Third
Year at a Small Private University in the Southeastern Portion of the United States. . . . . . 62
16. First Semester Grade Point Averages for First Time in College, Traditional-age
Undergraduates Who Did Not Persist in an Engineering Degree Program for Their
Third Year at a Small Private University in the Southeastern Portion of the United
States. . . . . . . . . . . . . . . . . . . . . . . . . . . . . . . . . . . . . . . . . . . . . . . . . . . . . . . . . . . . . . . . . . . 63
17. Grade Received in Calculus I Course that Fulfills First Math Curriculum Require-
ment for First Time in College, Traditional-age Undergraduates Who Did Not Persist
in an Engineering Degree Program for Their Third Year at a Small Private University
in the Southeastern Portion of the United States. . . . . . . . . . . . . . . . . . . . . . . . . . . . . . . . . . 65
18. If the First Time in College, Traditional-age Undergraduates Who Did Not Persist
in an Engineering Degree Program for Their Third Year at a Small Private University
in the Southeastern Portion of the United States Chose to Repeat the Calculus I Course
that Fulfills the First Math Curriculum Requirement. . . . . . . . . . . . . . . . . . . . . . . . . . . . . . .66
19. Grade Received in Physics I Course that Fulfills First Physics Curriculum Require-
ment for First Time in College, Traditional-age Undergraduates Who Did Not Persist
in an Engineering Degree Program for Their Third Year at a Small Private University
in the Southeastern Portion of the United States. . . . . . . . . . . . . . . . . . . . . . . . . . . . . . . . . . 67
20. If the First Time in College, Traditional-age Undergraduates Who Persisted in an
Engineering Degree Program for Their Third Year at a Small Private University in
the Southeastern Portion of the United States Chose to Repeat the Physics Course
that Fulfills the First Physics Curriculum Requirement . . . . . . . . . . . . . . . . . . . . . . . . . . . . 67
xii
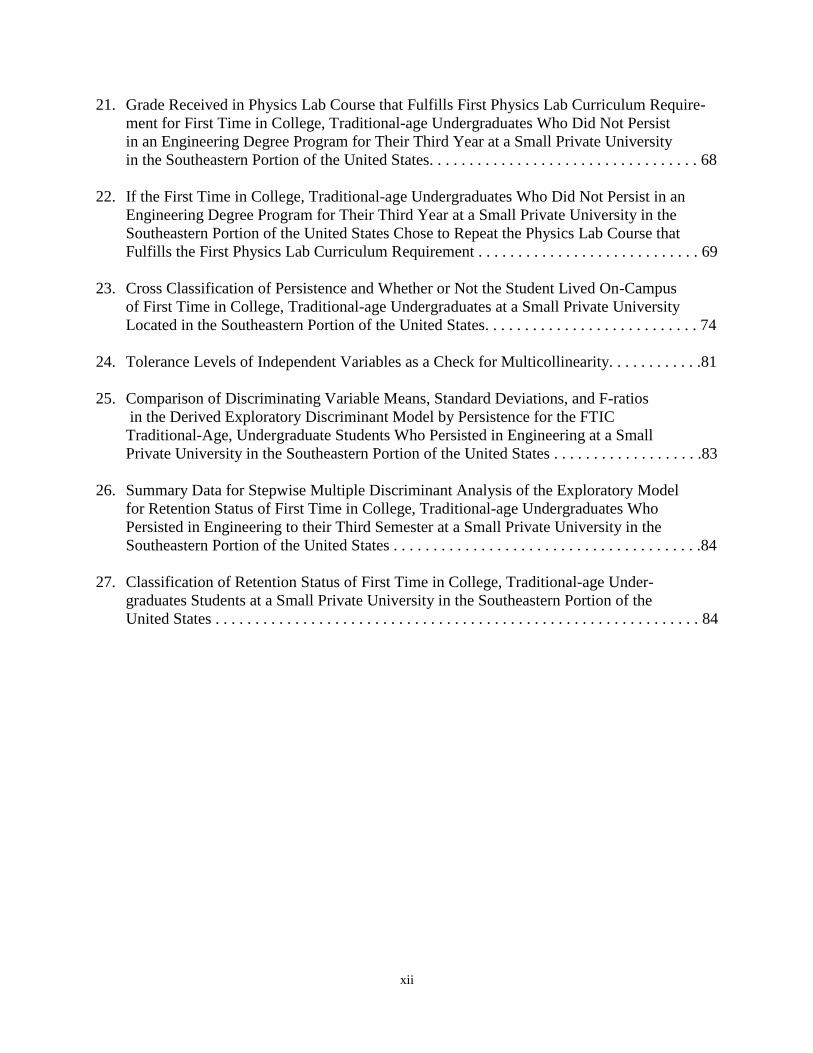
21. Grade Received in Physics Lab Course that Fulfills First Physics Lab Curriculum Require-
ment for First Time in College, Traditional-age Undergraduates Who Did Not Persist
in an Engineering Degree Program for Their Third Year at a Small Private University
in the Southeastern Portion of the United States. . . . . . . . . . . . . . . . . . . . . . . . . . . . . . . . . . 68
22. If the First Time in College, Traditional-age Undergraduates Who Did Not Persist in an
Engineering Degree Program for Their Third Year at a Small Private University in the
Southeastern Portion of the United States Chose to Repeat the Physics Lab Course that
Fulfills the First Physics Lab Curriculum Requirement . . . . . . . . . . . . . . . . . . . . . . . . . . . . 69
23. Cross Classification of Persistence and Whether or Not the Student Lived On-Campus
of First Time in College, Traditional-age Undergraduates at a Small Private University
Located in the Southeastern Portion of the United States. . . . . . . . . . . . . . . . . . . . . . . . . . . 74
24. Tolerance Levels of Independent Variables as a Check for Multicollinearity. . . . . . . . . . . .81
25. Comparison of Discriminating Variable Means, Standard Deviations, and F-ratios
in the Derived Exploratory Discriminant Model by Persistence for the FTIC
Traditional-Age, Undergraduate Students Who Persisted in Engineering at a Small
Private University in the Southeastern Portion of the United States . . . . . . . . . . . . . . . . . . .83
26. Summary Data for Stepwise Multiple Discriminant Analysis of the Exploratory Model
for Retention Status of First Time in College, Traditional-age Undergraduates Who
Persisted in Engineering to their Third Semester at a Small Private University in the
Southeastern Portion of the United States . . . . . . . . . . . . . . . . . . . . . . . . . . . . . . . . . . . . . . .84
27. Classification of Retention Status of First Time in College, Traditional-age Under-
graduates Students at a Small Private University in the Southeastern Portion of the
United States . . . . . . . . . . . . . . . . . . . . . . . . . . . . . . . . . . . . . . . . . . . . . . . . . . . . . . . . . . . . . 84
xiii
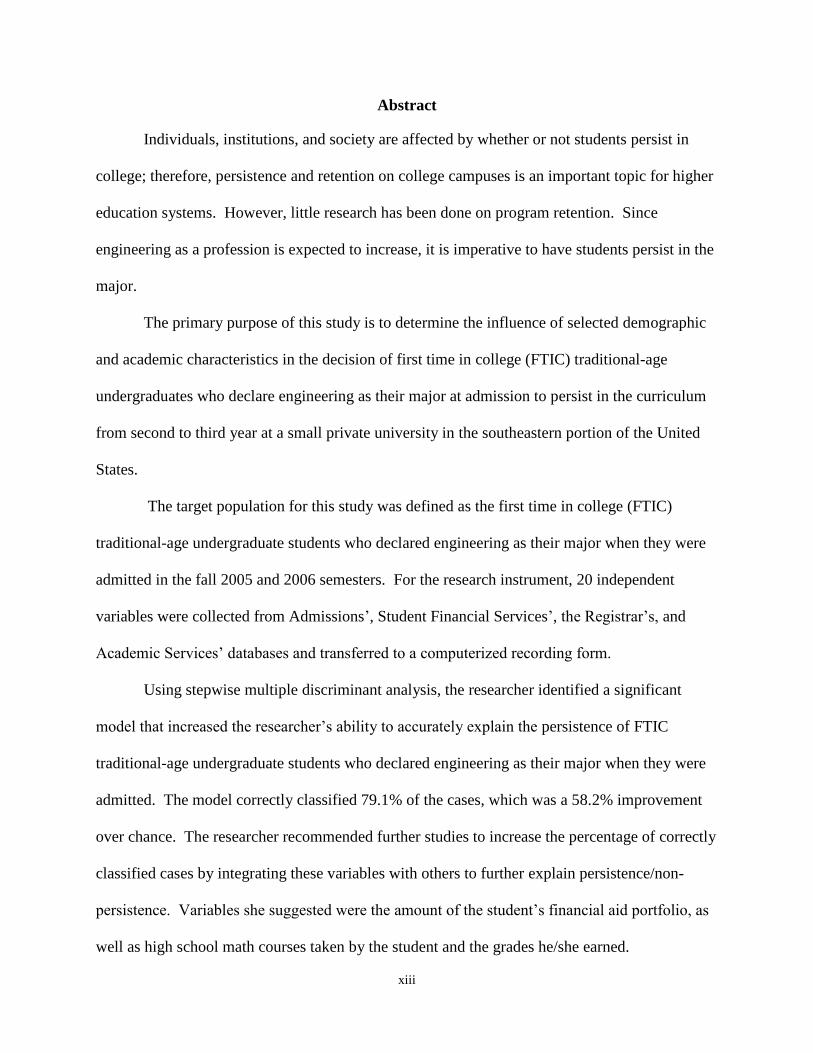
Abstract
Individuals, institutions, and society are affected by whether or not students persist in
college; therefore, persistence and retention on college campuses is an important topic for higher
education systems. However, little research has been done on program retention. Since
engineering as a profession is expected to increase, it is imperative to have students persist in the
major.
The primary purpose of this study is to determine the influence of selected demographic
and academic characteristics in the decision of first time in college (FTIC) traditional-age
undergraduates who declare engineering as their major at admission to persist in the curriculum
from second to third year at a small private university in the southeastern portion of the United
States.
The target population for this study was defined as the first time in college (FTIC)
traditional-age undergraduate students who declared engineering as their major when they were
admitted in the fall 2005 and 2006 semesters. For the research instrument, 20 independent
variables were collected from Admissions‘, Student Financial Services‘, the Registrar‘s, and
Academic Services‘ databases and transferred to a computerized recording form.
Using stepwise multiple discriminant analysis, the researcher identified a significant
model that increased the researcher‘s ability to accurately explain the persistence of FTIC
traditional-age undergraduate students who declared engineering as their major when they were
admitted. The model correctly classified 79.1% of the cases, which was a 58.2% improvement
over chance. The researcher recommended further studies to increase the percentage of correctly
classified cases by integrating these variables with others to further explain persistence/non-
persistence. Variables she suggested were the amount of the student‘s financial aid portfolio, as
well as high school math courses taken by the student and the grades he/she earned.
xiv
The researcher found that many of the non-persisting students had pre-college academic
success, and so the researcher recommends that the institution conduct exit interviews to find out
why these students chose to not persist in Engineering. She also recommends the
implementation of a learning community, a living and learning environment that combines social
and academic integration for the students.
1
Chapter 1: Introduction to the Study
Higher Education Is Business
Higher Education is business. Colleges and universities provide a good/service, an
education, to a customer, the student, for a price, tuition. Institutions have grown to depend on
the revenue that is generated from tuition, and there are implications for these institutions when
students do not persist. If the customer does not continue to buy the goods, there are monetary
consequences. According to John Schuh‘s article, ―Finances and Retention: Trends and Potential
Implications,‖ ―Contemporary financing of higher education has involved an increasing reliance
on students and their families to provide revenues for colleges and universities‖ (2005, pg. 277).
This is true with both public and private institutions. Twenty years ago, degree-granting public
institutions received 12.9% of their revenue from tuition and fees. For their private counter-
parts, the percentage was much higher, 35.9%. In a report provided by the Department of
Education in 2003, doctoral extensive public institutions received just 16.1% of their revenue
from tuition, master‘s and baccalaureate institutions received 21.9% and 26.7% of their income
respectively, from tuition and fees. Private, not-for-profit, doctoral extensive schools received
12.9% of their income from tuition and fees; however, master‘s and baccalaureate institutions
received 53.1% and 32.5% of their income from tuition and fees (Schuh, 2005). If a student does
not persist to graduation, his tuition is lost, and as a result, income is lost to the university. Once
income is lost to the university, business decisions are made. Ultimately, programs are cut,
positions are eliminated, and colleges and universities close.
Institutions get funds from the actual tuition monies; however, they also receive income
from room, board, and textbook sales as well. If a residential student leaves after the first year,
the university loses three years of revenue for the residence hall, meal plan, lab fees, textbooks,
and supplies. After giving an example where attrition of 76 students could cost College A $5.3
million dollars over time, Schuh said, ―As persistence rates fluctuate, the financial implications
2
are more or less dramatic, depending on how much revenue is forgone. In any event, each
student who leaves can represent substantial income lost to an institution of higher education‖
(2005, pg. 291).
The business of higher education affects not only the institution but also the individual
student and society. ―Students who attend institutions of higher education obtain a wide range of
personal, financial, and other lifelong benefits; likewise, taxpayers and society as a whole derive
a multitude of direct and indirect benefits when citizens have access to postsecondary education‖
(Baum & Payea, 2004, pg. 7).
According to The Big Pay-Off, a special study conducted by Day and Newburger in July
2002, individuals who have a bachelor‘s degree earn on average $2.1 million over a work-life,
nearly twice as much as workers with only a high school diploma. ―Median earnings for those
with some college but no degree were 16 percent higher than those for high school graduates‖
(Baum & Payea, 2004, pg. 10). Students who graduate with a four year degree annually earn
62% more than those with only a high school diploma, and ―the typical bachelor‘s degree
recipient can expect to earn about 73% more over a 40-year working life than the typical high
school graduate earns over the same time period‖ (Baum & Payea, 2004, pg. 11). The time,
effort, and funds that a student invests in his education pay great dividends and make getting a
college degree a smart business choice.
The increase in earnings not only helps the individual. It also helps the national, state,
and local governments, as the average college graduate who works full time pays over 100%
more in federal income taxes than the high school graduate and 78% more in federal, state, and
local taxes (Baum & Payea, 2004). The college graduate also has decreased reliance on
government financial assistance, lower demands on the criminal justice system, and greater civic
participation (McClanahan, 2004). Education adds value to the bank account and to the quality
3
of life, and that is good business. According to Alan Seidman, ―It can be said that education is
the great equalizer. No matter what economic stratum a person is born into, he or she can
acquire the skills necessary to succeed through education‖ (2005a, xi).
The necessary skills for today‘s society are in science, technology, engineering, and
math. According to the National Science Board, ―Science and technology have been and will
continue to be engines of US economic growth and national security. Excellence in discovery
and innovation in science and engineering (S&E) derive from an ample and well-educated
workforce – skilled practitioners with two- and four-year degrees and beyond, researchers and
educators with advanced degrees, and precollege teachers of mathematics and science‖ (2003,
pg. 13). ―As the twenty-first century begins, the demand for an abundant, diverse, and talented
engineering workforce remains strong. Continued growth in national productivity requires a
continuous supply of engineers who are highly competent in mathematics and science, and who
are adaptable to the needs of a rapidly changing profession‖ (Noeth, Cruce, & Harmston, 2003,
pg. vi). During this decade, employment in engineering is expected to increase by 3% to as
much as 9% as engineers are needed to design and develop the systems and products that support
the infrastructure of our society (Noeth et al, 2003).
Because this need for engineers could have negative consequences to the structural
development of progress, the government, through the National Science Foundation, deems it
necessary to get involved. ―The Federal Government must direct substantial new support to
students and institutions in order to improve success in S&E study by American undergraduates
from all demographic groups. The Federal Government should:
• Ensure that scholarships and other forms of financial assistance are available to well-
qualified students who otherwise would be unable to attend school full-time to pursue an
S&E major;
4
• Provide incentives to institutions to expand and improve the quality of their S&E
programs in areas in which degree attainment nationwide is insufficient;
• Provide financial support to community colleges to increase the success of high-ability
students in transferring to four-year S&E programs in colleges and universities; and
• Expand funding for programs that best succeed in graduating underrepresented minorities
and women in S&E‖ (2003, pg. 14).
In previous retention research, much focus has been placed on keeping students at the
university; however, not much has been published on the business of keeping students in
particular programs within the institutions and how those programs can meet the demands of
society, specifically with engineering programs. ―For example, a student who declares
engineering as a major but then switches to biology may be retained in an institutional sense but
is lost to the College of engineering‖ (Hagedorn, 2005, pg. 99). Retention within certain majors
may be of interest to deans and department chairs due to difficulty in recruitment or due to
shortages of graduates from specific disciplines; however, program retention is not nationally
tracked and is difficult to measure (Hagedorn, 2005). The NSF realizes that program retention,
namely engineering retention, needs to be tracked, assessed, and reported (2003).
Course completion is an even more focused aspect of retention; which courses are not
being completed even though a student may stay at the university? Also, how does course
completion relate to program retention or student persistence as a whole? If a student does not
fare well in Organic Chemistry, does he change majors outside of the School of Sciences, and if
another student has chosen an institution for its History department, does she leave the institution
if she changes majors? These are questions that affect the business of higher education, and yet
there is little research offered to answer them. Although a university‘s upper administration may
focus more on keeping students on a campus, academic deans worry about keeping students in
5
their degree programs so that the programs continue and the faculty members have students in
their classes.
To answer society‘s need for engineers, deans and department chairs attempt to recruit
the best and brightest science and math students into engineering majors, and over the course of
the students‘ academic career, the administration works hard to retain them to the programs, as
nearly 50% will change their major before graduation (Suresh, 2006). For students who select
engineering as a major, the movement towards Engineering begins in secondary schools, where
students acquire curricular momentum (Adelman, 1998). Students who excel in mathematics
and sciences are often guided towards Engineering; however, these students usually lack
knowledge about the Engineering discipline (Pomalaza-Raez & Groff, 2003). When these
students begin their first college classes, they may find that the reality of the curriculum is not
what they expected, and they may choose to leave. Institutions like Indiana University-Purdue
University at Indianapolis (IUPUI) are addressing these issues with freshman level courses that
provide an introduction to the discipline (Pomalaza-Raez & Groff, 2003).
―It is generally accepted that there is a convergence of factors that lead to attrition (in
Engineering)‖ (Suresh, 2006, pg. 216). Difficulty of curriculum, lack of study skills, poor
academic performance, and lack of knowledge about the skills needed to succeed in Engineering
are some factors discussed by researchers and administrators in schools of Engineering (Suresh,
2006). It is a common presumption that students who leave engineering do so because they
cannot handle the academic rigor. A study using the longitudinal database SUCCEED –
Southeastern University and College Coalition for Engineering Education – conducted by
Borrego, Padilla, Zhang, Ohland, & Anderson dismissed that myth and supported the claim of
the Department of Education; students attrition is linked to academic dissatisfaction (Adelman,
1998). These students do not academically integrate with Engineering, and the average semester
6
during which all students make their move is the third, the fall semester of their sophomore year
(Borrego et al, 2005).
Why do these students fail to integrate academically? Is there a specific issue that can be
addressed in helping these students academically integrate and therefore persist in Engineering?
If so, what is it? Do students who persist have certain demographic and academic
characteristics? Is the attrition from Engineering linked to an educational background, to a
socio-economic status, to specific college courses? Mathematics and Physics are foundational
courses of engineering. Further research is necessary to see if success in these courses is
indicative of a student‘s persistence in engineering past the first and second years and into the
third, or if the choice to persist in engineering is connected to success in college in general, to
success in high school, or to something completely separate. Further research is necessary to see
if there are other defining characteristics of students who persist in Engineering.
Purpose of the Study
The primary purpose of this study is to determine the influence of selected demographic
and academic characteristics in the decision of first-time-in-college (FTIC) traditional-age
undergraduates who declare engineering as their major at admission to persist in the curriculum
from second to third year at a small private university in the southeastern portion of the United
States.
Research Objectives
The following objectives were developed to guide this study.
1.) To describe FTIC traditional-age, undergraduates who persisted for their third year at a
small private university in the southeastern portion of the United States as defined by their
finalizing registration (either payment of fees or setting up a payment plan) on the following
selected demographic and academic characteristics:

7
a.) Age
b.) Gender
c.) Race
d.) ACT/SAT Score
e.) Math ACT/SAT Score
f.) Credits carried by the student first semester
g.) Credits earned by the student first semester
h.) GPA at the end of the first semester
i.) On-campus resident
j.) Receiving Federal Financial Aid
k.) Receiving Scholarships
l.) Receiving Loans
m.) If student took Pre-Calculus
n.) Which Calculus I course was taken
o.) Grade in Calculus I
p.) If Calculus I was repeated
q.) Grade in Physics I
r.) If Physics I was repeated
s.) Grade in Physics I Lab
t.) If Physics I Lab was repeated
2.) To describe FTIC traditional-age undergraduates who did not persist for their third year
at a small private university in the southeastern portion of the United States as defined by their
finalizing registration (either payment of fees or setting up a payment plan) on the following
selected demographic and academic characteristics:
8
a.) Age
b.) Gender
c.) Race
d.) ACT/SAT Score
e.) Math ACT/SAT Score
f.) Credits carried by the student first semester
g.) Credits earned by the student first semester
h.) GPA at the end of the first semester
i.) On-campus resident
j.) Receiving Federal Financial Aid
k.) Receiving Scholarships
l.) Receiving Loans
m.) If student took Pre-Calculus
n.) Which Calculus I course was taken
o.) Grade in Calculus I
p.) If Calculus I was repeated
q.) Grade in Physics I
r.) If Physics I was repeated
s.) Grade in Physics I Lab
t.) If Physics I Lab was repeated
3.) To compare the FTIC traditional-age undergraduates who persisted for their third year at
a small private university in the southeastern portion of the United States as defined by their
finalizing registration (either payment of fees or setting up a payment plan) to those who did not
persist on the following selected demographic and academic characteristics:

9
a.) Age
b.) Gender
c.) Race
d.) ACT/SAT Score
e.) Math ACT/SAT Score
f.) Credits carried by the student first semester
g.) Credits earned by the student first semester
h.) GPA at the end of the first semester
i.) On-campus resident
j.) Receiving Federal Financial Aid
k.) Receiving Scholarships
l.) Receiving Loans
m.) If student took Pre-Calculus
n.) Which Calculus I course was taken
o.) Grade in Calculus I
p.) If Calculus I was repeated
q.) Grade in Physics I
r.) If Physics I was repeated
s.) Grade in Physics I Lab
t.) If Physics I Lab was repeated
4.) To determine if a model exists that can accurately explain the retention status of the FTIC
traditional-age undergraduates who persisted for their third year at a small private university in
the southeastern portion of the United States as defined by their finalizing registration (either
10
payment of fees or setting up a payment plan) to those who did not persist on the following
selected demographic and academic characteristics:
a.) Age
b.) Gender
c.) Race
d.) ACT/SAT Score
e.) Math ACT/SAT Score
f.) Credits carried by the student first semester
g.) Credits earned by the student first semester
h.) GPA at the end of the first semester
i.) On-campus resident
j.) Receiving Federal Financial Aid
k.) Receiving Scholarships
l.) Receiving Loans
m.) If student took Pre-Calculus
n.) Which Calculus I course was taken
o.) Grade in Calculus I
p.) If Calculus I was repeated
q.) Grade in Physics I
r.) If Physics I was repeated
s.) Grade in Physics I Lab
t.) If Physics I Lab was repeated
11
Significance of the Study
The results of this study should contribute to the limited research regarding engineering
retention, program retention, and course retention, as those areas seem to have received little
time and consideration. In an effort to find distinguishing characteristics that set apart the
engineering students who persist to their third year from those who change their major or leave
the university, the researcher examined the students‘ demographically and academically. The
goal of this study is to create a model that is applicable to the School of Engineering at a small
private university and that can be slightly modified to address issues in other schools within this
university, as well as other universities of similar size and programs. Ultimately, the researcher
hopes to make recommendations to faculty, department chairs, deans, and enrollment managers
about how a specific unit can counteract attrition with retention programs once the model
indicates where there is a need.
The more students persist in engineering programs, ―everyone‖ wins. Deans and
department chairs are able to keep their programs running. The university has incoming revenue
from the tuition, books, room, board, fees, etc. Once this student graduates, society has one
more contributing member to the tax fund, and this member is far less likely to be dependent on
the government for assistance. In fact, this person will be contributing to the structure of
progress, building our cities and our cars in safer, more efficient ways. This person will be
working to create and refine eco-friendly fuels. He may defy gravity with his aeronautical
engineering degree, or she may write a computer program that keeps our files virus free.
Therefore, any efforts to increase enrollment and persistence in engineering retention
should be encouraged, and the model from this study should be useful to other small private
universities of similar size and programs.
12
Chapter 2: A Review of Relevant Literature
Introduction
In a freshman English composition class, 25 students sit, anticipating the arrival of their
professor. The reasons they are here are as different as the individuals sitting in the desks, as are
the reasons they may stay. These first-time-in-college students (FTICs) represent the current and
future workforce. They represent their own hopes and some the dreams of their parents. There
are those who are looking for a good time, those who hope to put off joining the real world if
they can, and those who will balance the responsibilities of college, work, and family. These 25
students represent different personalities, different ethnic backgrounds, the different educational
backgrounds of their parents, and different family demographics. They represent ―I want to
continue my family‘s legacy‖ and ―I can‘t go back to my old neighborhood.‖ They represent
their educational background up to this point and all of its strengths and weaknesses. They
represent different majors, different financial aid packages, different career goals, and different
expectations of how this institution can get them there.
What, though, makes them stay or what causes them to leave? Researchers and higher
education administrators have asked themselves those questions for much of the last century,
beginning with the first studies of student mortality in the 1930s. John McNeely, on behalf of
the U.S. Department of the Interior and the Office of Education, conducted a study of 60
institutions, examining the ―extent of attrition, average time to degree completion, points in the
academic career in which attrition was most prevalent, impact of institutional size, impact of
other factors (gender, age at entrance, location of home, type of lodging, participation in
extracurricular activities, dismissal, financial difficulties, illness and death, lack of interest, and
being called home by parents)‖ (Berger & Lyon, 2005, pg. 14).
13
Although there were times since then, due to what was happening in history, the interest
in retention was not as strong as it is currently, college retention as an issue for higher education
has not gone away. It continues to grow in interest because it matters that students not only
attend college but that they complete a degree. It affects how universities are viewed; student
departure can translate to a negative perception of the university, the quality of the institution,
and the stability of its budget (Braxton & Lee, 2005). Retention also affects the quality of life a
student can expect if he/she attends a college or university. If a high school counselor, higher
education researcher, or a guest at a graduation party asked a member of the latest high school
graduating class why he/she is going to college, the responses would be everything from ―I don‘t
know‖ to ―I want to be a doctor when I grow up.‖ The truth of the matter is that most, if not all,
realize that by attending college, they have the opportunity to create a more monetarily
comfortable lifestyle. As previously stated, the increase in earnings helps the individual, and it
also helps society through tax dollars, lower demands on government assistance, and an
increased desire to be civic-minded (McClanahan, 2004).
Because a student persisting and progressing through college affects the individual, the
university, and society as a whole, retention continues to be a popular topic in higher education
research. Students want a reason to stay, administrators want a reliable budget, and society
needs an educated workforce. Since there are no distinct answers, even though there are 5635
citations for ―college retention‖ in ERIC, researchers must continue to figure out the ―student
departure puzzle‖ (Braxton, 2000, pg. 1).
Start With a Few Definitions
According to Berger and Lyon, retention is ―the ability of a particular college or
university to successfully graduate the students that initially enroll at the institution‖ (2005, pg.
3). These are the FTICs – first time in college students. Most begin straight out of high school.
14
Retention is about persistence and progress until degree completion. Universities not only want
students to stay from one semester to the next, but they want them to eventually reach a goal,
graduation. They would prefer that the students reach the goal at the end of four years; however,
administrators are happy with the goals being attained in six years. Although some would argue
that student retention is complicated, confusing, and context dependent and so should include
transfers, those who leave and come back, etc. (Hagedorn, 2005), most research, though, focuses
on FTICs.
―The words persistence and retention are often used interchangeably. The National
Center for Education Statistics, however, differentiates the terms by using retention as an
institutional measure and persistence as a student measure‖ (Hagedorn, 2005, pg. 92). In other
words, a university retains while students persist. What makes a student stay? When discussing
student retention, researchers also discuss attrition, when students fail to re-enroll in consecutive
semesters. ―More students leave their college or university prior to degree completion than stay.
Of the nearly 2.4 million students who in 1993 entered higher education for the first time, over
1.5 million will leave their first institution without receiving a degree. Of those, approximately
1.1 million will leave higher education all together, without ever completing either a two or a
four-year degree program‖ (Tinto, 1993, pg. 1).
A university may lose students to attrition due to dismissal, when they ―invite‖ the
student to leave or sit out a designated time; stop-out, when a student temporarily withdrawals
possibly due to illness or military leave; or drop-out, when a student leaves the university
without ever attaining the initial goal of a bachelor‘s degree. With a permanent dismissal, the
students are forced to leave involuntarily, possibly for breaking the rules or failing to achieve
satisfactory academic progress, but sometimes when students leave, it is voluntary. They may
15
transfer to another university, and that is termed institution departure. System departure is when
students make a decision to leave higher education as a whole (Berger & Lyon, 2005).
Much of retention research focuses solely in terms of FTICs staying at their institution of
first enrollment. Deans and department chairs within institutions are often interested in a more
limited view of retention, viewing retention within a major area of study, program retention. To
narrow the focus even more, an institution may want to measure course completion. What
courses have the largest number of withdrawals? When students withdraw from full courses
after the add-period, they may be barring another student from enrolling in their spot, and the
space is wasted; the course will have to be offered again to both students. By studying retention
within a course, administrators can see which courses have the largest number of withdrawal and
attempt to find out why.
A History Lesson
The history of college retention in the U.S. did not begin with the first colleges and
universities, as the first 250 years in higher education were more focused on institutional survival
than on student persistence and retention (Berger & Lyon, 2005). ―College degrees had little or
no importance in early American society, and higher education was such a small enterprise that
there was no reason to consider persistence toward a degree as an issue‖ (Berger & Lyon, 2005,
pg. 9). Universities catered to specific populations, educating missionaries and pastors, and
eventually preparing men from elite families for vocations in law or politics. The universities
themselves were not very stable, often folding before their first class could graduate. This trend
continued through the mid 1800s when it was a time of rapid expansion of the ―American
college‖ and the establishment of the private denominational college (Berger & Lyon, 2005).
Rapid growth continued until the economic crash of 1837; a college education was viewed to
cater to the professional, not working, class. Again, no one, meaning higher education
16
researchers or administrators, was worried about retention because degree attainment was the
exception, not the rule (Berger & Lyon, 2005).
In the late 1800s, ―the development of a more comprehensive collegiate experience was
in response to external conditions that stimulated the increased importance of degree attainment
and helped make the completion of college a more desirable option‖ (Berger & Lyon, 2005, pg.
11). There was a focus on curriculum and college life. These elite young men in their teens and
early twenties acquired a liberal arts education, similar to that of their fathers. They took
classical languages, ethics, metaphysics, philosophy, and science. Students also organized social
events, playing card games, drinking, forming literary societies, and participating in open
debates. The importance of a ―well-balanced academic and social curriculum‖ began to be
realized (Berger & Lyon, 2005); however, institutions still were not tracking student persistence
and attrition. Administrators did not know why students stayed or why they left. ―Higher
education was still decades away from such concerns‖ (Berger & Lyon, 2005, pg. 11).
By the mid 1800s, college sizes grew in size and scope. Institutions expanded from 50 to
175 students. Women attended colleges like Vassar and Wellesley. Due to the influence of the
Germans, American colleges opened up to research and graduate education. The signing of the
Morrill Land Grant Act in 1862 was one of the most defining moments for American higher
education because it called for at least one college in every state to offer programs in agriculture
and engineering. ―This act transformed the ‗college‘ into the ‗university‘ and focused efforts on
equal access‖ (Berger & Lyon, 2005, pg. 12). It did not cause an initial boom in college
graduates because at first, most of these colleges were small and students did not come to earn a
degree; however, at the turn of the century, with the industrialization of America, that trend
changed.
17
The number of institutions stabilized, enrollments grew as our urban areas needed college
graduates to manage their industrial growth. Some institutions introduced selective admissions
policies, in an effort to weed out the undesirables. Institutions were created to serve the Jewish,
Catholic, and African-American who had been kept out of the more ―select‖ colleges, and
―antecedents of retention began to emerge out of this growth in the undergraduate population and
the increasing numbers of diverse types of colleges and universities‖ (Berger & Lyon, 2005, pg.
13). It was then that John McNeely did his study for the U.S. Department of the Interior and the
Office of Education. ―McNeely‘s work was clearly a forerunner of the more comprehensive
studies that would become common some thirty years later‖ (Berger & Lyon, 2005, pg. 14).
Three governmental policies were instrumental in initiating massive growth in American
colleges and universities mid-twentieth century. First, in 1935, the National Youth
Administration, in an effort to counter the effects of the Depression, was developed to fund
postsecondary educational opportunities for students who would not otherwise have had an
opportunity to go to college. After World War II, over 1.1 million ex-G.I.s took advantage of the
G.I. Bill that was designed to help them acquire the skills to transition back to civilian life. The
National Defense Education Act of 1958 and the Higher Education Act of 1965, after the launch
of Sputnik, continued to define the financial role that the federal government would play in
higher education (Berger & Lyon, 2005). More and more students were on college campuses,
and government helped make it happen.
The larger, more diverse, student populations included students who were underprepared
for college, both academically and socially. Institutions had to deal with student dissatisfaction
with curriculum changes (forced by the economy, as students needed to be prepared for jobs and
careers) and a lack of facilities. Also, this was the 60s, where college campuses were places of
activism and rebellion during the civil rights movement and the Vietnam War. ―These events
18
coincided with growing recognition that student satisfaction with and departure from college was
more complicated than a simple matter of academic fit and success‖ (Berger & Lyon, 2005, pg.
17). In the 40s and 50s, there had been limited attempts to assess patterns of student persistence,
and in the 60s, focus moved to the psychological lens of maturity, motivation, and disposition of
the student in an effort to report patterns of persistence (Berger & Lyon, 2005). That changed,
though, in the 1970s with the introduction of Spady and Tinto and their models of student
persistence.
The Theories on Which the Current Framework Is Built
In 1970, William Spady proposed a model for the college dropout based on the work of
French sociologist, Emile Durkheim. Durkheim believed suicide was a product of a lack of
relationship between individuals and society, and his theory assumed that an individual‘s suicide
was related to his or her ability or inability to integrate into social group (Lutta, 2008; Hagedorn,
2005; Tinto, 1993). Spady published ―Dropouts from Higher Education: An Interdisciplinary
Review and Synthesis‖ (1971) drawing on similar ideas. Student attrition is related to social
integration. Students drop out if they do not fit in. He proposed academic potential, normative
congruence, grade performance, intellectual development, and friendship as variables that
contribute to a student fitting in or dropping out of college (McClanahan, 2004). ―If the student
and the environment are congruent in their norms, the student will assimilate both socially and
academically, increasing the likelihood of persistence‖ (Berger & Lyon, 2005, pg. 19), according
to Spady‘s theory.
Vincent Tinto introduced the student integration model in 1975, which was built on the
work of Spady. This interactionalist theory of student departure combines both psychological
and organizational theoretical models, suggesting that early and continued institutional
commitment will impact both academic and social integration which are both important to
19
college student retention (Berger & Lyon, 2005). His theory enjoys ―paradigmatic status‖ in the
study of college departure. By 2000, this theory had been cited 400 times and in 170
dissertations (Braxton, 2000). By 2004, the ASHE-ERIC Higher Education report indicated that
it manifested itself in 775 citations. Pascarella and Terenzini said that it is ―probably the most
widely used framework guiding research into the complex persistence-related interconnections
among students and their college experiences (2005). That being said, not everyone agrees with
Tinto‘s theory. Empirical research shows mixed result for his findings (Tinto‘s Interactionalist
Theory, 2004,).
Tinto believed that each student brings characteristics with him when he attends college
that directly influenced the student‘s initial commitment to an institution and to
graduation/degree completion. These characteristics can be broken up into three categories:
family background factors, individual attributes, and precollege schooling experiences. Family
includes socio-economic status, parents‘ education level, and parents‘ expectation of the student.
Individual characteristics include race, gender, and academic ability. Finally, pre-college
schooling experiences include secondary school and record of high school achievement. Tinto
hypothesized that these characteristics directly affected the ―departure decision,‖ and this
commitment affected the degree to which the student integrated academically and socially
(Braxton, 2000). According to Tinto, the impact of these two systems is not entirely
symmetrical. Some colleges stress intellectual matters while other institutions may be dominated
by the social life (Tinto, 1993).
Academic integration is defined by structural and normative dimensions. In his model,
Tinto stated that structural integration involved the meeting of explicit standards of the college
or university, whereas normative integration pertained to an individual‘s identification with the
20
normative structure of the academic system (Tinto, 1975). Can a student make the grades? Can
he handle the academic rigor? Does the student feel like the curriculum is a fit for her?
A student‘s ability to fit into the social structure of a university, and therefore socially
integrate, can be through formal or informal means. He may participate in extracurricular
activities that are organized by the university, like a fraternity or intramural sports. She may join
a study group. They may interact with faculty, administrators, and peers. In contrast, a student
may choose to only attend class, opting to not buy-in to the college environment experience
(Tinto, 1975; Braxton, 2000). These students will integrate at different levels, and according to
Tinto, their integration will influence whether or not they are committed to their career and
educational goals, as well as to the goals of the institution (McClanahan, 2004).
Although Tinto‘s integration model was initially introduced in 1975, and it was focused
on the environmental conditions under which departure was likely to occur, he revised his theory
in 1987 and again in 1993 based on a longitudinal, explanatory model of departure, ―namely
inadequate intellectual and social integration into the systems of the institution, and on the
delineation of the individual dispositions (intentions and commitments) which help explain why
certain persons experiencing those conditions will in fact depart those institutions‖ (Tinto, 1993,
pg. 112). He reviewed how adjustment, difficulty, incongruence, isolation, finances, learning,
and external obligations or commitments came to influence students‘ desire, willingness, or
ability to stay or leave an institution. The immediate focus of this model was to explain why and
how some individuals came to depart their institution voluntarily prior to completing their degree
programs.
The model argues that individual departure from institutions is due to a longitudinal
process of interactions between individuals with given attributes, skills, financial resources, prior
educational experiences, and intentions/commitments with other members of the academic and
21
social systems of the institution (Tinto, 1993). Tinto proposed that this model was ―policy
relevant,‖ believing that it could be employed by institutional officials as a guide for institutional
action. Administrators could set an action plan to address elements that interfere with student
persistence and degree completion.
In 1980, Bean deviated from Tinto‘s model with the creation of the Model of Student
Departure (Hagedorn, 2005; McClanahan, 2004). He agreed with Tinto‘s assessment that
retention was based on integration; however, he stressed that students‘ beliefs, which ultimately
shaped their attitudes, were the predictors of their persistence. Bean (1980) posited:
The background characteristics of students must be taken into account in order to
understand their interactions within the environment of the IHE (Institutions of Higher
Education)…The student interacts with institution, perceiving objective measures, such
as grade point average or belonging to campus organizations, as well as subjective
measures such as the practical value of the education and the quality of the
institution…The level of satisfaction is expected to increase the level of institutional
commitment. (pg. 158-160)
Like Tinto, Bean revised his model based on empirical research. He found that peers are
more important agents of socialization than informal faculty contact, students may play a more
active role in their socialization than previously thought, and grades are more the product of
selection rather than socialization (McClanahan, 2004).
Later, in 2000, Bean and Eaton created a psychological model of college student
retention where they presented four psychological theories that helped explain student departure
from college. They made the assumption that leaving college is a behavior, and behaviors are
psychologically motivated. The attitude-behavior theory of Fishbein and Ajzen provided the
structure for Bean and Eaton‘s psychological model in which they introduced self-efficacy,
22
―goodness of fit,‖ and attribution as influences on a student‘s decision to persist. ―The model
indicates that students are psychological beings and that collective issues of sociology play a
secondary role. The social environment is important only as it is perceived by the individual‖
(Bean & Eaton, 2000, pg. 58).
While Tinto and Bean were designing their sociological and psychological models for
retention, Astin and his colleagues at UCLA also studied persistence and retention. Based on
data collected from large national databases from hundreds of colleges and universities, Astin
concluded that involvement was the key to retention; the more students were involved in their
academic endeavors and in college life, the more likely they were to persist (Berger & Lyon,
2005). In 1984, he developed the theory of student involvement to link subject matter, resources,
and individualization of approach to the learning outcomes desired by the student and the
professor (McClanahan, 2004). Later, in 1993, based on an empirical study of the model, Astin
found that the three most important forms of student involvement were academic involvement,
involvement with faculty, and involvement with peers, and the peer group was the single most
powerful influence on growth and development during the undergraduate years (Astin, 1993).
He said that retention was enhanced by residential experiences and student involvement;
however, retention was negatively affected by institutional size, as well as working or living off
campus (Astin, 1993).
Like Tinto, Astin believed that his model was action ready. The aim of What Matters
Most In College: Four Critical Years Revisited was to provide an empirical and theoretical basis
for faculty, administrators, and policy makers to improve the effectiveness of higher education
policy and practice (Astin, 1993). He addressed the faculty, diversity, the pedagogy, resource
allocation, testing, and peer groups. Astin gave the charge to institutions to address these issues
so that students could assimilate to college (1993).
23
Pascarella developed the general causal model in 1985 that included explicit
consideration of both an institution‘s structural characteristics and its environment, providing a
conceptual foundation for multi-institutional studies of collegiate impact (Pascarella &
Terenzini, 2005). Drawing on his previous research, as well as others, Pascarella suggested that
growth is a function of the direct and indirect effects of five main sets of variables: students‘
background/ precollege characteristics, structural/organizational features of the institution,
institution‘s environment, students‘ interactions with socializing agents on campus, and quality
of student effort (Pascarella & Terenzini, 2005).
There are other theorists and researchers in college retention. In 2005, Hagedorn said,
―An ERIC search of the terms college or university retention returns in excess of 3,000 hits‖ (pg.
93). In 2009, there are almost twice as many hits on ERIC. Institutions, whether looking for
answers for themselves or on a much larger scale, do research to find answers to keep students
from departing. There are sociological theories like Tinto‘s. There are psychological theories
like Bean and Eaton. Whether a descriptive or longitudinal model, often ideas overlap. Students
will not stay if they do not like it. How, then, do we make them stay?
What Makes Students Stay
Higher education has student retention models based on theories that are backed by
research. How, though, are these theories translated into action plans that have measurable
outcomes? Tinto said that we need to get students academically and socially integrated. How
does a university make that happen? Bean and Eaton said that self-confidence interacts with
other factors, affecting retention in a positive way (2000). How can an institution positively
affect self-efficacy? How do administrators, faculty, and staff make a student believe that he can
do it? Specifically, how are students retained?
24
College officials should begin addressing campus retention issues by asking themselves
some questions: Does the institution anticipate the importance of students feeling that they fit in
college? Can the institution develop an atmosphere where students are respected as people and
valued as friends and not just a source of revenue? Are resources in place so that all students can
succeed? What is the culture of the campus? Do students understand the full cost of their
education? Do faculty and staff members understand the importance of not just providing their
services but providing them in a way that students have a positive attitude toward the college?
(Bean, 2005). Once officials have the answers to these questions, they can move on to asking,
―What works in retaining students?‖
According to Tinto, ―The answer to that question, however, is not found in the listing of
intervention strategies commonly employed in the treatment of dropout or in the description of
their specific attributes. It resides instead in the answer to the more important question of why
particular forms of institutional action are successful in retaining students‖ (1993, pg. 145).
Administrators must also look at the desired outcome before developing an action plan to get
them there.
Tinto believed that retention was the university community‘s job; it does not belong to
one person or one office. Before any implementation, ―Institutional actions should be
coordinated in a collaborative fashion to ensure a systematic, campus-wide approach to student
retention‖ (1993, pg. 151). It is about the students, the faculty, the staff, and the administration.
It is about academics and student life. This requires that institutions develop a systematic, long-
range plan for retention that ―specifies the interplay between resources, personnel, and actions
needed to achieve desired retention goals‖ (Tinto, 1993, pg. 151). This collaboration is not a one
time event; instead, units must consistently assess ―with an eye for improvement‖ (Tinto, 1993,
pg. 152).
25
In 2004, ACT, Inc. published Habley and McClanahan‘s report ―What works in Student
Retention?‖ based on a survey that was mailed to 2,995 institutions, with 1,061 responding. This
included both two-year and four-year public and private colleges and universities. They listed 82
possible retention programs, services, curricular offerings, and interventions, and institutions
were asked to identify the three practices having the greatest impact on student retention at that
particular institution.
Overall, Habley and McClanahan found that the programs that contributed the greatest to
student retention fell into three main categories: first-year programs, academic advising, and
learning support (2004a). When asked to select three practices with the most impact, survey
respondents identified the following:
• freshman seminar/university 101 for credit
• tutoring program
• advising interventions with selected student populations
• mandated course placement testing program
• comprehensive learning assistance center/lab (2004a).
For four-year private schools, the findings were somewhat different. Although, they, too,
had freshman seminar for credit and advising interventions with select student populations, they
also had internships, integration of academic advising with first-year transition programs, pre-
enrollment orientation, and an early warning system topping their list of top impacting retention
practices (Habley & McClanahan, 2004b). It is worth noting that initial contact with the
institution was done through the Chief Academic Officer, and so the answers to the survey could
be influenced by this individual‘s interests on campus. That being said, Habley and McClanahan
give direction for assessing and implementing student retention interventions. They give
administrators a place to start.
26
―To ease the student‘s transition from high school to college, higher education
administrators must help students adjust to their learning and living environments, and ensure
that the institution is accommodating to the student‘s needs, interests, and learning styles‖ (Lau,
2003, pg. 128). That can be done through orientation programs, academic advising, first year
seminars, competitive financial aid packages, learning communities, tutoring/study groups,
residence halls, identifying with one‘s major, and having opportunities to interact with both
faculty and peers (Pascarella & Terenzini, 2005). These programs can be categorized into
transitioning, financial aid, academics, and community. Orientation, advising, and first year
seminars are a part of a student‘s transitioning to campus. Financial Aid gets a label all to itself.
Learning communities, tutoring/study groups, major, and interacting with faculty are a part of
academics. Finally, residence halls and interacting with peers are under the heading of
community.
Tinto (1993), Bean (1980), and Astin (1993) established that when students transition to
college, they come for various reasons, with differing expectations, performing at multiple
academic levels, based on prior educational experiences, with a vast array of other
considerations. Institutions of higher learning want to make sure that these students get off to a
great start. When newcomers arrive on campus, they can participate in an orientation program
that will acculturate them to the new university (Kuh, Kinzie, Schuh, Whitt, & Associates, 2005).
These programs provide information to the student – institutional policies, degree requirements,
etc. To make this event an effective retention program, though, institutions must ―go beyond the
provision of information per se to the establishment of early contacts for new students not only
with other members of their entering class but also with other students, faculty, and staff‖ (Tinto,
1993, pg. 159). Some institutions do this by bringing in upperclassmen to talk with the students.
Faculty may introduce their academic programs. Staff members make students and their families
27
aware of services the institution provides (Tinto, 1993; Kuh et al, 2005). The purpose is to
connect the student with the institution; they should feel that the transition to being a college
student will be a smooth one. Braxton and Lee believe that these programs fulfill that purpose
and should be mandatory (2005).
Some institutions choose to expand the orientation past getting a catalog and a quick
schedule. Instead, they have orientation programs that extend into the academic year in an effort
to help them adjust to life away from home (Kuh et al, 2005; Lau, 2003). Murtaugh, Burns, and
Schuster conducted a study of 8,867 undergraduates at Oregon State University. They found that
―students taking the Freshman Orientation Course appeared to be at reduced risk of dropping
out‖ (1999, pg. 355). These transition/orientation courses can be, but are not always, academic
in nature. Instead, they are more developmental and cover a variety of topics: social adjustment,
social responsibility, sexual behavior, discrimination, date rape, and self-protection. They help
students develop skills like appropriate behavior in class, meeting with a professor, and in the
residence halls (Tinto, 1993). The purpose of the course is to provide information to the student
so that he feels comfortable as a part of this campus community.
Some institutions require all students to participate in some freshman seminar; however,
for most colleges, it is an elective, whether it is an ―orientation‖ type course or something more
―academic‖ (Pascarella & Terenzini, 2005). Freshman Seminar courses were first introduced by
John Gardner in 1972 at the University of South Carolina as University 101. The seminars ―vary
widely in content, duration, structure, pedagogies, and degree credit value, but all have the goal
of promoting academic performance, persistence, and degree completion‖ (Pascarella &
Terenzini, 2005, pg. 400). Pascarella and Terenzini reported that there is evidence of the
effectiveness of these Freshman Seminar/Orientation courses, ―With respect to degree
completion, an informal examination of evidence of varying degrees of quality from more than
28
40 reports supports the estimate that FYS participants are 5-15 percentage points more likely
than non-participants to graduate within four years‖ (2005, pg. 402).
Where orientation programs and freshman seminar programs may miss, advising can
complete the transition process for students. Advising has many incarnations. It can be one on
one between a student and a staff member, and the two can discuss everything from degree
requirements to how to study for a French exam. It can also be more personal in nature; a
student may meet with a faculty member to discuss the pressures of working 40 hours a week,
taking 18 hours, and feeling academically unprepared. Students may meet with their peer
advisor when choosing courses for the next semester. Advising has taken on many forms,
―including both pre- and post-admissions advising, ‗intrusive‘ advising, group advising, and a
variety of enhancements in traditional advising programs‖ (Pascarella & Terenzini, 2005, pg.
404).
―The effectiveness of advising and counseling is further enhanced when they are an
integral and positive part of the educational process which all students are expected to
experience‖ (Tinto, 1993, pg. 172). ―The caring attitude of college personnel or lack thereof is
considered the most potent retention force on campus‖ (Lutta, 2008, pg. 53). Whether a
professional staff member, faculty member, or a peer, an advisor can assist students in
everything from choosing a major/career to selecting courses for registration. The greatest
hurdle for effective advising, though, is to provide students with consistent and accurate
information about their program choices (Tinto, 1993). ―Many students use poor advising as an
excuse for leaving. Good advising should link a student‘s academic capabilities with his or her
choice of courses and major, access to learning resources, and a belief that the academic pathway
a student is traveling will lead to employment after college‖ (Bean, 2005, pg. 226).
29
―There has long been a debate within the community of persistence researchers about
whether finances actually influence persistence‖ (St. John, Cabrera, Nora, and Asker, 2000, pg.
40). Initially, Vincent Tinto believed that when a student said that he was leaving college
because of the money that there was another, underlying reason, possibly a change in
commitments. After studies in the 1980s and 90s showed that finance-related factors (such as
tuition, room, board, student aid, etc.) explained about half of the total variance of the persistence
process, it was clear that there is a relationship between finances and retention.
―Financing higher education has become a complex, high-stakes activity for students and
their institutions. Many students, in effect, are betting their economic future on their college
experience‖ (Schuh, 2005, pg. 277). Students are relying on financial aid to do more than
supplement the cost of tuition; they are funding the complete cost of attendance, which includes
room, board, books, meal plans, lab fees, and ancillary expenses like transportation. ―Financial
Assistance to college students increased from a meager $557 million in 1963-1964 to a
phenomenal $55.7 billion dollars in 33 years‖ (St. John et al, 2000, pg. 29).
What kind of aid a student receives directly affects whether students enroll and whether
they can afford to continue their enrollment. ―Each year, as aid packages change due to federal,
state, and institutional aid policies, students are faced with new choices about whether to enroll,
where to attend, and whether to continue full time‖ (St. John, 2000, pg. 72). Families consider
total cost of attending, not just tuition, when deciding where a student will attend and if the
student can afford to persist; therefore, an annual analysis of the effects of aid on matriculation
and persistence should be replicated by the university to ensure that campus financial aid policies
have the desired effect on persistence and retention (Hossler, 2000).
As students consider if they will persist through college, if they can afford it, they
consider possible aid from grants, scholarships, loans, and work study. ―Although the evidence
30
is both generally clear and consistent in indicating that receipt of financial aid reduces the
economic barriers to enrollment and persistence for financially needy students, the research is
less clear concerning which types of aid – such as grants and scholarships, loans, work study,
singly or in combination – have the greatest impact‖ (Pascarella & Terenzini, 2005, pg. 409).
Studies do indicate that grant aid and work study assistance have positive and significant effects
on persistence degree completion (Pascarella & Terenzini, 2005).
Student loans can also be a part of a student‘s financial aid package, and in recent years,
due to federal and state financial aid policy changes, there has been a shift from grant
disbursement to ―awarding‖ students loans. Research is mixed as to whether the change in
policy has positively or negatively affected retention. ―Whether debt (from loans) spurs or
reduces an individual‘s chances of persistence and graduation remains unclear‖ (Pascarella &
Terenzini, 2005, pg. 413).
The one experience that most college students share is that of the classroom, and the
curriculum and pedagogical practices of a university shape the role that the classroom, faculty,
supplemental instruction, and academics, in general, play in student persistence (Tinto, 2000).
The academic setting is made up of peers and faculty members, who, according to Astin, are the
two most significant aspects in student development (1993). Chickering and Gamson encourage
contact between faculty and students in and outside of the classroom, as it is the ―most important
factor in student motivation and involvement‖ (1987, pg. 4).
A study by Pascarella, Seifert, and Whitt concluded that exposure to effective classroom
instruction in college has implications beyond the facilitation of knowledge acquisition;
organized and clear instruction during the first year of college significantly increases the
probability that a student re-enrolls for a second year (2008). A way that faculty can provide that
effective classroom instruction is through learning communities. ―Learning communities, in
31
their most basic form, intentionally cluster two or more courses taken by a cohort of students,
typically around an interdisciplinary theme‖ (Engstrom, 2008, pg. 7). For a learning community
to work well, it goes beyond a cluster of classes. Shared learning experiences of learning
communities help to cement friendships and bridge the academic-social divide (Tinto, 2000).
The community becomes a safe learning environment that promotes student success, encourages
student participation, and validates student views (Engstrom, 2008).
Such environments use active learning techniques. ―Learning is not a spectator
sport…They must talk about what they are learning, write about it, relate it to past experiences,
apply it to their daily lives. They must make what they learn a part of themselves‖ (Chickering
& Gamon, 1987, pg. 5). Affording students the opportunity to connect with peers through class
discussions allows them to integrate both socially and academically (Braxton et al, 2008).
Support services such as tutoring, supplemental instruction, and academic services
centers can fill the gap when it comes to a student integrating academically. It is important to
identify the students in need of assistance academically, assess the need, prescribe the
appropriate intervention, monitor, and adjust if necessary (Seidman, 2005b).
Often, formal classroom groups spill out into informal study groups and supportive
networks, influencing a student‘s desire to continue college despite the many challenges the
student may face (Tinto, 2000). According to Astin, receiving tutoring in courses is positively
associated with student satisfaction (1993). Lau said that peer tutoring increases the student‘s
involvement with the learning process and enriches the student‘s understanding of the course
material (2003).
Traditionally, these ―support‖ services are thought to be provided for at-risk students;
however, in an effort to address at-risk courses, not students, institutions design supplemental
instruction (SI) where student facilitators rather than professors work cooperatively on materials
32
that supplement and enrich what is taught in class (Peterfreund, Rath, Xenos, & Bayliss, 2008).
Some institutions include this as part of the course; however, for others, it is voluntary.
According to Peterfreund et al, students who participate in SI tend to do better than those who do
not (2008). Specifically, in his study, ―the presence of SI at SFSU (San Francisco State
University) appears responsible for getting many more students through the courses and on to
bachelor‘s degrees than would be possible without the program‖ (2008, pg. 501).
The transition from high school to college, financial aid packages, and academic
interactions all work together to build an experience for the student. It is the community of
college that often has the greatest impact because it is affected by peer interaction. ―A peer
group is a collection of individuals with whom the individual identifies and affiliates and from
whom the individual seeks acceptance or approval‖ (Astin, 1993, pg. 400). This happens in the
classroom, in the common meeting areas, in the residence halls, and in structured student
organizations. It is with these individuals that a student can socially integrate. If a student is
able to connect with others like himself, he is more likely to persist. ―Contact among students
may be particularly important not only because it helps cement personal affiliations which tie the
new student to the fabric of student culture, but also because it enables the newcomer to acquire
useful information as to the informal character of the institutional life (Tinto, 1993).
Living on campus has a direct positive effect on students becoming more involved in the
campus community, joining fraternities or sororities, being elected to student office, and
attending recitals and concerts. ―The three effects that are directly attributable to living in a
campus residence hall are positive effects on attainment of the bachelor‘s degree, satisfaction
with faculty, and willingness to re-enroll in the same college‖ (Astin, 1993, pg. 367). Students
who live on campus are immersed in the community and are more likely to persist in school in
order to be a part of the community. Their friends are ―there.‖ They want to be ―there‖ too.
33
According to Braxton and Lee, living on campus should be a required part of the first year
experience (2005).
Engineering Retention
As of May 15, 2009, ERIC had 5,635 citations for college retention; however, it may
have changed, as research regarding student persistence is growing exponentially. In contrast to
that, though, there were 51 citations for engineering college retention. Much focus has been
placed on keeping students at the university; however, not much published research has focused
on keeping students in specific programs within these colleges. It is important that colleges and
universities that offer engineering majors keep the Engineering workforce full and flowing with
qualified applicants.
It is the engineers who apply the principles of science and mathematics to develop
economical solutions to technical problems. They link scientific discoveries and the commercial
applications that meet societal and consumer needs. ―In addition to design and development,
many engineers work in testing, production, or maintenance. These engineers supervise
production in factories, determine the causes of component failure, and test manufactured
products to maintain quality. They also estimate the time and cost to complete projects‖ (Bureau
of Labor and Statistics, 2008. para. 3). They develop spacecraft, design devices that solve
medical and health-related issues, oversee the manufacture and installation of computer
hardware, and develop solutions to environmental issues such as air and water pollution, among
many other specializations (Bureau of Labor and Statistics, 2008). To be able to do that, an
engineer needs a certain educational background that is heavy in math, technology, and physical
sciences (National Science Board, 2003).
Often, K-12 students who are successful in the sciences choose Engineering as a major
when they matriculate to college; however, Suresh‘s study in 2006 found that 50% of students
34
who start engineering leave by the end of the first or second year. Because of the need for
engineers in society, it is imperative to find out why they leave and to stop the mass exodus.
Adelman found that both women and men who leave the engineering path are more likely to take
their curricular momentum into computer science and the physical sciences than other majors,
and women who leave the engineering path are more likely to complete bachelor‘s degrees than
are men (1998). Borrego and her colleagues‘ study found that both male and female students
chose business over the computer and physical sciences (2005). A certain amount of shifting is
to be expected of college students as they choose, un-choose, re-choose their majors. What is
interesting is that after matriculation, engineering attracts far fewer students than any other major
(Ohland, Sheppard, Lichtenstein, Eris, Chachra, & Layton, 2008). It is not likely that they will
graduate in engineering if they did not declare it at the time of admission. ―Over 90% of eight-
semester students who are studying engineering had identified engineering as their major when
they matriculated to college‖ (Ohland et al, 2008, pg. 275). These students did not begin college
as Arts, Sciences, or Business majors.
In What Matters in College: Four Critical Years Revisited, Astin concluded that
choosing engineering as a major positively correlated with the development of strong analytic
skills but negatively correlated with overall college experience satisfaction (Astin, 1993). If
students do not have a positive college experience, they will leave the major or the institution.
How can schools of engineering determine if students will positively integrate academically?
Kauffmann, Abdel-Salam, and Garner conducted a study looking for predictors of success (as
measured by end of year GPA) in the first two years for engineering students. They found that
high school GPA and rank were the most significant predictors for success of freshmen and
sophomores; SAT scores (verbal and math) were not statistically significant in predicting
35
success. Kauffman et al believed that standardized test scores serve as a snapshot and ―do not
measure a student‘s determination or persistence to succeed‖ (2007, pg. 9).
Suresh conducted a study of student performance in barrier courses. For engineering
students, those courses are varying levels of Calculus, Physics, and Chemistry. In his study, he
found that high school academic experience, student behaviors (including study habits, work
habits, coping strategies), students‘ perceptions about faculty behavior (including teaching styles
and the ―weed out‖ culture), the perceived culture of support in the engineering school, and
motivation to succeed in engineering all impacted student performance in the above mentioned
barrier courses (2006).
Schools of Engineering are filled with white men; however, recruiting and retention
efforts are focusing on historically underrepresented students, meaning women and minorities.
―African Americans, American Indians, and Hispanics will make up almost 60% of the
population increase‖ by 2010 (Noeth et al, 2003). The engineering community wants a
workforce that is more reflective of that. According to Davis and Finelli, ―The engineer of the
twenty-first century will compete in an increasingly global environment and face an expanding
array of problems in the business sector as well as the social sector. To meet these challenges,
the U. S. engineering enterprise must produce graduates who are not only technically proficient
but also diverse in terms of background, culture, outlook, and approach‖ (2007, pg. 63).
―Demographic changes overlaid with future workforce demands demonstrate the necessity to
substantially increase the number of well-prepared female and minority students entering and
completing engineering programs‖ (Noeth et al, 2003, pg. vi). That is an arduous task. Based
on Tinto (1993), Astin (1993), and Bean (1980), students want to connect with their peers, with
students like them. If a female is sitting in a class with 15 males, she may have difficulty
socially integrating.
36
The research that has been done in engineering retention has barely scratched the surface.
There are a few studies that look at predictors for success from the first to second year; what,
though, would make them stay in engineering from sophomore to junior year? Barrier classes
can scare students away, as they are called ―barriers‖ for a reason; should they, instead, be
considered foundation courses? Exactly what courses are the ―breaking point‖ for students?
Where do they get off? Is the research available to answer those questions?
Summary
John Bean said, ―Student Retention is a win-win situation: the student gains an education
and increased lifetime earnings and the institution educates a student, fulfilling its mission, and
gains tuition income‖ (2005, pg. 237). It‘s that easy, except that it isn‘t. Students come, and
then for whatever reason, students go. Despite the research done and theories proposed by
Spady (1970), Tinto (1993), Bean (and Eaton) (1993; 2000), Astin (1993), and Pascarella and
Terenzini (2005), there are gaps in the theories and the research based on them. Braxton and
Lee, in an effort to test Tinto‘s Interactionalist Theory, tested 13 propositions based on his
theory. Of the 13, there was only reliable knowledge for three propositions with regards to
residential campuses; there was no reliable knowledge available for commuter campuses
(Braxton & Lee, 2005). Because there are major gaps in the literature regarding persistence,
especially past the first year in college (Nora, Barlow, & Crisp, 2005), there continues to be a
need for reliable knowledge; there continues to be a need for research.
The research must go past theories on college retention. It should also address retention
within academic programs. It is not enough that we are ―educating the workforce.‖ We, as a
society, need to ensure that the workforce has certain skills, especially when technical skills are
needed, and so we must retain students in these disciplines. How, then, can we do that? What
are the predictors for student persistence past the first year, the second, and on to graduation?
37
More research needs to be done. At what levels in the barrier courses do schools of Engineering
lose their students? Is it Calculus I, II, III, or Differential Equations? Maybe Physics I or II?
There is a need for this research so that institutions can better meet the needs of their students
and assist them in persistence.
38
Chapter 3: Methodology
Population
The target population for this study was defined as the first-time in college (FTIC)
traditional-age undergraduate students who declared engineering as their major when they were
admitted at a small private university which is located in the southeastern portion of the United
States. The accessible population was defined as the FTIC traditional age undergraduate
students who declared engineering as their major when they were admitted during the fall 2005
and 2006 semesters at one small private university in the southeastern portion of the United
States. The sample for this study was defined as 100% of the defined accessible population who
entered during the fall 2005 and 2006 semesters as engineering majors at the selected small
private university located in the southeastern portion of the United States. The sampling plan for
this study is outlined below:
a.) All FTIC traditional-age, undergraduate students who entered during the fall 2005
and 2006 semesters as engineering majors at a selected small private university in the
southeastern portion of the United States were identified following the last day to
finalize registration with the institutions‘ Business Office, which means to have paid
fees or made a commitment to pay fees.
b.) The sample was defined as 100 percent of the accessible population. This study
therefore had a total of 92 traditional-age undergraduate students who entered during
the fall 2005 and 2006 semester as declared engineering majors at a small private
university in the southeastern portion of the United States.
Instrumentation
The instrument used in collecting data for this study consisted of a researcher-designed
computerized recording form on which data from the Office of Undergraduate Admissions,
39
Student Financial Services, the Registrar, and Academic Services was downloaded and stored.
The form, containing information from the above mentioned databases, served as the research
instrument. The variables that were measured were based on previous research that is noted in
the review of relevant literature, as well as curricular requirements of three universities‘
engineering programs. These variables included:
a.) Age
b.) Gender
c.) Race
d.) ACT/SAT Score
e.) Math ACT/SAT Score
f.) Credits carried by the student first semester
g.) Credits earned by the student first semester
h.) GPA at the end of the first semester
i.) On-campus resident
j.) Receiving Federal Financial Aid
k.) Receiving Scholarships
l.) Receiving Loans
m.) If student took Pre-Calculus
n.) Which Calculus I course was taken
o.) Grade in Calculus I
p.) If Calculus I was repeated
q.) Grade in Physics I
r.) If Physics I was repeated
s.) Grade in Physics I Lab
40
t.) If Physics I Lab was repeated
Data Collection
In collecting the data, the researcher transferred the information from the Office of
Undergraduate Admissions, Student Financial Services, the Registrar, and Academic Services‘
databases for the selected small private university and downloaded it into her computerized
recording form that served as the instrument. Permission for the study was received from the
university‘s administration, with permission to access and collect the data. The researcher
received permission from the Institutional Review Board (IRB) to conduct the study (See
Appendix A).
The researcher worked closely with Information Technology Services at the university to
retrieve the variables from the selected databases.
Data Analysis
The data analysis for this study was designed to accomplish the objectives of the study
and included the following procedures.
1.) Objective one was to describe FTIC traditional-age, undergraduates who persisted in an
Engineering degree program for their third year at a small private university in the southeastern
portion of the United States as defined by their finalizing registration (either payment of fees or
setting up a payment plan) on the following selected demographic and academic characteristics:
a.) Age
b.) Gender
c.) Race
d.) ACT/SAT Score
e.) Math ACT/SAT Score
f.) Credits carried by the student first semester
41
g.) Credits earned by the student first semester
h.) GPA at the end of the first semester
i.) On-campus resident
j.) Receiving Federal Financial Aid
k.) Receiving Scholarships
l.) Receiving Loans
m.) If student took Pre-Calculus
n.) Which Calculus I course was taken
o.) Grade in Calculus I
p.) If Calculus I was repeated
q.) Grade in Physics I
r.) If Physics I was repeated
s.) Grade in Physics I Lab
t.) If Physics I Lab was repeated
Descriptive statistics were used to accomplish this objective. The specific procedure was
selected based on the level of measurement of the variable. Those measured on an interval scale
were described using means and standard deviation. Those on a categorical scale were described
using frequencies and percentages in categories.
2.) Objective two was to describe FTIC traditional-age undergraduates who did not persist in
an Engineering degree program for their third year at a small private university in the
southeastern portion of the United States as defined by their finalizing registration (either
payment of fees or setting up a payment plan) on the following selected demographic and
academic characteristics:
42
a.) Age
b.) Gender
c.) Race
d.) ACT/SAT score
e.) Math ACT/SAT score
f.) Credits carried by the student first semester
g.) Credits earned by the student first semester
h.) GPA at the end of the first semester
i.) On-campus resident
j.) Receiving Federal Financial Aid
k.) Receiving Scholarships
l.) Receiving Loans
m.) If student took Pre-Calculus
n.) Grade in Calculus I
o.) Which Calculus I course was taken
p.) If Calculus I was repeated
q.) Grade in Physics I
r.) If Physics I was repeated
s.) Grade in Physics I Lab
t.) If Physics I Lab was repeated
Like objective one, descriptive statistics were used to accomplish this objective. The
specific procedure was selected based on the level of measurement of the variable. Those
measured on an interval scale were described using means and standard deviation. Those on a
categorical scale were described using frequencies and percentages in categories.
43
3.) Objective three was to compare the FTIC traditional-age undergraduates who persisted
for their third year at a small private university in the southeastern portion of the United States as
defined by their finalizing registration (either payment of fees or setting up a payment plan) to
those who did not persist on the following selected demographic and academic characteristics:
a.) Age
b.) Gender
c.) Race
d.) ACT/SAT Score
e.) Math ACT/SAT Score
f.) Credits carried by the student first semester
g.) Credits earned by the student first semester
h.) GPA at the end of the first semester
i.) On-campus resident
j.) Receiving Federal Financial Aid
k.) Receiving Scholarships
l.) Receiving Loans
m.) If student took Pre-Calculus
n.) Which Calculus I course was taken
o.) Grade in Calculus I
p.) If Calculus I was repeated
q.) Grade in Physics I
r.) If Physics I was repeated
s.) Grade in Physics I Lab
t.) If Physics I Lab was repeated
44
Objective three was accomplished by selecting the most appropriate statistical test based
on the level of measurement of the variable. Those measured on interval were compared using
independent t-tests, and those measured on categorical were compared using the Chi-square test
of independence.
4.) Objective four was to determine if a model existed that could accurately explain the
retention status of the FTIC traditional-age undergraduates who persisted in Engineering for their
third year at a small private university in the southeastern portion of the United States as defined
by their finalizing registration (either payment of fees or setting up a payment plan) to those who
did not persist on the following selected demographic and academic characteristics:
a.) Age
b.) Gender
c.) Race
d.) ACT/SAT Score
e.) Math ACT/SAT Score
f.) Credits carried by the student first semester
g.) Credits earned by the student first semester
h.) GPA at the end of the first semester
i.) On-campus resident
j.) Receiving Federal Financial Aid
k.) Receiving Scholarships
l.) Receiving Loans
m.) If student took Pre-Calculus
n.) Which Calculus I course was taken
o.) Grade in Calculus I
45
p.) If Calculus I was repeated
q.) Grade in Physics I
r.) If Physics I was repeated
s.) Grade in Physics I Lab
t.) If Physics I Lab was repeated
Objective four was accomplished using multiple discriminant analysis with whether or
not the student was enrolled in an Engineering major at the point of their fifth semester and each
of the other variables entered as independent variables in the analysis. Because of the
exploratory nature of the study, stepwise entry of the independent variables was used.
46
Chapter 4: Results
The primary purpose of this study is to determine the influence of selected demographic
and academic characteristics in the decision of first-time-in-college (FTIC) traditional-age
undergraduates who declare engineering as their major at admission to persist in the curriculum
from second to third year at a small private university in the southeastern portion of the United
States. The dependent variable of this study was whether or not the traditional age college
students who chose engineering as their major persisted in this major to their fifth semester as
defined by finalizing their registration with payment of fees or setting up a payment plan.
In collecting the data, the researcher transferred the information from the Office of
Undergraduate Admissions, Student Financial Services, the Registrar, and Academic Services‘
databases for the selected small private university and downloaded it into her computerized
recording form that will serve as the instrument. Permission for the study was received from the
university‘s administration, with permission to access and collect the data. The researcher
gained permission from the Institutional Review Board (IRB) to conduct the study. The
researcher worked closely with Information Technology Services at the university to retrieve the
variables from the selected databases.
The researcher defined traditional-age undergraduates as those who graduated from high
school, applied for admission, and were accepted into the small private university that is located
in the southeastern portion of the United States for the fall 2005 and fall 2006 semesters. This
set of 92 students served as the accessible population for this study, and the sample was defined
as 100% of the accessible population. Out of the 93 students who were selected as the sample
for this study, at fifth semester, 49 persisted in an Engineering major. Of the 43 remaining, 28
left the university and 15 persisted in non-engineering majors. In this chapter, the researcher
presents the results of the study by objective.
47
Objective One Results
1.) To describe FTIC traditional-age, undergraduates who persisted in an Engineering degree
program for their third year at a small private university in the southeastern portion of the United
States as defined by their finalizing registration (either payment of fees or setting up a payment
plan) on the following selected demographic and academic characteristics:
a.) Age
b.) Gender
c.) Race
d.) ACT/SAT score
e.) Math ACT/SAT Score
f.) Credits carried by the student first semester
g.) Credits earned by the student first semester
h.) GPA at the end of the first semester
i.) On-campus resident
j.) Receiving Federal Financial Aid
k.) Receiving Federal Financial Aid
l.) Receiving Scholarships
m.) Receiving Loans
n.) If student took Pre-Calculus
o.) Which Calculus I course was taken
p.) Grade in Calculus I
q.) If Calculus I was repeated
r.) Grade in Physics I
s.) If Physics I was repeated
48
t.) Grade in Physics I Lab
u.) If Physics I Lab was repeated
Forty-nine traditional-age undergraduate students met this criteria, and below are the
results for each of the variables.
Age
The first objective measured was the students‘ age in years at time of entry into the
University. The average age of the students who persisted (n= 49) was 17.86 (SD = .500), with
the youngest student being 17 and the oldest being 19.
Gender
The variable of gender is also used to describe the students who persisted in the
Engineering major to their fifth semester. Of the 49 persisters, 43 (87.8%) were male, and 6
(12.2%) were female.
Race
The next variable used to describe those who persisted in Engineering at a small private
university in the southeastern portion of the United States was their race. Of the 49 persisters,
six students did not identify their ethnic background, their race could not be determined, or the
system did not recognize the background they identified, so of the 43 who identified their Race,
32 (74.4%) were White--non-Hispanic; Asians were 14.0% of the sample, n= 6; Blacks made up
7.0%, n= 3; the 2 Hispanic students composed 4.6% of the sample (See Table 1).
Composite ACT/SAT Score
To be considered for admission in the small private university in the southeastern portion
of the United States, all applicants must submit a college entrance exam score. Both the ACT
and SAT are used for admissions purposes, awarding financial aid, and course placement. Most
students submit an ACT score, and so for this study, if an SAT score was submitted, it was
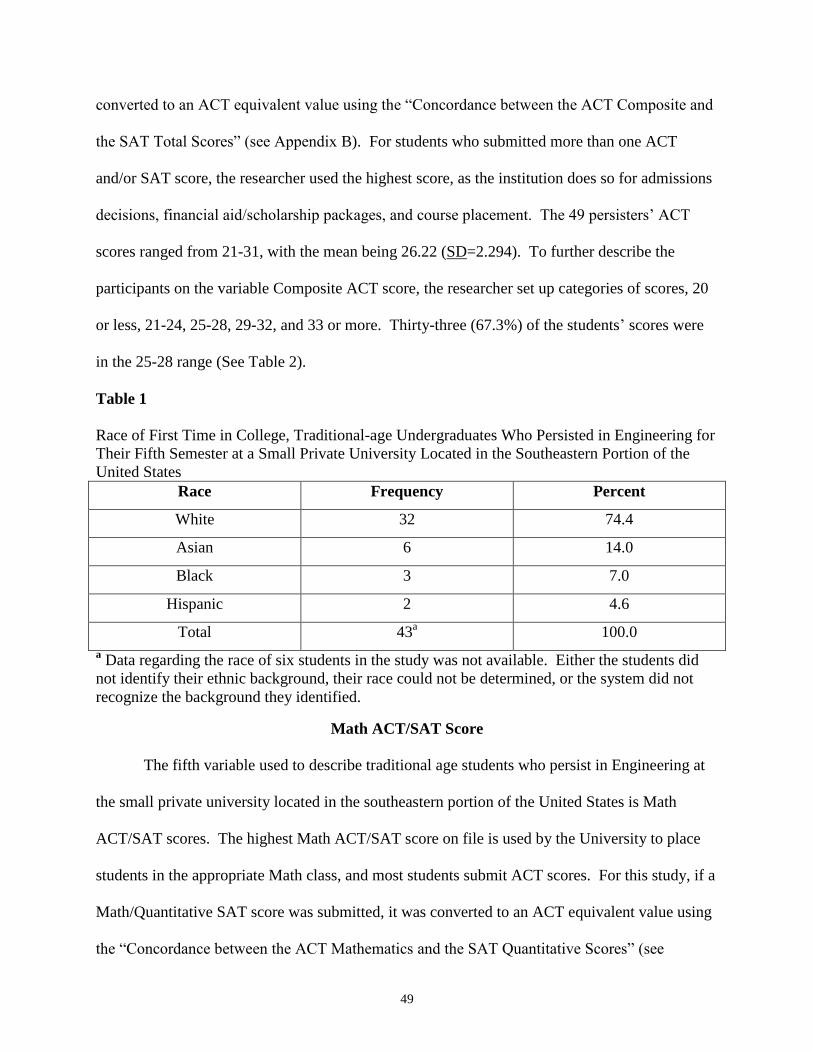
49
converted to an ACT equivalent value using the ―Concordance between the ACT Composite and
the SAT Total Scores‖ (see Appendix B). For students who submitted more than one ACT
and/or SAT score, the researcher used the highest score, as the institution does so for admissions
decisions, financial aid/scholarship packages, and course placement. The 49 persisters‘ ACT
scores ranged from 21-31, with the mean being 26.22 (SD=2.294). To further describe the
participants on the variable Composite ACT score, the researcher set up categories of scores, 20
or less, 21-24, 25-28, 29-32, and 33 or more. Thirty-three (67.3%) of the students‘ scores were
in the 25-28 range (See Table 2).
Table 1
Race of First Time in College, Traditional-age Undergraduates Who Persisted in Engineering for
Their Fifth Semester at a Small Private University Located in the Southeastern Portion of the
United States
Race Frequency Percent
White 32 74.4
Asian 6 14.0
Black 3 7.0
Hispanic 2 4.6
Total 43a
100.0
a Data regarding the race of six students in the study was not available. Either the students did
not identify their ethnic background, their race could not be determined, or the system did not
recognize the background they identified.
Math ACT/SAT Score
The fifth variable used to describe traditional age students who persist in Engineering at
the small private university located in the southeastern portion of the United States is Math
ACT/SAT scores. The highest Math ACT/SAT score on file is used by the University to place
students in the appropriate Math class, and most students submit ACT scores. For this study, if a
Math/Quantitative SAT score was submitted, it was converted to an ACT equivalent value using
the ―Concordance between the ACT Mathematics and the SAT Quantitative Scores‖ (see
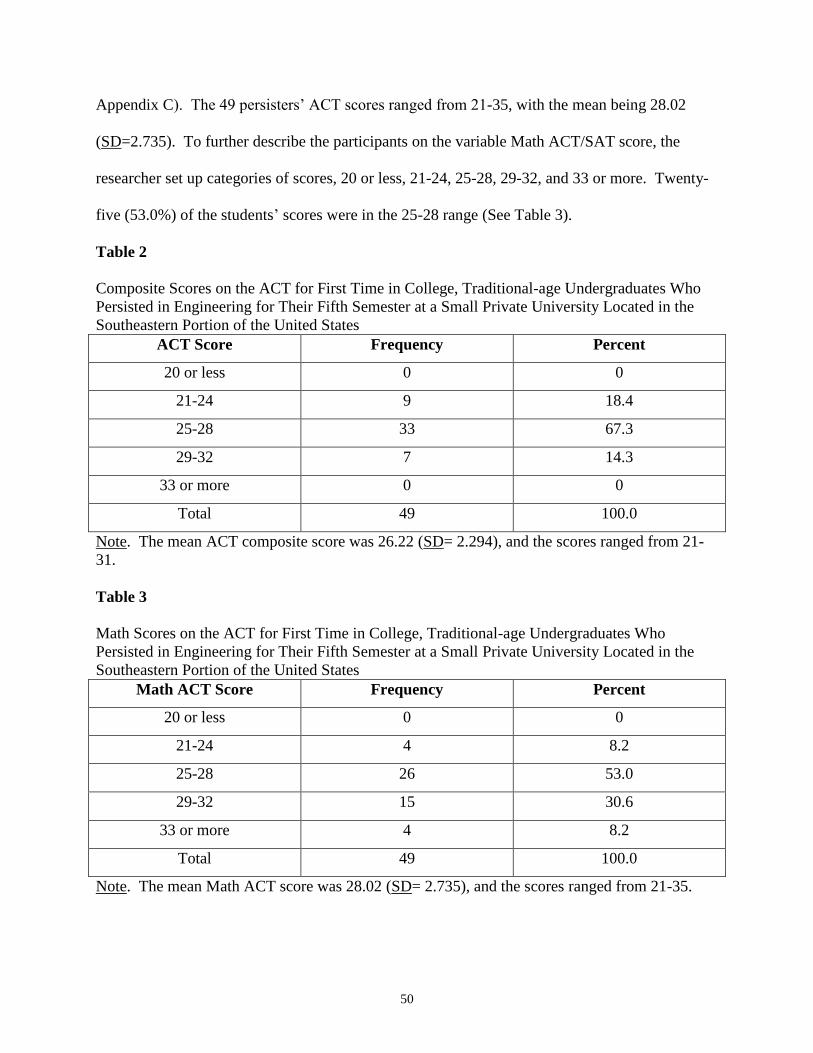
50
Appendix C). The 49 persisters‘ ACT scores ranged from 21-35, with the mean being 28.02
(SD=2.735). To further describe the participants on the variable Math ACT/SAT score, the
researcher set up categories of scores, 20 or less, 21-24, 25-28, 29-32, and 33 or more. Twenty-
five (53.0%) of the students‘ scores were in the 25-28 range (See Table 3).
Table 2
Composite Scores on the ACT for First Time in College, Traditional-age Undergraduates Who
Persisted in Engineering for Their Fifth Semester at a Small Private University Located in the
Southeastern Portion of the United States
ACT Score Frequency Percent
20 or less 0 0
21-24 9 18.4
25-28 33 67.3
29-32 7 14.3
33 or more 0 0
Total 49 100.0
Note. The mean ACT composite score was 26.22 (SD= 2.294), and the scores ranged from 21-
31.
Table 3
Math Scores on the ACT for First Time in College, Traditional-age Undergraduates Who
Persisted in Engineering for Their Fifth Semester at a Small Private University Located in the
Southeastern Portion of the United States
Math ACT Score Frequency Percent
20 or less 0 0
21-24 4 8.2
25-28 26 53.0
29-32 15 30.6
33 or more 4 8.2
Total 49 100.0
Note. The mean Math ACT score was 28.02 (SD= 2.735), and the scores ranged from 21-35.
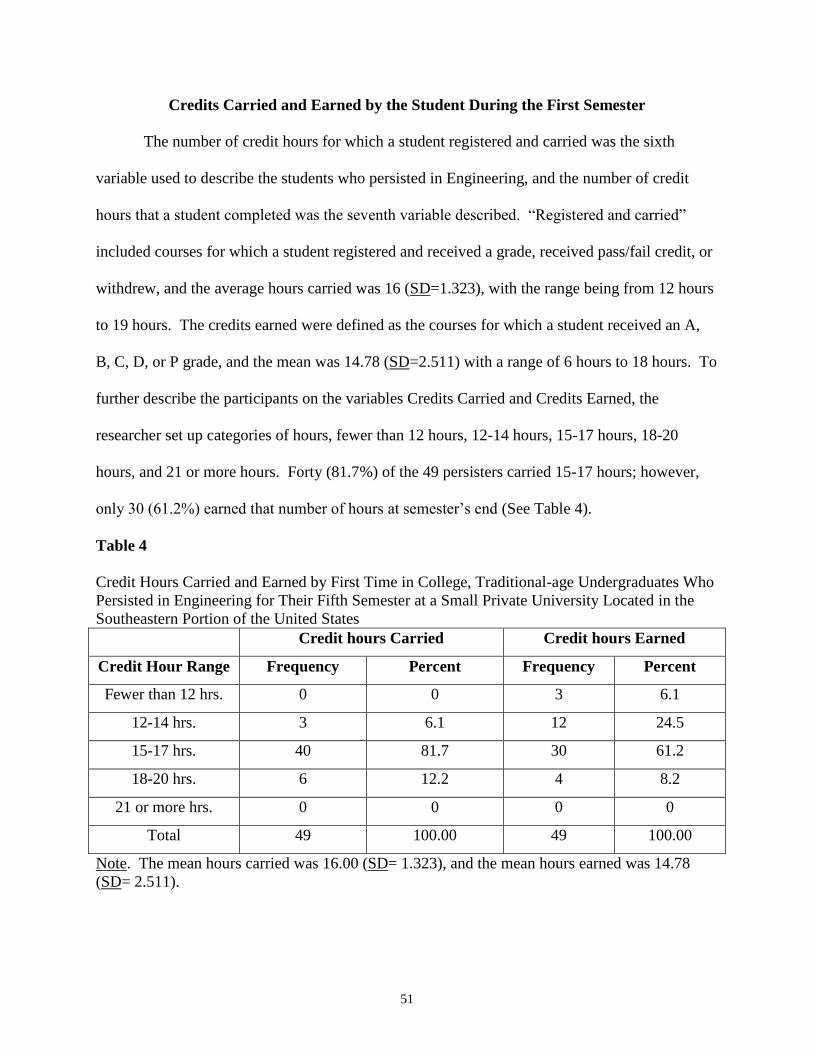
51
Credits Carried and Earned by the Student During the First Semester
The number of credit hours for which a student registered and carried was the sixth
variable used to describe the students who persisted in Engineering, and the number of credit
hours that a student completed was the seventh variable described. ―Registered and carried‖
included courses for which a student registered and received a grade, received pass/fail credit, or
withdrew, and the average hours carried was 16 (SD=1.323), with the range being from 12 hours
to 19 hours. The credits earned were defined as the courses for which a student received an A,
B, C, D, or P grade, and the mean was 14.78 (SD=2.511) with a range of 6 hours to 18 hours. To
further describe the participants on the variables Credits Carried and Credits Earned, the
researcher set up categories of hours, fewer than 12 hours, 12-14 hours, 15-17 hours, 18-20
hours, and 21 or more hours. Forty (81.7%) of the 49 persisters carried 15-17 hours; however,
only 30 (61.2%) earned that number of hours at semester‘s end (See Table 4).
Table 4
Credit Hours Carried and Earned by First Time in College, Traditional-age Undergraduates Who
Persisted in Engineering for Their Fifth Semester at a Small Private University Located in the
Southeastern Portion of the United States
Credit hours Carried Credit hours Earned
Credit Hour Range Frequency Percent Frequency Percent
Fewer than 12 hrs. 0 0 3 6.1
12-14 hrs. 3 6.1 12 24.5
15-17 hrs. 40 81.7 30 61.2
18-20 hrs. 6 12.2 4 8.2
21 or more hrs. 0 0 0 0
Total 49 100.00 49 100.00
Note. The mean hours carried was 16.00 (SD= 1.323), and the mean hours earned was 14.78
(SD= 2.511).
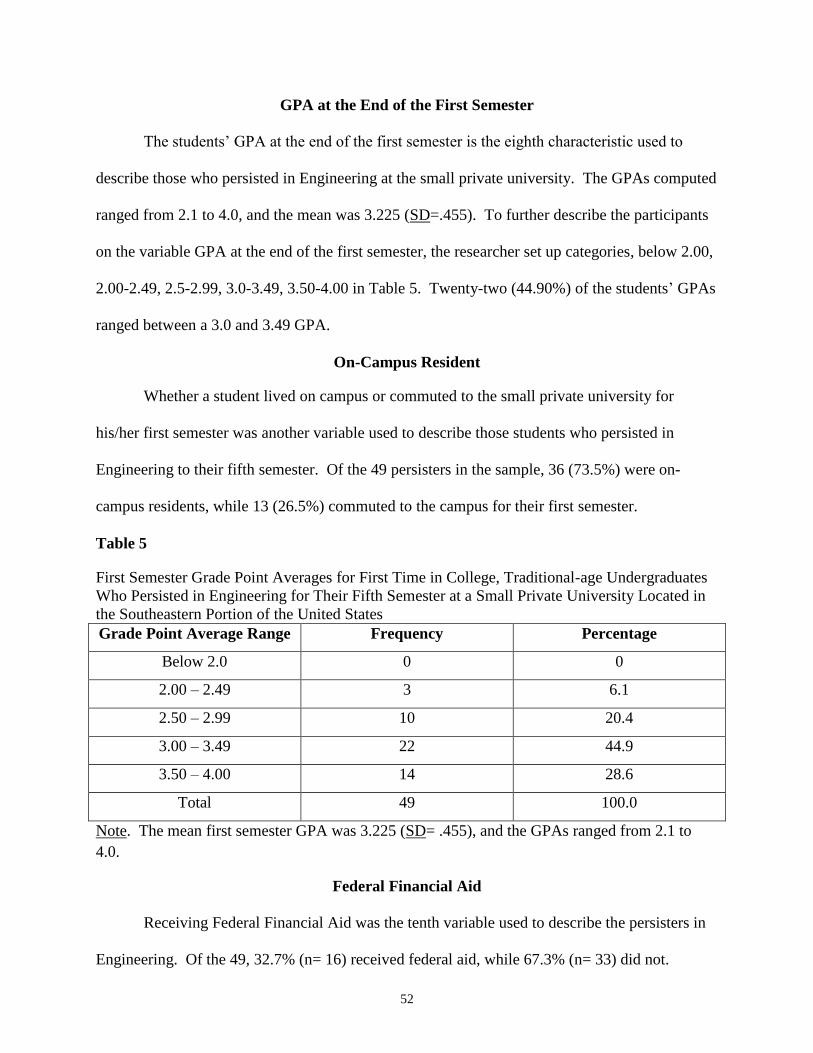
52
GPA at the End of the First Semester
The students‘ GPA at the end of the first semester is the eighth characteristic used to
describe those who persisted in Engineering at the small private university. The GPAs computed
ranged from 2.1 to 4.0, and the mean was 3.225 (SD=.455). To further describe the participants
on the variable GPA at the end of the first semester, the researcher set up categories, below 2.00,
2.00-2.49, 2.5-2.99, 3.0-3.49, 3.50-4.00 in Table 5. Twenty-two (44.90%) of the students‘ GPAs
ranged between a 3.0 and 3.49 GPA.
On-Campus Resident
Whether a student lived on campus or commuted to the small private university for
his/her first semester was another variable used to describe those students who persisted in
Engineering to their fifth semester. Of the 49 persisters in the sample, 36 (73.5%) were on-
campus residents, while 13 (26.5%) commuted to the campus for their first semester.
Table 5
First Semester Grade Point Averages for First Time in College, Traditional-age Undergraduates
Who Persisted in Engineering for Their Fifth Semester at a Small Private University Located in
the Southeastern Portion of the United States
Grade Point Average Range Frequency Percentage
Below 2.0 0 0
2.00 – 2.49 3 6.1
2.50 – 2.99 10 20.4
3.00 – 3.49 22 44.9
3.50 – 4.00 14 28.6
Total 49 100.0
Note. The mean first semester GPA was 3.225 (SD= .455), and the GPAs ranged from 2.1 to
4.0.
Federal Financial Aid
Receiving Federal Financial Aid was the tenth variable used to describe the persisters in
Engineering. Of the 49, 32.7% (n= 16) received federal aid, while 67.3% (n= 33) did not.
53
Federal Financial Aid is defined as pell grants, supplemental education opportunity grants,
academic competitive grants, smart grants, vocational rehabilitation grants, work study, and
veterans benefits.
Scholarships
The next characteristic used to describe the 49 students who persisted in Engineering is
whether or not scholarships were received. Scholarships are defined as academic scholarships,
based on a student‘s ACT/SAT and GPA; the state lottery scholarship, awarded to residents who
have at least a 3.0 high school GPA or a 21 on the ACT; departmental scholarships (The School
of Engineering awards $2000/year to Engineering majors who scored a minimum 23 on the ACT
or 1070 on the SAT); and various other awards. One hundred percent of the persisters received
at least one scholarship.
Loans
If a student received a loan is the 12th
characteristic used to describe the students who
persisted in their major at a small private university in the southeastern portion of the United
States. Loans are defined as federal Perkins loans, federal Stafford loans, federal unsubsidized
Stafford Loans, federal PLUS loans, and alternative education loans through private lenders. Of
those who persisted, 49% (n=24) did receive loans, and 51% (n=25) did not.
Pre-Calculus
The next variable used in describing those who persisted to their fifth semester is whether
or not a student took a Pre-Calculus course. Sixteen students (32.7%) did take Pre-Calculus,
while 33 (67.3%) did not.
Calculus I Course Taken
Which Calculus I course a student took is the 14th
variable used to describe the persisters
in Engineering at the small private university located in the southeastern portion of the United
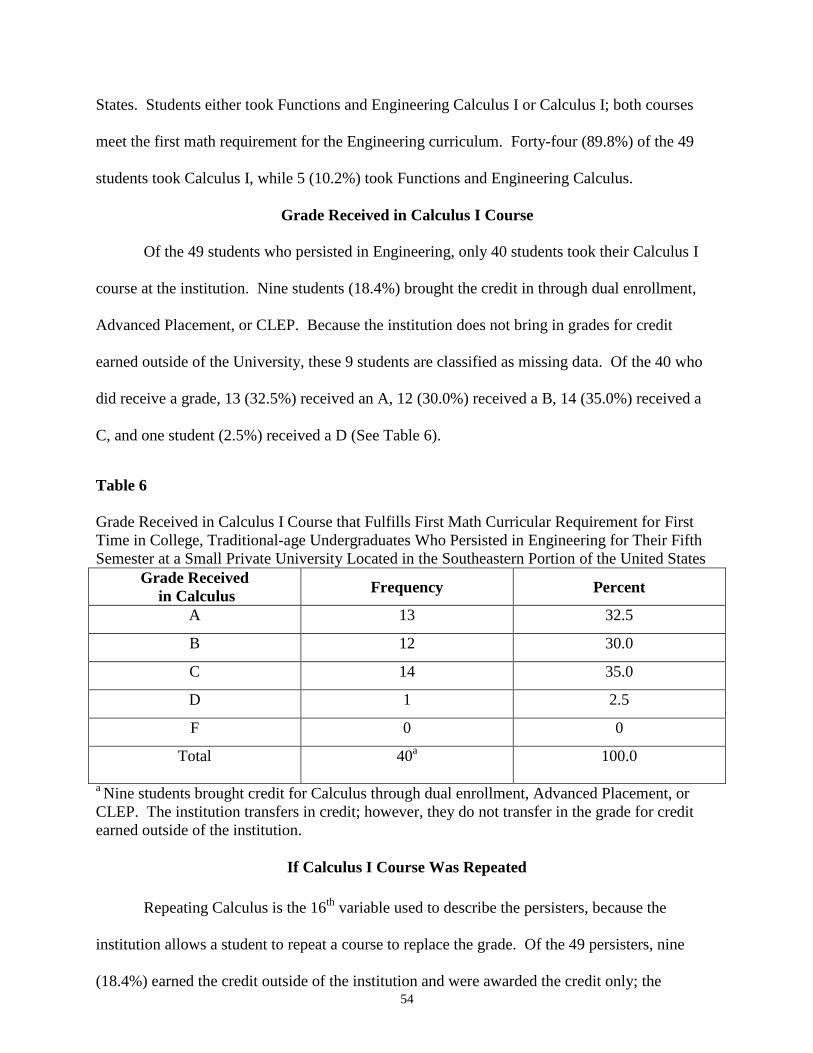
54
States. Students either took Functions and Engineering Calculus I or Calculus I; both courses
meet the first math requirement for the Engineering curriculum. Forty-four (89.8%) of the 49
students took Calculus I, while 5 (10.2%) took Functions and Engineering Calculus.
Grade Received in Calculus I Course
Of the 49 students who persisted in Engineering, only 40 students took their Calculus I
course at the institution. Nine students (18.4%) brought the credit in through dual enrollment,
Advanced Placement, or CLEP. Because the institution does not bring in grades for credit
earned outside of the University, these 9 students are classified as missing data. Of the 40 who
did receive a grade, 13 (32.5%) received an A, 12 (30.0%) received a B, 14 (35.0%) received a
C, and one student (2.5%) received a D (See Table 6).
Table 6
Grade Received in Calculus I Course that Fulfills First Math Curricular Requirement for First
Time in College, Traditional-age Undergraduates Who Persisted in Engineering for Their Fifth
Semester at a Small Private University Located in the Southeastern Portion of the United States
Grade Received
in Calculus Frequency Percent
A 13 32.5
B 12 30.0
C 14 35.0
D 1 2.5
F 0 0
Total 40a
100.0
a Nine students brought credit for Calculus through dual enrollment, Advanced Placement, or
CLEP. The institution transfers in credit; however, they do not transfer in the grade for credit
earned outside of the institution.
If Calculus I Course Was Repeated
Repeating Calculus is the 16th
variable used to describe the persisters, because the
institution allows a student to repeat a course to replace the grade. Of the 49 persisters, nine
(18.4%) earned the credit outside of the institution and were awarded the credit only; the
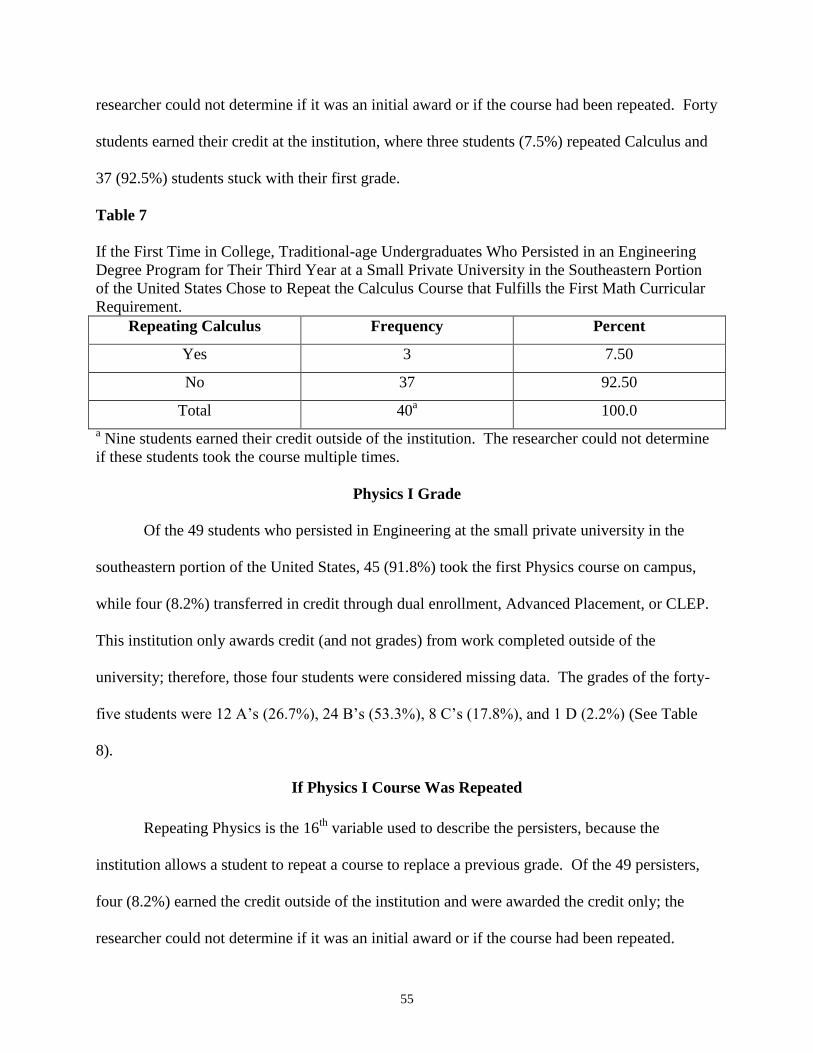
55
researcher could not determine if it was an initial award or if the course had been repeated. Forty
students earned their credit at the institution, where three students (7.5%) repeated Calculus and
37 (92.5%) students stuck with their first grade.
Table 7
If the First Time in College, Traditional-age Undergraduates Who Persisted in an Engineering
Degree Program for Their Third Year at a Small Private University in the Southeastern Portion
of the United States Chose to Repeat the Calculus Course that Fulfills the First Math Curricular
Requirement.
Repeating Calculus Frequency Percent
Yes 3 7.50
No 37 92.50
Total 40a
100.0
a Nine students earned their credit outside of the institution. The researcher could not determine
if these students took the course multiple times.
Physics I Grade
Of the 49 students who persisted in Engineering at the small private university in the
southeastern portion of the United States, 45 (91.8%) took the first Physics course on campus,
while four (8.2%) transferred in credit through dual enrollment, Advanced Placement, or CLEP.
This institution only awards credit (and not grades) from work completed outside of the
university; therefore, those four students were considered missing data. The grades of the forty-
five students were 12 A‘s (26.7%), 24 B‘s (53.3%), 8 C‘s (17.8%), and 1 D (2.2%) (See Table
8).
If Physics I Course Was Repeated
Repeating Physics is the 16th
variable used to describe the persisters, because the
institution allows a student to repeat a course to replace a previous grade. Of the 49 persisters,
four (8.2%) earned the credit outside of the institution and were awarded the credit only; the
researcher could not determine if it was an initial award or if the course had been repeated.
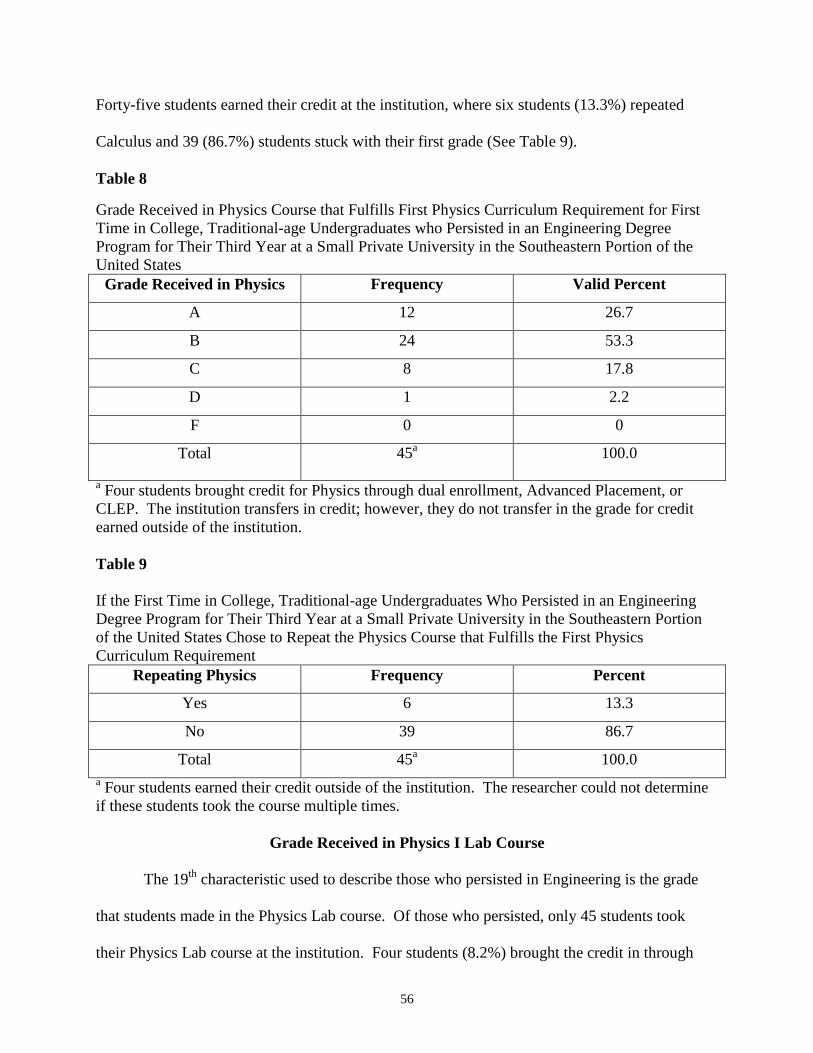
56
Forty-five students earned their credit at the institution, where six students (13.3%) repeated
Calculus and 39 (86.7%) students stuck with their first grade (See Table 9).
Table 8
Grade Received in Physics Course that Fulfills First Physics Curriculum Requirement for First
Time in College, Traditional-age Undergraduates who Persisted in an Engineering Degree
Program for Their Third Year at a Small Private University in the Southeastern Portion of the
United States
Grade Received in Physics Frequency Valid Percent
A 12 26.7
B 24 53.3
C 8 17.8
D 1 2.2
F 0 0
Total 45a
100.0
a Four students brought credit for Physics through dual enrollment, Advanced Placement, or
CLEP. The institution transfers in credit; however, they do not transfer in the grade for credit
earned outside of the institution.
Table 9
If the First Time in College, Traditional-age Undergraduates Who Persisted in an Engineering
Degree Program for Their Third Year at a Small Private University in the Southeastern Portion
of the United States Chose to Repeat the Physics Course that Fulfills the First Physics
Curriculum Requirement
Repeating Physics Frequency Percent
Yes 6 13.3
No 39 86.7
Total 45a
100.0
a Four students earned their credit outside of the institution. The researcher could not determine
if these students took the course multiple times.
Grade Received in Physics I Lab Course
The 19th
characteristic used to describe those who persisted in Engineering is the grade
that students made in the Physics Lab course. Of those who persisted, only 45 students took
their Physics Lab course at the institution. Four students (8.2%) brought the credit in through
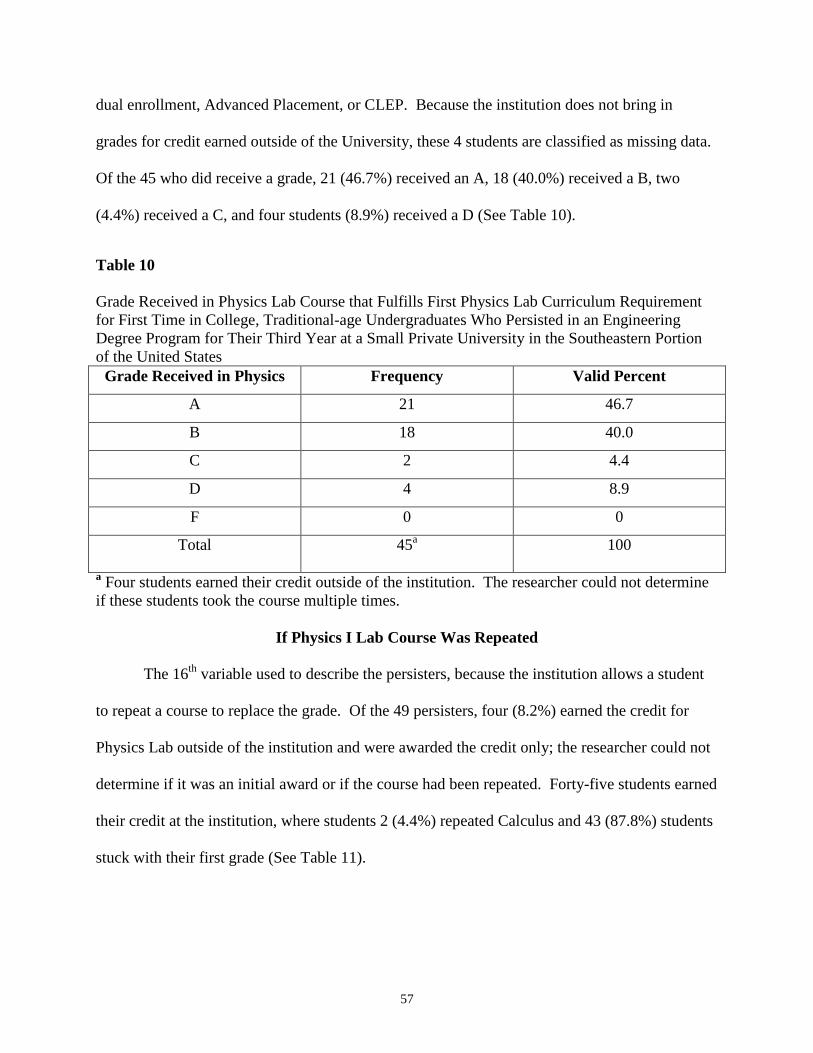
57
dual enrollment, Advanced Placement, or CLEP. Because the institution does not bring in
grades for credit earned outside of the University, these 4 students are classified as missing data.
Of the 45 who did receive a grade, 21 (46.7%) received an A, 18 (40.0%) received a B, two
(4.4%) received a C, and four students (8.9%) received a D (See Table 10).
Table 10
Grade Received in Physics Lab Course that Fulfills First Physics Lab Curriculum Requirement
for First Time in College, Traditional-age Undergraduates Who Persisted in an Engineering
Degree Program for Their Third Year at a Small Private University in the Southeastern Portion
of the United States
Grade Received in Physics Frequency Valid Percent
A 21 46.7
B 18 40.0
C 2 4.4
D 4 8.9
F 0 0
Total 45a
100
a Four students earned their credit outside of the institution. The researcher could not determine
if these students took the course multiple times.
If Physics I Lab Course Was Repeated
The 16th
variable used to describe the persisters, because the institution allows a student
to repeat a course to replace the grade. Of the 49 persisters, four (8.2%) earned the credit for
Physics Lab outside of the institution and were awarded the credit only; the researcher could not
determine if it was an initial award or if the course had been repeated. Forty-five students earned
their credit at the institution, where students 2 (4.4%) repeated Calculus and 43 (87.8%) students
stuck with their first grade (See Table 11).
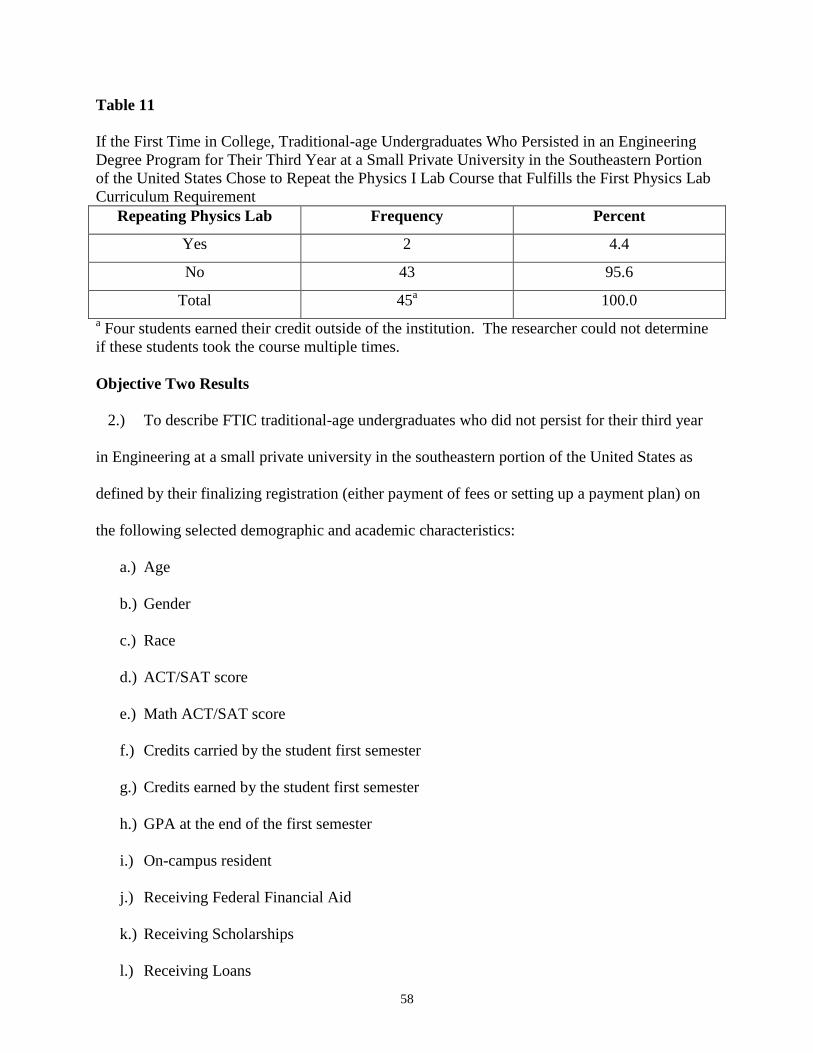
58
Table 11
If the First Time in College, Traditional-age Undergraduates Who Persisted in an Engineering
Degree Program for Their Third Year at a Small Private University in the Southeastern Portion
of the United States Chose to Repeat the Physics I Lab Course that Fulfills the First Physics Lab
Curriculum Requirement
Repeating Physics Lab Frequency Percent
Yes 2 4.4
No 43 95.6
Total 45a
100.0
a Four students earned their credit outside of the institution. The researcher could not determine
if these students took the course multiple times.
Objective Two Results
2.) To describe FTIC traditional-age undergraduates who did not persist for their third year
in Engineering at a small private university in the southeastern portion of the United States as
defined by their finalizing registration (either payment of fees or setting up a payment plan) on
the following selected demographic and academic characteristics:
a.) Age
b.) Gender
c.) Race
d.) ACT/SAT score
e.) Math ACT/SAT score
f.) Credits carried by the student first semester
g.) Credits earned by the student first semester
h.) GPA at the end of the first semester
i.) On-campus resident
j.) Receiving Federal Financial Aid
k.) Receiving Scholarships
l.) Receiving Loans
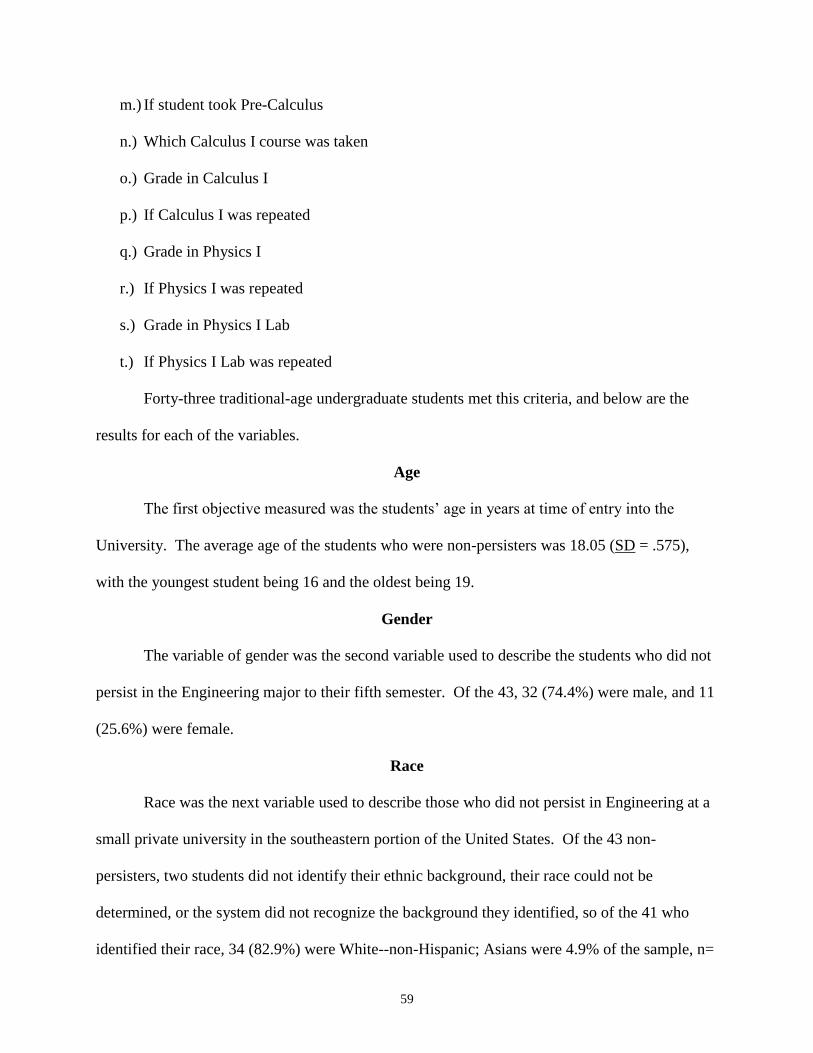
59
m.) If student took Pre-Calculus
n.) Which Calculus I course was taken
o.) Grade in Calculus I
p.) If Calculus I was repeated
q.) Grade in Physics I
r.) If Physics I was repeated
s.) Grade in Physics I Lab
t.) If Physics I Lab was repeated
Forty-three traditional-age undergraduate students met this criteria, and below are the
results for each of the variables.
Age
The first objective measured was the students‘ age in years at time of entry into the
University. The average age of the students who were non-persisters was 18.05 (SD = .575),
with the youngest student being 16 and the oldest being 19.
Gender
The variable of gender was the second variable used to describe the students who did not
persist in the Engineering major to their fifth semester. Of the 43, 32 (74.4%) were male, and 11
(25.6%) were female.
Race
Race was the next variable used to describe those who did not persist in Engineering at a
small private university in the southeastern portion of the United States. Of the 43 non-
persisters, two students did not identify their ethnic background, their race could not be
determined, or the system did not recognize the background they identified, so of the 41 who
identified their race, 34 (82.9%) were White--non-Hispanic; Asians were 4.9% of the sample, n=
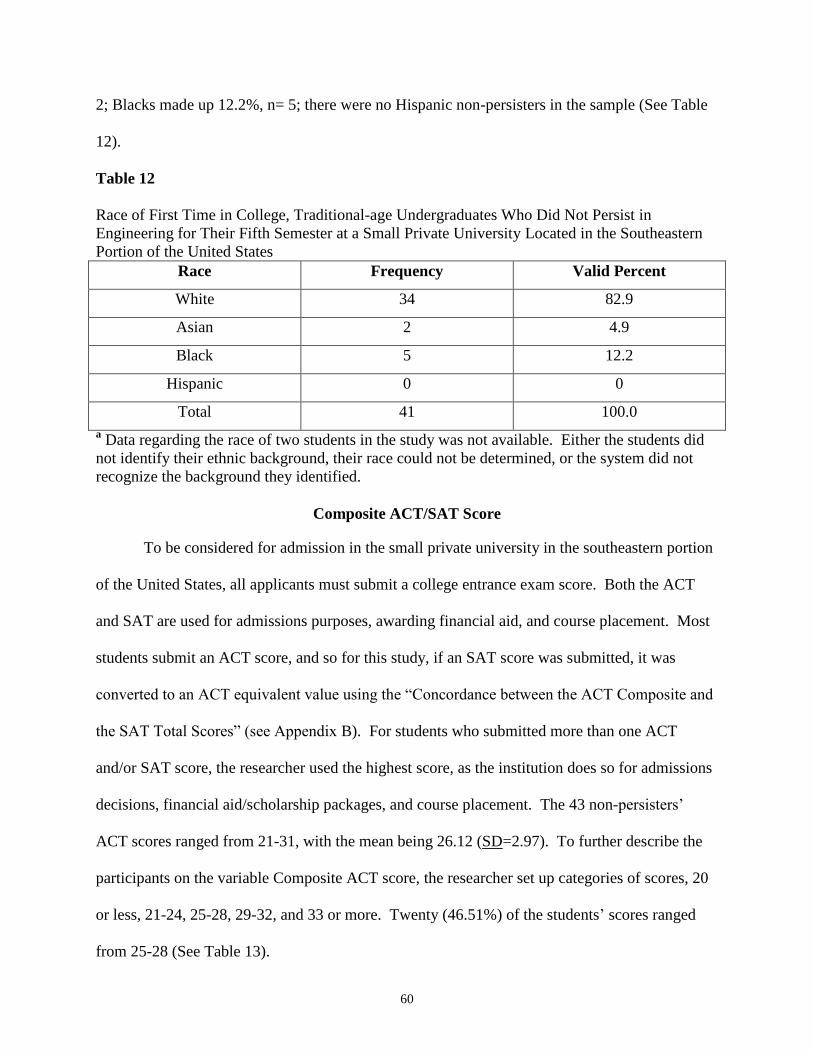
60
2; Blacks made up 12.2%, n= 5; there were no Hispanic non-persisters in the sample (See Table
12).
Table 12
Race of First Time in College, Traditional-age Undergraduates Who Did Not Persist in
Engineering for Their Fifth Semester at a Small Private University Located in the Southeastern
Portion of the United States
Race Frequency Valid Percent
White 34 82.9
Asian 2 4.9
Black 5 12.2
Hispanic 0 0
Total 41 100.0
a Data regarding the race of two students in the study was not available. Either the students did
not identify their ethnic background, their race could not be determined, or the system did not
recognize the background they identified.
Composite ACT/SAT Score
To be considered for admission in the small private university in the southeastern portion
of the United States, all applicants must submit a college entrance exam score. Both the ACT
and SAT are used for admissions purposes, awarding financial aid, and course placement. Most
students submit an ACT score, and so for this study, if an SAT score was submitted, it was
converted to an ACT equivalent value using the ―Concordance between the ACT Composite and
the SAT Total Scores‖ (see Appendix B). For students who submitted more than one ACT
and/or SAT score, the researcher used the highest score, as the institution does so for admissions
decisions, financial aid/scholarship packages, and course placement. The 43 non-persisters‘
ACT scores ranged from 21-31, with the mean being 26.12 (SD=2.97). To further describe the
participants on the variable Composite ACT score, the researcher set up categories of scores, 20
or less, 21-24, 25-28, 29-32, and 33 or more. Twenty (46.51%) of the students‘ scores ranged
from 25-28 (See Table 13).
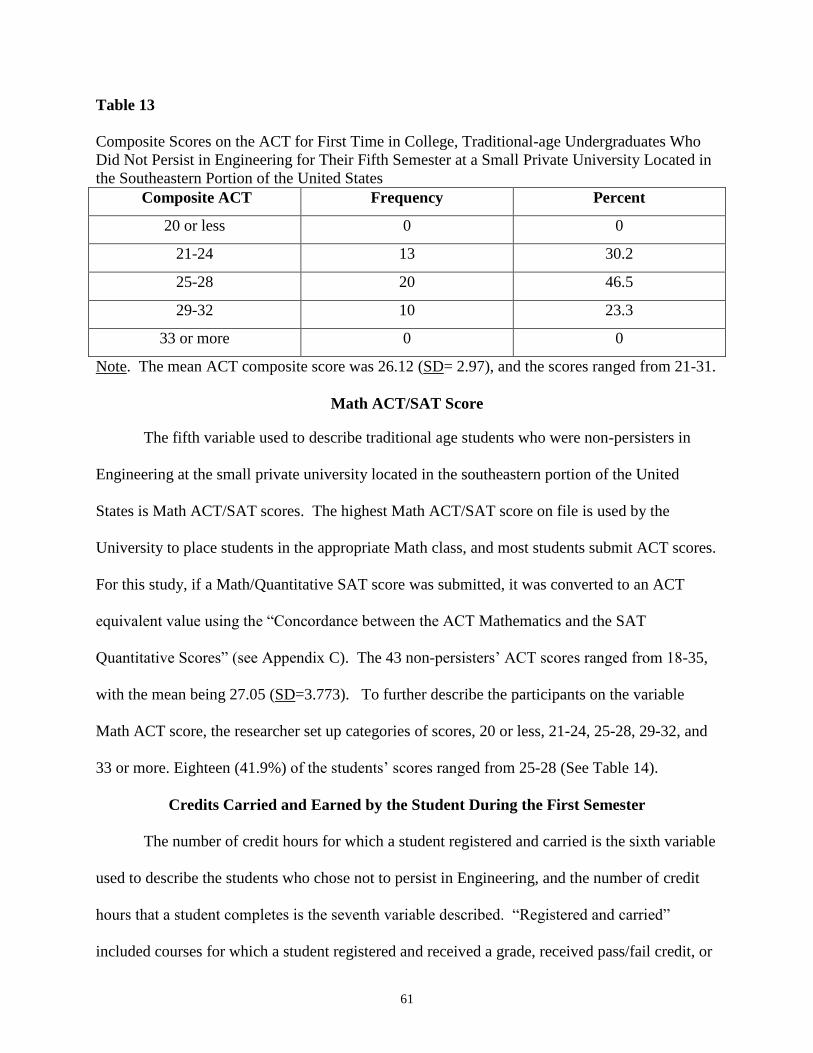
61
Table 13
Composite Scores on the ACT for First Time in College, Traditional-age Undergraduates Who
Did Not Persist in Engineering for Their Fifth Semester at a Small Private University Located in
the Southeastern Portion of the United States
Composite ACT Frequency Percent
20 or less 0 0
21-24 13 30.2
25-28 20 46.5
29-32 10 23.3
33 or more 0 0
Note. The mean ACT composite score was 26.12 (SD= 2.97), and the scores ranged from 21-31.
Math ACT/SAT Score
The fifth variable used to describe traditional age students who were non-persisters in
Engineering at the small private university located in the southeastern portion of the United
States is Math ACT/SAT scores. The highest Math ACT/SAT score on file is used by the
University to place students in the appropriate Math class, and most students submit ACT scores.
For this study, if a Math/Quantitative SAT score was submitted, it was converted to an ACT
equivalent value using the ―Concordance between the ACT Mathematics and the SAT
Quantitative Scores‖ (see Appendix C). The 43 non-persisters‘ ACT scores ranged from 18-35,
with the mean being 27.05 (SD=3.773). To further describe the participants on the variable
Math ACT score, the researcher set up categories of scores, 20 or less, 21-24, 25-28, 29-32, and
33 or more. Eighteen (41.9%) of the students‘ scores ranged from 25-28 (See Table 14).
Credits Carried and Earned by the Student During the First Semester
The number of credit hours for which a student registered and carried is the sixth variable
used to describe the students who chose not to persist in Engineering, and the number of credit
hours that a student completes is the seventh variable described. ―Registered and carried‖
included courses for which a student registered and received a grade, received pass/fail credit, or
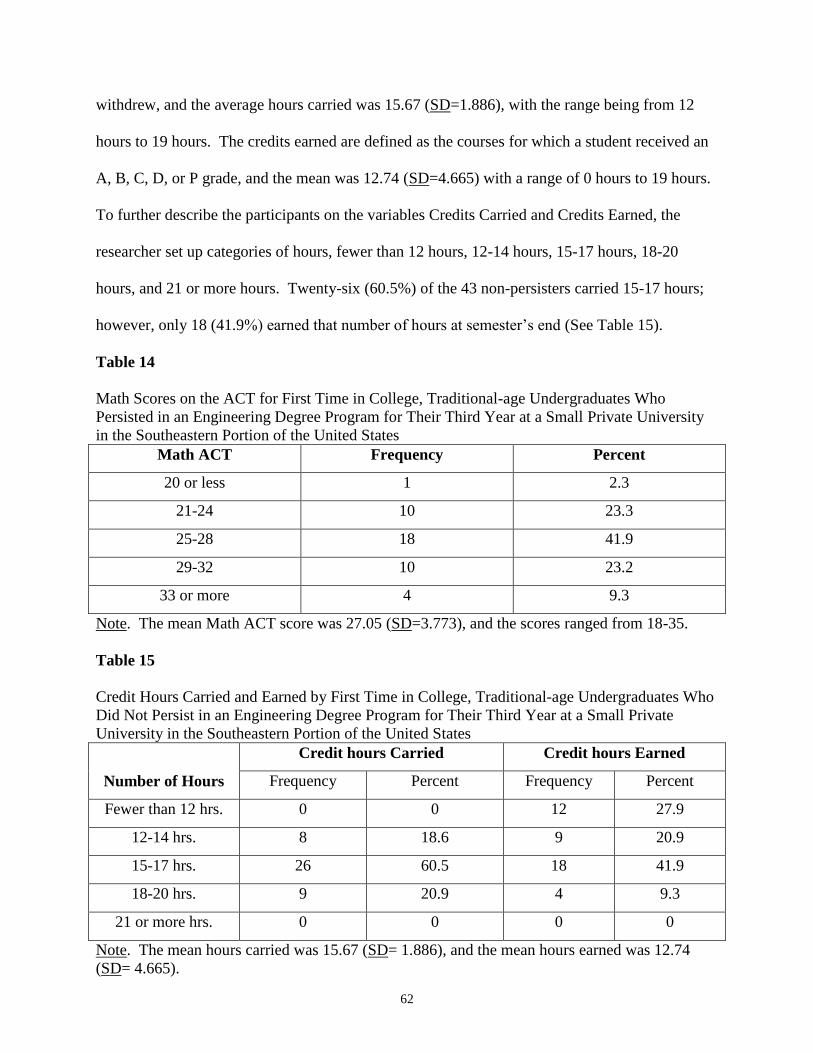
62
withdrew, and the average hours carried was 15.67 (SD=1.886), with the range being from 12
hours to 19 hours. The credits earned are defined as the courses for which a student received an
A, B, C, D, or P grade, and the mean was 12.74 (SD=4.665) with a range of 0 hours to 19 hours.
To further describe the participants on the variables Credits Carried and Credits Earned, the
researcher set up categories of hours, fewer than 12 hours, 12-14 hours, 15-17 hours, 18-20
hours, and 21 or more hours. Twenty-six (60.5%) of the 43 non-persisters carried 15-17 hours;
however, only 18 (41.9%) earned that number of hours at semester‘s end (See Table 15).
Table 14
Math Scores on the ACT for First Time in College, Traditional-age Undergraduates Who
Persisted in an Engineering Degree Program for Their Third Year at a Small Private University
in the Southeastern Portion of the United States
Math ACT Frequency Percent
20 or less 1 2.3
21-24 10 23.3
25-28 18 41.9
29-32 10 23.2
33 or more 4 9.3
Note. The mean Math ACT score was 27.05 (SD=3.773), and the scores ranged from 18-35.
Table 15
Credit Hours Carried and Earned by First Time in College, Traditional-age Undergraduates Who
Did Not Persist in an Engineering Degree Program for Their Third Year at a Small Private
University in the Southeastern Portion of the United States
Number of Hours
Credit hours Carried Credit hours Earned
Frequency Percent Frequency Percent
Fewer than 12 hrs. 0 0 12 27.9
12-14 hrs. 8 18.6 9 20.9
15-17 hrs. 26 60.5 18 41.9
18-20 hrs. 9 20.9 4 9.3
21 or more hrs. 0 0 0 0
Note. The mean hours carried was 15.67 (SD= 1.886), and the mean hours earned was 12.74
(SD= 4.665).
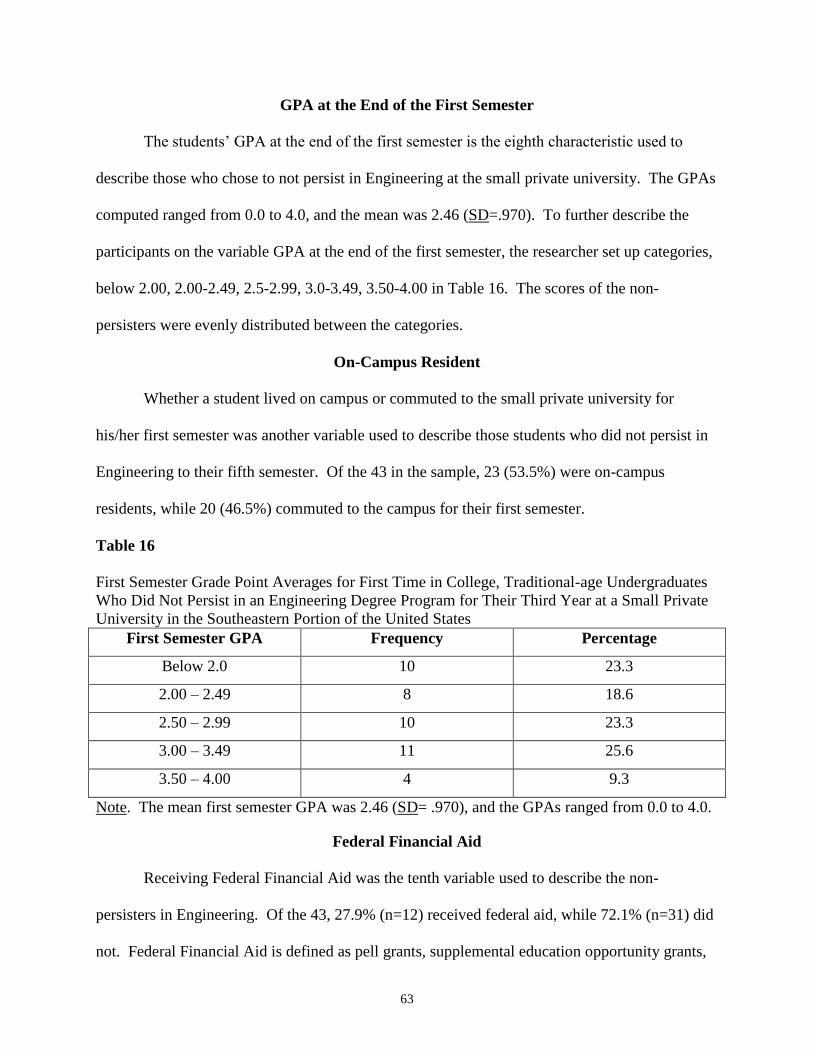
63
GPA at the End of the First Semester
The students‘ GPA at the end of the first semester is the eighth characteristic used to
describe those who chose to not persist in Engineering at the small private university. The GPAs
computed ranged from 0.0 to 4.0, and the mean was 2.46 (SD=.970). To further describe the
participants on the variable GPA at the end of the first semester, the researcher set up categories,
below 2.00, 2.00-2.49, 2.5-2.99, 3.0-3.49, 3.50-4.00 in Table 16. The scores of the non-
persisters were evenly distributed between the categories.
On-Campus Resident
Whether a student lived on campus or commuted to the small private university for
his/her first semester was another variable used to describe those students who did not persist in
Engineering to their fifth semester. Of the 43 in the sample, 23 (53.5%) were on-campus
residents, while 20 (46.5%) commuted to the campus for their first semester.
Table 16
First Semester Grade Point Averages for First Time in College, Traditional-age Undergraduates
Who Did Not Persist in an Engineering Degree Program for Their Third Year at a Small Private
University in the Southeastern Portion of the United States
First Semester GPA Frequency Percentage
Below 2.0 10 23.3
2.00 – 2.49 8 18.6
2.50 – 2.99 10 23.3
3.00 – 3.49 11 25.6
3.50 – 4.00 4 9.3
Note. The mean first semester GPA was 2.46 (SD= .970), and the GPAs ranged from 0.0 to 4.0.
Federal Financial Aid
Receiving Federal Financial Aid was the tenth variable used to describe the non-
persisters in Engineering. Of the 43, 27.9% (n=12) received federal aid, while 72.1% (n=31) did
not. Federal Financial Aid is defined as pell grants, supplemental education opportunity grants,
64
academic competitive grants, smart grants, vocational rehabilitation grants, work study, and
veterans benefits.
Scholarships
The next characteristic used to describe the 43 students who did not persist in
Engineering is whether or not scholarships were received. Scholarships are defined as academic
scholarships, based on a student‘s ACT/SAT and GPA; the state lottery scholarship, awarded to
residents who have at least a 3.0 high school GPA or a 21 on the ACT; departmental scholarships
(The School of Engineering awards $2000/year to Engineering majors who scored a minimum
23 on the ACT or 1070 on the SAT); and various other awards. One hundred percent of the non-
persisters received at least one scholarship.
Loans
If a student received a loan is the 12th
characteristic used to describe the students who did
not persist in their major at a small private university in the southeastern portion of the United
States. Loans are defined as federal Perkins loans, federal Stafford loans, federal unsubsidized
Stafford Loans, federal PLUS loans, and alternative education loans through private lenders. Of
those who did not persist, 60.5% (n=26) did receive loans, and 39.5% (n=17) did not.
Pre-Calculus
The next variable used in describing those who were non-persisters to their fifth semester
is whether or not a student took a Pre-Calculus course. Thirteen students (30.2%) did take Pre-
Calculus, while 30 (69.8%) did not.
Calculus I Course Taken
Which Calculus I course a student took is the 14th
variable used to describe the non-
persisters in Engineering at the small private university located in the southeastern portion of the
United States. Of the 43 non-persisters, 35 (81.4%) took either Functions and Engineering
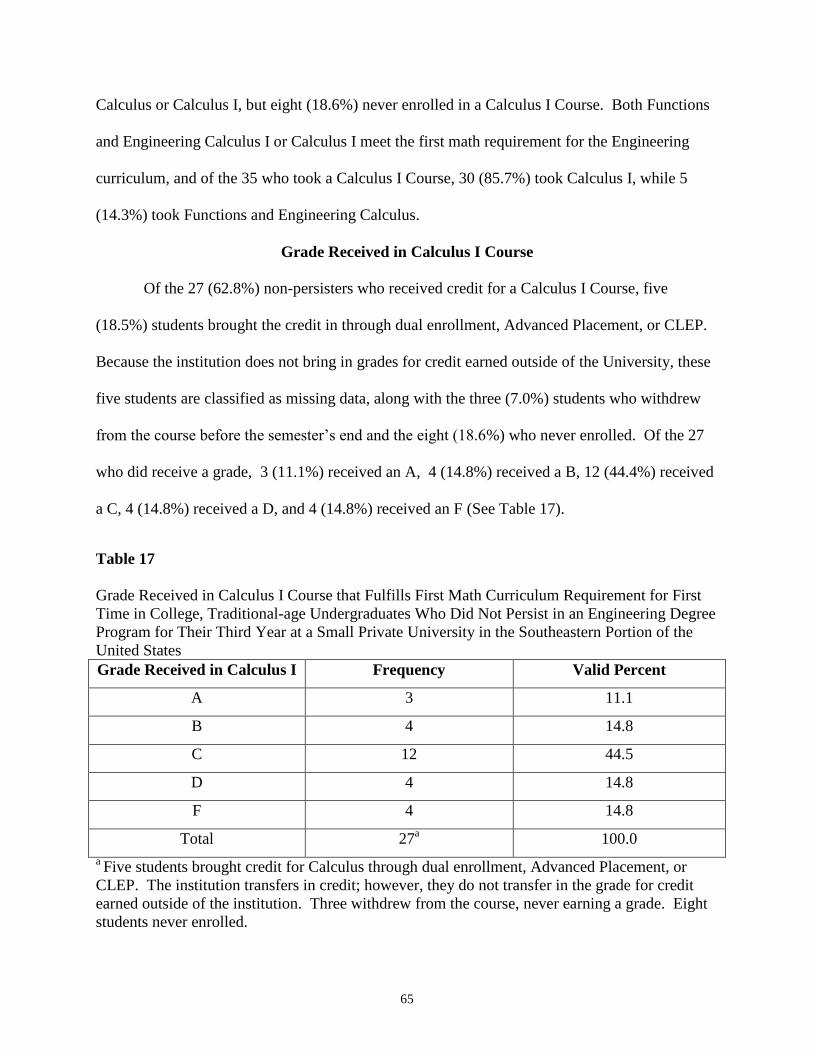
65
Calculus or Calculus I, but eight (18.6%) never enrolled in a Calculus I Course. Both Functions
and Engineering Calculus I or Calculus I meet the first math requirement for the Engineering
curriculum, and of the 35 who took a Calculus I Course, 30 (85.7%) took Calculus I, while 5
(14.3%) took Functions and Engineering Calculus.
Grade Received in Calculus I Course
Of the 27 (62.8%) non-persisters who received credit for a Calculus I Course, five
(18.5%) students brought the credit in through dual enrollment, Advanced Placement, or CLEP.
Because the institution does not bring in grades for credit earned outside of the University, these
five students are classified as missing data, along with the three (7.0%) students who withdrew
from the course before the semester‘s end and the eight (18.6%) who never enrolled. Of the 27
who did receive a grade, 3 (11.1%) received an A, 4 (14.8%) received a B, 12 (44.4%) received
a C, 4 (14.8%) received a D, and 4 (14.8%) received an F (See Table 17).
Table 17
Grade Received in Calculus I Course that Fulfills First Math Curriculum Requirement for First
Time in College, Traditional-age Undergraduates Who Did Not Persist in an Engineering Degree
Program for Their Third Year at a Small Private University in the Southeastern Portion of the
United States
Grade Received in Calculus I Frequency Valid Percent
A 3 11.1
B 4 14.8
C 12 44.5
D 4 14.8
F 4 14.8
Total 27a
100.0
a Five students brought credit for Calculus through dual enrollment, Advanced Placement, or
CLEP. The institution transfers in credit; however, they do not transfer in the grade for credit
earned outside of the institution. Three withdrew from the course, never earning a grade. Eight
students never enrolled.
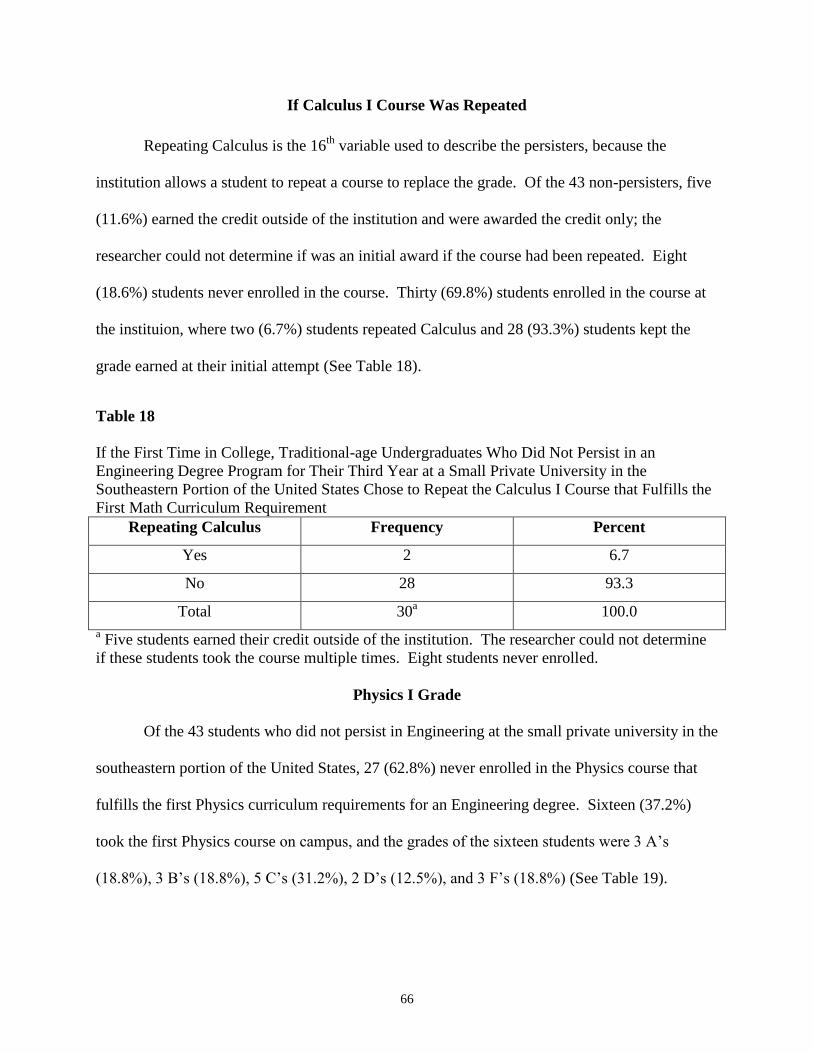
66
If Calculus I Course Was Repeated
Repeating Calculus is the 16th
variable used to describe the persisters, because the
institution allows a student to repeat a course to replace the grade. Of the 43 non-persisters, five
(11.6%) earned the credit outside of the institution and were awarded the credit only; the
researcher could not determine if was an initial award if the course had been repeated. Eight
(18.6%) students never enrolled in the course. Thirty (69.8%) students enrolled in the course at
the instituion, where two (6.7%) students repeated Calculus and 28 (93.3%) students kept the
grade earned at their initial attempt (See Table 18).
Table 18
If the First Time in College, Traditional-age Undergraduates Who Did Not Persist in an
Engineering Degree Program for Their Third Year at a Small Private University in the
Southeastern Portion of the United States Chose to Repeat the Calculus I Course that Fulfills the
First Math Curriculum Requirement
Repeating Calculus Frequency Percent
Yes 2 6.7
No 28 93.3
Total 30a
100.0
a Five students earned their credit outside of the institution. The researcher could not determine
if these students took the course multiple times. Eight students never enrolled.
Physics I Grade
Of the 43 students who did not persist in Engineering at the small private university in the
southeastern portion of the United States, 27 (62.8%) never enrolled in the Physics course that
fulfills the first Physics curriculum requirements for an Engineering degree. Sixteen (37.2%)
took the first Physics course on campus, and the grades of the sixteen students were 3 A‘s
(18.8%), 3 B‘s (18.8%), 5 C‘s (31.2%), 2 D‘s (12.5%), and 3 F‘s (18.8%) (See Table 19).
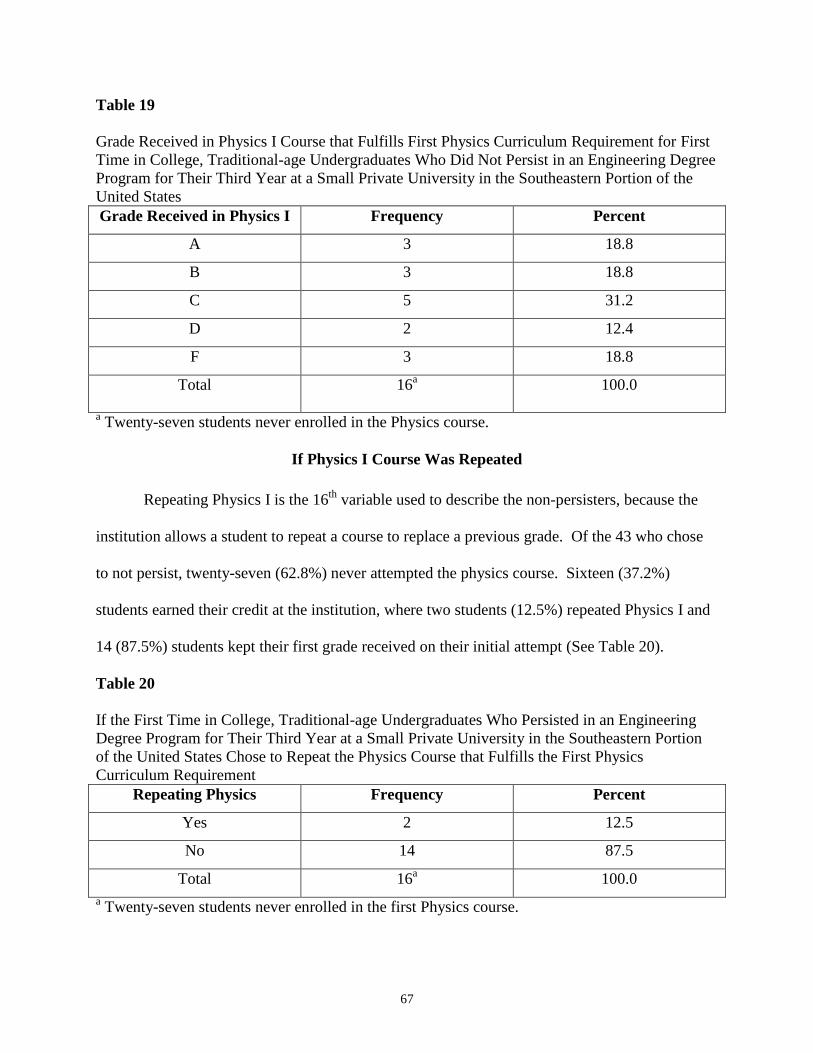
67
Table 19
Grade Received in Physics I Course that Fulfills First Physics Curriculum Requirement for First
Time in College, Traditional-age Undergraduates Who Did Not Persist in an Engineering Degree
Program for Their Third Year at a Small Private University in the Southeastern Portion of the
United States
Grade Received in Physics I Frequency Percent
A 3 18.8
B 3 18.8
C 5 31.2
D 2 12.4
F 3 18.8
Total 16a
100.0
a Twenty-seven students never enrolled in the Physics course.
If Physics I Course Was Repeated
Repeating Physics I is the 16th
variable used to describe the non-persisters, because the
institution allows a student to repeat a course to replace a previous grade. Of the 43 who chose
to not persist, twenty-seven (62.8%) never attempted the physics course. Sixteen (37.2%)
students earned their credit at the institution, where two students (12.5%) repeated Physics I and
14 (87.5%) students kept their first grade received on their initial attempt (See Table 20).
Table 20
If the First Time in College, Traditional-age Undergraduates Who Persisted in an Engineering
Degree Program for Their Third Year at a Small Private University in the Southeastern Portion
of the United States Chose to Repeat the Physics Course that Fulfills the First Physics
Curriculum Requirement
Repeating Physics Frequency Percent
Yes 2 12.5
No 14 87.5
Total 16a
100.0
a Twenty-seven students never enrolled in the first Physics course.
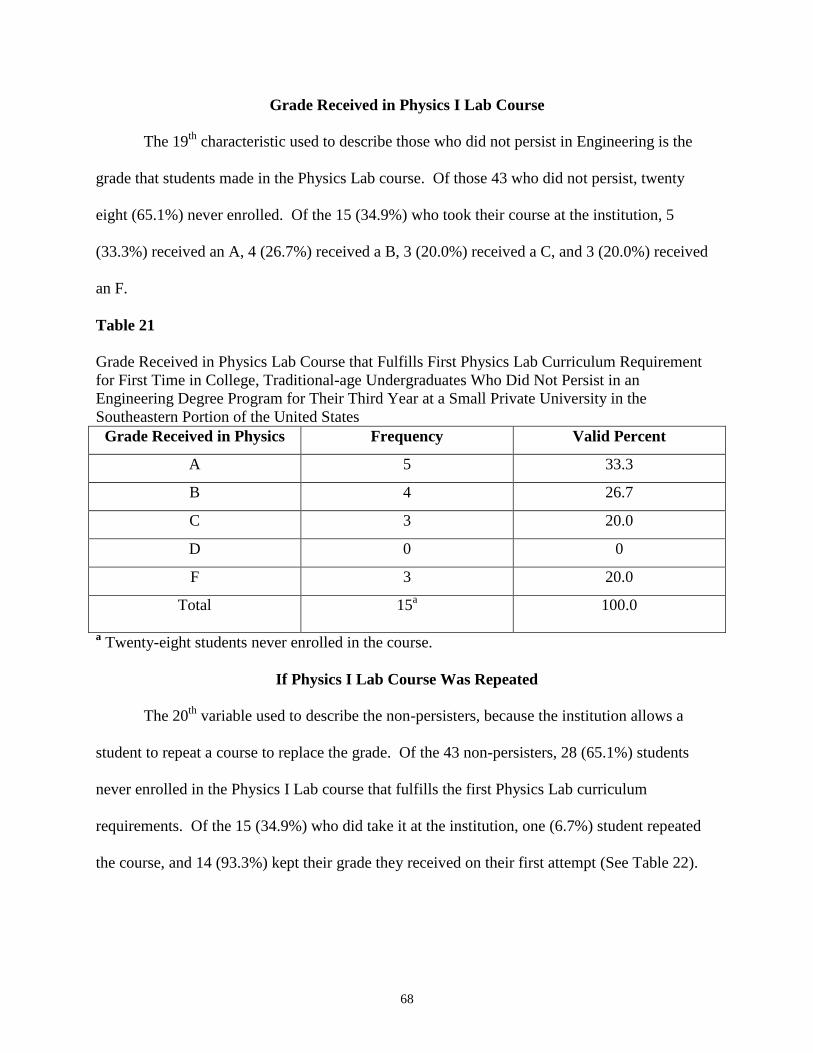
68
Grade Received in Physics I Lab Course
The 19th
characteristic used to describe those who did not persist in Engineering is the
grade that students made in the Physics Lab course. Of those 43 who did not persist, twenty
eight (65.1%) never enrolled. Of the 15 (34.9%) who took their course at the institution, 5
(33.3%) received an A, 4 (26.7%) received a B, 3 (20.0%) received a C, and 3 (20.0%) received
an F.
Table 21
Grade Received in Physics Lab Course that Fulfills First Physics Lab Curriculum Requirement
for First Time in College, Traditional-age Undergraduates Who Did Not Persist in an
Engineering Degree Program for Their Third Year at a Small Private University in the
Southeastern Portion of the United States
Grade Received in Physics Frequency Valid Percent
A 5 33.3
B 4 26.7
C 3 20.0
D 0 0
F 3 20.0
Total 15a
100.0
a Twenty-eight students never enrolled in the course.
If Physics I Lab Course Was Repeated
The 20th
variable used to describe the non-persisters, because the institution allows a
student to repeat a course to replace the grade. Of the 43 non-persisters, 28 (65.1%) students
never enrolled in the Physics I Lab course that fulfills the first Physics Lab curriculum
requirements. Of the 15 (34.9%) who did take it at the institution, one (6.7%) student repeated
the course, and 14 (93.3%) kept their grade they received on their first attempt (See Table 22).
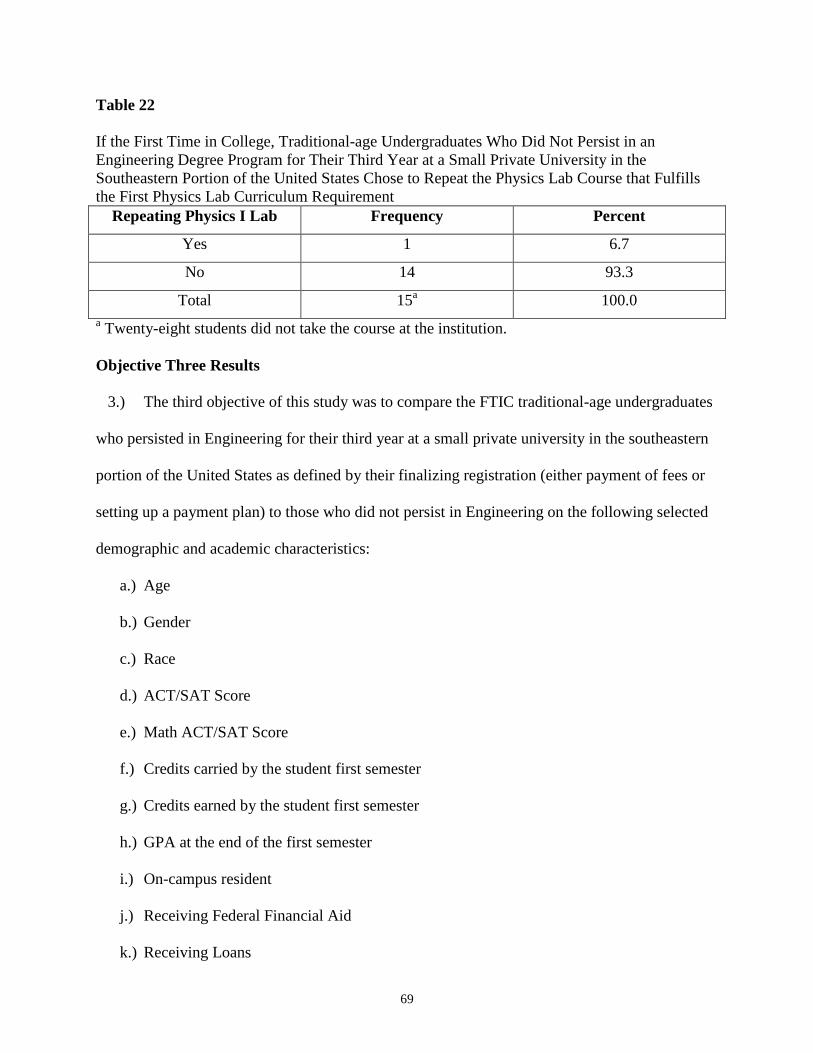
69
Table 22
If the First Time in College, Traditional-age Undergraduates Who Did Not Persist in an
Engineering Degree Program for Their Third Year at a Small Private University in the
Southeastern Portion of the United States Chose to Repeat the Physics Lab Course that Fulfills
the First Physics Lab Curriculum Requirement
Repeating Physics I Lab Frequency Percent
Yes 1 6.7
No 14 93.3
Total 15a
100.0
a Twenty-eight students did not take the course at the institution.
Objective Three Results
3.) The third objective of this study was to compare the FTIC traditional-age undergraduates
who persisted in Engineering for their third year at a small private university in the southeastern
portion of the United States as defined by their finalizing registration (either payment of fees or
setting up a payment plan) to those who did not persist in Engineering on the following selected
demographic and academic characteristics:
a.) Age
b.) Gender
c.) Race
d.) ACT/SAT Score
e.) Math ACT/SAT Score
f.) Credits carried by the student first semester
g.) Credits earned by the student first semester
h.) GPA at the end of the first semester
i.) On-campus resident
j.) Receiving Federal Financial Aid
k.) Receiving Loans
70
l.) If student took Pre-Calculus
m.) Calculus I course taken
n.) Grade in Calculus I
o.) If Calculus I was repeated
p.) Grade in Physics I
q.) If Physics I was repeated
r.) Grade in Physics I Lab
s.) If Physics I Lab was repeated
To make the specified comparisons, the researcher selected the statistical test based on its
appropriateness for level of measurement of each used variable as well as to maximize the
interpretability of findings. The researcher used an a‘ priori significance level of <.05 to
determine if the groups of students differed significantly. Variables that were measured on an
interval scale were compared using the independent t-test procedure. For those variables that
were measured as categorical data, the chi-square test of independence was used to compare the
students in the two groups (those who persisted in the third year in the engineering major and
those who did not persist). In comparing the groups on the 20 variables, six were found to be
significantly different by/related to a student‘s persistence in Engineering. The significant
variables were:
1.) Credits earned by the student first semester
2.) GPA at the end of the first semester
3.) On-campus resident
4.) Grade in Calculus I
5.) Grade in Physics I
6.) Grade in Physics Lab
71
Age
The ages of the persisters and non-persisters were compared. The mean age of persisters
was 17.86 (SD=.500), while the mean age of non-persisters was 18.05 (SD= .575). Examination
of the t-test results revealed that the groups were not significantly different on the variable age
(t90=1.689, p=.095).
Gender
The second variable compared was the gender of the persisters and non-persisters. Forty-
three of the 75 (57.3%) males persisted, while 32 (42.7%) did not, and 11 of the 17 (64.7%)
females did not, while 6 (35.3%) did. The researcher used the chi-square test of independence to
determine if the variables of persister/non-persister and gender were independent of each other.
Examination of the chi-square test results revealed that the variables were independent (X2
1,
92=2.704, p=.10).
Race
Race was the third variable used to compare the persisters and non-persisters. Because
the minority groups were so small, the researcher combined Black, Hispanic, and Asian into a
―non-white‖ group. Seventeen (65.4%) of the 26 non-white students persisted, while 9 (34.5%)
did not. Thirty-two (48.5%) of the white students persisted, while 34 (51.5%) were non-
persisters. The chi-square test of independence was used to determine if the variables of
persister/non-persister and race were independent of each other. Examination of the chi-square
test results revealed that the variables were independent (X2
1,92=2.140, p=.144).
Composite ACT/SAT Score
The students‘ highest Composite ACT/SAT score was the fourth variable used to
compare those who persisted in Engineering with those who did not. The researcher converted
the SAT scores to ACT scores using the ―Concordance between the ACT Composite and the
72
SAT Total Scores‖ (See Appendix B) and found the means score of persisters to be 26.20
(SD=2.300) and 26.12 (SD=2.970) for the non-persisters. Examination of the independent t-test
results revealed that the groups were not significantly different on the variable composite
ACT/SAT (t78.762=-.157, p=.876).
Math ACT/SAT Score
The fifth variable used to compare the persisters and the non-persisters was the student‘s
Math ACT/SAT Score. The researcher converted any SAT to ACT scores using the
―Concordance between the ACT Mathematics and the SAT Quantitative Scores‖ (See Appendix
C), and the mean score of the persisters was 28.00 (SD=2.716) and of the non-persisters was
27.05 (SD=3.773). Examination of the independent t-test results revealed that the groups were
not significantly different on the variable Math ACT/SAT score (t75.259=-1.374, p=.174).
Credits Carried by the Student First Semester
The credits carried by the student the first semester was the next variable used to compare
the persisters and the non-persisters. The mean number of credits carried by the persisters was
16.00 (SD=1.323), while the mean number of credits carried by the non-persisters was 15.67
(SD=1.886). Examination of the independent t-test results revealed that the groups were not
significantly different on the variable credits carried by the student first semester (t74.015=-.946,
p=.347).
Credits Earned by the Student First Semester
The credits earned by the student the first semester was the seventh variable used to
compare the students who persisted in Engineering with those who did not. The mean number of
hours earned by the students who persisted was 14.78 (SD=2.511), and the mean number of
hours for the non-persisters was 12.74 (SD=4.665). By using an independent t-test procedure,
the researcher found that the mean number of credit hours earned by the persisters is
73
significantly higher than the mean number of hours earned by non-persisters (t62.524=-2.549,
p=.013).
GPA at the End of the First Semester
Comparing the persisting and non-persisting students‘ GPAs at the end of the first
semester is the next variable used in this study. The mean GPA of the persisters was 3.22702
(SD=.459928), and the mean GPA of the non-persisters was 2.46419 (SD=.970113). By using
an independent t-test procedure, the researcher found that the mean GPA earned by the persister
is significantly higher than the mean GPA earned by the non-persisters (t58.221=-4.712, p=<.001).
On-Campus Resident
Whether or not a student chose to live on campus during his/her first semester in college
is the ninth variable used to compare the persisters with the non-persisters in Engineering.
Thirty-nine percent (n=23) of the on-campus residents were non-persisters, while 61% (n=59)
did persist to their fifth semester. In contrast, 20 of the 33 (60.6%) of the commuters did not
persist, and 13 (39.4%) did. By using the chi-square test of independence, the researcher found
that the variables on-campus resident and commuter were not independent. The nature of the
association of these variables was such that a higher percentage of residents were persisters
(61.0%) while a higher percentage of commuters (60.6%) were non-persisters (X2
1, 92=3.975,
p=.046) (See Table 23).
Receiving Federal Financial Aid
Whether or not a student received Federal Financial Aid was the next variable used in
comparing persisters in Engineering with those who did not persist. Of those 28 students who
received Federal Aid, 12 (42.9%) did not persist, while 16 (57.1%) did. Sixty-four students did
not receive Federal Aid; 33 (51.6%) persisted, and 31 (48.4%) did not persist in Engineering.
The chi-square test of independence was used to determine if the variables of persister/non-
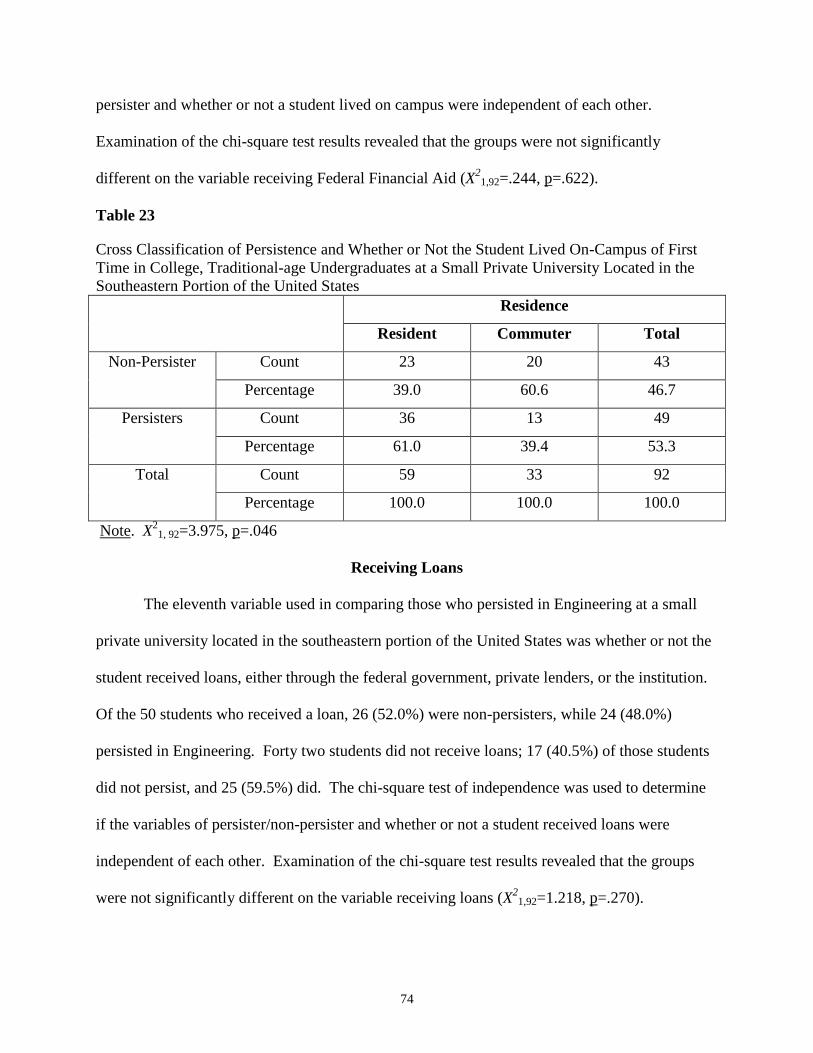
74
persister and whether or not a student lived on campus were independent of each other.
Examination of the chi-square test results revealed that the groups were not significantly
different on the variable receiving Federal Financial Aid (X2
1,92=.244, p=.622).
Table 23
Cross Classification of Persistence and Whether or Not the Student Lived On-Campus of First
Time in College, Traditional-age Undergraduates at a Small Private University Located in the
Southeastern Portion of the United States
Residence
Resident Commuter Total
Non-Persister Count 23 20 43
Percentage 39.0 60.6 46.7
Persisters Count 36 13 49
Percentage 61.0 39.4 53.3
Total Count 59 33 92
Percentage 100.0 100.0 100.0
Note. X2
1, 92=3.975, p=.046
Receiving Loans
The eleventh variable used in comparing those who persisted in Engineering at a small
private university located in the southeastern portion of the United States was whether or not the
student received loans, either through the federal government, private lenders, or the institution.
Of the 50 students who received a loan, 26 (52.0%) were non-persisters, while 24 (48.0%)
persisted in Engineering. Forty two students did not receive loans; 17 (40.5%) of those students
did not persist, and 25 (59.5%) did. The chi-square test of independence was used to determine
if the variables of persister/non-persister and whether or not a student received loans were
independent of each other. Examination of the chi-square test results revealed that the groups
were not significantly different on the variable receiving loans (X2
1,92=1.218, p=.270).
75
If Student Took Pre-Calculus
Whether or not a student took Pre-calculus is the next variable used to compare the
students who persisted in Engineering with those who did not. Of the 29 students who took Pre-
Calculus, 16 (55.2%) persisted, and 13 (44.8%) did not. Sixty-three students did not take Pre-
Calculus, and of those, 33 (52.4%) persisted, while 30 (47.6%) did not. The chi-square test of
independence was used to determine if the variables of persister/non-persister and whether or not
a student completed a Pre-Calculus course were independent of each other. Examination of the
chi-square test results revealed that the groups were not significantly different on the variable if a
student took Pre-Calculus (X2
1,92=.062, p=.803).
Calculus I Course Taken
Whether or not a student took Functions and Engineering Calculus I or Calculus I was the
13th
variable used to compare those who persisted in Engineering with those who did not. Ten
students took Functions and Engineering Calculus I, and of those, 5 (50%) persisted and 5 (50%)
did not. Forty-four (59.5%) of the 74 Calculus I students persisted, and 30 (40.5%) did not. The
chi-square test of independence was used to determine if the variables of persister/non-persister
and the specific Calculus I course taken were independent of each other. Examination of the chi-
square test results revealed that the groups were not significantly different on the variable
(X2
1,84=.324, p=.569).
Grade in Calculus I
The grade a student earned in the completed Calculus I course is the next variable used to
compare persisters with non-persisters in Engineering. The mean grade (based on A=4, B=3,
C=2, D=1, F=0) of those who persisted was 2.92 (SD=.888), and that of the non-persisters was
1.93 (SD=1.174). By using an independent t-test procedure, the researcher found a statistically
significant difference in the Calculus I grades of the persisters and non-persisters in Engineering
76
(t65=-3.962, p=<.001). The nature of this difference is that persisters had higher grades than non-
persisters.
If Calculus I Was Repeated
If the students repeated their Calculus I course is the 15th
variable used to compare
persisters with non-persisters in Engineering. Five students repeated the course, and of those, 2
(40.0%) did not persist, while 3 (60.0%) did. Of the sixty-five who did not repeat, 37 (56.9%)
were persisters, but 28 (43.1%) chose not to persist. The chi-square test of independence was
used to determine if the variables of persister/non-persister and whether or not a student repeated
his Calculus I course. Examination of the chi-square test results revealed that the groups were
not significantly different on the variable if Calculus was repeated (X2
1,70=.018, p=.893).
Grade in Physics I
The grade a student earned in the completed Physics course is the next variable used to
compare persisters with non-persisters in Engineering. The mean grade (based on A=4, B=3,
C=2, D=1, F=0) of those who persisted was 3.04 (SD=.737), and that of the non-persisters was
2.06 (SD=1.389). By using an independent t-test procedure, the researcher found a statistically
significant difference in the Physics I grades of persisters and non-persisters in Engineering
(t18.093=-2.696, p=.015). The nature of this difference is that persisters had higher grades than
non-persisters.
If Physics I Was Repeated
If the students repeated their Physics course is the 17th
variable used to compare
persisters with non-persisters in Engineering. Eight students repeated the course, and of those,
two (25.0%) did not persist, while six (75.0%) did. Of the fifty-three who did not repeat, three
(73.6%) were persisters, but 14 (26.4%) chose not to persist. The chi-square test of
independence was used to determine if the variables of persister/non-persister and whether or not
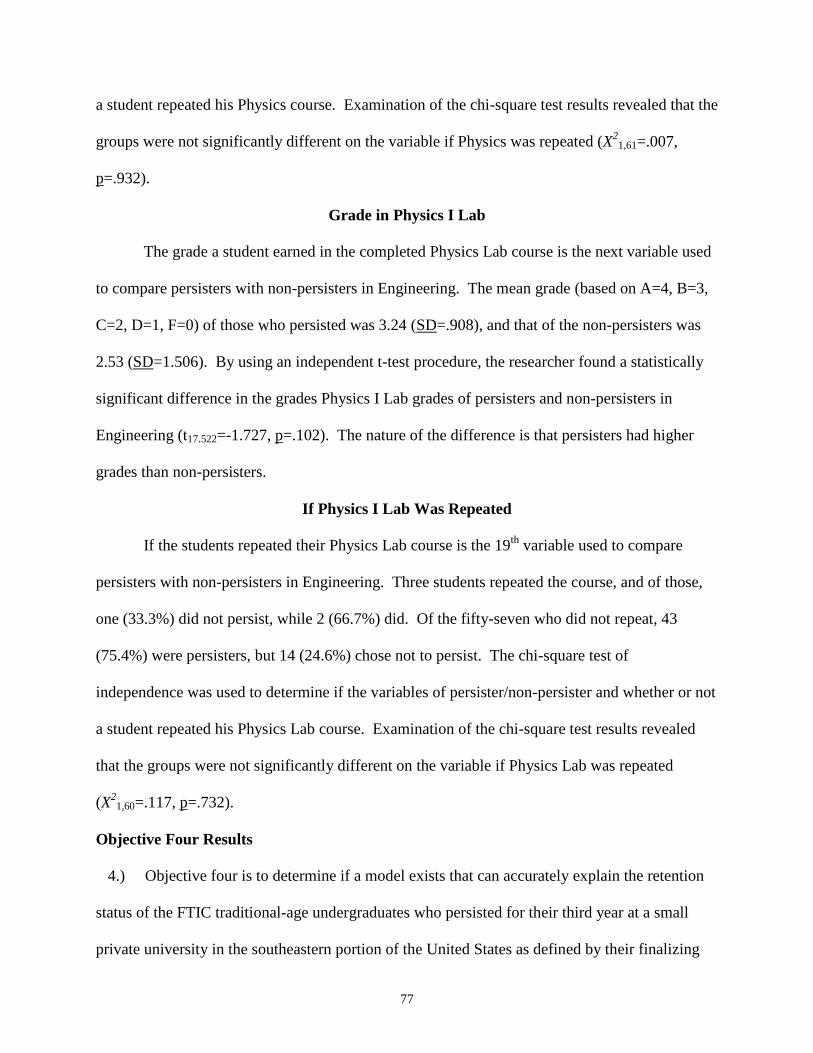
77
a student repeated his Physics course. Examination of the chi-square test results revealed that the
groups were not significantly different on the variable if Physics was repeated (X2
1,61=.007,
p=.932).
Grade in Physics I Lab
The grade a student earned in the completed Physics Lab course is the next variable used
to compare persisters with non-persisters in Engineering. The mean grade (based on A=4, B=3,
C=2, D=1, F=0) of those who persisted was 3.24 (SD=.908), and that of the non-persisters was
2.53 (SD=1.506). By using an independent t-test procedure, the researcher found a statistically
significant difference in the grades Physics I Lab grades of persisters and non-persisters in
Engineering (t17.522=-1.727, p=.102). The nature of the difference is that persisters had higher
grades than non-persisters.
If Physics I Lab Was Repeated
If the students repeated their Physics Lab course is the 19th
variable used to compare
persisters with non-persisters in Engineering. Three students repeated the course, and of those,
one (33.3%) did not persist, while 2 (66.7%) did. Of the fifty-seven who did not repeat, 43
(75.4%) were persisters, but 14 (24.6%) chose not to persist. The chi-square test of
independence was used to determine if the variables of persister/non-persister and whether or not
a student repeated his Physics Lab course. Examination of the chi-square test results revealed
that the groups were not significantly different on the variable if Physics Lab was repeated
(X2
1,60=.117, p=.732).
Objective Four Results
4.) Objective four is to determine if a model exists that can accurately explain the retention
status of the FTIC traditional-age undergraduates who persisted for their third year at a small
private university in the southeastern portion of the United States as defined by their finalizing
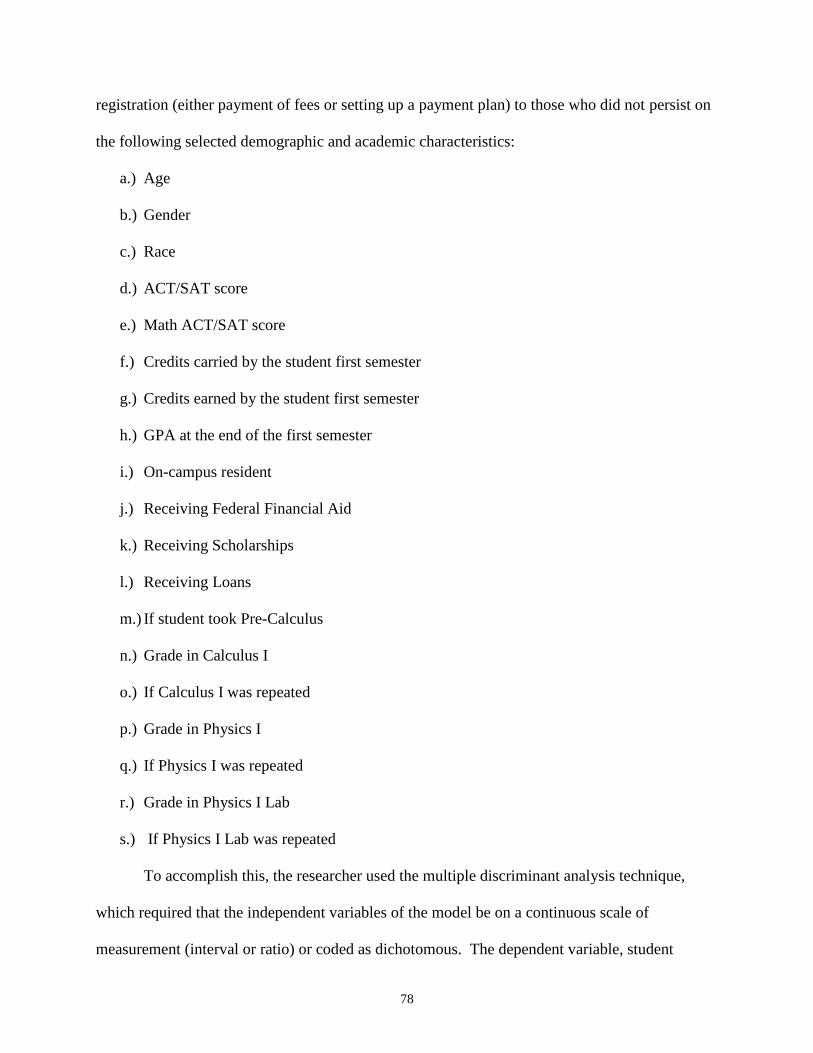
78
registration (either payment of fees or setting up a payment plan) to those who did not persist on
the following selected demographic and academic characteristics:
a.) Age
b.) Gender
c.) Race
d.) ACT/SAT score
e.) Math ACT/SAT score
f.) Credits carried by the student first semester
g.) Credits earned by the student first semester
h.) GPA at the end of the first semester
i.) On-campus resident
j.) Receiving Federal Financial Aid
k.) Receiving Scholarships
l.) Receiving Loans
m.) If student took Pre-Calculus
n.) Grade in Calculus I
o.) If Calculus I was repeated
p.) Grade in Physics I
q.) If Physics I was repeated
r.) Grade in Physics I Lab
s.) If Physics I Lab was repeated
To accomplish this, the researcher used the multiple discriminant analysis technique,
which required that the independent variables of the model be on a continuous scale of
measurement (interval or ratio) or coded as dichotomous. The dependent variable, student
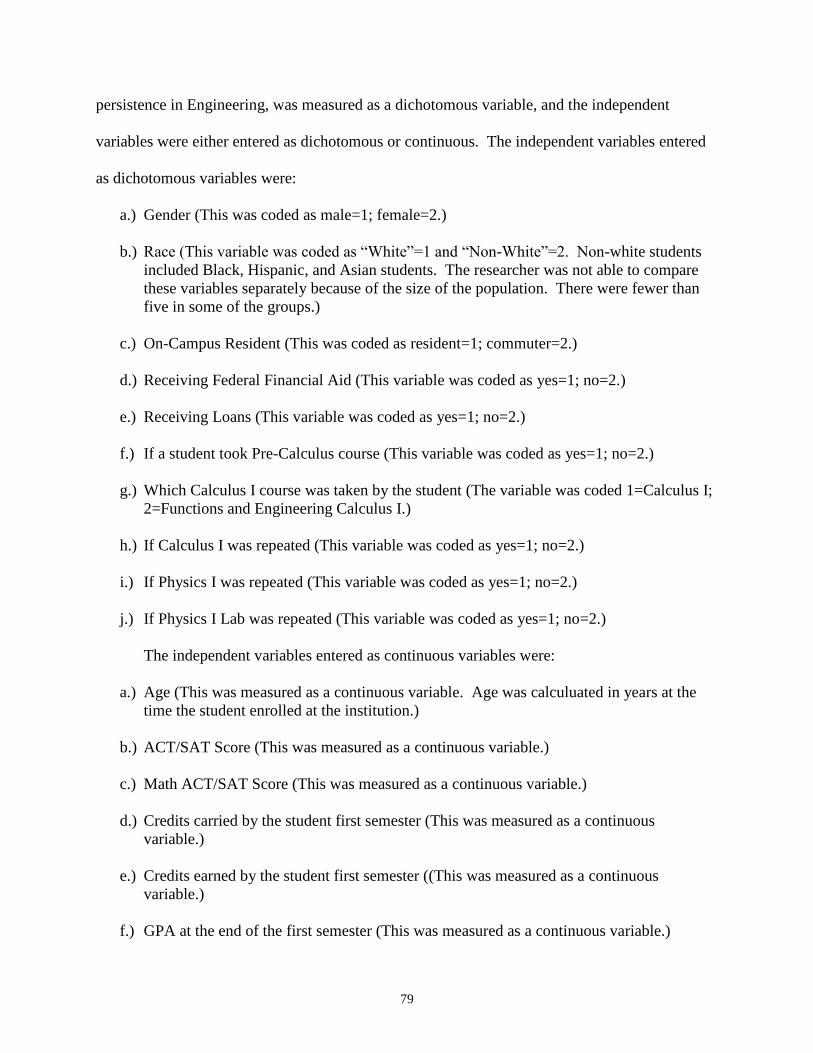
79
persistence in Engineering, was measured as a dichotomous variable, and the independent
variables were either entered as dichotomous or continuous. The independent variables entered
as dichotomous variables were:
a.) Gender (This was coded as male=1; female=2.)
b.) Race (This variable was coded as ―White‖=1 and ―Non-White‖=2. Non-white students
included Black, Hispanic, and Asian students. The researcher was not able to compare
these variables separately because of the size of the population. There were fewer than
five in some of the groups.)
c.) On-Campus Resident (This was coded as resident=1; commuter=2.)
d.) Receiving Federal Financial Aid (This variable was coded as yes=1; no=2.)
e.) Receiving Loans (This variable was coded as yes=1; no=2.)
f.) If a student took Pre-Calculus course (This variable was coded as yes=1; no=2.)
g.) Which Calculus I course was taken by the student (The variable was coded 1=Calculus I;
2=Functions and Engineering Calculus I.)
h.) If Calculus I was repeated (This variable was coded as yes=1; no=2.)
i.) If Physics I was repeated (This variable was coded as yes=1; no=2.)
j.) If Physics I Lab was repeated (This variable was coded as yes=1; no=2.)
The independent variables entered as continuous variables were:
a.) Age (This was measured as a continuous variable. Age was calculuated in years at the
time the student enrolled at the institution.)
b.) ACT/SAT Score (This was measured as a continuous variable.)
c.) Math ACT/SAT Score (This was measured as a continuous variable.)
d.) Credits carried by the student first semester (This was measured as a continuous
variable.)
e.) Credits earned by the student first semester ((This was measured as a continuous
variable.)
f.) GPA at the end of the first semester (This was measured as a continuous variable.)
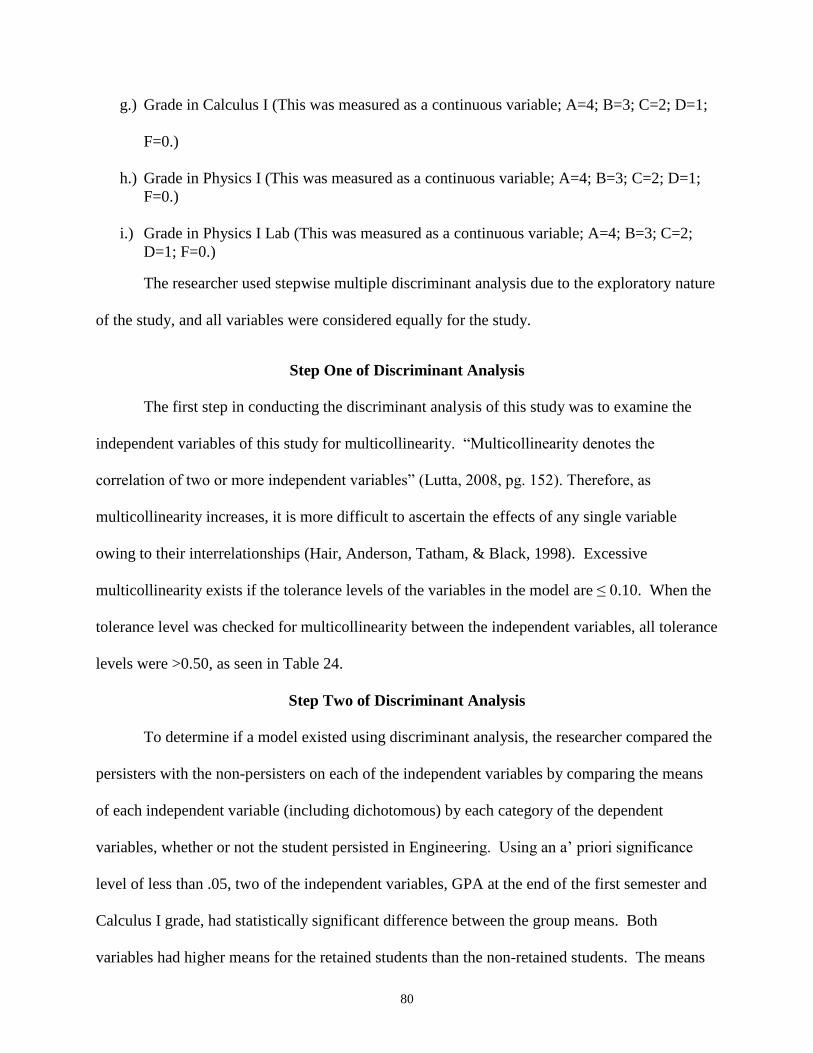
80
g.) Grade in Calculus I (This was measured as a continuous variable; A=4; B=3; C=2; D=1;
F=0.)
h.) Grade in Physics I (This was measured as a continuous variable; A=4; B=3; C=2; D=1;
F=0.)
i.) Grade in Physics I Lab (This was measured as a continuous variable; A=4; B=3; C=2;
D=1; F=0.)
The researcher used stepwise multiple discriminant analysis due to the exploratory nature
of the study, and all variables were considered equally for the study.
Step One of Discriminant Analysis
The first step in conducting the discriminant analysis of this study was to examine the
independent variables of this study for multicollinearity. ―Multicollinearity denotes the
correlation of two or more independent variables‖ (Lutta, 2008, pg. 152). Therefore, as
multicollinearity increases, it is more difficult to ascertain the effects of any single variable
owing to their interrelationships (Hair, Anderson, Tatham, & Black, 1998). Excessive
multicollinearity exists if the tolerance levels of the variables in the model are ≤ 0.10. When the
tolerance level was checked for multicollinearity between the independent variables, all tolerance
levels were >0.50, as seen in Table 24.
Step Two of Discriminant Analysis
To determine if a model existed using discriminant analysis, the researcher compared the
persisters with the non-persisters on each of the independent variables by comparing the means
of each independent variable (including dichotomous) by each category of the dependent
variables, whether or not the student persisted in Engineering. Using an a‘ priori significance
level of less than .05, two of the independent variables, GPA at the end of the first semester and
Calculus I grade, had statistically significant difference between the group means. Both
variables had higher means for the retained students than the non-retained students. The means
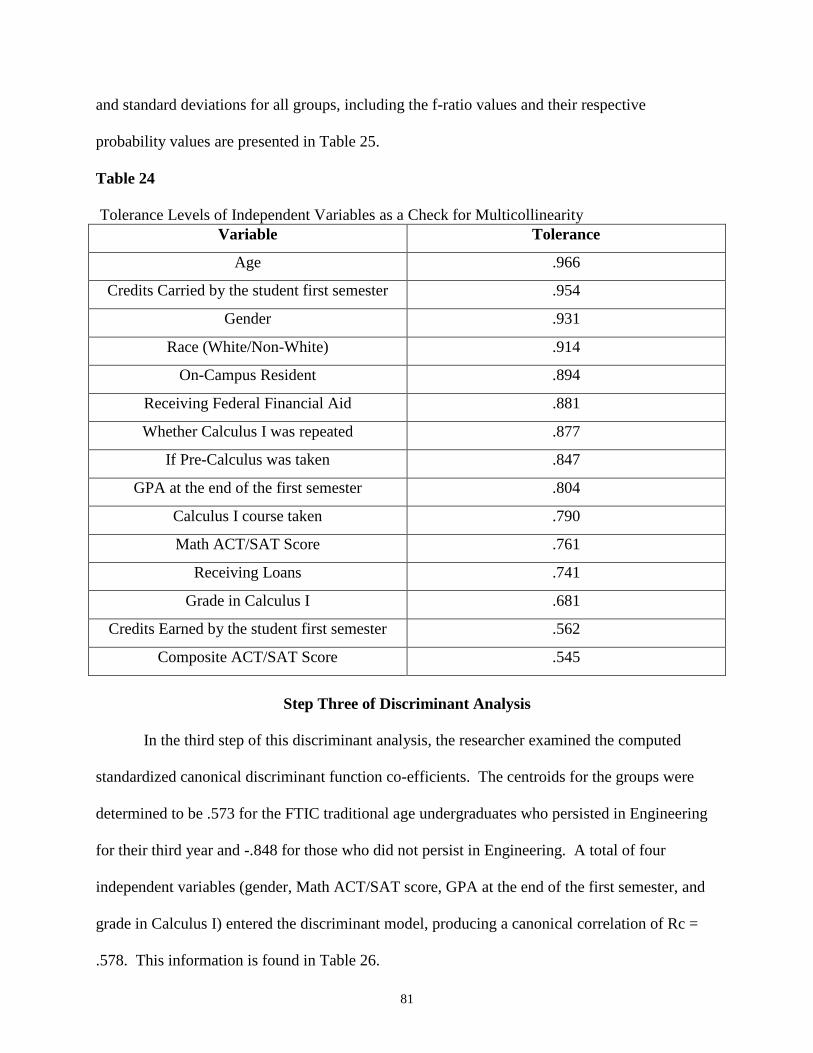
81
and standard deviations for all groups, including the f-ratio values and their respective
probability values are presented in Table 25.
Table 24
Tolerance Levels of Independent Variables as a Check for Multicollinearity
Variable Tolerance
Age .966
Credits Carried by the student first semester .954
Gender .931
Race (White/Non-White) .914
On-Campus Resident .894
Receiving Federal Financial Aid .881
Whether Calculus I was repeated .877
If Pre-Calculus was taken .847
GPA at the end of the first semester .804
Calculus I course taken .790
Math ACT/SAT Score .761
Receiving Loans .741
Grade in Calculus I .681
Credits Earned by the student first semester .562
Composite ACT/SAT Score .545
Step Three of Discriminant Analysis
In the third step of this discriminant analysis, the researcher examined the computed
standardized canonical discriminant function co-efficients. The centroids for the groups were
determined to be .573 for the FTIC traditional age undergraduates who persisted in Engineering
for their third year and -.848 for those who did not persist in Engineering. A total of four
independent variables (gender, Math ACT/SAT score, GPA at the end of the first semester, and
grade in Calculus I) entered the discriminant model, producing a canonical correlation of Rc =
.578. This information is found in Table 26.
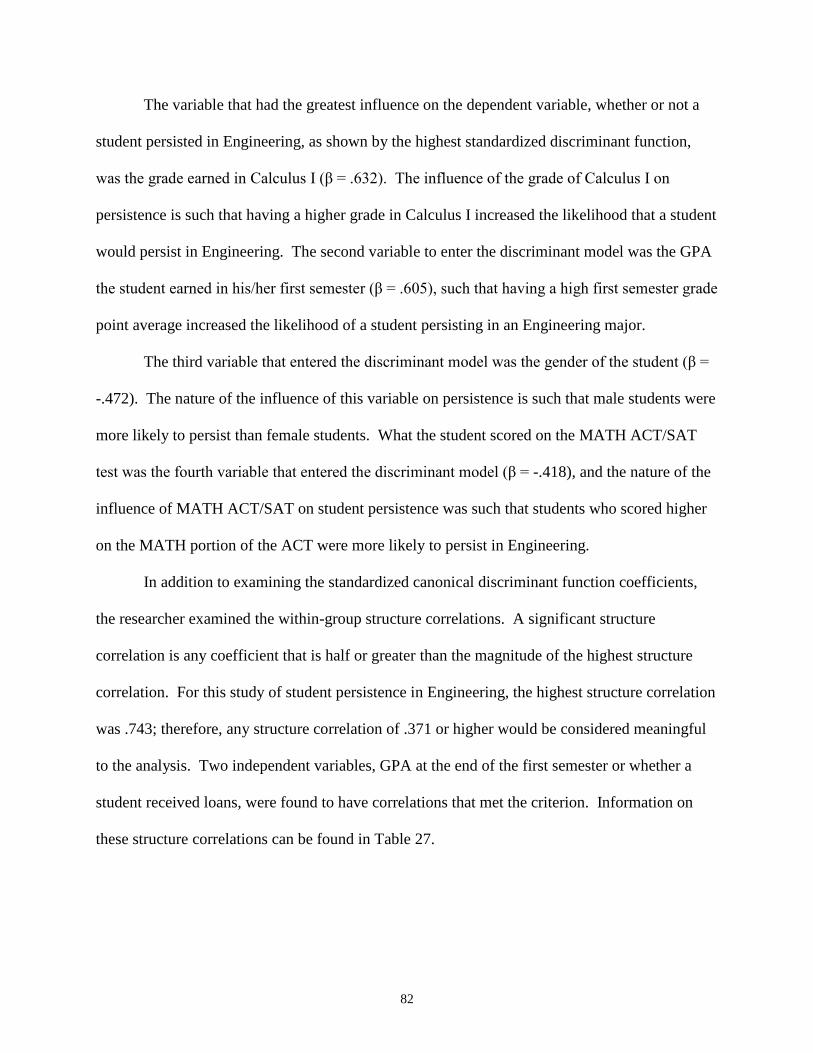
82
The variable that had the greatest influence on the dependent variable, whether or not a
student persisted in Engineering, as shown by the highest standardized discriminant function,
was the grade earned in Calculus I (β = .632). The influence of the grade of Calculus I on
persistence is such that having a higher grade in Calculus I increased the likelihood that a student
would persist in Engineering. The second variable to enter the discriminant model was the GPA
the student earned in his/her first semester (β = .605), such that having a high first semester grade
point average increased the likelihood of a student persisting in an Engineering major.
The third variable that entered the discriminant model was the gender of the student (β =
-.472). The nature of the influence of this variable on persistence is such that male students were
more likely to persist than female students. What the student scored on the MATH ACT/SAT
test was the fourth variable that entered the discriminant model (β = -.418), and the nature of the
influence of MATH ACT/SAT on student persistence was such that students who scored higher
on the MATH portion of the ACT were more likely to persist in Engineering.
In addition to examining the standardized canonical discriminant function coefficients,
the researcher examined the within-group structure correlations. A significant structure
correlation is any coefficient that is half or greater than the magnitude of the highest structure
correlation. For this study of student persistence in Engineering, the highest structure correlation
was .743; therefore, any structure correlation of .371 or higher would be considered meaningful
to the analysis. Two independent variables, GPA at the end of the first semester or whether a
student received loans, were found to have correlations that met the criterion. Information on
these structure correlations can be found in Table 27.
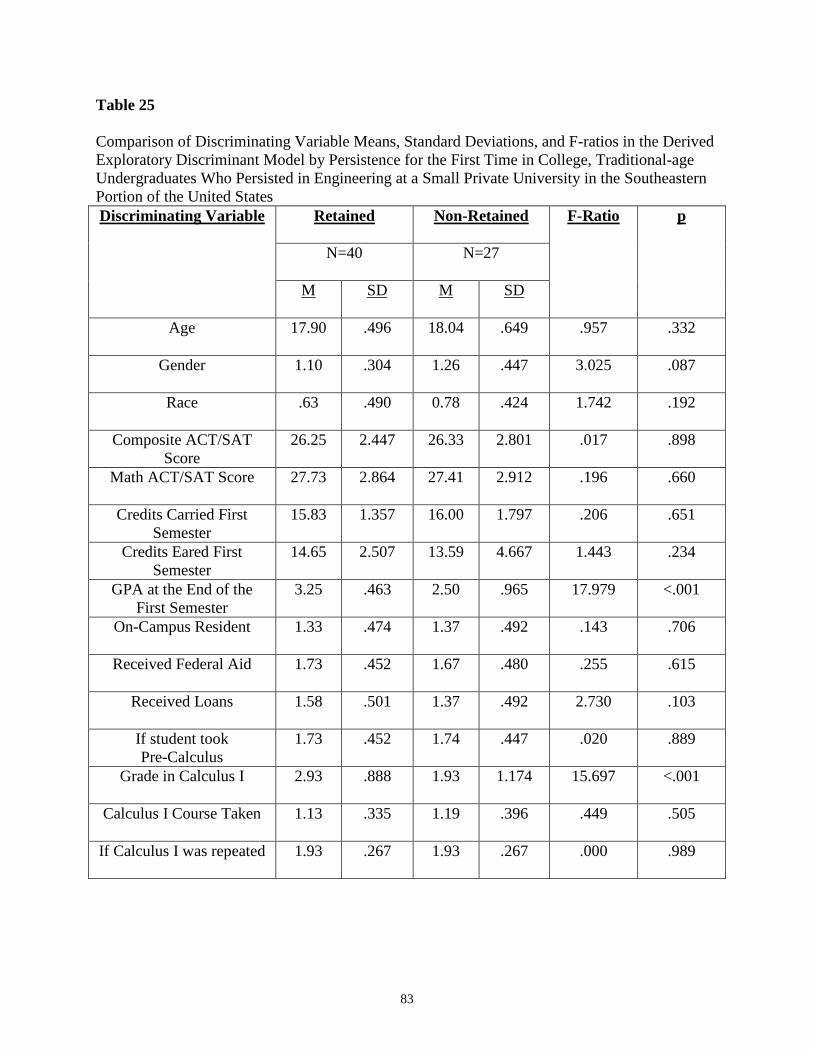
83
Table 25
Comparison of Discriminating Variable Means, Standard Deviations, and F-ratios in the Derived
Exploratory Discriminant Model by Persistence for the First Time in College, Traditional-age
Undergraduates Who Persisted in Engineering at a Small Private University in the Southeastern
Portion of the United States
Discriminating Variable Retained Non-Retained F-Ratio p
N=40 N=27
M SD M SD
Age 17.90 .496 18.04 .649 .957 .332
Gender 1.10 .304 1.26 .447 3.025 .087
Race .63 .490 0.78 .424 1.742 .192
Composite ACT/SAT
Score
26.25 2.447 26.33 2.801 .017 .898
Math ACT/SAT Score 27.73 2.864 27.41 2.912 .196 .660
Credits Carried First
Semester
15.83 1.357 16.00 1.797 .206 .651
Credits Eared First
Semester
14.65 2.507 13.59 4.667 1.443 .234
GPA at the End of the
First Semester
3.25 .463 2.50 .965 17.979 <.001
On-Campus Resident 1.33 .474 1.37 .492 .143 .706
Received Federal Aid 1.73 .452 1.67 .480 .255 .615
Received Loans 1.58 .501 1.37 .492 2.730 .103
If student took
Pre-Calculus
1.73 .452 1.74 .447 .020 .889
Grade in Calculus I 2.93 .888 1.93 1.174 15.697 <.001
Calculus I Course Taken 1.13 .335 1.19 .396 .449 .505
If Calculus I was repeated 1.93 .267 1.93 .267 .000 .989
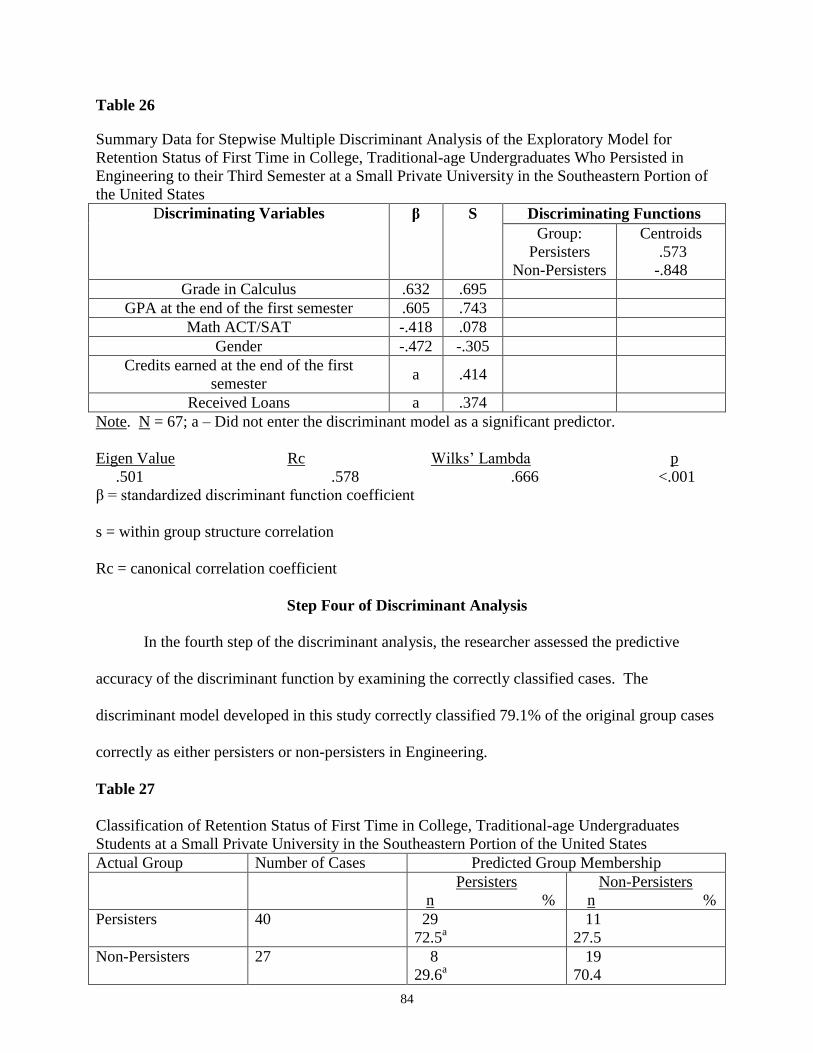
84
Table 26
Summary Data for Stepwise Multiple Discriminant Analysis of the Exploratory Model for
Retention Status of First Time in College, Traditional-age Undergraduates Who Persisted in
Engineering to their Third Semester at a Small Private University in the Southeastern Portion of
the United States
Discriminating Variables β S Discriminating Functions
Group:
Persisters
Non-Persisters
Centroids
.573
-.848
Grade in Calculus .632 .695
GPA at the end of the first semester .605 .743
Math ACT/SAT -.418 .078
Gender -.472 -.305
Credits earned at the end of the first
semester a .414
Received Loans a .374
Note. N = 67; a – Did not enter the discriminant model as a significant predictor.
Eigen Value Rc Wilks‘ Lambda p
.501 .578 .666 <.001
β = standardized discriminant function coefficient
s = within group structure correlation
Rc = canonical correlation coefficient
Step Four of Discriminant Analysis
In the fourth step of the discriminant analysis, the researcher assessed the predictive
accuracy of the discriminant function by examining the correctly classified cases. The
discriminant model developed in this study correctly classified 79.1% of the original group cases
correctly as either persisters or non-persisters in Engineering.
Table 27
Classification of Retention Status of First Time in College, Traditional-age Undergraduates
Students at a Small Private University in the Southeastern Portion of the United States
Actual Group Number of Cases Predicted Group Membership
Persisters
n %
Non-Persisters
n %
Persisters 40 29
72.5a
11
27.5
Non-Persisters 27 8
29.6a
19
70.4
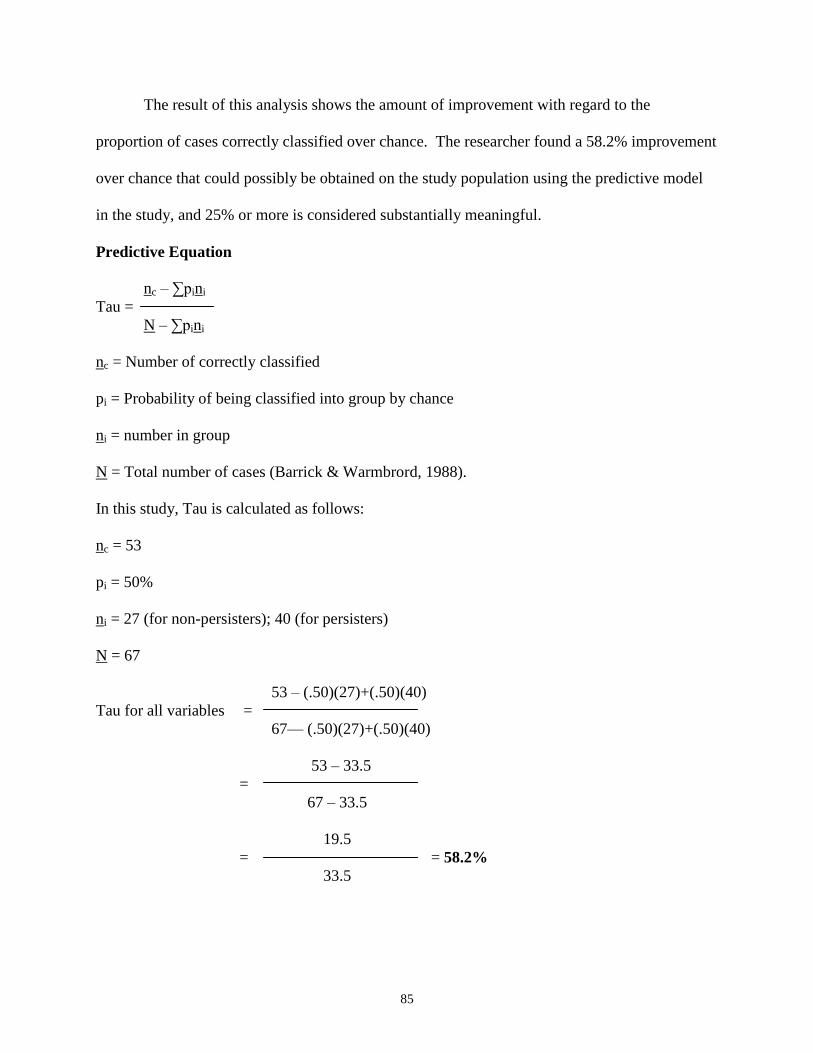
85
The result of this analysis shows the amount of improvement with regard to the
proportion of cases correctly classified over chance. The researcher found a 58.2% improvement
over chance that could possibly be obtained on the study population using the predictive model
in the study, and 25% or more is considered substantially meaningful.
Predictive Equation
nc – ∑pini
Tau =
N – ∑pini
nc = Number of correctly classified
pi = Probability of being classified into group by chance
ni = number in group
N = Total number of cases (Barrick & Warmbrord, 1988).
In this study, Tau is calculated as follows:
nc = 53
pi = 50%
ni = 27 (for non-persisters); 40 (for persisters)
N = 67
53 – (.50)(27)+(.50)(40)
Tau for all variables =
67— (.50)(27)+(.50)(40)
53 – 33.5
=
67 – 33.5
19.5
= = 58.2%
33.5
86
Chapter 5: Conclusions and Recommendations
Summary of Purpose and Specific Objectives
The primary purpose of this study is to determine the influence of selected demographic
and academic characteristics in the decision of first-time-in-college (FTIC) traditional-age
undergraduates who declare engineering as their major at admission to persist in the curriculum
from second to third year at a small private university in the southeastern portion of the United
States. The dependent variable of this student was whether or not the FTIC traditional age
student persisted in Engineering to their fifth semester at a small private university located in the
southeastern portion of the United States.
The following objectives were used to guide the research study:
1.) To describe FTIC traditional-age, undergraduates who persisted for their third year at a
small private university in the southeastern portion of the United States as defined by their
finalizing registration (either payment of fees or setting up a payment plan) on the following
selected demographic and academic characteristics:
a.) Age
b.) Gender
c.) Race
d.) ACT/SAT Score
e.) Math ACT/SAT Score
f.) Credits carried by the student first semester
g.) Credits earned by the student first semester
h.) GPA at the end of the first semester
i.) On-campus resident
j.) Receiving Federal Financial Aid
k.) Receiving Scholarships
87
l.) Receiving Loans
m.) If student took Pre-Calculus
n.) Which Calculus I course was taken
o.) Grade in Calculus I
p.) If Calculus I was repeated
q.) Grade in Physics I
r.) If Physics I was repeated
s.) Grade in Physics I Lab
t.) If Physics I Lab was repeated
2.) To describe FTIC traditional-age undergraduates who did not persist for their third year
at a small private university in the southeastern portion of the United States as defined by their
finalizing registration (either payment of fees or setting up a payment plan) on the following
selected demographic and academic characteristics:
a.) Age
b.) Gender
c.) Race
d.) ACT/SAT Score
e.) Math ACT/SAT Score
f.) Credits carried by the student first semester
g.) Credits earned by the student first semester
h.) GPA at the end of the first semester
i.) On-campus resident
j.) Receiving Federal Financial Aid
k.) Receiving Scholarships
88
l.) Receiving Loans
m.) If student took Pre-Calculus
n.) Which Calculus I course was taken
o.) Grade in Calculus I
p.) If Calculus I was repeated
q.) Grade in Physics I
r.) If Physics I was repeated
s.) Grade in Physics I Lab
t.) If Physics I Lab was repeated
3.) To compare the FTIC traditional-age undergraduates who persisted for their third year at
a small private university in the southeastern portion of the United States as defined by their
finalizing registration (either payment of fees or setting up a payment plan) to those who did not
persist on the following selected demographic and academic characteristics:
a.) Age
b.) Gender
c.) Race
d.) ACT/SAT Score
e.) Math ACT/SAT Score
f.) Credits carried by the student first semester
g.) Credits earned by the student first semester
h.) GPA at the end of the first semester
i.) On-campus resident
j.) Receiving Federal Financial Aid
k.) Receiving Scholarships
89
l.) Receiving Loans
m.) If student took Pre-Calculus
n.) Which Calculus I course was taken
o.) Grade in Calculus I
p.) If Calculus I was repeated
q.) Grade in Physics I
r.) If Physics I was repeated
s.) Grade in Physics I Lab
t.) If Physics I Lab was repeated
4.) To determine if a model exists that can accurately explain the retention status of the FTIC
traditional-age undergraduates who persisted for their third year at a small private university in
the southeastern portion of the United States as defined by their finalizing registration (either
payment of fees or setting up a payment plan) to those who did not persist on the following
selected demographic and academic characteristics:
a.) Age
b.) Gender
c.) Race
d.) ACT/SAT Score
e.) Math ACT/SAT Score
f.) Credits carried by the student first semester
g.) Credits earned by the student first semester
h.) GPA at the end of the first semester
i.) On-campus resident
j.) Receiving Federal Financial Aid
90
k.) Receiving Scholarships
l.) Receiving Loans
m.) If student took Pre-Calculus
n.) Which Calculus I course was taken
o.) Grade in Calculus I
p.) If Calculus I was repeated
q.) Grade in Physics I
r.) If Physics I was repeated
s.) Grade in Physics I Lab
t.) If Physics I Lab was repeated
Summary of Methodology
The target population for this study was defined as the first-time in college (FTIC)
traditional-age undergraduate students who declared engineering as their major when they were
admitted at a small private university which is located in the southeastern portion of the United
States. The accessible population was defined as the FTIC traditional age undergraduate
students who declared engineering as their major when they were admitted during the fall 2005
and 2006 semesters at one small private university in the southeastern portion of the United
States. The sample for this study was defined as 100% of the defined accessible population who
entered during the fall 2005 and 2006 semesters as engineering majors at the selected small
private university located in the southeastern portion of the United States.
The researcher defined traditional age undergraduates as those who graduated from high
school, applied for admission, and were accepted into the small private university that is located
in the southeastern portion of the United States for the Fall 2005 and Fall 2006 semesters. This
set of 92 students served as the accessible population for this study, and the sample was defined
91
as 100% of the accessible population. Out of the 92 students who were selected as the sample
for this study, at fifth semester, 49 persisted in an Engineering major. Of the 43 remaining, 28
left the university and 15 persisted in non-engineering majors. To collect the data, the researcher
transferred the information from the Office of Undergraduate Admissions‘, Student Financial
Services‘, the Registrar‘s, and Academic Services‘ databases for the selected small private
university and downloaded it into her computerized recording form that served as the instrument.
Based on the review of relevant literature, as well as information obtained by the dean of
the School of Engineering at the small private university that is located in the southeastern
portion of the United States, the researcher selected the specific variables for this study.
Permission to complete this study was received from the University‘s administration, as well the
Institutional Review Board (IRB). The researcher worked closely with Information Technology
Services at the university to retrieve the variables from the selected databases in order to
complete the study.
Using descriptive statistics, the researcher analyzed the persisters and non-persisters in
objectives one and two. She used frequencies and percentages for variables that were measured
on a categorical scale, while means and standard deviations were used for variables that were
measured on interval scales. To complete the third objective, comparing the two groups, the chi-
square test of independence (for variables measured on a categorical scale of measurement) and
the independent t-test test (for variables measured on an interval scale of measurement) were
used. An a‘ priori significance level of less than .05 was used to determine if the independent
variables were statistically significant.
Multiple discriminant analysis was used to complete the fourth objective of finding a
model that could accurately explain the retention status of FTIC traditional age students who
persist in Engineering. Persistence, the dependent variable in the analysis, was measured as a
92
dichotomous variable (was the student a persister or non-persister in Engineering). The
independent variables were either entered as dichotomous or continuous. An a‘ priori
significance level of less than .05 was used to determine if the independent variables were
statistically significant.
Summary of Major Findings
Below are the findings of the study by objective.
Objective One
The first objective was to describe the 49 students who declared Engineering as their
major when they were admitted to the University and persisted in that major to their fifth
semester at a small private university that is located in the Southeastern portion of the United
States.
The average age of the FTIC traditional age students who persisted in Engineering to
their third term was 17.86 (SD=.500). There were more males (n=43, 87.8%) than females (n=8,
12.2%). Of the 43 for whom the researcher had their race, White—Non-Hispanic made up
74.4% (n=32) of the population, while Asians (n=6, 14.0%) were the second largest group.
Blacks (n=3, 7.0%) and Hispanics (n=2, 4.7%) were the other groups represented in our
population. Thirty six (73.5%) of persisters were on-campus residents, while 13 (26.5%)
commuted to campus. Of the 49 students who persisted, 100% received a scholarship, while
32.7% (n=16) received federal financial aid and 49.0% (n=24) took out student loans in addition
to scholarships.
The 49 persisters‘ Composite ACT scores ranged from 21-31, with the mean being 26.22
(SD=2.294) and 67.3% of the students‘ scores ranging from 25-28. Their Math ACT Scores
ranged from 21-35, with the mean being 28.02 (SD=2.735) and 53.0% of the students‘ scores
ranging from 25-28. Their mean first semester GPA was 3.225 (SD=.455), ranging from 2.1 to
93
4.0 and 44.9% of students earning between a 3.0 and 3.49 GPA. Those persisting carried an
average of 16 (SD=1.323) credit hours, with the range being from 12 hours to 19 hours. They
earned 14.78 (SD=2.511) with a range of 6 hours to 18 hours. Forty (81.7%) of the 49 persisters
carried 15-17 hours; however, only 30 (61.2%) earned that number of hours at semester‘s end.
Only 16 of the 49 (32.7%) persisters took a Pre-Calculus course prior to going to their
Calculus I course. Forty-four (89.8%) of the persisters took Calculus I, while five (10.2%) took
Functions and Engineering Calculus I. Only 40 (81.6%) students took their Calculus I course at
the institution, and of those, 13 (32.5%) received an A, 12 (30.0%) received a B, 14 (35.0%)
received a C, and one student (2.5%) received a D. When given the opportunity to repeat the
course and improve his/her grade, only 3 (7.5%) chose to repeat, while thirty-seven (92.5%) did
not.
Forty-five persisters (91.8%) took the first Physics course on campus, while four (8.2%)
transferred in credit. The grades of the forty-five students who took the course at the institution
were 12 A‘s (26.7%), 24 B‘s (53.3%), 8 C‘s (17.8%), and 1 D (2.2%). Six (13.3%) of the 45
students chose to repeat the course; however, 39 (86.7%) retained the grade from their initial
enrollment in the course. Of the 45 who took Physics Lab at the institution, 21 (46.7%) received
an A, 18 (40.0%) received a B, two (4.4%) received a C, and four students (8.9%) received a D.
Two (4.4%) repeated Physics Lab and 43 (95.6%) students kept the grade they received on their
initial attempt.
Objective Two
The second objective was to describe FTIC traditional-age undergraduates who did not
persist for their third year at a small private university in the southeastern portion of the United
States as defined by their finalizing registration (either payment of fees or setting up a payment
plan). Forty-three traditional-age undergraduate students met this criteria.
94
The average age of the students who were non-persisters (n=43) was 18.05 (SD = .575),
with the youngest student being 16 and the oldest being 19. Thirty-two (74.4%) of the 43 non-
persisters were male, and 11 (25.6%) were female. Of the 41 for whom the researcher had their
race, White—Non-Hispanic made up 82.9% (n=34) of the population, while Blacks (n=5,
12.2%) were the second largest group. Asians (n=2, 4.9%) were the other group represented in
the population. Twenty-three (53.5%) of non-persisters were on-campus residents, while 20
(46.5%) commuted to campus. Of the 43 students who persisted, 100% received a scholarship,
while 27.9% (n=12) received federal financial aid and 60.5% (n=26) took out student loans in
addition to scholarships.
The 43 non-persisters‘ ACT scores ranged from 21-31, with the mean being 26.12
(SD=2.97) and 46.5% of the students‘ scores ranging from 25-28. The 43 non-persisters‘ Math
ACT scores ranged from 18-35, with the mean being 27.05 (SD=3.773) and 41.9% of the
students‘ scores ranging from 25-28. Their mean first semester GPA was 3.23 (SD=.455),
ranging from 2.1 to 4.0 and 44.90% of students earning between a 3.0 and 3.49 GPA. Those not
persisting carried an average of 15.67 (SD=1.886) credit hours, with the range being from 12
hours to 19 hours. They earned 12.74 (SD=4.665) with a range of 0 hours to 19 hours. Twenty-
six (60.5%) of the 43 non-persisters carried 15-17 hours; however, only 18 (41.9%) earned that
number of hours at semester‘s end.
Only 13 of the 43 (32.7%) non-persisters took a Pre-Calculus course prior to going to
their Calculus I course, and only 35 of the non-persisters took Calculus. Thirty (85.7%) of the
non- persisters took Calculus I, while five (14.3%) took Functions and Engineering Calculus I.
Of the 35, only 27 (62.8%) students completed their Calculus I course at the institution, and three
(7.0%) withdrew from the course before semester‘s end. Of the completers (n=27), three
(11.1%) received an A, four (14.8%) received a B, 12 (44.4%) received a C, four (14.8%)
95
received a D, and four (14.8%) students received an F. When given the opportunity to repeat the
course and improve his/her grade, only two (6.7%) chose to repeat, while twenty-eight (93.3%)
did not.
Sixteen non-persisters (37.2%) took the first Physics course on campus, while 27 (62.8%)
never enrolled. The grades of the 27 students who took the course at the institution were three
A‘s (18.8%), three B‘s (18.8%), five C‘s (31.2%), two D‘s (12.4%), and three F‘s (18.8). Two
(12.5%) of the 16 students chose to repeat the course; however, 14 (87.5%) retained the grade
from their initial enrollment in the course. Of the 15 who took Physics I Lab at the institution,
five (33.3%) received an A, four (26.7%) received a B, three (20.0%) received a C, and three
(20.0%) students received an F. One (6.7%) repeated Physics Lab and 14 (93.3%) students kept
the grade they received on their initial attempt.
Objective Three
The third objective of this study was to compare the FTIC traditional-age undergraduates
who persisted in Engineering for their third year at a small private university in the southeastern
portion of the United States as defined by their finalizing registration (either payment of fees or
setting up a payment plan) to those who did not persist in Engineering. The researcher used an
a‘ priori significance level of <.05 to determine if the groups of students differed significantly.
In comparing the groups on the 20 variables, six were found to be significantly related to a
student‘s persistence in Engineering. The significant variables were:
1.) Credits earned by the student first semester
2.) GPA at the end of the first semester
3.) Grade in Calculus I
4.) Grade in Physics I
5.) Grade in Physics Lab
96
6.) On-campus resident
In comparing the persisters with the non-persisters, there was a statistically significant
difference on the variable of credit hours earned during the first semester (t62.524=-2.549, p=.013).
The mean number of hours earned by the students who persisted was 14.78 (SD=2.511), and the
mean number of hours for the non-persisters was 12.74 (SD=4.665). The GPAs earned at the
end of the first semester was another variable where the persisters and non-persisters were
statistically significant (t58.221=-4.712, p=<.001). The mean GPA of the persisters was 3.22702
(SD=.459928), and the mean GPA of the non-persisters was 2.46419 (SD=.970113).
The difference in the grades earned by persisters and non-persisters in Calculus, Physics,
and Physics Lab were statistically significant. In Calculus, the mean grade of those who
persisted was 2.92 (SD=.888), and that of the non-persisters was 1.93 (SD=1.174) (t65=-3.962,
p=<.001). The mean Physics grade of those who persisted was 3.04 (SD=.737), and that of the
non-persisters was 2.06 (SD=1.389) (t18.093=-2.696, p=.015). The mean grade for the
accompanying Physics Lab was 3.24 (SD=.908) for the persisters, and that of the non-persisters
was 2.53 (SD=1.506) (t58=-2.202, p=.032).
Sixty one percent (n=59) of on-campus residents did persist to their fifth semester;
however, thirty-nine percent (n=23) were non-persisters. In contrast, 20 of the 33 (60.6%) of the
commuters did not persist, and 13 (39.4%) did. The researcher found this variable to be
statistically significant, and a student‘s residence and persistence were dependent (X2
1, 92=3.975,
p=.046).
97
Objective Four
The fourth objective of the study was to determine if a model existed that could
accurately explain the retention status of the FTIC traditional-age undergraduates who persisted
for their third year at a small private university in the southeastern portion of the United States as
defined by their finalizing registration (either payment of fees or setting up a payment plan) to
those who did not persist. A total of four independent variables (gender, Math ACT/SAT score,
GPA at the end of the first semester, and grade in Calculus I) entered the discriminant model,
producing a canonical correlation of Rc = .578. The combination of these four variables in the
exploratory model correctly classified 79.1% of the original grouped cases. Using this predictive
model, there was a 58.2% improvement over chance that the FTIC traditional age undergraduates
could be classified as persisters or non-persisters in Engineering.
Conclusions, Implications, and Recommendations
Based on the findings of this study, the researcher derived the following conclusions,
implications, and recommendations:
Conclusion One
The researcher found a model that increases her ability to correctly classify students who
enter the institution as Engineering majors on whether or not they will be retained in that major
at a small private institution located in the southeastern portion of the United States. This
conclusion is based on the finding that gender, Math ACT/SAT score, GPA at the end of the first
semester, and grade in Calculus I in the discriminant model enabled the researcher to classify
79.1% of the participants.
The variables included in this model were a combination of factors that were both
anticipated and not anticipated to contribute to the significant model based on previous studies,
as well as preliminary research included in this study. For example, it was expected that the
98
grade that the student received in Calculus I would contribute to the model. Engineers need
math, as well as technology and physical sciences, to be successful (National Science Board,
2003). Success in the first math course of the Engineering curriculum is indicative of a student‘s
ability to persist. However, based on Kauffman et al‘s study in 2007, where they said that
standardized test scores (both verbal and math) were not statistically significant in predicting
success, the researcher was not anticipating to find Math ACT/SAT score in the model.
The model did classify 79.1% correctly; however, there were 20.9% that were not
classified correctly; therefore, the researcher recommends enhancing the model through further
study to correctly classify more students who attend a small private institution in the southeastern
portion of the United States as persisters or non-persisters to their third year. She believes that
by refining some of the variables used in this study and including them in the model, the
researcher would be able to better predict third year enrollment of Engineering students.
One variable that should be revisited and possibly refined is the student‘s financial aid
portfolio. Although Tinto (1993) initially believed that even though a student said he/she was
leaving an institution because of finances, there was another underlying issue. Research by
Schuh (2005), St. John et al (2000), and Hossler (2000), tell a different story. Financial aid
policies and packages have an effect on persistence and retention. In this study, the researcher
included whether or not the student received scholarships, Federal Financial Aid, and loans;
however, she did not include the amount of each; she did not analyze the portfolio. Since 100%
of persisters and non-persisters received some scholarship monies at the institution, the amount
of the scholarship becomes important.
Since the student‘s Math ACT/SAT score is included in the model, the researcher
believes that knowing the last Math course that a student took in high school and the grade
he/she earned would be variables worth analyzing. There is research to support high school GPA
99
as a predictor for persistence in college (Astin, 1997; Suresh 2006; Kauffmann, 2007), and
because Engineering students take multiple Math courses as a part of their curriculum, it is worth
further research.
Conclusion Two
Overall, the non-persisting students who entered the small private university as
Engineering majors did so with strong ACT scores, both composite and Math, which indicates
strong pre-college academic success. This conclusion is based on the mean ACT score of the
non-persisters being 26.12 (SD=2.97), with 46.51% of the students‘ scores ranging from 25-28.
Specifically, with Math, the non-persisters‘ mean Math ACT score was 27.05 (SD=3.773) with
41.86% of the students‘ scores ranging from 25-28. These scores compared well with the
students who persisted in Engineering.
Because the non-persisters in Engineering may have been persisters at the institution, it is
difficult to compare the researcher‘s findings of strong pre-college academic achievement for
non-persisters with the research of Astin (1993) and Pascarella & Terenzini (2005), which is
based not on program retention but on college retention. Their studies indicate that pre-college
academic achievement (as measured by ACT/SAT) influences a student‘s persistence and
college retention.
Based on this research, the researcher recommends exit interviews with students as they
change majors or leave the institution. Interviews would allow college administrators and future
researchers to understand why students do not persist in Engineering, even if they had a strong
pre-college academic background. Did the student feel unprepared for the academic rigor of
Engineering? Was the student aware of what Engineering entailed? Was the student integrating
academically and socially? Those questions can only be answered by the student.
100
Once the administrators have information from the exit interviews, they can work to
implement programs to assist students in academic and/or social integration. The School of
Engineering should provide supplementary instruction, especially in Calculus and Physics, for
students who are having difficulty integrating academically and a school-wide student
organization that will assist with social integration.
The researcher further recommends the implementation of a learning community, a living
and learning environment that combines social and academic integration for the students. The
living component of a learning community allows Engineering majors to live in the same
residence hall, and this close proximity gives students the opportunity to socially integrate with
their academic peers. It also extends the time that students are on-task through ancillary
programs that support what is happening in the classroom; the learning environment extends
from the co-hort of courses, which would include Calculus I and Physics I (with the lab), to the
residence. According to Engstrom (2008), learning communities make it more convenient for
students to form study groups, access tutoring, and seek support services. This engagement with
Engineering peers and faculty provides positive outcomes that lead to student persistence (Astin,
1993; Engstrom, 2008; Pascarella and Terenzini, 2003; Tinto, 1993).
Conclusion Three
Students who lived on campus were more likely to be retained in Engineering than those
who commuted to campus. This conclusion is based on 61.0% of on-campus residents persisting
to their fifth semester. In contrast, 39.4% of the commuters persisted. Astin‘s 1993 research
indicated that living in a residence hall positively affected a student‘s willingness to persist in the
same college and attain the bachelor‘s degree. Based on the findings of this research, as well as
that of Astin, there is a need for institutions to either implement programs that will require
101
students to live on campus, as some institutions do, or to make living on campus more attractive
to students, either with programs or with minimal costs.
One way to attract students to living on-campus is through learning communities that are
living and learning environments. Tinto (2000) said that learning communities go beyond a
cluster of classes. It is shared experiences, and when those experiences can marry what is
happening in the classroom with discussions and activities in the residence hall, the experience
allows for both academic and social integration for the student. Creating a learning
community/living and learning environment for specific majors could help retention within those
programs, and that is attractive to department chairs and deans.
The cost of living in a residence hall is often a deterrent for students who live in the
vicinity of the institution. Enrollment managers will want to make living on campus as
financially attractive as possible for those students, as having the students as residents positively
affects their college retention at the university and in specific programs.
Conclusion Four
The students who did not persist in Engineering had lower grades in their Calculus and
Physics courses. The mean Calculus grade of the non-persisters was 1.93 (SD=1.174), and of
those who persisted, the mean was 2.92 (SD=.888). In Physics, the mean grade of the non-
persisters was 2.06 (SD=1.389), while those who persisted had a mean of 3.04 (SD=.737).
Seidman (2005b) indicated that academic supports, such as supplemental instruction, would fill
the gap and assist students in integrating academically and in their retention. Suresh (2006)
called these courses barrier courses. This researcher likes to call them foundation courses, as the
skills taught in Calculus and Physics provide the basis for Engineering curriculum. Whether
called barrier or foundational, based on this research, they are ―at-risk courses‖ for students;
102
therefore, supplemental instruction would allow for students to work cooperatively to enrich
what is taught in the class. This would positively affect students‘ retention within Engineering.
Conclusion Five
The majority of persisters in Engineering are white males. Over half of the males
(57.3%) who were included in the population persisted; however, 64.7% of females did not.
White—non-hispanics made up 74.4% of persisters, while Asians were 14.0%, Blacks made up
7.0%, and Hispanic students composed 4.7% of the sample. According to Noeth et al (2003),
minorities will make up almost 60% of the population increase by 2010. Davis and Finelli
(2007) say that the engineer will compete in a more global market and should be diverse in
background, culture, and approach. If this is to happen, Engineering programs must retain
historically underrepresented populations. Programs need women and minorities. In order to
retain these students, Engineering programs must recruit them. The researcher recommends an
aggressive recruitment program to attract minority students. Students will integrate academically
and socially when they are with their peers (Tinto, 2000; Astin, 1993; Pascarella & Terenzini,
2005), so it is necessary to build diversity within the Engineering student population to make
Engineering more appealing for the underrepresented students. If the university and School of
Engineering are to be successful in recruiting underrepresented students, the minority students
need to be able to see themselves in this environment in order to be comfortable in that
environment.
Next, the researcher recommends a qualitative research study with non-white students
and women to find out why they leave Engineering or why they stay. By using focus groups of
peristers and non-persisters, the administration of the institution can see what does and does not
work to bring underrepresented students to the Engineering major, as well as what is necessary to
keep the students there. It is beneficial to the university to find out the factors pushing students
103
forward or pulling them back. Academic, social, financial, and environmental factors will
influence men/women and white/non-white differently (Nora, Barlow, & Crisp, 2005). The
researcher recommends that once the institution knows the factors, it begins addressing them
with support services.
Conclusion Six
Students who persisted in Engineering had higher GPAs at the end of the first semester
than students who did not persist. This conclusion is based on comparing the mean GPA of the
persisters [3.22702 (SD=.459928)] to that of the non-persisters [2.46419 (SD=.970113).] These
findings are inconsistent with previous research by Adelman (1998), who said that students do
not leave Engineering due to grade but due to academic dissatisfaction. It is consistent, however,
with research (Bean, 1980; Lutta, 2008) on college-wide retention.
Good grades are often indicative of academic integration. Students are connecting with
the content, their professors, etc. For the large percentage of non-persisters, there needs to be
programs that can assist with academic integration. Seidman (2005b) suggested academic
services such as supplemental instruction and tutoring. Engineering based first year transition
programs and orientation courses, academic advising with an Engineering faculty member, and a
formalized early warning system for all faculty, staff, and students to use are interventions that
can possibly catch a student before he/she walks out the door or changes his/her major (Habley
& McClanahan, 2004b).
This researcher recommends that the university establish a formalized early warning
policy so that faculty, staff, and students can report concern for struggling students who are not
integrating academically. Since most freshmen, regardless of the degree program, take
foundation courses and general education requirements, it is likely that the non-persisters with a
low GPA are struggling in non-major based courses. The administration of the university should
104
meet with the identified at-risk students individually to make them aware of available support
services.
Recognizing that not all struggling students will be reported through a formalized early
warning system, the researcher recommends that the institution intervene at mid-term with all
students who have failing grades. This intervention can be done by requiring that these students
speak with their academic advisor. By looking at grades and speaking with students, the
administration can find out where the deficiencies are. Based on that information, the researcher
recommends that the university establish a student development center to provide programming,
such as time management and study skills seminars, to help failing students better adjust to
college life. The students will be referred to this center by faculty and advisors.
105
References
Adelman, C. (1998). Women and Men of the Engineering Path: A model for Analyses of
Undergraduate Careers. U.S. Department of Education. PLLI-98-8055. Retrieved from at
www.erc-assoc.org/nsf/engrg_paths/
Astin, A. (1993). What Matters In College: Four Critical Years Revisited. San Francisco, CA:
Jossey-Bass.
Barrick, R. K. & Warmbrod, J. R. (1988, December). Discriminant analysis. Packet presented at
a workshop in the Department of Agricultural Education at The Ohio State University,
Columbus, OH.
Baum, S. & Payea, K. (2004). Education Pays: The Benefits of Higher Education for
Individuals and Society. Retrieved 10 October 2008 from www.collegeboard.com.
Bean, J. (1980). Dropouts and turnover: The synthesis and test of causal model of student
attrition. Research in Higher Education, 12(2), 155-187.
Bean, J. & Eaton, S. (2000). A Psychological Model of College Student Retention. In John
Braxton (ed)., Reworking the Student Departure Puzzle. 48-59. Nashville, TN: Vanderbilt
University Press.
Bean, J. (2005). Nine Themes of College Student Retention. In A. Seidman (ed), College
Student Retention. 215-243. Westport, CT: American Council on Education.
Berger, J. & Lyon, S. (2005). Past to Present: A Historical Look at Retention. In A. Seidman
(ed), College Student Retention. 1-29. Westport, CT: American Council on Education.
Borrego, M., Padilla, M., Zhang, G., Ohland, M., & Anderson, T.. (2005, October). Graduation
Rates, Grade-Point Average, and Change of Major of Female and Minority Students
Entering Engineering. Paper presented at the 35th
ASEE/IEE Frontiers in Education
Conference, Indianapolis, IN.
Braxton, J. (2000). Introduction. In J. (ed), Reworking the Student Departure Puzzle. 1-8.
Nashville, TN: Vanderbilt University Press.
Braxton, J. & Lee, S. (2005). Toward Reliable Knowledge about College Student Departure. In
A. Seidman (ed), College Student Retention. 107-127. Westport, CT: American Council on
Education.
Braxton, J., Jones, W., Hirschy, A., & Hartley, H. (2008, Fall). The Role of Active Learning in
College Student Persistence. In J. Braxton (ed), New Directions for Teaching and Learning:
The Role of the Classroom in College Student Persistence, 115, 71-83. San Francisco, CA:
Jossey-Bass.
Bureau of Labor and Statistics. (2008). Occupational outlook handbook (2008-09 ed.).
Washington, DC. Retrieved 8 August 2009 from http://www.bls.gov/oco/ocos027.
htm#projections_data
Chickering, A. & Gamson, Z. (1987, March). Seven Principles for Good Practice in
Undergraduate Education. AAHE Bulletin, 3-7.
106
Davis, C. & Finelli, C. (2007, Fall). Diversity and Retention in Engineering. New Directions for
Teaching and Learning, 111, 63-70. Retrieved 13 May 2009 from
www.interscience.wiley.com.
Day, J. & Newburger, E. (2002, July). The Big Payoff: Educational Attainment and Synthetic
Estimates of Work-Life Earnings. Retrieved 10 April 2009 from
http://www.census.gov/prod/2002pubs/p23-210.pdf.
Engstrom, C. (2008, Fall). Curricular Learning Communities and Underprepared Students:
How Faculty Can Provide A Foundation for Success. In J. Braxton (ed), New Directions for
Teaching and Learning: The Role of the Classroom in College Student Persistence, 115, 1-
19. San Francisco, CA: Jossey-Bass.
Habley, W. & McClanahan, R. (2004a). What Works in Student Retention? All Survey
Colleges. Iowa City, IA: ACT, Inc. Retrieved from www.act.org.
Habley, W. & McClanahan, R. (2004b). What Works in Student Retention? Four-Year Private
Colleges. Iowa City, IA: ACT, Inc. Retrieved from www.act.org.
Hagedorn, L. (2005). How to Define Retention. In A. Seidman (ed), College Student Retention.
89-105. Westport, CT: American Council on Education.
Hair, J.F., Anderson, R. E., Tatham, R. L., & Black, W. C. (1998). Multivariate data analysis
(5th
Ed.). Upper Saddle River, NJ: Prentice Hall.
Hossler, D. (2000, Spring). The Role of Financial Aid in Enrollment Management. New
Directions for Student Services, 89, 77-90.
Kauffmann, P., Abdel-Salam, T., & Garner, J. (2007). Predictors of Success in the First Two
Years: A Tool for Retention. American Society for Engineering Education. Retrieved from
www.asee.org.
Kuh, G., Kinzie, J., Schuh, J., Whitt, E., and Associates. (2005). Student Success in College:
Creating Conditions That Matter. San Francisco, CA: Jossey-Bass.
Lau, L. (2003). ―Institutional Factors Affecting Student Retention,‖ Education, fall (124).
Lavergne, G. and Walker, B. (2001). Developing a Concordance Between the ACT Assessment
and the SAT I: Reasoning Test for The University of Texas at Austin. Austin, Texas:
University of Texas, Office of Admissions Research.
Lutta, J. (2008). Factors that Influence Traditional-Age College Students to Re-enroll in Their
Third Year at a Research Extensive University in the Southern Region of the United States.
(Doctoral dissertation, Louisiana State University-Baton Rouge).
McClanahan, R. (2004). Appendix 1: Review of Retention Literature. In W. Habley & R.
McClanahan (eds), What Works in Student Retention? Iowa City, IA: American Testing
Program. Retrieved from www.act.org.
Murtaugh, P., Burns, L., and Schuster, J. (1999). Predicting the Retention of University
Students. Research in Higher Education, 40(3), pg. 355-371.
107
National Science Board. (2003). The Science and Engineering Workforce: Realizing
America‘s Potential. Arlington, VA: National Science Foundation. Retrieved from
http://nsf.gov/nsb/ documents/2003/nsb0369/nsb0369.pdf.
Noeth, R., Cruce, T., and Harmston, M. (2003). Maintaining a Strong Engineering Workforce:
ACT Policy Report. Iowa City, IA: ACT, Inc. Retrieved from www.act.org.
Nora, A., Barlow, E., & Crisp, G. (2005). Student Persistence and Degree Attainment Beyond
the First Year in College. In A. Seidman (ed), College Student Retention. 129-153. Westport,
CT: American Council on Education.
Ohland, M., Sheppard, S., Lichtenstein, G., Eris, O., Chachra, D., & Layton, R. (2008, July).
Persistence, Engagement, and Migration in Engineering Programs. Journal of Engineering
Education. 259-278.
Pascarella, E., Seifert, T., & Whitt, E. (2008, Fall). Effective Instruction and College Student
Persistence: Some New Evidence. In J. Braxton (ed), New Directions for Teaching and
Learning: The Role of the Classroom in College Student Persistence, 115, 55-70. San
Francisco, CA: Jossey-Bass.
Pascarella, E. & Terenzini, P. (2005). How College Affects Students: A Third Decade of
Research. San Francisco, CA: Jossey-Bass.
Peterfreund, A., Rath, K., Xenos, S., & Bayliss, F. (2008). The Impact of Supplemental
Instruction on Students in STEM courses: Results from San Francisco State University.
Journal of College Student Retention, 9(4), 487-503.
Pomalaza-Raez, C, & Groff, B. (2003, January). Retention 101: Where Robots Go…Students
Follow. Journal of Engineering Education, 1-6.
Schuh, J. (2005). Finances and Retention: Trends and Potential Implications. In A. Seidman
(ed), College Student Retention. 277-293. Westport, CT: American Council on Education.
Seidman, A. (2005a). Introduction. In A. Seidman (ed), College Student Retention. xi-xiv.
Westport, CT: American Council on Education.
Seidman, A. (2005b). Where We Go From here: A Retention Formula for Student Success. In
Alan Seidman (ed), College Student Retention. 295-316. Westport, CT: American Council
on Education.
St. John, E. (2000, Spring). The Impact of Student Aid on Recruitment and Retention. New
Directions for Student Services, 89, 61-74.
St. John, E., Cabrera, A., Nora, M., and Asker, E. (2000). Economic Influences on Persistence
Reconsidered: How can Finance Research Inform the Reconceptualization of Persistence
Models. In John Braxton (ed)., Reworking the Student Departure Puzzle. 29-47, Nashville,
TN: Vanderbilt University Press.
Suresh, R. (2006). The Relationship Between Barrier Courses and Persistence in Engineering.
Journal of College Student Retention, 8(2), 215-239).
108
Tinto, V. (1975). Dropout from higher education: A theoretical synthesis of recent research.
Review of Educational Research, 45(1), 89-125.
Tinto, V. (1993). Leaving College. (2nd
ed.) Chicago: University of Chicago Press.
Tinto, V. (2000). Linking Learning and Leaving: Exploring the Role of the College Classroom
in Student Departure. In J. Braxton (ed), Reworking the Student Departure Puzzle. 81-94.
Nashville, TN: Vanderbilt University Press.
Tinto's Interactionalist Theory. (2004, February). ASHE-ERIC Higher Education Report,
Retrieved May 26, 2009, from Academic Search Premier Database.
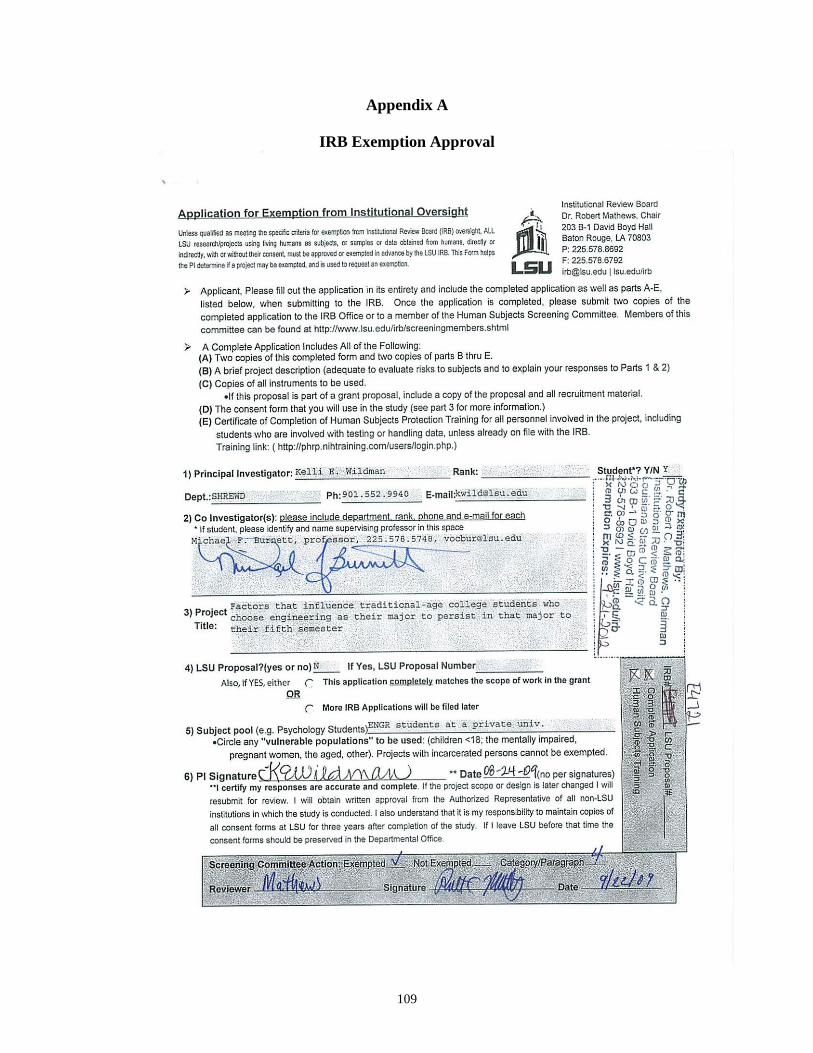
109
Appendix A
IRB Exemption Approval
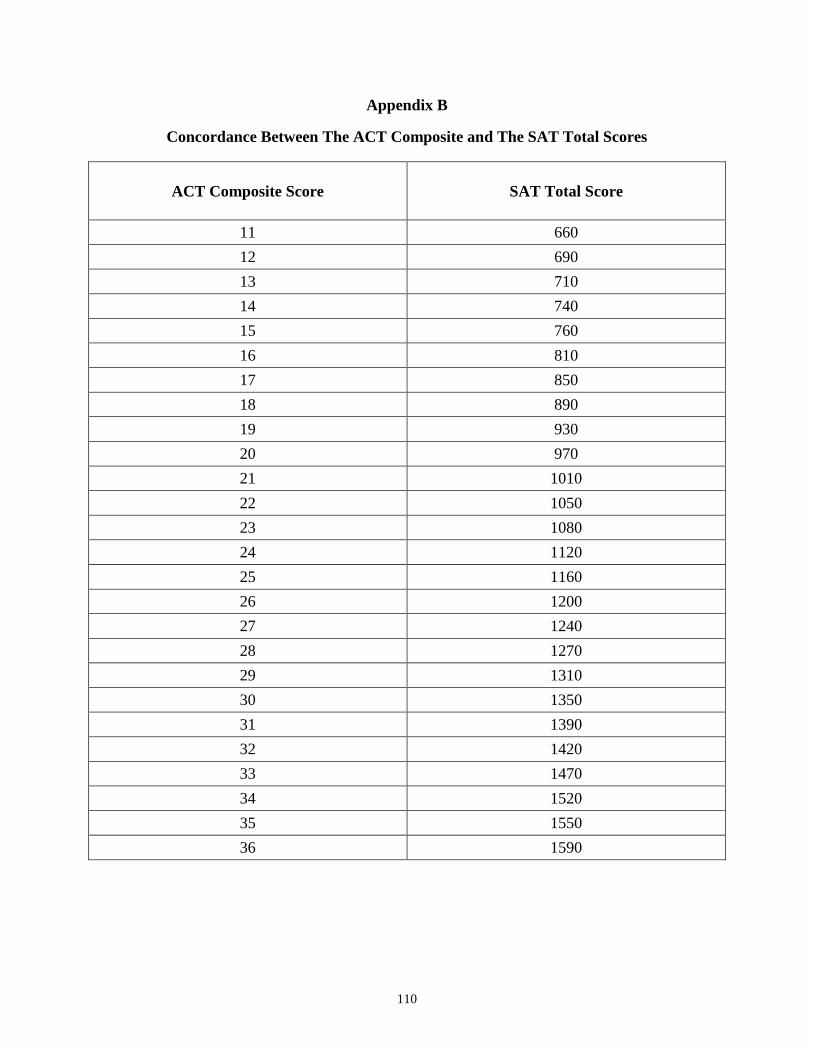
110
Appendix B
Concordance Between The ACT Composite and The SAT Total Scores
ACT Composite Score SAT Total Score
11 660
12 690
13 710
14 740
15 760
16 810
17 850
18 890
19 930
20 970
21 1010
22 1050
23 1080
24 1120
25 1160
26 1200
27 1240
28 1270
29 1310
30 1350
31 1390
32 1420
33 1470
34 1520
35 1550
36 1590
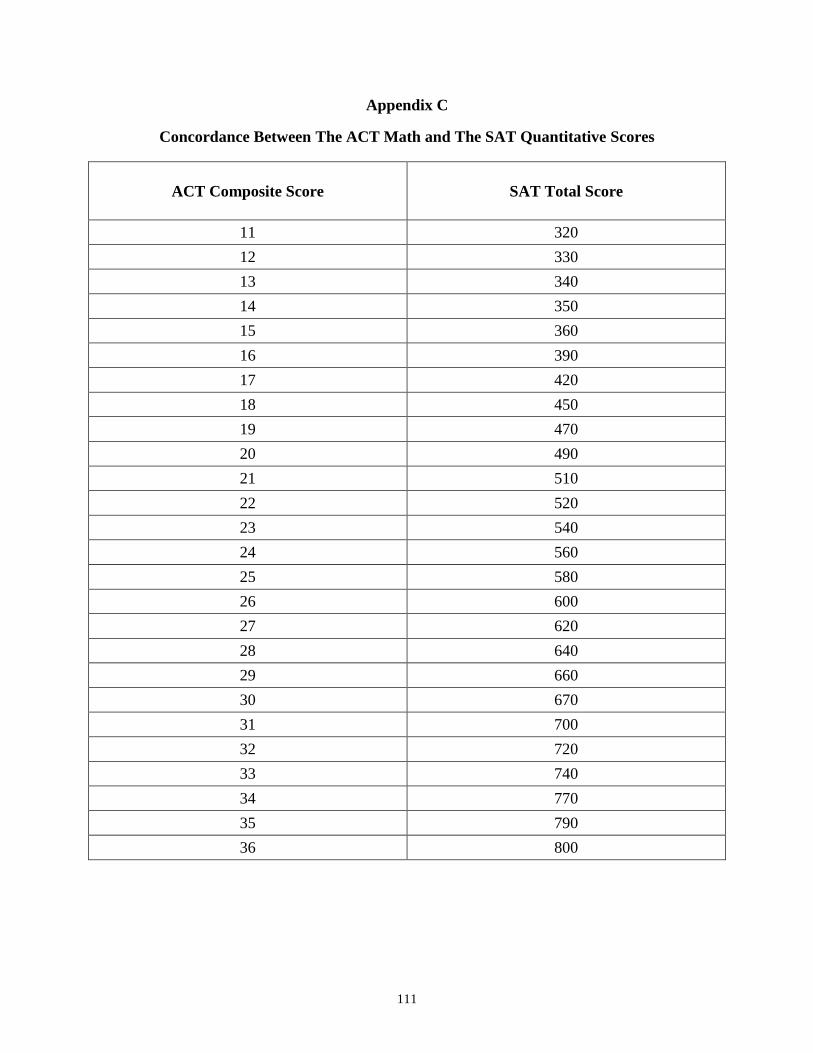
111
Appendix C
Concordance Between The ACT Math and The SAT Quantitative Scores
ACT Composite Score SAT Total Score
11 320
12 330
13 340
14 350
15 360
16 390
17 420
18 450
19 470
20 490
21 510
22 520
23 540
24 560
25 580
26 600
27 620
28 640
29 660
30 670
31 700
32 720
33 740
34 770
35 790
36 800
112
Vita
Kelli Elaine Wildman was born to Janice Elaine Lively Wildman and Edwin Dwayne
Wildman in June 1974. Upon graduation from Zachary High School in May 1992, she
entered LSU as an English major with a concentration in creative writing and completed the
degree in May 1996. That fall, she entered LSU‘s master‘s program in curriculum and
instruction through the College of Education, and she graduated in December 1997. After
student teaching at Central High School in spring 1998, she moved to Memphis, Tennessee,
to teach secondary English at Kirby High School that fall. The following year, she
transferred to Germantown High School where she taught all levels of English for five years.
In December 2004, Kelli left secondary education and accepted a position at the E. J.
Ourso College of Business at Louisiana State University where she served as academic
advisor, coordinator for Freshman Year Experience, associate rector for the Business
Residential College, and instructor of BADM 1000. During her time as an employee of LSU,
she began her doctorate from the School of Human Resource Education and Workforce
Development under the direction of Dr. Michael Burnett. Kelli left her alma mater in July
2008 to become dean of Academic Services at Christian Brothers University in Memphis,
Tennessee. Kelli holds professional memberships in Gamma Sigma Delta (Agricultural
Honors Society), Delta Sigma Pi (Business Fraternity), and NACADA (National Association
of Academic Advisors).