Embed Size (px)
Citation preview
FACTORS THAT INFLUENCE FINANCIAL PERFORMANCE OF PRIVATE
SOLID WASTE MANAGEMENT COMPANIES IN NAIROBI COUNTY
PHILOMENA WAIRIMU MUNGAI
D61/75857/2012
A RESEARCH PROJECT SUBMITTED IN PARTIAL FULFILMENT OF THE
REQUIREMENTS FOR THE AWARD OF MASTER OF BUSINESS
ADMINISTRATION DEGREE OF THE UNIVERSITY OF NAIROBI
OCTOBER 2014
1
DECLARATION
Student Declaration
This research project is my original work and has never been presented for a Degree in any other
University or institution for any academic award.
Signature ……………………………… Date………………………………..
Philomena Wairimu Mungai
Reg. no.: D61/75857/2012
This research project has been submitted for examination with my approval as University
Supervisor.
Signature ……………………………… Date ………………………………..
Dr. J. O. Aduda,
Project Supervisor
Dean School of Business, University of Nairobi
2
ACKNOWLEDGEMENT
It has been an exciting and instructive study period in the University of Nairobi and I feel
privileged to have had the opportunity to carry out this study as a demonstration of knowledge
gained during the period studying for my master’s degree. With these acknowledgments, it
would be impossible not to remember those who in one way or another, directly or indirectly,
have played a role in the realization of this research project. Let me, therefore, thank them all
equally. First, I am indebted to the all-powerful GOD for all the blessings he showered on me
and for being with me throughout the study. I am deeply obliged to my supervisor Dr. Josiah
Aduda for his exemplary guidance and support without whose help; this project would not have
been a success. Finally, yet importantly, I take this opportunity to express my deep gratitude to
my loving family, and friends who are a constant source of motivation and for their never ending
support and encouragement during this project.

3
DEDICATION
I dedicate this study to my dear family members and friends for all the support they gave me all
the time as I prepared and worked on this project.
4
ABSTRACT
Company’s performance can be evaluated in three dimensions. The first dimension is company’s productivity, or processing inputs into outputs efficiently. The second is profitability dimension, or the level of which company’s earnings are bigger than its cost. The third dimension is market premium, or the level at which company’s market value exceeds its book value. Return on assets (ROA) determines an organisation’s efficiency in ability to make use of its assets and return on equity (ROE) reveals the return investors expect to earn for their investments and return on sales (ROS) reveals how much a company earns in reaction to its sales. The advantages of financial measures are the simplicity of calculation and also that their definitions are widely agreed. This was done by answering the question: what are the factors influencing financial performance of Private Solid Waste Management companies in Nairobi County? A descriptive research design was used to analyze the factors that influence financial performance of Private Solid Waste Management companies in Nairobi County. The population of interest in this study constituted all the 56 private Solid Waste Management operators registered in Nairobi County for the period of three years from 2011 to 2013. Secondary financial data sources was used for the study, where annual financial reports of each firm was used over the three year period where profitability was extracted and used as a measure of financial performance. The findings showed that leverage is statistically significant at 5% level of significance in explaining the variation in financial performance of private waste management company in Nairobi County. A unit increase in leverage ratio will lead to a unit decrease in financial performance of solid waste management company in Kenya. Liquidity ratio is statistically significant in influencing the variation in the profitability of the solid waste management companies. A unit increase in liquidity ratio will lead to high units increase in financial performance of solid waste management companies in Nairobi County. Regression coefficient of the size of the company is positively and significantly related to the financial performance of solid waste management companies. A unit increase in the company size will lead to positive units increase in the financial performance of the waste management company. The study concludes that financial performance of private solid waste companies in Nairobi County is influenced by leverage, liquidity, age and size of these companies. The study recommends that since the ratio of debt-equity has implications on the shareholder’s dividends and risk hence affecting the cost of capital and leverage position of the company, solid waste management companies should reduce debt financing of the companies since companies that are highly leveraged may be at risk of bankruptcy if they are unable to make payments on their debt; they may also be unable to find lenders in the future. Solid waste management companies should also increase their liquid asset base so as to increase the ability of the business to meet financial obligations on time. Solid waste management companies should use an investment fund as liquid assets to finance its activities. Higher liquidity allows an investment fund to deal with unexpected contingencies and to cope with its obligations during periods of low earnings. Larger and mature solid waste management companies are also known to have better and predictable financial performance.
5
TABLE OF CONTENTS
DECLARATION ............................................................................................................................ 1
ACKNOWLEDGEMENT .............................................................................................................. 2
DEDICATION ................................................................................................................................ 3
ABSTRACT .................................................................................................................................... 4
LIST OF TABLES .......................................................................................................................... 8
LIST OF ACRONYMS .................................................................................................................. 9
CHAPTER ONE ........................................................................................................................... 10
INTRODUCTION ........................................................................................................................ 10
1.1 Background of the Study ................................................................................................ 10
1.1.1 Leverage ....................................................................................................................... 10
1.1.2 Liquidity ....................................................................................................................... 11
1.1.3 Company Age .............................................................................................................. 11
1.1.4 Company Size .............................................................................................................. 11
1.1.5 Financial Performance ................................................................................................. 12
1.1.6 Relationship between Selected Factors and Financial Performance ............................ 13
1.1.7 Solid Waste Management Companies in Kenya .......................................................... 14
1.2 Research Problem ........................................................................................................... 17
1.3 Objective of the Study .................................................................................................... 18
1.4 Value of the Study .......................................................................................................... 19
CHAPTER TWO .......................................................................................................................... 20
LITERATURE REVIEW ............................................................................................................. 20
2.1 Introduction ......................................................................................................................... 20
2.2 Theoretical Review ............................................................................................................. 20
2.2.1 Open Systems Theory .................................................................................................. 20
6
2.2.2 Institutional Theory ...................................................................................................... 22
2.2.3 Stakeholder Theory ...................................................................................................... 23
2.3 Other Factors Influencing Financial Performance .............................................................. 25
2.3.1 Management Competence Index .................................................................................. 25
2.3.2 Ownership Structure .................................................................................................... 26
2.4 Tools of Financial Analysis ................................................................................................ 27
2.5 Empirical Review ................................................................................................................ 28
2.6 Summary of Literature Review and Research Gap ............................................................. 31
CHAPTER THREE ...................................................................................................................... 32
RESEARCH METHODOLOGY .................................................................................................. 32
3.1 Introduction ......................................................................................................................... 32
3.2 Research Design.................................................................................................................. 32
3.3 Population ........................................................................................................................... 32
3.4 Data Collection Techniques ................................................................................................ 32
3.5 Data Analysis and Presentation .......................................................................................... 33
3.6 The Study Model................................................................................................................. 33
CHAPTER FOUR ......................................................................................................................... 35
DATA ANALYSIS, RESULTS AND DISCUSSION ................................................................. 35
4.1 Introduction ......................................................................................................................... 35
4.2 Response Rate ..................................................................................................................... 35
4.2 Descriptive Statistics ........................................................................................................... 35
4.3 Correlation Matrix .............................................................................................................. 37
4.4 Pooled OLS Regression Model ........................................................................................... 38
4.5 Summary and Interpretation of Findings ............................................................................ 39
CHAPTER FIVE .......................................................................................................................... 42
7
SUMMARY, CONCLUSION, AND RECOMMENDATIONS .................................................. 42
5.1 Summary ............................................................................................................................. 42
5.2 Conclusion .......................................................................................................................... 42
5.3 Recommendations of Policies and Practices ....................................................................... 43
5.4 Limitation of the Study ....................................................................................................... 44
5.5 Suggestions for Further Study ............................................................................................ 45
REFERENCES ............................................................................................................................. 46
APPENDICES .............................................................................................................................. 58
Appendix i: List of Registered Solid Waste Collection Companies in Nairobi, Kenya ........... 58
8
LIST OF TABLES
Table 4.1: Descriptive Statistics ................................................................................................... 36
Table 4.2: Correlation Matrix ....................................................................................................... 37
Table 4.3: Analysis of Variance (ANOVA) ................................................................................. 38
Table 4.4: Goodness of fit statistic ............................................................................................... 39
Table 4.5: Regression Result ........................................................................................................ 39
9
LIST OF ACRONYMS
CBD : Central Business District
CBO : Community Based organization
GoK : Government of Kenya
KER : Kenya Economic Review
LG : Local Government
NCC : Nairobi City Council
NEMA : National Environment Management Agency
NGO : Non-Governmental Organization
PPP : Public Private Partnership
RAs : Residential Associates
ROA : Return on Assets
ROE : Return on Equity
ROS : Return on Sales
SPSS : Statistical Packages for Social Sciences
SWM : Solid Waste Management
UESP : Urban Environmental Sanitation Project
10
CHAPTER ONE
INTRODUCTION
1.1 Background of the Study
Almajali et al (2012) argues that there are various measures of financial performance. For
instance return on sales reveals how much a company earns in relation to its sales, return on
assets explain a firm’s ability to make use of its assets and return on equity reveals what return
investors take for their investments. Company’s performance can be evaluated in three
dimensions. The first dimension is company’s productivity, or processing inputs into outputs
efficiently. The second is profitability dimension, or the level of which company’s earnings are
bigger than its cost.
The third dimension is market premium, or the level at which company’s market value exceeds
its book value (Walker, 2001). Return on assets (ROA) determines an organisation’s efficiency
in ability to make use of its assets and return on equity (ROE) reveals the return investors expect
to earn for their investments and return on sales (ROS) reveals how much a company earns in
reaction to its sales. The advantages of financial measures are the simplicity of calculation and
also that their definitions are widely agreed.
Traditionally, the success of a company has been evaluated by the use of financial measure
(Tangen, 20023). Four useful measures of profitability are the rate of return on assets (ROA), the
rate of return on equity (ROE) operating profit margin and net income (Hansen and Mowen,
2005).
1.1.1 Leverage
In the quest to optimize their objective, which hinges primarily on quantifiable performance,
financial managers have adopted various capital structures as a means to that goal. A firm can
finance its investment by debt and/or equity. The use of fixed-charged funds, such as debt and
preference capital along with the owner’s equity in the capital structure is described as financial
leverage or gearing (Dare and Sola, 2010).
11
Leverage refers to the proportion of debt and equity in the capital structure of a firm. The
financing or leverage decision is a significant managerial decision because it influences the
shareholder’s return and risk and the market value of the firm. The ratio of debt-equity has
implications for the shareholder’s dividends and risk, this affect the cost of the capital and the
market value of the firm (Pandey, 2007).
1.1.2 Liquidity
Liquidity measures the ability of the business to meet financial obligations as they fall due,
without disrupting the normal, ongoing operations of the business. Liquidity can be analyzed
both structurally and operationally. Structural liquidity refers to balance sheet measures of the
relationships between assets and liabilities and operational liquidity refers to cash flow measures.
Solvency measures the amount of borrowed capital used by the business relative to the amount
of owner’s equity capital invested in the business.
In other words, solvency measures provide an indication of the business’ ability to repay all
indebtedness if all its assets were sold. Solvency measures also provide an indication of the
business’ ability to withstand risks by providing information about the operation’s ability to
continue operating after a major financial adversity (Harrington and Wilson, 1989).
1.1.3 Company Age
Several earlier studies (Batra, 1999; Lumpkin and Dess, 1999) argued that firm age has an
influence on its performance (Sorensen and Stuart, 2000) argued that organisational inertia
operating in old firms tends to make them inflexible and unable to appreciate changes in the
environment. Newer and smaller firms, as a result, take away market share in spite of
disadvantages like lack of capital, brand names and corporate reputation with older firms
(Kakani, Saha and Reddy, 2001).
1.1.4 Company Size
Previous studies in finance have shown that company size can predict the future stock price
(Simerly and Li, 2000). For instance, Hvide and These (2007) in their study concluded that larger
firms have better financial performance. Flamini et al (2009) suggested that bigger firms are
more competitive than smaller firms in harnessing economies of scale in transactions and enjoy a
higher level of profits. Athanasoglou et al (2005) assert that increase in company size increases
12
the performance of the bank. Almajali et al (2012) argued that the size of the firm can affect its
financial performance. However, for firms that become exceptionally large, the effect of size
could be negative due to bureaucratic and other reasons (Yuqi, 2007).
1.1.5 Financial Performance
Literature usually distinguishes between two types of firm performance, financial or economic
performance and innovative performance. Financial or economic performance is often expresses
in terms of growth of sakes, turnover, employment or stock prices (Havnes and Senneseth,
2001), whereas innovative performance is generally expressed in terms of expenditures, patents,
percentages of innovative sales, or self – reported (results of) innovations (Oerlemans et al, 2001;
Hagedoorn and Cloodt, 2003). Although both types of performance are often inter-related
(Damanpou and Evan, 1984), the literature often uses both types of performance as separate
concepts or only focuses on one or two (Knoben and Oerlemans, 2006).
Performance is the outcome of all of the organisation’s operations and strategies (Wheelen and
Hunger, 2002). Measuring performance accurately is critical for the accounting purposes and
remains a central concern for most organisations. Performance measurement systems provide the
foundation to develop strategic plans, assess an organisation’s completion objectives; and
remunerate manager (Ittner and Larcker, 1998).
Although assessment of performance is the past literature is still very important, it is also
complicated (Pont and Shaw, 2003). While consensual measurement of performance promotes
scholarly investigations and can clarify managerial decisions, managers have not been able to
find clear, current and reliable measures of performance on which marketing merit could be
judged. Two approaches have been adopted in the literature to measure financial performance.
The first subject measures the performance of forms based on their own evaluation and
expectations or comparison with their competitors, the second is objective, based on the absolute
measure of performance such as financial ratios (Appiah- Adu, 1998).
Finance is always being disregarded in financial decision making since it involves investment
and financing in the short-term period. Further, it also acts as a restrain in financial performance,
since it does not contribute to return on equity (Refuse, 1996). A well designed and implemented
13
financial management is expected to contribute positively to the creation of a firm’s value
(Padachi, 2006).
Dilemma in financial management is to achieve desired to trade-off between liquidity, solvency
and profitability (Lazaridis et al, 2007). Management of working capital in terms of liquidity and
profitability management is essential for sound financial recital as it has a direct impact on
profitability of the company (Rajesh Ramana and Reddy, 2011). The crucial part in managing
working capital is maintaining its liquidity in day to day operation to ensure its smooth running
and meets its obligations (Eljelly, 2004). Ultimately goal of profitability can be achieved by
efficient use of resources. Financial performance is concerned with maximisation of shareholders
or owners wealth (Panwala, 2009). It can be attained through financial performance analysis.
Financial performance is a measure of a firm’s overall financial health over a given period of
time.
1.1.6 Relationship between Selected Factors and Financial Performance
Liquidity refers to the degree to which debt obligations coming due in the next twelve months
can be paid from cash or assets that was turned into cash. It is usually measured by the current
assets to current liabilities (current ratio). It shows the ability to convert an asset to cash quickly
and reflects the ability of the firm to manage working capital when kept at normal levels. An
investment fund can use liquid assets to finance its activities and investments when external
finance is not available or it is too costly. On the other hand, higher liquidity would allow an
investment fund to deal with unexpected contingencies and to cope with its obligations during
periods of low earnings (Liargovas and Skandalis, 2008).
An unlevered firm is an all-equity firm, whereas a levered firm is made up of ownership equity
and debt. Financial leverage takes the form of a loan or other borrowing (debt), the proceeds of
which are (re)invested with the intent to earn a greater rate of return than the cost of interest. If
the firm’s marginal rate of return on asset (ROA) is higher than the rate of interest payable on the
loan, then its overall return on equity (ROE) was higher than if it did not borrow (Laurent, 2005).
On the other hand, if the firm’s return on assets (ROA) is lower than the interest rate, then its
return on equity (ROE) was lower than if it did not borrow. Leverage allows a greater potential
returns to the investor than otherwise would have been available, but the potential loss is also
14
greater: if the investment becomes worthless, the loan principal and all accrued interest on the
loan still need to be repaid (Andy et al, 2002). This constitutes financial risk (Pandey, 2005).
Debt leverage is measured by the ratio of total debt to equity (debt/equity ratio). It shows the
degree to which a business is utilising borrowed money. Companies that are highly leveraged
may be at risk of bankruptcy if they are unable to make payments on their debt; they may also be
unable to find lenders in the future. Leverage is not always bad; however, it can increase the
shareholder’s return on their investments and make good use of the tax advantages associated
with borrowing.
The size of the firm affects its financial performance in many ways. Large firms can exploit
economies of scale and scope and thus being more efficient compared to small firms. In addition,
small firms may have less power than large firms; hence they may find it difficult to compete
with the large firms particularly in the highly competitive markets. On the other hand, as firms
become larger, they might suffer from inefficiencies, leading to inferior financial performance.
Theory, therefore, is equivocal on the precise relationship between size and performance
(Majumdar, 1997).
Firm age influencing financial performance in that older firms are more experienced, have
enjoyed the benefits of learning, are not prone to the liabilities of newness, and can, therefore,
enjoy superior performance. Older firms may also benefit from reputation effects, which allow
them earn higher margin on sales. On the other hand, older firms are prone to inertia, and the
bureaucratic ossification that goes along with age; they might have developed routines, which are
out of touch with changes in market conditions, in which case an inverse relationship between
age and profitability or growth can be observed (Liargovas and Skandalis, 2008).
1.1.7 Solid Waste Management Companies in Kenya
Kenya’s capital city, Nairobi, currently has a population of 3.3 million people according to a
recent population census (GoK Census, 2010). Located along the equator at 6000 feet above sea
level, it covers an area of 696 km², thus practically it is the smallest county in Kenya but the
most populated. There is a general disparity of incomes as well as population densities in Nairobi
15
with the people living in the western suburbs being generally wealthier while the lower and
middle-income elements of society dominate the eastern suburbs. The poor economic growth of
1.1 percent in 1993 and less than 2 percent in 2001 resulted in an increase in the level of poverty
that stood at 56 percent in 2001 (Rotich, 2005), the economic growth rate has gone up recently to
4.7 percent in 2013 (KER, 2013). Rural urban migrations resulted in unplanned settlements in
the peri-urban areas accommodating about 60 percent of the urban population on only 5 percent
urban land area.
Consequently, urban centres have experienced comparatively high growth rates with little
infrastructure expansion to match it. This urbanization and accompanying industrialization in a
state of overstretched infrastructure is one of the major challenges facing the Kenyan
government. Urbanization in Kenya has led to social, economic and environmental problems,
some in overwhelming proportions. These include but not limited to lack of access to clean
drinking water, illegal waste dumping and improper disposal of solid and hazardous wastes
(Mutai & Njoroge, 2012).
The current practice of collecting, processing and disposing solid wastes is also considered to be
least efficient in most developing countries. The typical problems are - low collection coverage
and irregular collection services, crude open dumping and burning without air and water
pollution controls, the breeding of flies and pests in the open dumpsites, and the handling and
control of informal waste picking or scavenging activities (Bartone, 1995). Although some cities
do spend significant portions of their revenues on waste management, they are often unable to
keep pace with the scope of the problem (Bartone, 2000). Senkoro (2003) indicated that for
many African countries, only less than 30% of the urban population has access to proper and
regular garbage collection.
Solid waste management can only be ranked among the non-excludable goods as it is difficult to
be protected by the general market forces. One way of managing non-excludable goods or
services is either by the internalization of costs (by levying charges for the use of the services) or
by following a command and control policy or a combination of both. Government intervention
is necessary for this. The rationality of the government’s intervention can be judged when the
costs of producing the good or service decline as more of the good or service is produced and
16
when production or use of the good or service results in “externalities” such as environmental
pollution (Macauley and Walls, 1995; Jenkins, 1993). Thus, the major problem for solid waste
management is the internalization of costs of waste disposal.
As far as solid waste collection is concerned, most local governments do not have official
policies towards the privatisation of these services and actual support to the idea is largely
confined to an occasional experiment (UNCHS, 1998). Nevertheless, numerous small and large
firms have sprung up trying to fill the gap left by the dismal performance of most public
cleansing departments. They are attending to the needs of the upper and middle-income groups
who can afford to pay commercial prices (Werna, 1998). However, this spontaneous
privatisation takes place without any institutional or legal regulation. Similarly, waste disposal in
low-income areas, especially slums and squatter areas, largely depends on voluntary efforts to
burn it or bring it to the nearest formal collection point.
There are over 120 private companies licensed by NCC and more than 140 informal private
companies that are estimated to be participating in waste management in Kenya (Ngau & Kahiu,
2009). An analysis of total costs incurred by various actors and amount of waste collected per
month showed CBOs with the least cost of operation (at zero waste collection) at Kshs 7,355 as
compared to private companies which showed over 5 times this amount Kshs 40,608 and NCC
over 200 times Kshs 1,617,462. Further, the CBOs had the lowest cost per tonne of waste
collected as Kshs. 865 compared to other operators who charged almost twice this amount. These
figures suggest that solid waste management is very expensive and CBOs are the cheapest
operators of solid waste (Mwangi, 2007). Therefore, CBOs should be left as the waste operators
especially in the low-income areas where the residents are unable to pay a lot of money for waste
management due to their low operating costs. Due to their relatively high operation costs, the
private companies are more suited to operate in the high-income areas and CBD where the
residents or the owners of buildings are able to pay for the services.
However, private enterprises are primarily interested in earning a return on their investment and
may not be efficient due to the complexity of their operations outlay especially when proper
coordination and SWM models are lacking. Despite the sprouting of private companies, CBOs,
residential associates (RAs) and other actors currently involved in solid waste management in
17
Nairobi, the models of operations of these actors are not well understood. Effective coordination
among these actors is absent and regulation of the private companies by the County government
is only beginning to emerge.
1.2 Research Problem
Waste management has been a persistent headache for city planners and environmentalists
globally for the last four decades. The situation has been observed to be worse off in the
developing countries with burgeon overpopulations, such as that in Nairobi where average
population per square kilometre is 4,742, and gets far worse in the slums where the population
density is 36,253.8/km2. The waste produced is therefore in very large quantities and
management and handling of the same is quite a hard task bestowed upon the newly created
county government. This is expected to get worse since the 3.3 million population density in
Nairobi as at 2010 is estimated to be growing at the rate of 7% per annum.
Mwangi (2007) observes that the sheer volume of waste does not actually constitute the problem
but rather the inability of governments and waste-disposal firms to keep up with it. The situation
in Nairobi pertinently illustrates this. Although between 1977 and 1983 the population of this
city was increasing at an estimated annual rate of at least 6%, the amount of refuse collected fell
from 202,229 tonnes in 1977 to 159,974 tonnes in 1983 — a decline of 21% over 6 years.
Thus, over the late 1970s and early 1980s, the municipal authority in charge of waste was
collecting, on average, almost 10% less refuse per capita every year (Stren and White, 1989). A
similar situation was observed in Malindi (a secondary town in Kenya), where increasing
population is a major constraint. In 1991, in Malindi, an estimated 36,000 tonnes of solid waste
was produced, but only 7,300 tonnes was transported to dumping sites by the municipal
collection service (Otieno, 1992). This situation has persisted to date with more problems
cropping up where dumpsites are used beyond their capacity.
Arnold and Inge (2010) posit that this inability to manage urban solid waste consists of failures
in the following areas: inadequate services; inadequate financing; inadequate environmental
controls; poor institutional structure; inadequate understanding of complex systems; and,
inadequate sanitation. These are issues that PPPs are meant to be solving in their integration in
18
the governance system. However, even though there has been adoption of public private
partnerships in the handling of solid waste, most of the private actors are informally involved and
very little has been done by Nairobi County and NEMA to formalize their engagement.
Monyoncho (2013) observes that entrepreneurs think the SWM ventures are highly profitable
and many would like a chance to venture into it, but the current restrictions by the County
governments has been a huge barrier to entry. Despite these setbacks, there has been however
several entrants who are highly successful in the sector.
Waste management has enjoyed rich interests from the research community both locally and
globally since waste became a global nightmare in the 80s. Many researchers such as: Bartone,
(1995); Schübeler, Karl and Jurg, (1996); Pierre, (1998); Werna, (1998); Devas, (1999); Baud
and Post, (2003); Senkoro (2003); Ikiara, et al. (2004); and, Chan (2008) among others have
deeply looked at solid waste management.
Locally, a myriad of studies have been done on the SWM issue such as those done by Otieno
(1992), Mwangi (2007), Ngau & Kahiu, (2009), Afullo and Odhiambo, (2009), Muniafu &
Otiato 2010), and Monyoncho (2013) among others. However, all these studies have been
directed in the operational side of the waste management discourse and very little have been
done on the involvement of the private actors in the waste management jig.
This study hopes to fill this research gap by analysing these private solid waste management
companies in Nairobi County and more so their financial performance so as to evaluate the
managerial performance, corporate efficiency, financial strength and weakness and credit
worthiness of the companies, given the environment they operate in. This was done by answering
the question: What are the factors influencing private Solid Waste management companies in
Nairobi County?
1.3 Objective of the Study
The objective of this study is to analyse the relationship of the selected factors influencing
financial performance and the Solid Waste Management companies in Nairobi County.
19
1.4 Value of the Study
The study findings will be important to: investors and owners of Solid Waste Management
companies, government policy makers in the Nairobi County and National Environmental
Management Authority, and academicians in many ways. Commerce and industry operate within
a legal framework. Companies, the drivers of commerce and industry, formulate their own
policies (within the legal framework), to ensure their corporate success yet problems are
experiences from time to time. Bankruptcies occur and it may be a mystery why some of them
are so sudden.
Honsberger (1979) as quoted by Naidoo (2006:2) comes to mind: “We tend to forget that
bankruptcy does not strike a bolt of lightning and that there are, in fact, many indicators or
predictors of its approach”. Despite the legal framework, as well as the continuous steps that are
taken by authorities to tighten the financial reporting mechanisms, the problem persists. The
research will help policymakers to access the factors that influence financial soundness of SWM
companies in Nairobi and know which policies to formulate. It also inform them when making
future plans in the SWM industry.
It will assist shareholders, investors and SWM company owners in exploring the factors
influencing performance of the companies, identifying any gaps, and making recommendations,
it may assist in opening avenues for creativity towards maintaining and sustaining the business
activity which will inform them when making future project plans. The study will measure the
firm’s liquidity, profitability and other indicators that the business is conducted in a rational and
normal way; ensuring enough returns to the shareholder to maintain at least its market value
hence assessing investment viability.
The study findings will assist NEMA to formulate guidelines that will ensure efficiency of the
Solid Waste Management in the industry. Academicians on the other hand will be provided with
information on the financial performance of SWM companies in Nairobi. It will also provide an
insight into and act as a base for further research in SWM.
20
CHAPTER TWO
LITERATURE REVIEW
2.1 Introduction
This chapter contains the literature review of the study. The chapter discusses the theoretical
review that covers theories related to financial performance. The study covers an empirical
review on the factors influencing financial performance of firms; a summary of literature review
culminates the chapter for the study.
2.2 Theoretical Review
Advances in theory and methodology on financial performance have been noted over the years
with more and more improved theories coming up. Various theoretical backings have influenced
decision makers in the analysis of factors influencing financial performance of companies. This
study has looked at some of these theories and has come up with the following views.
2.2.1 Open Systems Theory
Open systems theory provides a framework to study partnership as a social system with sub-
systems that interact with each other and with the environment (Katz and Kahn 1978). The
existing partnership models are open systems model that describes a system as a set of
interacting elements or sub-systems that make up an integrated completely, forming part of
larger systems. Because open systems theory deals with organizations in general and across all
sectors, it is applicable to stakeholders in solid waste management and other involved
organizations.
The historical roots of open systems theory lie with Bartolanffy’s (1976) general systems theory
that describes dynamic, recurring patterns in biological systems. Open systems theory adapted
this to the study of organizations, proposing that systems maintain themselves through contact
with the environment. An open system is defined as a coalition of shifting interest groups,
strongly influenced by environmental factors that develop goals by negotiating its structure,
activities, and outcomes.
21
Open systems theory argues that organizations are social systems made up of a structuring of
events or processes. Social systems are anchored in attitudes, beliefs, and motivations of humans,
representing patterns of relationships characterized by variability in objectives that change over
time and by control mechanisms to decrease variability of human behaviour in the interest of
stability (Katz and Kahn, 1978). The theory stresses complexity and variability of parts,
looseness of connections, amorphous system boundaries, and attention to process, not structure
(Scott, 2004). Properties of open systems include inputs, transformation processes, and outputs
(Katz and Kahn, 1978). Inputs represent importation of energy and the influence of the
environment on the system. These inputs are transformed into outputs that are returned to and
influence the environment.
This import and export process represents a cycle of events that decreases the natural tendency of
a system toward entropy. Positive and negative feedback loops lead to dynamic homeostasis,
where positive feedback allows an organization to respond to changes in the environment and
negative feedback serves to correct deviations, opposing change and maintaining stability
(Ashmos and Huber, 2006). The concept of equifinality allows that a final state can be reached
from different initial conditions and by multiple paths. Organizations are controlled through
rules, regulations and norms in their environment.
Therefore, organizational functioning cannot be understood in isolation since any system is a
sub-system of a larger system. Open systems analysis seeks to define the boundaries of a system
and the elements making up the system, their interactions, and the connections between them.
Starting with the system of interest, analysis must identify the larger system in which the system
of interest is embedded, as well as the sub-systems (Katz and Kahn, 1978).
This framework is useful in describing the component sub-systems of partnership that are
required for effective functioning. The utility of the open systems approach is that importance
placed on the environment calls for scanning for changes and bridging boundaries and
interdependencies. The open systems approach allows identification and elimination of potential
dysfunctions (Morgan, 2008). The explanatory power of open systems theory is however limited,
given that it provides a framework to describe and classify organizations within their
environments (Ashmos and Huber, 2006).
22
Open systems theory views organizations only as physical entities, ignoring the importance of
meaning in any human system (Flood, 2008). However, it offers attention to interactions among
interest groups or stakeholders also limits its usefulness (Harrison and Shiron, 2005). Thus, the
theory informs the study in relation to external factors which affect the firm hence influencing its
financial performance. In the SWM industry, the county government offers rules, regulations and
norms in the environment while the private sector players offer the requisite services at a cost.
2.2.2 Institutional Theory
Institutional theory builds on the open systems perspective by adding that the environment is not
only a stock of resources and technical information, but also a supplier of legitimacy and
meaning (Thompson, 1967). Early institutional theory argued that organizations reflect rules and
structures in their external environments, rather than result from internal, rational decision
making processes. Organizations take on patterns of functioning and of meaning systems from
those organizations in their environment that influence them, providing them legitimacy and
stability where they accommodate the requirements of these influences. Organizations are thus
more about the process of organizing than about the structure of organization (Weick, 2002). The
environment is a source of information and a stock of resources. Most institutional research
focuses on why organizations are structured as they are and on the isomorphism between
organizations that this process produces.
Additionally, the theory provides some understanding of why organizations are interested in
collaboration because it can help organizations adjust more efficiently and effectively to
increasing complexity (Hatch, 2006). An organization’s structural complexity increases as the
environment becomes more complex. With increases in uncertainty, organizations increase their
formalization and control processes. Increasing complexity and uncertainty leads organizations
to become more interdependent, looking for ways to coordinate (Scott, 2004).
The institutional model consists of four elements: 1) macro processes within power and social
structures (the nation-state, professions, culture, and the economy) affect or control development
of the environment of organizing; 2) the institutional environment is made up of a set of
organizations with identities, structures, and activities that influence a particular organization; 3)
causal connections (or types of pressure) between institutional elements and organizational
23
identity, structure, and activities; 4) sources of influence on organizations (e.g., public regulation
by nation state, scientific or professional norms and guidelines) (Meyer, 2007). Within
institutional theory, two types of organization exist—technical and institutional. In technical
organizations, success depends on outputs and profit. In institutional organizations, on the other
hand, success depends on acceptance of society’s norms and values (Powell and DiMaggio,
2003). Understanding an organization’s ability to participate in a community through an
examination of these elements is an important part of this research.
2.2.3 Stakeholder Theory
Stakeholder theory is managerial in that it reflects and directs how managers operate rather than
primarily addressing management theorists and economists. The focus of stakeholder theory is
articulated in two core questions (Freeman, 1994). First, it asks, what is the purpose of the firm?
This encourages managers to articulate the shared sense of the value they create, and what brings
its core stakeholders together. This propels the firm forward and allows it to generate outstanding
performance, determined both in terms of its purpose and marketplace financial metrics. Second,
stakeholder theory asks, what responsibility does management have to stakeholders?
This pushes managers to articulate how they want to do business—specifically, what kinds of
relationships they want and need to create with their stakeholders to deliver on their purpose.
Today’s economic realities underscore the fundamental reality we suggest is at the core of
stakeholder theory: Economic value is created by people who voluntarily come together and
cooperate to improve everyone’s circumstance. Managers must develop relationships, inspire
their stakeholders, and create communities where everyone strives to give their best to deliver
the value the firm promises. Certainly shareholders are an important constituent and profits are a
critical feature of this activity, but concern for profits is the result rather than the driver in the
process of value creation.
Many firms have developed and run their businesses in terms highly consistent with stakeholder
theory. Firms such as J&J, eBay, Google, Lincoln Electric, AES, and the companies featured in
Built to Last and Good to Great (Collins, 2001) provide compelling examples of how managers
understand the core insights of stakeholder theory and use them to create outstanding businesses.
Whereas all these firms value their shareholders and profitability, none of them make
24
profitability the fundamental driver of what they do. These firms also see the import of values
and relationships with stakeholders as a critical part of their ongoing success. They have found
compelling answers to the two core questions posed by stakeholder theory, which underscore the
moral presuppositions of managing they are about purpose and human relationships. Stakeholder
theory begins with the assumption that values are necessarily and explicitly a part of doing
business, and rejects the separation thesis (Freeman, 1994).
The separation thesis begins by assuming that ethics and economics can be neatly and sharply
separated. In this context, the challenge of doing business ethics or improving the moral
performance of business becomes a Sisyphean task because business ethics is, by definition, an
oxymoron. Many proponents of a shareholder, single objective view of the firm distinguish the
economic from the ethical consequences and values. The resulting theory is a narrow view that
cannot possibly do justice to the panoply of human activity that is value creation and trade, i.e.,
business.
In our view, Sundaram and Inkpen (2004) exhibit their commitment to such a narrow
interpretation of the shareholder ideology in their paper “The Corporate Objective Revisited.”
They begin, “Governing the corporation requires purposeful activity. All purposeful activity, in
turn, requires goals.” They conclude that the goal of “maximizing shareholder value” is the only
appropriate goal for managers in the modern corporation. More subtly, according to McCloskey
(1998), the “maximizing shareholder value” view is put forward as a “scientific” theory that is
modelled and verified appropriately by ideologists called “economists.” Unfortunately, in an
attempt to be accepted by their “scientific brethren,” several management theorists have adopted
the fashion of accepting the economic view of business activity as the most useful one available
and have fallen into the trap of the separation thesis.
“Maximizing shareholder value” is not a value-neutral theory and contains vast ideological
content. At its worst, it involves using the prima facie rights claims of one group shareholders to
excuse violating the rights of others. Shareholder rights are far from absolute, regardless of how
much economists talk about the corporation as being the private property of the shareholders.
25
The rights of shareholders are prima facie at best, and cannot be used to justify limiting the
freedom of others without their consent.
2.3 Other Factors Influencing Financial Performance
2.3.1 Management Competence Index
Is a multidimensional concept and a number of well documented attempts have been made in the
literature to define it. More specifically, the popularity of the term competence can be attributed
to (Boyatzi, 1982). In “The Competent Manager” (Boyatzi ,1982) defines competence as “an
underlying characteristic of a person”, stating it could be, “motive, trait, skill, aspect of one’s
self-image or social role, or a body of knowledge which he or she uses” (Woodruffe, 1993)
points out, that this definition leaves the term open to a multitude of interpretations and argues
that the term ‘competence’ can be used to refer to a ‘set of behaviors, skills, knowledge and
understanding which are crucial to the effective performance of a position’. (Nordhaug and
Gronhaug, 1994) interpret competence as “work-related knowledge, skills and abilities” while
(Rees, 2003) argues that there has been an enormous diversity of interpretation of the term,
‘competence’, and no agreed definition (Hamel and Prahalad, 1994) define competence as a
bundle of skills and technologies that enable company to provide benefits for customers rather
than a single skill or technology.
Management efficiency is one of the key internal factors that determine the profitability of a
firm. It is represented by different financial ratios like for in a bank they are total asset growth,
loan growth rate and earnings growth rate. Yet it is one of the complex subjects to be captured by
financial ratios. Moreover, operational efficiency in managing the operating expenses is another
dimension for management quality. The performance of management is often expressed
qualitatively through subjective evaluation of management systems, organizational discipline,
control systems, quality of staff, and others.
Yet some financial ratios of the financial statements act as a proxy for management efficiency.
The capability of the management to deploy its resources efficiently, income maximization,
reducing operating costs can be measured by financial ratios. One of the ratios used to measure
management quality is operating profit to income ratio (Rahman et al, IIhomovich, 2009; Sangmi
26
and Nazri, 2010). The higher the operating profit to total income (revenue) the more efficient
management is in terms of operational efficiency and income generation. The other important
ratio is that proxy management quality is expense to asset ratio.
The ratio of operating expenses to total asset is expected to be negatively associated with
profitability. Management quality in this regard, determines the level of operating expenses and
in turn affects profitability (Athanasolgou et al, 2005).
2.3.2 Ownership Structure
Firm performance is supposed to be independent from the ownership structure in the absence of
agency cost. However, in the real world, the agency cost generated from principal-agent
problems exists widely. Equity ownership structure as an important mechanism in corporate
governance (Denis & McConnell 2003), influence the quality of corporate governance and its
ability to reduce agency costs (Berk & DeMarzo, 2007). The path dependent argument (Dyck,
2004) state that the ownership structures are path dependent, and are determined by the stakes.
Therefore, the current ownership structure may not be the most efficient one. Thus, testing the
relationship between ownership structure and financial performance could help the investors to
gain value by optimizing the firm’s ownership structure.
The effect of ownership structure on firm performance may be looked at according to two
dimensions, ownership concentration and owner identities. Ownership concentration provides
quantitative information about the capital right of the largest shareholder(s). Owner identity
information provides qualitative information about the character of the controlling
shareholder(s). One issue to pay attention to is the divergence of capital right and voting
(control) right. Normally the two kinds of right are the same; however, when the voting right is
different from the capital right due to control mechanisms, the incentives of the principals and
agents would get influenced (Gross, 2007).
Various forms of ownership structure exist that affects performance. In Kenya, key reforms have
encouraged foreign companies to venture into the Kenyan market. Kamau (2009) affirm that
foreign banks are more efficient than local banks. She attributes this to the fact that foreign banks
concentrate mainly in major towns and target corporate customers, whereas large local banks
spread their activities more widely across the country. Foreign banks therefore refrain from retail
27
banking to specialise in corporate products, while large domestic banks are less discriminatory in
their business strategy. These different operational modalities affect efficiency and profitability
she affirms, which is dependent on the institutional owners decisions.
2.4 Tools of Financial Analysis
Financial analysis tools are one of the most efficient ways that can be used for ensuring good
profit from organisations in their financial performance. These financial analysis tools are highly
helpful in evaluating the market and investing in a way so as to maximize the profit from the
investments made (Bangs and David, 1992). These financial analysis tools are useful for
deciphering both internal and external information related to a specific business organization.
Mainly, the financial analysis tools can be used for SWOT analysis to determine the strengths,
weaknesses, opportunities and threats of the organisation. According to (Casteuble and Tracy,
1997), the economic conditions in the present day market are analysed by management
professionals with assistance from SWOT analysis performed by the various financial analysis
tools. Each section of the evaluation process contains specific information which is helpful in
gauging the general performance of a company. Moreover, financial analysis tools are really
important for any investor for the company’s performance shows direct impact on the price of a
company’s stock.
For private solid waste management companies, there are two financial analysis tools available
in the financial field. These tools are designed especially for carrying out specific functions. A
Balanced Scorecard is one tool which can be of good assistance to gauge the financial position of
a company. This financial analysis tool is helpful in subjective as well as objective measurement
of special processes. Moreover, this financial tool is also helpful in evaluation of a company’s
overall return, the operating income, and the capital financing processes (Donnahoe, 1999).
The other financial analysis tool available is benchmarking which is used for assessing the
intrinsic strengths and weaknesses of a company. Besides, this also sways the stock price of the
company. Also, there are some professional agencies which use this type of financial analysis
tools to generate advices for their clients (Gill, 1994).
In addition to the aforementioned financial analysis tools, other important financial analysis tools
include ratio analysis, trend analysis, comparative financial statement analysis or horizontal
28
analysis, and common size statement analysis or vertical analysis that could also be applied by
the company (Kristy et al., 1999).
The finance function in companies involves evaluating economic trends, setting financial policy,
and creating long-range plans for business activities. It also involves applying a system of
internal controls for the handling of cash, the recognition of sales, the disbursement of expenses,
the valuation of inventory, and the approval of capital expenditures. In addition, the finance
function reports on these internal control systems through the preparation of financial statements,
such as income statements, balance sheets, and cash flow statements (Larkin and Howard, 1996).
According to Financial Analysis Review (1999) financial analysis can be an important tool for
small business owners and managers to measure their progress toward reaching company goals,
as well as toward competing with larger companies within an industry. When performed
regularly over time, financial analysis can also help small businesses recognize and adapt to
trends affecting their operations. It is also important for small business owners to understand and
use financial analysis because it provides one of the main measures of a company's success from
the perspective of bankers, investors, and outside analysts.
2.5 Empirical Review
According to Atrill (2003) financial management is the process of managing the financial
resources, including accounting and financial reporting, budgeting, collecting accounts
receivable, risk management, and insurance for a business.
Financial management system needs to address risk. Any good system should minimize the risks
in the business. Even in businesses that have a well set up system, cash flow can be a problem.
There are some tried and true methods for managing cash shortages that can help prevent cash
flow problems and deal with them if they come up. In the worst case one may have difficulties
meeting all the debt obligations. One may even be at the point where he/she wants to sell the
business or simply close it and liquidate assets. There are financial issues involved for these
circumstances too. So, be certain that you know what steps you need to take in order to protect
yourself financially in the long run. Clearly, financial management encompasses a number of
crucial areas of the business, Wangombe, J.G. (2003).
29
To evaluate the financial condition and performance of a company, the financial analyst needs
certain yardsticks. The yardstick frequently used is a ratio, or index, relating two pieces of
financial data to each other. The analysis of financial ratios involves two types of comparison;
first, the analyst can compare a present ratio with past and expected future ratios for the same
company (Atrill, 2003). Also financial ratios can be computed for projected statements and
compared with present and past ratios. in the comparisons over time, it is best to compare not
only financial ratios but also the raw figures Comparisons with others, it involves comparing
ratios of one firm with those of similar firms or with industry averages at the same point in time.
The urban solid waste management in developing countries is faced with challenges of
sustainability. A sustainable solid waste collection and management system encompasses a
system that is environmentally, financially and socially appropriate and acceptable, and meets
the criteria of sustainable development that meets the needs of the present generation without
compromising the ability of future generations to meet their needs (Callan and Thomas, 2001).
The three important interrelated aspects (environmental, financial, and social) of sustainability
when met ensure that solid waste does not cause environmental pollution and public health
hazards (Baud et al., 2004; Baud and Post, 2003).
The private sector-led developments in the developed countries and the structural adjustment
programme in the 1980s in Ghana made critics to question the service delivery role of Local
Governments. In 1990 the LGs of Accra and Tema took the initiative and subsequently started
contracting out franchising of solid waste and sanitation services to the private sector However,
there was no provision in the legislation that allowed other actors than the LG to provide these
services until 1992.
Private sector involvement in urban solid waste management was an integral part of Urban
Environmental Sanitation Project (UESP) which was funded with World Bank loan and
implemented in Tema, Takoradi, Kumasi, and Tamale from 1995. In the plans to involve the
private sector, it was envisaged that in the short to medium term, LGs would provide about 60%
of the basic services, with 40% being in the hands of the private sector. LGs were also required
to set tariffs at realistic and economically viable levels, with due allowance for recurrent cost
recovery and depreciation of capital investments, and to build private sector capacity through
access to investment funds. The move from direct provision to contracting out implied that LGs
30
had to completely re-organize, reorient their management and regulatory apparatus and
strengthen their human capabilities (Awortwi, 2003), in order to facilitate, regulate, and monitor
the private sector provision of solid waste management services.
Robbins (2003) discussed ways many of those factors are related to one another and therefore
affect leverage. A complex leverage has a greater need for communication across many
departments horizontally or between many levels vertically. The more complex an organization
is, the greater the need for effective communication, coordination, and control (Robbins, 2003).
Locally, scholar literature divides formalization as high versus low, where a high level of
formalization is related to a mechanistic structure and a low level of formalization is related to a
flexible organic structure. The fourth variable is the level of process-based.
Onyango (2000) undertook a study on the relationship between ownership structure value of
firms listed at the Nairobi Stock Exchange and arrived at a conclusion on the relationship
between the value of the firm and insider. From the analysis he concluded that the value of the
firm increased when insider ownership ranged between 0% and 37% while firm value again
increased when the ownership level is more than 50%.
Barako et al (2007) study provides longitudinal examination of voluntary disclosure practices in
the annual reports of listed companies in Kenya from 1992 to 2001. Their study investigated the
extent to which organizational structure attributes, ownership structure and company
characteristics influence voluntary disclosure of various types of information. Due to the panel
nature of their data, to estimate the determinants of voluntary disclosure of various types of
information, they used pooled Ordinary Least Square (OLS) with Panel-Corrected Standard
Errors (PCSEs). The results indicated that, disclosures of all types of information are influenced
by organizational structure attributes, ownership structure and corporate characteristics. In
particular, the results also suggestted that size and companies in the agricultural sector are
significantly associated with the voluntary disclosure of all four types of information disclosures.
Ngumi (2008) looked at the survey of the age in the Housing Finance Company (HFCK) as
affecting good corporate governance practices. He came to the clear conclusion that the age bank
31
and level of commitment will ensure that its business and operations are conducted with high
integrity and compliance with the law and the accepted practices in accounting.
Kiamba (2008) studied the effects of size on the financial performance of local authorities in
Kenya. The study found that financial performance of the local authorities was influenced by
political composition in the respective councils and the manner in which internal audits are
conducted and the managerial approaches applied by the council’s chiefs.
Muriithi (2008) documented organizational structure and financial performance of state
corporations, the case of the New KCC and drew a conclusion that better organizational
structure will improve financial performance. In that respect he identified the following
organizational structure practices; appointment and leadership of the board structure of the
organization, purpose and values, balance of power in the board ,corporate communication and
the assessment of performance of board and its responsibilities.
Ongore (2008) carried out a research on the effects of ownership structure, board effectiveness
and managerial discretion on performance of listed companies in Kenya where the following
conclusion was drawn from this study that; ownership concentration is inimical to a manager
creativity and innovation and curtains firm performance, also increase in government
shareholding of a firm results in negative performance.
2.6 Summary of Literature Review and Research Gap
A number of studies have sought to investigate the relationship between various factors and
financial performance with most studies focusing on companies listed on stock exchange and the
banking industry. Hardly do these studies clearly demonstrate the relationship between various
factors and financial performance of waste management organisations in Kenya and the accruing
benefits. This research therefore aims to find out the factors that influence financial performance
of private solid waste management companies in Nairobi County.
32
CHAPTER THREE
RESEARCH METHODOLOGY
3.1 Introduction
This chapter described the research methodology in a systematic manner by explaining the
research design, the population from which the data was obtained, the sample selection and
techniques, procedure used in collection and analysing the data.
3.2 Research Design
Copper and Schindler (2003) define research design as ‘the blueprint for fulfilling objectives and
answering questions’. Research design brings out the plan of what the researcher intends to do
and how to carry out the research. A research design can summarily be defined as the plan for
the collection, measurement and analysis of data (Copper & Schindler, 2003). This study adopted
a descriptive research design. Descriptive research fits the research at hand since it gave a
description of the factors influencing financial performance of private solid waste management
companies in Nairobi County.
3.3 Population
Population is defined as “an entire group of individuals, events, or objects having a common
observable characteristic” (Mugenda and Mugenda, 2003). It consists of all elements of study in
a research. The target population of the study was composed of all the private solid waste
management operators found in Nairobi County. The sample population comprised all the 56
registered solid waste management companies in Nairobi County. The study conducted a census
survey owing to the number of the solid waste management companies registered by NCC (as
provided in appendix i), being manageable. Therefore, the study targets the whole population of
the study.
3.4 Data Collection Techniques
The study required secondary data in meeting its obligation. Therefore, secondary data collection
techniques were employed. The study collected audited financial statements and reports from the
33
targeted companies within the study period 2011-2013. This data was analysed to facilitate
meeting the study objective.
3.5 Data Analysis and Presentation
Data analysis involves reducing accumulated data to a manageable size, developing summaries,
looking for patterns and finally applying statistical techniques. It refers to converting raw data
into meaningful information. The collected data was examined for completeness and
comprehensibility. The data will then be coded and keyed into the Statistical Package for Social
Sciences (SPSS Version 17) for analysis.
This is a computer aided tool for the analysis that helps to generate descriptive statistics such as
means, standard deviations and percentages. It was used in analyzing the data. The study also
employed inferential statistics such as regression and correlation to test the relationship between
the selected factors influencing financial performance in solid waste management companies in
Nairobi County.
3.6 The Study Model
The study used a multiple linear regression model. The multiple linear regression models sought
to analyze the factors influencing financial performance of private solid waste management
through regressing factors such as leverage, liquidity, age and size of the companies within the
period of interest. The study used the following regression model;
FPt= α + biLt + biiQt + biiiAt + bivSt + εt
Where FPt= Firm Performance (ROE)
α = Constant term - defines value of return on equity without inclusion of predictor variables
bn = Coefficients of the variable - rate of change of dependent variable (financial performance)
as a function of changes in the independent variables
L = Leverage position of the firm – measured by the ratio of debt by equity
Q = Liquidity position of the firm - measured by the ratio of current assets by current liabilities
34
A = Age of the company – given by the years the company has been in operation
S = Size of the company – measured by the company’s total assets
εt = Standard error
This model was created using insights and success from Kabajeh, AL-Nu’aimat, and Dahmash,
(2012), study findings on “The Relationship between the ROA, ROE and ROI ratios with
Jordanian Insurance Public Companies Market Share Prices”, which was modified to fit the case
of the analysis. They found the model to be very useful in determining performance of the
insurance sector in their country.
Correlation was used to test the relationship of the ROE, current and quick ratios, debt and equity
ratios, total assets and the years the company has been in operation.
The study also used ANOVA (model goodness of fit) to test the statistical significance of the
variables in satisfying the set objectives.
35
CHAPTER FOUR
DATA ANALYSIS, RESULTS AND DISCUSSION
4.1 Introduction
This chapter presents the data analysis, results, interpretation, and discussion of the research
findings. To achieve the objective of the study, SPSS Version 17 statistical software was used to
analyse the data. Linear regression was used to analyse the relationship of the selected factors
influencing financial performance and the Solid Waste Management companies in Nairobi
County.
4.2 Response Rate
The sample population comprised all the 56 registered solid waste management companies in
Nairobi County. The study conducted a census survey owing to the number of the solid waste
management companies registered by NCC being manageable. Therefore, the study targets the
whole population of the study and collected audited financial statements and reports from the
targeted companies within the study period 2011-2013. This data was analysed to facilitate
meeting the study objective.
4.2 Descriptive Statistics
The study seeks to determine the relationship of the selected factors influencing financial
performance and the Solid Waste Management companies in Nairobi County. The references
included audited financial statements and reports from the targeted companies within the study
period 2011-2013.
36
Table 4.1: Descriptive Statistics
Variable Mean Standard
Deviation
Minimum
Value
Maximum
Value
Observations
FP 0.2115 0.02501 0.01025 0.36510 56
LV 0.3684 0.11890 0.23541 0.48940 56
LQD
SIZE(Million)
Age
0.3577
23.3514
19
0.25118
2.65818
1.78024
0.29897
17
12
0.58501
31.0778
52
56
56
56
Source: Research Findings
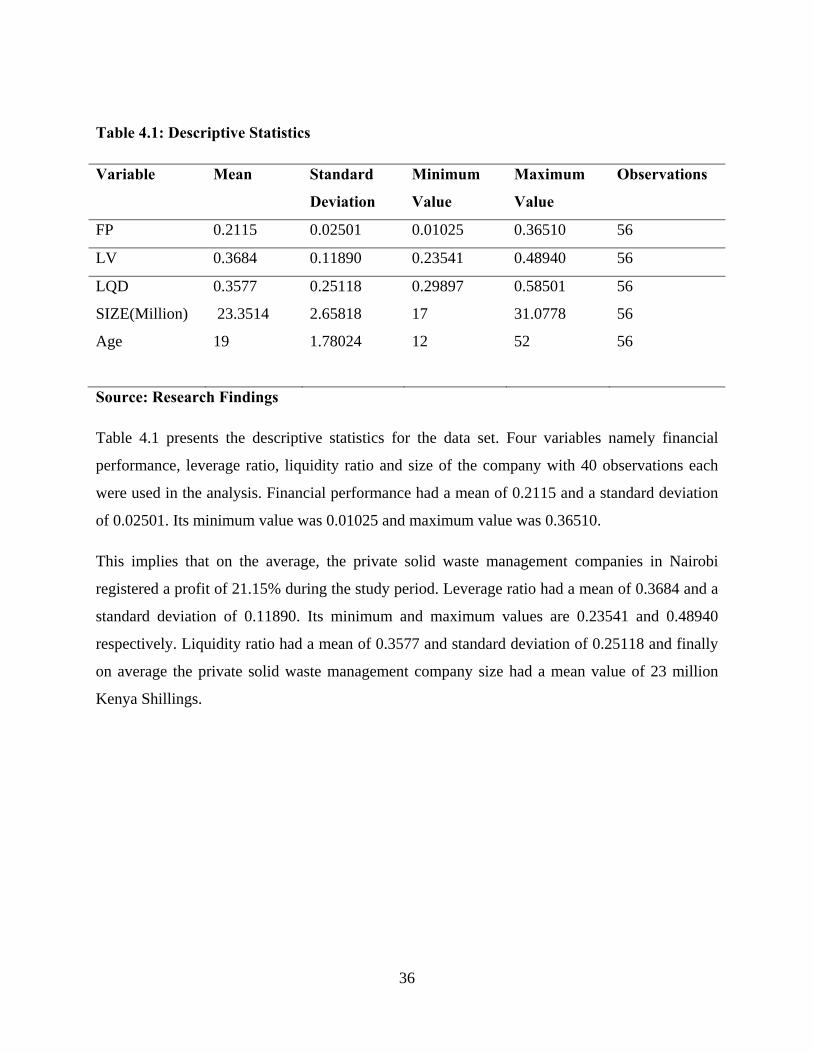
Table 4.1 presents the descriptive statistics for the data set. Four variables namely financial
performance, leverage ratio, liquidity ratio and size of the company with 40 observations each
were used in the analysis. Financial performance had a mean of 0.2115 and a standard deviation
of 0.02501. Its minimum value was 0.01025 and maximum value was 0.36510.
This implies that on the average, the private solid waste management companies in Nairobi
registered a profit of 21.15% during the study period. Leverage ratio had a mean of 0.3684 and a
standard deviation of 0.11890. Its minimum and maximum values are 0.23541 and 0.48940
respectively. Liquidity ratio had a mean of 0.3577 and standard deviation of 0.25118 and finally
on average the private solid waste management company size had a mean value of 23 million
Kenya Shillings.
37
4.3 Correlation Matrix
Table 4.2: Correlation Matrix
FP LV LQD SIZE AGE
FP 1.0000
LV - 0.7358 1.0000
LQD 0.8339 0.2385 1.0000
SIZE 0.6875 0.5781 0.4358 1.0000
AGE 0.354 0.2877 0.2310 -0.4337 1.0000
Source: Research Findings
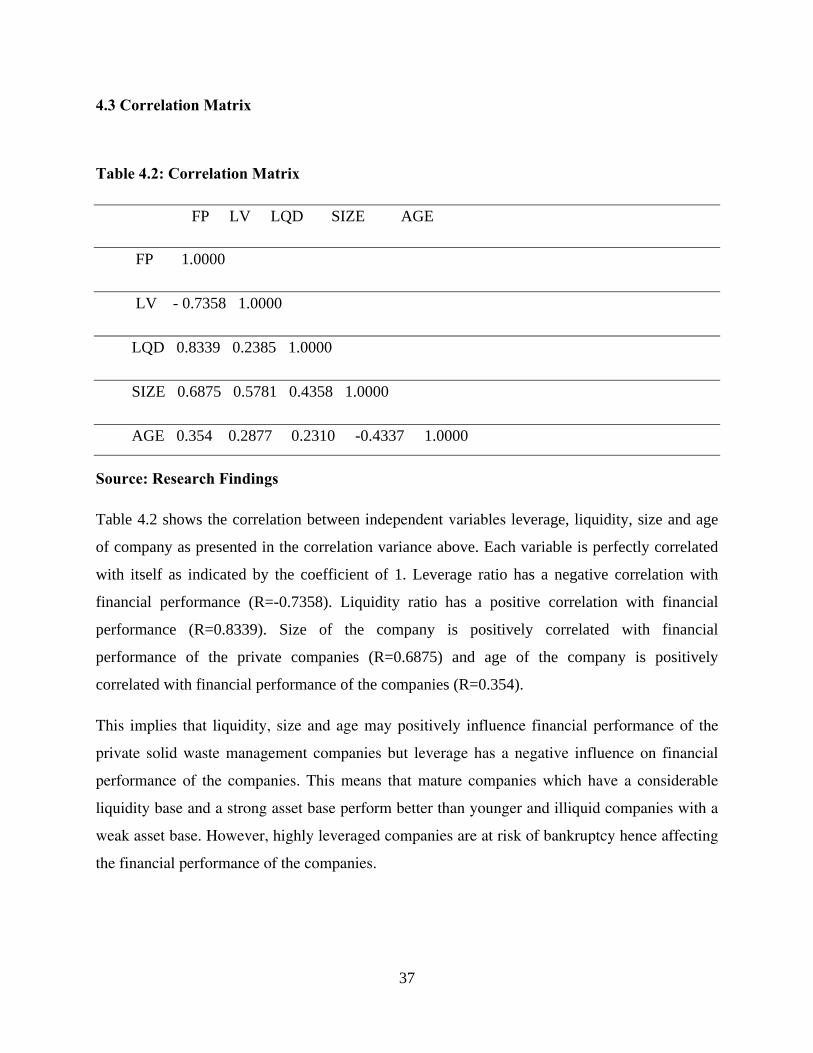
Table 4.2 shows the correlation between independent variables leverage, liquidity, size and age
of company as presented in the correlation variance above. Each variable is perfectly correlated
with itself as indicated by the coefficient of 1. Leverage ratio has a negative correlation with
financial performance (R=-0.7358). Liquidity ratio has a positive correlation with financial
performance (R=0.8339). Size of the company is positively correlated with financial
performance of the private companies (R=0.6875) and age of the company is positively
correlated with financial performance of the companies (R=0.354).
This implies that liquidity, size and age may positively influence financial performance of the
private solid waste management companies but leverage has a negative influence on financial
performance of the companies. This means that mature companies which have a considerable
liquidity base and a strong asset base perform better than younger and illiquid companies with a
weak asset base. However, highly leveraged companies are at risk of bankruptcy hence affecting
the financial performance of the companies.
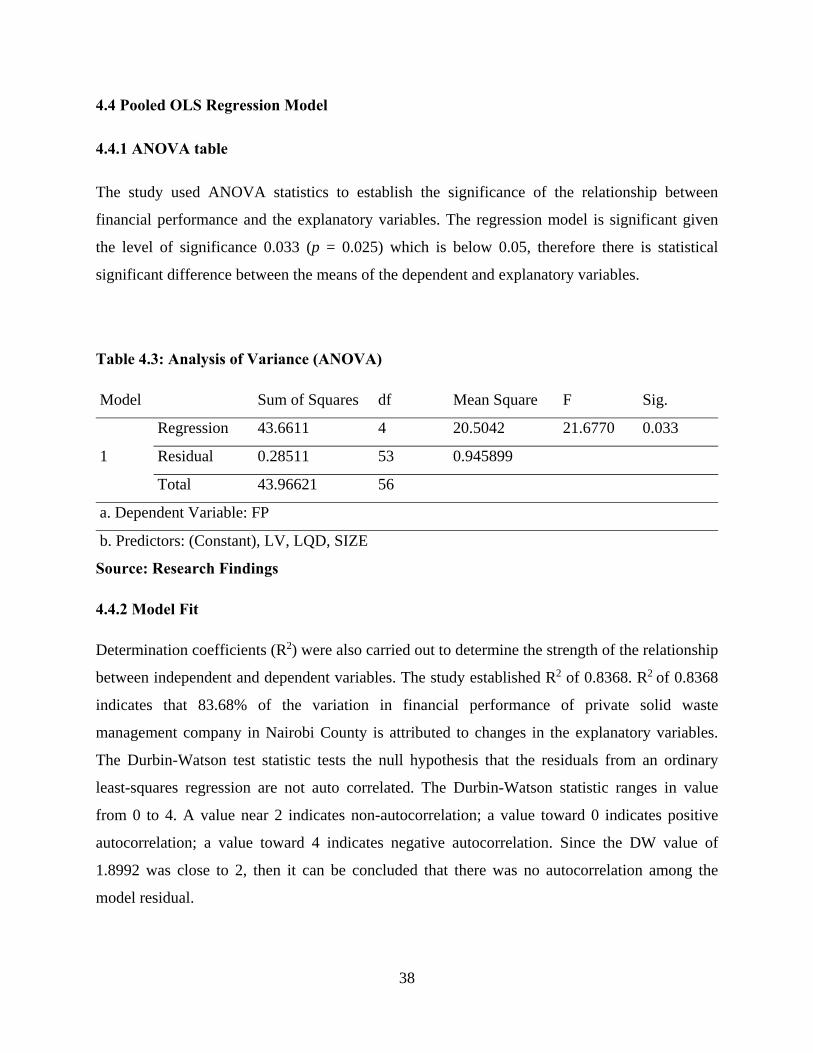
38
4.4 Pooled OLS Regression Model
4.4.1 ANOVA table
The study used ANOVA statistics to establish the significance of the relationship between
financial performance and the explanatory variables. The regression model is significant given
the level of significance 0.033 (p = 0.025) which is below 0.05, therefore there is statistical
significant difference between the means of the dependent and explanatory variables.
Table 4.3: Analysis of Variance (ANOVA)
Model Sum of Squares df Mean Square F Sig.
1
Regression 43.6611 4 20.5042 21.6770 0.033
Residual 0.28511 53 0.945899
Total 43.96621 56
a. Dependent Variable: FP
b. Predictors: (Constant), LV, LQD, SIZE
Source: Research Findings
4.4.2 Model Fit
Determination coefficients (R2) were also carried out to determine the strength of the relationship
between independent and dependent variables. The study established R2 of 0.8368. R2 of 0.8368
indicates that 83.68% of the variation in financial performance of private solid waste
management company in Nairobi County is attributed to changes in the explanatory variables.
The Durbin-Watson test statistic tests the null hypothesis that the residuals from an ordinary
least-squares regression are not auto correlated. The Durbin-Watson statistic ranges in value
from 0 to 4. A value near 2 indicates non-autocorrelation; a value toward 0 indicates positive
autocorrelation; a value toward 4 indicates negative autocorrelation. Since the DW value of
1.8992 was close to 2, then it can be concluded that there was no autocorrelation among the
model residual.
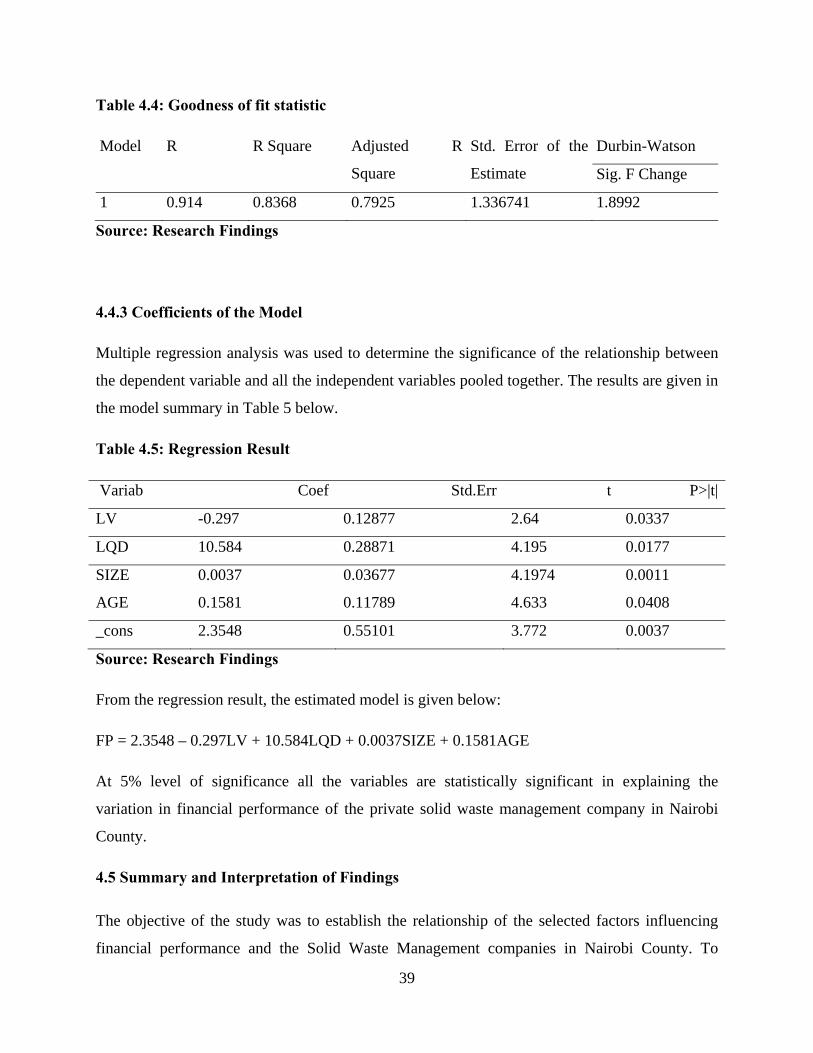
39
Table 4.4: Goodness of fit statistic
Model R R Square Adjusted R
Square
Std. Error of the
Estimate
Durbin-Watson
Sig. F Change
1 0.914 0.8368 0.7925 1.336741 1.8992
Source: Research Findings
4.4.3 Coefficients of the Model
Multiple regression analysis was used to determine the significance of the relationship between
the dependent variable and all the independent variables pooled together. The results are given in
the model summary in Table 5 below.
Table 4.5: Regression Result
Variab Coef Std.Err t P>|t|
LV -0.297 0.12877 2.64 0.0337
LQD 10.584 0.28871 4.195 0.0177
SIZE
AGE
0.0037
0.1581
0.03677
0.11789
4.1974
4.633
0.0011
0.0408
_cons 2.3548 0.55101 3.772 0.0037
Source: Research Findings
From the regression result, the estimated model is given below:
FP = 2.3548 – 0.297LV + 10.584LQD + 0.0037SIZE + 0.1581AGE
At 5% level of significance all the variables are statistically significant in explaining the
variation in financial performance of the private solid waste management company in Nairobi
County.
4.5 Summary and Interpretation of Findings
The objective of the study was to establish the relationship of the selected factors influencing
financial performance and the Solid Waste Management companies in Nairobi County. To

40
achieve this objective, all the 56 registered solid waste management companies in Nairobi
County for the period 2011-2013. On average, the financial performance during the study period
was 21.15% with a minimum and maximum value of 1.025% and 36.510% respectively.
Leverage ratio Leverage ratio had a mean of 0.3684 and a standard deviation of 0.11890. Its
minimum and maximum values are 0.23541 and 0.48940 respectively. Liquidity ratio had a
mean of 0.3577 and standard deviation of 0.25118 and finally on average the private solid waste
management company size had a mean value of 23 million Kenya Shillings with the largest
company having a monetary value of 31 million Kenya Shillings.
The regression coefficient of leverage ratio is negatively correlated with the profitability of the
companies. A unit increase in leverage ratio will lead to 0.297 units decrease in financial
performance of solid waste management company in Kenya. Company’s liquidity is positively
related with the financial performance of the. A unit increase in liquidity ratio will lead to 10.584
units increase in financial performance of waste management company in Nairobi County. A unit
increase in the company size will lead to 0.0037 units increase in the financial performance of
the waste management company.
Leverage was statistically significant at 5% level of significance in explaining the variation in
financial performance of private waste management company in Nairobi County. A unit increase
in leverage ratio will lead to 0.297 units decrease in financial performance of solid waste
management company in Kenya. The findings show that liquidity ratio is statistically significant
in influencing the variation in the profitability of the waste management company. A unit
increase in liquidity ratio will lead to 10.584 units increase in financial performance of waste
management company in Nairobi County.
The above findings are in line with Wangombe, (2003) who contended that financial
management system needs to address risk. Any good system should minimize the risks in the
business. Even in businesses that have a well set up system, cash flow can be a problem since
there are some tried and true methods for managing cash shortages that can help prevent cash
flow problems and deal with them if they come up. His study also established that the worst case
one may have difficulties meeting all the debt obligations. One may even be at the point where
he/she wants to sell the business or simply close it and liquidate assets. There are financial issues
involved for these circumstances too. So, be certain that you know what steps you need to take in
41
order to protect yourself financially in the long run. Clearly, financial management encompasses
a number of crucial areas of the business,
The result is in line with (Liargovas and Skandalis, 2008) who argues that liquidity would allow
an investment fund to deal with unexpected contingencies and to cope with its obligations during
periods of low earnings which positively influence profitability of the company. Regression
coefficient of the size of the company is positively and significantly related to the financial
performance of waste management company. A unit increase in the company size will lead to
0.0037 units increase in the financial performance of the waste management company. The
finding is consistent with Hvide and These (2007) who contends that larger firms have better
financial performance. Flamini et al (2009) also postulate that bigger firms are more competitive
than smaller firms in harnessing economies of scale in transactions and enjoy a higher level of
profits.
The study findings established that the age of the company is positively related with the financial
performance of the solid waste companies with a unit increase in the duration of the operation of
the company resulting to 0.1581 units increase in the profitability of the solid waste management
companies. This findings are in line Barako (2007) study provides longitudinal examination of
voluntary disclosure practices in the annual reports of listed companies in Kenya from 1992 to
2001. Their study investigated the extent to which organizational structure attributes, ownership
structure and company characteristics influence voluntary disclosure of various types of
information. Due to the panel nature of their data, to estimate the determinants of voluntary
disclosure of various types of information, they use pooled Ordinary Least Square (OLS) with
Panel-Corrected Standard Errors (PCSEs). The results indicate that, disclosures of all types of
information are influenced by organizational structure attributes, ownership structure and
corporate characteristics. In particular, the results also suggest that size and companies in the
agricultural sector are significantly associated with the voluntary disclosure of all four types of
information disclosures. Moreover the study findings were also in line with Mwangi (2007) who
observes that the sheer volume of waste does not actually constitute the problem but rather the
inability of governments and waste-disposal firms to keep up with it and also asserts that he
situation in Nairobi pertinently illustrates this.
42
CHAPTER FIVE
SUMMARY, CONCLUSION, AND RECOMMENDATIONS
5.1 Summary
This chapter presents the summary of finds, conclusion, recommendations and suggestions for
further research derived from the findings. The chapter also presents the limitations that were
encountered with suggestions for further research.
The objective of the study was to establish the relationship of the selected factors influencing
financial performance and the Solid Waste Management companies in Nairobi County. Various
factor including Leverage, Liquidity, Age of the company and the Size of the company. The
study established that the financing or leverage decision is a significant managerial decision
because it influences the shareholder’s return and risk and the market value of the firm. The ratio
of debt-equity has implications for the shareholder’s dividends and risk, this affect the cost of the
capital and the market value of the firm.
The study established that liquidity established both structurally and operationally capacity of the
firms. Solvency results provided an indication of the business’ ability to withstand risks by
providing information about the operation’s ability to continue operating after a major financial
adversity. Moreover, the study found out that firm age has an influence on its performance in that
organizational inertia operating in old firms tends to make them inflexible and unable to
appreciate changes in the environment. Newer and smaller firms, as a result, take away market
share in spite of disadvantages like lack of capital, brand names and corporate reputation with
older firms.
5.2 Conclusion
The results obtained from the model shows that size of the company, liquidity position of the
firm and age of the firm positively influence the financial performance of private solid waste
management companies in Nairobi. However, the study revealed that leverage position of the
43
firm negatively impacts on the financial performance of the company. Previous studies on the
factors affecting financial performance of firms established that company size can predict the
future stock price for instance large firms have better financial performance. This finding reveals
why bigger firms are more competitive than smaller firms in harnessing economies of scale in
transactions and enjoy a higher level of profits. The study asserted that increase in company size
increases the performance of the bank. The study finding contends that the size of the firm can
affect its financial performance. However, for firms that become exceptionally large, the effect
of size could be negative due to bureaucratic and other reasons
The study established that financial performance is the outcome of all of the organisation’s
operations and strategies measuring performance accurately is critical for the accounting
purposes and remains a central concern for most organisations. Performance measurement
systems provide the foundation to develop strategic plans, assess an organisation’s completion
objectives; and remunerate manager. Although assessment of performance in the past literature is
still very important, it is also complicated while consensual measurement of performance
promotes scholarly investigations and can clarify managerial decisions; managers have not been
able to find clear, current and reliable measures of performance on which marketing merit could
be judged. Two approaches have been adopted in the literature to measure financial performance.
The first subject measures the performance of forms based on their own evaluation and
expectations or comparison with their competitors, the second is objective, based on the absolute
measure of performance such as financial ratios. Finance is always being disregarded in financial
decision making since it involves investment and financing in the short-term period. Further, it
also acts as a restrain in financial performance, since it does not contribute to return on equity .A
well designed and implemented financial management is expected to contribute positively to the
creation of a firm’s value.
5.3 Recommendations of Policies and Practices
Based on the study findings, the study recommends that private solid waste companies should
avoid operating in debt. Leverage refers to the proportion of debt and equity in the capital
structure of a firm. The financing or leverage decision is a significant managerial decision
because it influences the shareholder’s return and risk and the market value of the firm. The ratio
44
of debt-equity has implications for the shareholder’s dividends and risk, this affect the cost of the
capital and this reduces leverage position of the company. Solid waste management companies
should reduce debt financing of the companies since companies that are highly leveraged may be
at risk of bankruptcy if they are unable to make payments on their debt; they may also be unable to
find lenders in the future.
Solid waste companies should increase their liquid asset base which increases the ability of the
business to meet financial obligations on time. Solid waste company should use an investment
fund as liquid assets to finance its activities. Higher liquidity allows an investment fund to deal
with unexpected contingencies and to cope with its obligations during periods of low earnings.
This study moreover recommends that Dilemma in financial management is to achieve desired to
trade-off between liquidity, solvency and profitability .Management of working capital in terms
of liquidity and profitability management is essential for sound financial recital as it has a direct
impact on profitability of the company .The crucial part in managing working capital is
maintaining its liquidity in day to day operation to ensure its smooth running and meets its
obligations. Ultimately goal of profitability can be achieved by efficient use of resources.
Financial performance is concerned with maximisation of shareholders or owners’ wealth. It can
be attained through financial performance analysis. Financial performance is a measure of a
firm’s overall financial health over a given period of time.
5.4 Limitation of the Study
In carrying out this study, a limitation relating to the measurement of financial performance was
noted. In this regard, ROA was used to measure the financial performance of commercial banks.
However, financial performance could be measured using market ratios such as price earnings
ratio, market yield ratio among others. It is possible that if any of those ratios were included in
the study, the results would probably be different.
In view of the research findings a negative relationship between performance and leverage which
was established may have been attributed to the diminishing influence of lack of various
mechanisms which are unavoidable.
Performance ratios and opportunity only appear to be inversely related to big firms as their size
45
appears to subordinate their immediate financial interests to that of the overall goal of the firm
which is to maximize profitability. Consequently, there is need to reign in the tendencies in
smaller firms to favor bigger firms who double up as resources.
5.5 Suggestions for Further Study
Future studies should be conducted to establish the effect of credit access facilities on the
profitability of the solid waste management companies in Nairobi County. There is need for
further studies to carry out similar tests for a longer time period.
A similar study should also be carried out on solid waste management companies with total
income as the proxy for size to try and assess whether the relationship between financial factors
and size is drastically altered by the change of variables.
Given that a good chunk of the studies touch on factors affecting financial performance, there is
need to ascertain the relationship between the firm value as indicated by the various
organisational factors, and performance.
46
REFERENCES
Almajali, Y. A., Alamro, S. H., & Al-Soub, A. Z. (2012). Factors influencing the financial
performance of Jordanian Insurance Companies Listed at Amman Stock Exchange.
Journal of Management Research, 4(2).
Antwi-Agyei, P. (2009). Faecal sludge management: The case of madina, M.Sc. Thesis. Kwame
Nkrumah University of Science and Technology. Faculty of Civil and Geomatic
Engineering Department of Civil Engineering. 17, 30.
Appiah-Adu, K. (1998). Market orientation and performance: empirical test in a transition
economy. Journal of Strategic Marketing 6: 665-79.
Arnold, V. D. K. & Lardinois, I. (2010). Community and Private (formal and informal) Sector
Involvement in Municipal Solid Waste Management in Developing Countries. WASTE
Consultants, Advisers on Urban Environment and Development, Nieuwehaven 201, 2801
CW Gouda, the Netherlands.
Ashmos, D.P. & Huber G.P. (2006). The Systems Paradigm in Organization Theory: Correcting
the Record and Suggesting the Future. Academy of Management Review 12: 607-621.
Athanasoglou, P. B., Brissimis, S. N., & Delis, M. D. (2005). Bank-Specific, Industry-Specific
and Macroeconomic Determinants and Bank Profitability. Bank of Greece Working
Paper, No. 25.
Atrill, P. (2003). Financial Management for Decision Makers.
Awortwi N. (2003). Getting the fundamentals wrong: Governance of multiple modalities of basic
services delivery in three Ghanaian Cities PhD Thesis. ISS

47
Bangs, David H., Jr. (1992). Managing by the Numbers: Financial Essentials for the Growing
Business. Upstart Publishing, 1992.
Barako D. G., Hancock P. & Izan, H. Y. (2006). Factors Influencing voluntary corporate
disclosure by Kenyan companies. Corporate Governance: An Int. Rev. 14(2): 107 - 25.
Bartolanffy, L. (1976). Introduction. In H. Werley, A. Zurich, M. Zajkowski, and A. Zagornik.
eds. Health Research: The Systems Approach. New York: Springer Publishing.
Bartone, C. (2000). Strategies for Improving Municipal Solid Waste Management: Lessons from
World Bank Lending and CWG Activities. Workshop on Planning for Sustainable and
Integrated Solid Waste Management, Manila, 18-22: September 2000. Washington, DC:
Urban Management Division, World Bank.
Bartone, C. R., (1995). The role of the private sector in developing countries: Keys to success.
Paper presented at ISWA Conference on Waste Management - Role of the Private Sector,
Singapore, 24-25 September 1995.
Batley, R. (1996), ‘Public-Private Relationships and Performance in Service Delivery’, Urban
Studies, 33(4-5): 723-51.
Batra, G. (1999). Job Reallocation, the Export Market, and Firm Performance: Microeconomic
Evidence. World Bank Policy and Research; Business Environment Unit: Ref. 683-26;
10(1).
Baud, I. &. Post J. (2003). Between Market and Partnerships: Urban Solid Waste Management
and Contribution to Sustainable Development. GBER 3(1): 46 - 65.
Baud, I., Post, J. & Furedy C. (2004). Solid Waste Management and Recycling; Actors,
Partnerships and Policies in Hydrebad, India and Nairobi, Kenya. Dordrecht/Boston
/London, Kluwer Academic Publishers.
48
Baud, I.S.A., Grafakos, S., Hordijk, M. & Post, J. (2001), ‘QOL and Alliances in Solid Waste
Management: Contributions to Urban Sustainable Development’, Cities, 18(1): 1-10.
Bebbington, A. & McCourt, W. (2007). Explaining (and Obtaining) Development Success, in
Development Success: Statecraft in the South, edited by Anthony Bebbington and Willy
McCourt, 211-245.
Berk, J. & DeMarzo, P. (2007).Corporate finance, International ed., Pearson Education, Boston.
Boyatzi, R. (1982). The Competent Manager: A Model of Effective Performance, New York:
Wiley and sons.
Burgess, R., Carmona, M. & Kolstee, T. (1997). The Challenge of Sustainable Cities,
Neoliberalism and Urban Strategies in Developing Countries, Zed Books, London
Callan S. J. & Thomas J. M. (2001). Economies of scale and scope: a cost analysis of municipal
solid waste services. Land Economics, 77(3):548–60.
Casteuble, T. (1997). "Using Financial Ratios to Assess Performance." Association
Management. July 1997.
Chan A.P.C. (2008). Application of public private partnerships in Hong Kong special
Administrative Region: the critics’ perspectives. Journal of Management in Engineering.
Coffey, M. & Coad A. (2010). Collection of municipal solid waste in developing countries, Ed:
2nd. UN-Habitat, Nairobi.
Collins, J. C. (2001). Good to Great. HarperCollins, New York.
49
Copper K. & Schindler H., (2003). Research Methodology: Methods and Techniques New Delhi,
New Age International Publishers.
Damanpour, F. & Evan, W. (1984). Organisational innovation and performance: the problem of
organisational lag. Administrative Science Quarterly Journal, 29(392).
Dare, F. D. & Sola, O. (2010). Capital structure and corporate performance in Nigeria petroleum
industry: Panel data analysis. Journal of Mathematics and Statistics, 6(2): 168-173.
Denis, D. K. & McConnell, J. J. (2003). International Corporate Governance. The Journal of
Financial & Quantitative Analysis, 38(1).
Devas, N. (1999), Who Runs Cities? – The Relationship between Urban Governance, Service
Delivery and Urban Poverty, Theme Paper 4 of the Urban Governance, Partnership and
Poverty Programme, University of Birmingham, Birmingham.
Donnahoe, A. S. (1999). What Every Manager Should Know about Financial Analysis. Simon
and Schuster, 1999.
Dyck, A. & Zingales, L. (2004). Private Benefits of Control: An International Comparison. The
Journal of Finance, 59(2):537.
Eljelly, A. (2004). Liquidity – Profitability Tradeoff: An empirical investigation in an emerging
market, International Journal of Commerce & Management, 14(2). 48-61.
"Financial Analysis: 17 Areas to Review." Business Owner. January-February 1999.
Flamini, V., McDonald, C. & Schumacher, L. (2009). Determinants of Commercial Bank
Profitability in Sub-Saharan Africa. IMF Working Paper, 1 – 30.
50
Flood, R. L. (2008). Rethinking the 5th Discipline Learning within the Unknowable. New York:
Routledge.
Freeman, R. E. (1994). The politics of stakeholder theory. Bus. Ethics Quart. 4(4) 409–421.
Gill, J. O. (1994). Financial Basics of Small Business Success. Crisp Publications, 1994.
GoK Census, (2010). Kenya Population and Housing Census Results, Ministry of State for
Planning, National Development and Vision 2030.
Gross, K., (2007). Equity Ownership and Performance: An Empirical Study of German Traded
Companies, PhysicaVerlag, Germany.
Hagedoorn, J. & Cloodt, M. (2003). Measuring innovative performance: Is there an advantage of
using multiple indicators? Research Policy, 32(8), 1365-1379.
Hamel, G. & Prahalad, C. (1994). Competing for the Future. Harvard Business School Press,
Boston.
Hansen, R. & Mowen, M. (2005). Management Accounting, 7th Edition. Singapore: South –
Western.
Harrington, G., & Wilson, R. (1989). Governance and banks’ valuations. Journal of Financial
Intermediation, 16, 584-617.
Harrison, M. I. & Shiron, A. (2005). Organizational Diagnosis and Assessment. Bridging Theory
and Practice. Thousand Oaks: Sage.
Hatch, M. J. (2006). Organization Theory - Modern Symbolic and Postmodern Perspectives.
Oxford University Press.
51
Havnes, P. & Senneseth, K. (2001). A panel study of firm growth among SMEs in networks.
Small business economics, 293 – 302.
Hvide, H. K. & Moen, J. (2007). Liquidity Constraints and Entrepreneurial Performance.
Retrived November 2008, from ssrn.com: http://ssrn.com/abstract==10212012
Ikiara M. M., Karanja A. M., & Davies T. C., (2004). Collection, Transportation and Disposal of
Urban Solid Waste in Nairobi. Kluwer Academic Publishers – Dordrecht / Boston /
London
Ittner, C. & David, L. (1998). Are Non-Financial Measures Leading Indicators of Financial
Performance? An analysis of Customer Satisfaction. Journal of Accounting Research,
36(3), 1-35.
Jenkins, R. R. (1993). The Economics of Solid Waste Reduction, Hants, England: Edward Elgar
Publishing Limited
Kabajeh, M. A., AL-Nu’aimat, A.M., & Dahmash, F. N. (2012). The Relationship between the
ROA, ROE and ROI Ratios with Jordanian Insurance Public Companies Market Share
Prices. International Journal of Humanities and Social Science, 2(11)
Kakani, R., Saha, B. & Reddy, V. (2001). Determinants of Financial Performance of Indian
Corporate Sector in the Post- Liberation Era: An Exploration Study. NSE Research
Initiative Paper, (5): 12-30.
Kamau, A. (2009). Efficiency and Productivity of the Banking Sector in Kenya: An Empirical
Investigation. University of Nairobi.
Katz, D., & Kahn, R. L. (1978). The Social Psychology of Organization. 2nd ed. New York:
John Wiley & Sons
52
Kiamba, J. M. (2008) effect of corporate governance on financial performance of local
authorities. Unpublished MBA project. University of Nairobi
Knoben, J. & Oerlemans, L. A. (2006). The effect of firm performance on firm performance,
Regional Studies, 3.
Kristy, J. E. & Susan, Z. D. (1999). Finance without Fear. American Management Association,
1999.
Larkin & Howard (1996). "How to Read a Financial Statement." American Medical News.
March 11, 1996.
Lazaridis, D. (2006). Factors affecting the number of outside directorships held by CEOs.
Journal of Financial Economics. 40: 81-104.
Liargovas, P. & Skandalis, K. (2008). Factors affecting firms’ financial performance. The Case
of Greece, University of Peloponnese.
Majumdar, S. (1997). The Impact of Size and Age on Firm-Level Performance: Some Evidence
from India. Review of Industrial Organisation, 12: 231-241.
McCloskey, D. (1998). The Rhetoric of Economics. University of Wisconsin Press, Madison,
WI.
McConnell, A. 2010. Understanding Policy Success: Rethinking Public Policy, Palgrave
Macmillan, 265.
Meyer, J.W. (2007). Rationalized Environments. In J.W. Meyer, and W.R. Scott and associates.
Institutional Environments and Organizations: Structural Complexity and Individualism.
Thousand Oaks: Sage.
53
Monyoncho G.O. (2013). Solid Waste Management in Urban Areas of Kenya: A case study of
Lamu Town. Department of Real Estate and Construction Management. University of
Nairobi
Morgan, G. (2008). Images of Organization 2. Thousand Oaks: Sage.
Mugenda, O. M. & Mugenda, A.G., (2003). Research Methods: Quantitative & Qualitative
Approaches. Nairobi: Acts Press.
Muriithi A.M. (2004) The relationship between corporate governance mechanisms and
performance of firms quoted on the NSE. (Unpublished MBA Project.) University of
Nairobi, Nairobi, Kenya.
Mutai, P. & Njoroge, R., (2012). SWM a growing challenge in Kenya: Africa News Kenya
Focus, Nairobi: at http://www.coastweek.com/3535_solid.htm. Last accessed 4th
October, 2013.
Mwangi, F. W., (2007). Evaluation of Optimum Solid Waste Management Model for Nairobi,
M.Sc. Thesis, University of Nairobi, Kenya
NCC- UNEP, (2010). Integrated Solid Waste Management Plan for the City of Nairobi, Kenya:
Situation Analysis & Detailed Action Plan (City Council of Nairobi - United Nations
Environment Programme: 2010)
Ngumi, P. M. (2008). Corporate governance practices in housing finance company of Kenya,
Masters in Business Administration. University of Nairobi.
Nordhaug, O. & Gronhaug, K. (1994). Competencies as Resources, 5(1), February 1994, 89-103.
Oerlemans, L. & Meuss, H. (2001). Do organisational and spatial proximity impact on firm
performance? Regional studies, 39(1).
54
Ongore, V.O. (2011) The relationship between ownership structure and firm performance: An
empirical analysis of listed companies in Kenya. African Journal of Business
Management, 5(6), 2120-2128.
Onyango, F. (2000). The Influence of Dividends and Earnings Announcement on Shareholders’
Value of Companies Listed at the Nairobi Stock Exchange.
Otieno, F. A. O. (1992), Solid Waste Management in the City of Nairobi: What are the Prospects
for the Future? African Urban Quarterly, 7(1-2):142-9, February and May.
Padachi, C. B. (2006). Elite Directors and Firm Performance. Unpublished Master’s Thesis,
Stockhom School of Economics.
Pandey, I. M. (2007). Financial Management (9th Edition). New Delhi: Vikas Publishing House
Ltd
Panwala, M. (2009). Dimensions of liquidity management – A case study of the Surat Textile’s
Traders Co-operative Bank Ltd. Journal of Accounting Restrictions: 2(1): 69-78.
Peltenburg, M., de Wit, J. & Davidson, F. (2000). Capacity Building for Urban Management:
Learning from Recent Experiences, Habitat International, 24(4):363-73
Pierre, J. (1998). Partnerships in Urban Governance: European and American Experience,
MacMillan Press, London
Pont, M. & Shaw, R. (2003). Measuring marketing performance: A critique of empirical
literature, Paper presented at the ANZMAC, Adelaide, December 6.
Powell, W.W., & DiMaggio P. J. (2003). The New Institutionalism in Organizational Analysis.
Chicago: University of Chicago Press.

55
Rafuse, M. E. ((1996). Working Capital Management: An urgent need to refocus. Journal of
Management Decisions, 34(2): 59-63.
Rajesh, M. & Ramana, R. N. R. V. (2011). Impact of Working Capital Management on Firm’s
Profitability. Global Journal of Financial Management, 3(1): 151-158.
Rees, W. (2003). International Diversification and Firm Value. European Financial Management
Association.
Robbins, S.P. (2003). Essentials of organizational behavior (3rd edition). New Jersey: Pearson
Education
Rodic, L., Scheinberg, A. & Wilson, D.C. (2010). Comparing Solid Waste Management in the
World’s Cities. Key-note paper at ISWA World Congress 2010. Urban Development and
Sustainability – a Major Challenge for Waste Management in the 21st Century, Hamburg,
Germany, 15-18 November 2010.
Rondinelli, D.A. & Iacono, M. (1996), ‘Strategic Management of Privatisation: a Framework for
Planning and Implementation’, Public Administration and Development, 16, 247-63
Rotich, K. H. (2005). Municipal solid waste management challenges in developing countries-
Kenyan Case Study. Waste Management - 26(1) 2006: 92-100.
Scott, W. R. (2004). Organizations: Rational, Natural and Open Systems. New Jersey: Prentice
Hall.
Senkoro, H. (2003). Solid Waste Management in Africa: A WHO / AFRO Perspective. Paper 1,
presented in Dares salaam at the CWG Workshop, March 2003. Retrieved electronically:
http://www.skat.ch/sfweb/activities/ws/cwg/pdf/cwg-01.pdf.
56
Simerly, R. & Li, M. (2000). Environmental dynamism, financial leverage and performance: A
theoretical integration and empirical test. Strategic Management Journal, 21(1), 31-49.
Skelcher, C., (2010). ‘Governance of Public-Private Partnerships’ in Hodge, Graeme, Greve,
Carsten & Boardman, Anthony. 2010. International Handbook on Public-Private
Partnerships. Cheltenham: Edward Elgar.
Sorenson, B. & Stuart, E. (2000). Age, Obsolescence and Organisational Innovation. Academy of
Management Journal, 25.
Sundaram, A. & Inkpen, A. (2004). The corporate objective revisited. Organisational Science.
15(3) 350–363.
Tangen, S. (2003). An overview on frequently used performance measures. International
Journal of Productivity and Performance Management, 52(7), 347 – 354.
Thompson, J. D. 1967. Organizations in Action: Social Science Bases of Administrative Theory.
New York: McGraw Hill.
Tvarnø, C.D. (2010). Law and regulatory aspects of public–private partnerships: contract law
and public procurement law, in Hodge, G.A., Greve, C. and Boardman, A. (Eds)
International Handbook in Public-Private Partnerships, Edward Elgar, UK, 216-236
UNEP, (2005). Selection, design and implementation of economic instruments in: Solid Waste
Management, Nairobi.
United Nations Centre for Human Settlements (1998), Privatization of Municipal Services in
East Africa, a Governance Approach to Human Settlements Management, Nairobi,
http://www.unchs.org/unchs/planning/privat.
Walker, D. (2001). Exploring the Human Capital Contribution to Productivity, Profitability and
the Market Evaluation of the Firm, available on: http:/wwwlib.urni.com/dissertations
57
Walls, M. & Palmer, K. (1997). Upstream Political Downstream Waste Disposal, and the Design
of Comprehensive Environmental Policies. Resources for the Future Discussion Paper
97-51-REV, September.
Wang H., He J., Yoonhee K., Kamata T., (2011). Municipal Solid Waste Management. An
Economic Analysis Conducted in Yunnan, China. The World Bank, Development
Research Group, Environment and Energy Team: Policy Research Working Paper, 5767
Wangombe J.G (2003) “A survey of corporate governance practices in co-operatives SACCO
societies in Nairobi.
Weick, K. (2002). The Social Psychology of Organizing 2. New York: McGraw Hill.
Werna, E. (1998). Urban Management, the Provision of Public Services and Intra-urban
Differentials in Nairobi, Habitat International, 22(1):15-26
Wheelen, L. T. & Hunger, D. J. (2002). Strategy formulation. In strategic management and
business policy, 8(12). New Jersey: Prentice Hall.
Woodruffe, C. (1993). What is meant by competency? Leadership and Organisational Journal,
14(1), 29-36.
WSP, (2005). Understanding small scale providers of sanitation services: A case of Kibera, field
note, Water and sanitation program-Africa, Nairobi.
Yuqi, L. (2007). Determinants of Bank Profitability and its Implication on Risk Management
Practices: Panel Evidence from the UK. The University of Nottingham.
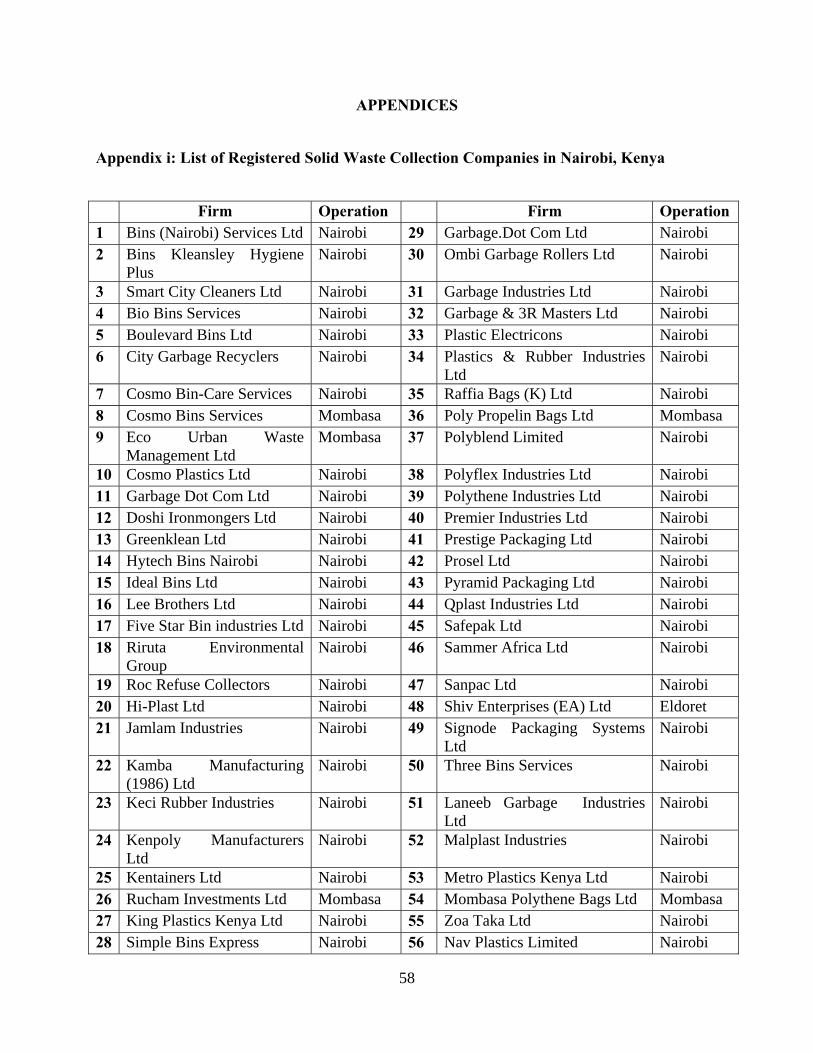
58
APPENDICES
Appendix i: List of Registered Solid Waste Collection Companies in Nairobi, Kenya
Firm Operation Firm Operation 1 Bins (Nairobi) Services Ltd Nairobi 29 Garbage.Dot Com Ltd Nairobi 2 Bins Kleansley Hygiene
Plus Nairobi 30 Ombi Garbage Rollers Ltd Nairobi
3 Smart City Cleaners Ltd Nairobi 31 Garbage Industries Ltd Nairobi 4 Bio Bins Services Nairobi 32 Garbage & 3R Masters Ltd Nairobi 5 Boulevard Bins Ltd Nairobi 33 Plastic Electricons Nairobi 6 City Garbage Recyclers Nairobi 34 Plastics & Rubber Industries
Ltd Nairobi
7 Cosmo Bin-Care Services Nairobi 35 Raffia Bags (K) Ltd Nairobi 8 Cosmo Bins Services Mombasa 36 Poly Propelin Bags Ltd Mombasa 9 Eco Urban Waste
Management Ltd Mombasa 37 Polyblend Limited Nairobi
10 Cosmo Plastics Ltd Nairobi 38 Polyflex Industries Ltd Nairobi 11 Garbage Dot Com Ltd Nairobi 39 Polythene Industries Ltd Nairobi 12 Doshi Ironmongers Ltd Nairobi 40 Premier Industries Ltd Nairobi 13 Greenklean Ltd Nairobi 41 Prestige Packaging Ltd Nairobi 14 Hytech Bins Nairobi Nairobi 42 Prosel Ltd Nairobi 15 Ideal Bins Ltd Nairobi 43 Pyramid Packaging Ltd Nairobi 16 Lee Brothers Ltd Nairobi 44 Qplast Industries Ltd Nairobi 17 Five Star Bin industries Ltd Nairobi 45 Safepak Ltd Nairobi 18 Riruta Environmental
Group Nairobi 46 Sammer Africa Ltd Nairobi
19 Roc Refuse Collectors Nairobi 47 Sanpac Ltd Nairobi 20 Hi-Plast Ltd Nairobi 48 Shiv Enterprises (EA) Ltd Eldoret 21 Jamlam Industries Nairobi 49 Signode Packaging Systems
Ltd Nairobi
22 Kamba Manufacturing (1986) Ltd
Nairobi 50 Three Bins Services Nairobi
23 Keci Rubber Industries Nairobi 51 Laneeb Garbage Industries Ltd
Nairobi
24 Kenpoly Manufacturers Ltd
Nairobi 52 Malplast Industries Nairobi
25 Kentainers Ltd Nairobi 53 Metro Plastics Kenya Ltd Nairobi 26 Rucham Investments Ltd Mombasa 54 Mombasa Polythene Bags Ltd Mombasa 27 King Plastics Kenya Ltd Nairobi 55 Zoa Taka Ltd Nairobi 28 Simple Bins Express Nairobi 56 Nav Plastics Limited Nairobi

59