Embed Size (px)
Citation preview

Graefe's Arch Clin Exp Ophthalmol (1990)228:338-341 Graefe's Archive [or Clinical and Experimental
Ophthalmology © Springer-Verlag 1990
Factors that influence the prevalence of positive catch trials in glaucoma patients Mark Reynolds 1, William C. Stewart 1, and Susan Sutherland 2
1 Department of Ophthalmology and 2 Department of Biometry, Medical University of South Carolina, Charleston, SC, USA
Received November 21, 1989 / Accepted January 19, 1990
Abstract. We eva lua ted fac tors tha t inf luence the ca tch- tr ial response in a u t o m a t e d pe r ime t ry by consecut ively examin ing 408 g l a u c o m a pa t ien t s (703 eyes) wi th e i ther the p r o g r a m 30-2 o r a 76-po in t screen wi th a quan t i f i ed defect on the H u m p h r e y F ie ld Ana lyzer . The preva lence o f posi t ive ca tch tr ials us ing b o t h p r o g r a m s was : 15.9% f ixat ion losses, 5 .5% false-posi t ives , and 17.0% false- negat ives. The on ly s ignif icant difference be tween the two p r o g r a m s was a lower preva lence o f fa lse-negat ives on the p r o g r a m 30-2 ( P < 0.01). Fa lse -pos i t ive responses showed a s ignif icant posi t ive co r re la t ion to f ixa t ion losses, and the ca tch t r ia l response in genera l was corre- la ted s ignif icant ly to defect dep th , test t ime, age, and visual acui ty ( P < 0.05). This s tudy suggests t ha t the pre- valence o f posi t ive ca tch tr ials is no t an i n d e p e n d e n t var iab le when tes t ing g l a u c o m a pa t ien ts wi th a u t o m a t e d pe r ime t ry and is no t r educed by us ing a screening s t ra te- gy over a fu l l - th reshold exam.
Introduction
A u t o m a t e d pe r ime t ry p rov ides an object ive eva lua t ion o f pa t i en t dependab i l i t y by us ing ca tch- t r i a l tests, which m a y inc lude assessment o f f ixa t ion losses, as well as fa lse-posi t ive and negat ive errors . The h igher the per- centage o f posi t ive ca tch tr ials , p r o b a b l y the m o r e l ikely it is t ha t the e x a m i n a t i o n is unrel iable .
However , few d a t a exist t ha t show the n o r m a l ca tch- tr ial response in pa t i en t s wi th g l a u c o m a and how it de- pends on o the r var iables in the visual field exam. The p u r p o s e o f this s tudy was to de te rmine the average ca tch- t r i a l response in pa t ien ts wi th g l aucoma tested on the H u m p h r e y F ie ld A n a l y z e r us ing ei ther a screening s t ra tegy with a quan t i f i ed defect or a fu l l - th reshold exam. Also , var iables tha t m a y poss ib ly have inf luenced the ca tch- t r i a l response were eva lua ted as well.
Offprint requests to: W. Stewart, Storm Eye Institute, Medical Uni- versity of South Carolina, 171 Ashley Avenue, Charleston, SC 29425, USA
Materials and methods
We included in this study patients with either glaucoma or ocular hypertension who were consecutively examined with automated perimetry at the Medical University of South Carolina. We ex- cluded only patients with known neurologic disease or those who were unable to complete the visual field examination.
Each visual field examination was performed on the Humprey Field Analyzer, which is a single-unit projection perimeter with a 330-mm bowl and a 31.5 apostilb background. The programs used were either the 30-2 or a 76-point screen with a quantified defect. Both programs have similar grid patterns testing 76 loca- tions in the central 30 ° . Locations are separated by 6 ° and are offset symmetrically from the vertical and horizontal midlines.
The program 30-2 performs a full-threshold exam at each loca- tion by first presenting a stimulus at an intensity based on the patient's expected threshold level. If the patient sees the stimulus, the program decreases the intensity by 4 dB steps until not seen. The program then increases the intensity by 2 dB steps until the patient again perceives the stimulus, which is considered the thresh- old for that location.
However, if the patient fails to see the initial stimulus, the program increases the stimulus intensity by 4 dB steps until it is seen. The program then decreases the stimulus intensity by 2 dB steps until it is not seen, which represents the threshold.
Conversely, the 76-point screen with a quantified defect pres- ents a stimulus which is 6 dB brighter than the expected threshold at each location. If the patient sees this stimulus, the location is considered normal and no further testing is performed. However, if the patient fails to perceive the initial stimulus, then a full-thresh- old exam is completed as outlined above. This screening program has been shown to have a similar sensitivity in diagnosing glauco- matous defects, but in less time than the program 30-2, and was studied to determine if a shorter examination helped improve the catch trial results [9].
To measure patient reliability, the Humphrey Field Analyzer uses, among other parameters, three separate catch trial tests that include determination of the percentage of fixation losses, as well as false-positive and false-negative responses. Fixation is assessed by projection of an occasional stimulus into the blind spot. If the patient fails to see the stimulus, then proper fixation is assumed. Conversely, if the patient perceives the stimulus, fixation is consid- ered lost.
The false-positive test is performed by the perimeter moving the projection apparatus without a stimulus presentation. Patient response to the sound of the moving projection apparatus indicates a false-positive test. A false-negative test is accomplished by the perimeter projecting a much brighter stimulus than previously seen

339
at the same location. If a patient fails to respond to the brighter stimulus, a false-negative is registered.
We analyzed the results of the catch trial tests as a percentage of positive responses to the number of times tested. Other variables assessed were the patient's age, visual acuity, length of time to perform the visual field exam, and the total loss of decibels for all 76 locations. The 30-2 and 76-point screen with a quantified defect were evaluated separately and were compared using a stu- dents t-test Also, left and right eyes were analyzed individually, but since no statistical difference was seen in the results between eyes, the data were combined for presentation (P>0.05 t-test). Significant association of both catch trials to each other, and addi- tionally measured variables were evaluated by using correlation analysis. This statistical method shows quantitative strength of ei- ther a negative or positive linear association.
Results
A total o f 408 patients (703 eyes) were included in the study. Of these, 168 patients (291 eyes) were tested with the p r o g r a m 30-2; 148 were right and 143 were left eyes. Two hundred for ty patients (412 eyes) were tested with the 76-point screen with a quantif ied defect; 198 were right and 214 were left eyes.
Patients tested with the 30-2 had an average age o f 60.0___16 years (range 13 to 91) and an average visual acuity between 20/40 and 20/50 (range 20/15 to 20/400).
Table 1. Average percentage, standard deviation, and range of posi- tive catch trials using both the 30-2 and the 76-point screen with a quantified defect programs
Program 30-2
Percent (SD) Range
76-Point screen with a quantified defect
Percent (SD) Range
Fixationloss 16.3_+18.3 0%- 93% 15.8_+19.3 0%- 97% False-positive 5.2_+11.0 0%- 91% 5.7_+12.2 0%- 89% False-negative 14.9_+20.2" 0%-100% 23.9_+29.7* 0%-100%
* Significant difference between programs, (P< 0.01)
The mean time to complete the test was 15.3_+ 3.5 rain (range 4.7 to 28). The average depth o f defect for all 76 points was 737 + 649 dB (range 1.0 to 2557 dB). The prevalence o f positive catch trials is shown for the pro- g ram 30-2 in Table 1.
Patientes tested with the 76-point screen with a quan- tified defect had an average age o f 64.5 ___ 14 years (range 13 to 93) and an average visual acuity between 20/50 and 20/60 (range 20/15 to 20/400). The mean time to complete the test was 8.7_+5.7 min (range 3.2 to 22). The average depth o f defect for all 76 points was 432_+ 448 dB (range 0-1949 dB). The prevalence o f positive catch trials for the 76-point screen with a quantified defect is shown in Table 1. There was a significant differ- ence between the results o f the false-negative catch trials between the two p rograms ( P < 0.01), but no t for false- positives or f ixation losses.
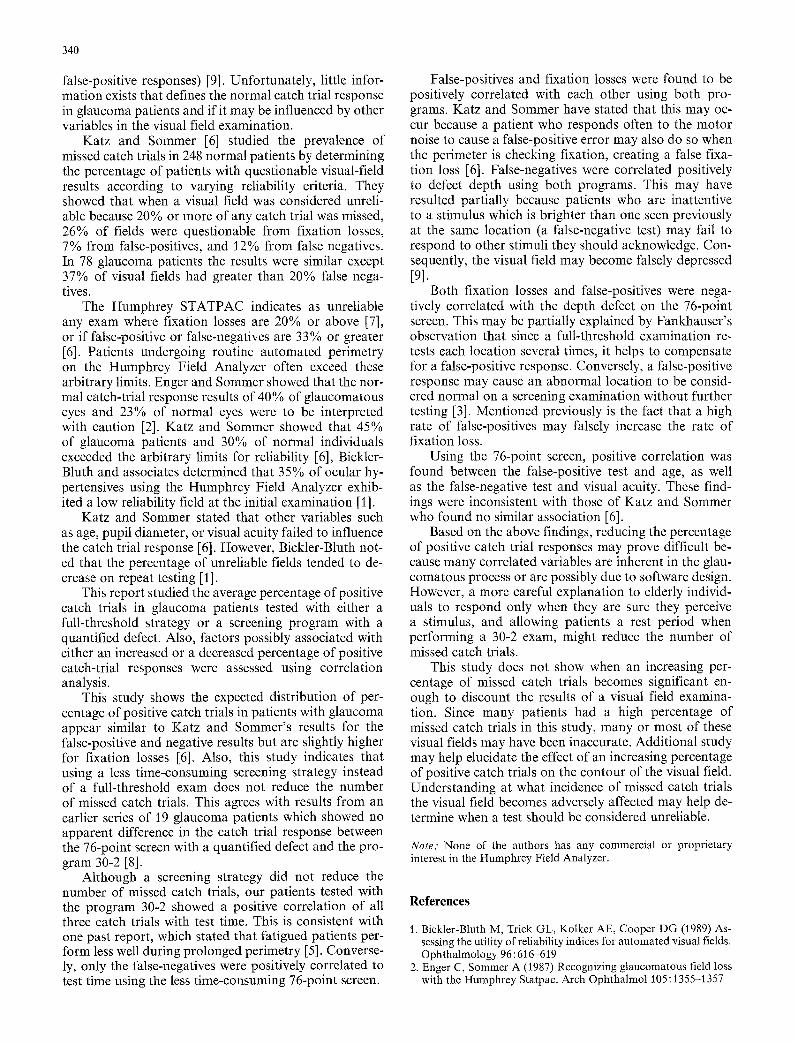
Corre la t ion analysis o f the catch trial tests to each other and to age, visual acuity, test time, and depth o f defect is shown in Table 2 for patients tested with the p rog ram 30-2. Each catch trial was significantly positively related to test time. Also, false-positives were positively correlated to fixation losses and false-nega- tives to defect depth.
Table 3 presents the correlat ion analysis o f the catch trial response in patients tested with the 76-point screen with a quantif ied defect. False-positive responses dem- onst ra ted a significant positive correlat ion with fixation losses and pat ient age and false-negatives to depth de- fect, visual acuity, and test time. Conversely, depth de- fect showed a significant negative correlat ion to bo th fixation losses and false-positives.
Discussion
A disadvantage o f manua l per imetry is the subjective analysis o f pat ient coopera t ion per formed by the techni- cian [4]. In au toma ted perimetry, pat ient reliability m a y be assessed objectively by at least three types o f catch trial tests (fixation losses and false-negative, as well as
Table 2. Rho values using the program 30-2
Catch trial Age Visual Fixation False- False- Test Depth acuity loss positive negative time defect
Fixation loss 0.0373 0.0843 - 0.5293 * 0.0625 0.4159" - 0.0627 False positive 0.0397 -0.0563 0.5293" - 0.0547 0.4416" -0.0702 False negative 0.1045 0.1159 0.0625 0.0547 - 0.2192' 0.3831 *
* P < 0.05 significance level
Table 3. Rho values using the 76-point screen with a quantified defect
Catch trial Age Visual Fixation False- False- Test Depth acuity loss positive negative time defect
Fixation loss 0.0184 0.0544 - 0.3756* 0.0102 -0.0616 -0.1822" False-positive 0.1261" 0.0037 0.3756* - 0.0776 -0.0603 -0.1321" False-negative 0.09]5 0.1902" 0.0102 0.0776 - 0.3777* 0.5377*
* P< 0.05 significance level
340
false-positive responses) [9]. Unfortunately, little infor- mation exists that defines the normal catch trial response in glaucoma patients and if it may be influenced by other variables in the visual field examination.
Katz and Sommer [6] studied the prevalence of missed catch trials in 248 normal patients by determining the percentage of patients with questionable visual-field results according to varying reliability criteria. They showed that when a visual field was considered unreli- able because 20% or more of any catch trial was missed, 26% of fields were questionable from fixation losses, 7% from false-positives, and 12% from false negatives. In 78 glaucoma patients the results were similar except 37% of visual fields had greater than 20% false nega- tives.
The Humphrey STATPAC indicates as unreliable any exam where fixation losses are 20% or above [7], or if false-positive or false-negatives are 33% or greater [6]. Patients undergoing routine automated perimetry on the Humphrey Field Analyzer often exceed these arbitrary limits. Enger and Sommer showed that the nor- mal catch-trial response results of 40% of glaucomatous eyes and 23% of normal eyes were to be interpreted with caution [2]. Katz and Sommer showed that 45% of glaucoma patients and 30% of normal individuals exceeded the arbitrary limits for reliability [6], Bickler- Bluth and associates determined that 35% of ocular hy- pertensives using the Humphrey Field Analyzer exhib- ited a low reliability field at the initial examination [1].
Katz and Sommer stated that other variables such as age, pupil diameter, or visual acuity failed to influence the catch trial response [6]. However, Bickler-Bluth not- ed that the percentage of unreliable fields tended to de- crease on repeat testing [1].
This report studied the average percentage of positive catch trials in glaucoma patients tested with either a full-threshold strategy or a screening program with a quantified defect. Also, factors possibly associated with either an increased or a decreased percentage of positive catch-trial responses were assessed using correlation analysis.
This study shows the expected distribution of per- centage of positive catch trials in patients with glaucoma appear similar to Katz and Sommer's results for the false-positive and negative results but are slightly higher for fixation losses [6]. Also, this study indicates that using a less time-consuming screening strategy instead of a full-threshold exam does not reduce the number of missed catch trials. This agrees with results from an earlier series of 19 glaucoma patients which showed no apparent difference in the catch trial response between the 76-point screen with a quantified defect and the pro- gram 30-2 [8].
Although a screening strategy did not reduce the number of missed catch trials, our patients tested with the program 30-2 showed a positive correlation of all three catch trials with test time. This is consistent with one past report, which stated that fatigued patients per- form less well during prolonged perimetry [5]. Converse- ly, only the false-negatives were positively correlated to test time using the less time-consuming 76-point screen.
False-positives and fixation losses were found to be positively correlated with each other using both pro- grams. Katz and Sommer have stated that this may oc- cur because a patient who responds often to the motor noise to cause a false-positive error may also do so when the perimeter is checking fixation, creating a false fixa- tion loss [6]. False-negatives were correlated positively to defect depth using both programs. This may have resulted partially because patients who are inattentive to a stimulus which is brighter than one seen previously at the same location (a false-negative test) may fail to respond to other stimuli they should acknowledge. Con- sequently, the visual field may become falsely depressed [9].
Both fixation losses and false-positives were nega- tively correlated with the depth defect on the 76-point screen. This may be partially explained by Fankhauser's observation that since a full-threshold examination re- tests each location several times, it helps to compensate for a false-positive response. Conversely, a false-positive response may cause an abnormal location to be consid- ered normal on a screening examination without further testing [3]. Mentioned previously is the fact that a high rate of false-positives may falsely increase the rate of fixation loss.
Using the 76-point screen, positive correlation was found between the false-positive test and age, as well as the false-negative test and visual acuity. These find- ings were inconsistent with those of Katz and Sommer who found no similar association [6].
Based on the above findings, reducing the percentage of positive catch trial responses may prove difficult be- cause many correlated variables are inherent in the glau- comatous process or are possibly due to software design. However, a more careful explanation to elderly individ- uals to respond only when they are sure they perceive a stimulus, and allowing patients a rest period when performing a 30-2 exam, might reduce the number of missed catch trials.
This study does not show when an increasing per- centage of missed catch trials becomes significant en- ough to discount the results of a visual field examina- tion. Since many patients had a high percentage of missed catch trials in this study, many or most of these visual fields may have been inaccurate. Additional study may help elucidate the effect of an increasing percentage of positive catch trials on the contour of the visual field. Understanding at what incidence of missed catch trials the visual field becomes adversely affected may help de- termine when a test should be considered unreliable.
Note: None of the authors has any commercial or proprietary interest in the Humphrey Field Analyzer.
References
1. Bickler-Bluth M, Trick GL, Kolker AE, Cooper DG (1989) As- sessing the utility of reliability indices for automated visual fields. Ophthalmology 96: 616-619
2. Enger C, Sommer A (1987) Recognizing glaucomatous field loss with the Humphrey Statpac. Arch Ophthalmol 105:1355-1357

341
3. Fankhauser F (1983) Perimeter digest. Interzeag, Bern, p 31 4. Fankhauser F, Spahr J, Bebie H (1977) Some aspects of the
automation of perimetry. Surv Ophthalmol 22:131 141 5. Heijl A, Drance SM (1983) Changes in differential threshold
in patients with glaucoma during prolonged perimetry. Br J Oph- thalmol 67:512-516
6. Katz J, Sommer A (1988) Reliability indexes of automated peri- metric tests. Arch Ophthalmol 106:1252-1254
7. Owner's Manual for Humphrey Field Analyzer (1986) Allergan Humphrey, San Leandro, Calif, pp 6-30
8. Stewart WC, Shields MB, Ollie AR (1989) Full threshold versus quantification of defects for visual field testing in glaucoma. Graefe's Arch Clin Exp Ophthalmol 227 : 51-54
9. Whalen WR (1985) Routine reliability parameters. In: Whalen WR, Spaeth GL (eds) (1985) Computerized visual fields. What they are and how to use them. Slack, Thorofare, N.J., pp 85-86