Embed Size (px)
Citation preview
, ,.2323
A LOADING STUDY OF OLDER HIGHWAY BRIDGES IN VIRGINIA
Part 2
A Concrete Slab and Steel Beam Bridge in Clarke County
by
H. L. Kinnier Faculty Research Engineer
and
L. Lo Ichter Graduate Assistant
(The opinions, findings, and conclusions expressed in this report are those of the authors and not necessarily those of
the sponsoring agencies.)
Virginia Highway & Transportation Research Council (A Cooperative Organization Sponsored Jointly by the Virginia
Department of Highways & Transportation and the University of Virginia)
Charlottesville, Virginia
November 1976 VHTRC 77-R26

2324
2325
SUMMARY
A 60-foot non-composite steel beam and concrete deck highway bridge span over the Shenandoah River on Route 7 in Clarke County was tested with a 23-ton, tandem axle test vehicle in July1975. Strain gages were placed near midspan on the lower flanges, the webs and the upper flanges of the steel stringers (W36 x 150) and in one position on the underside of the concrete deck. Midspan deflections were measured for each ofthe five stringers. The purpose of the study was to deterNine the present capacity of this typical design that was used extensively in the 1920s and 1930s when no shear connectors were employed to provide composite action.
The results indicated that the experimental stresses from static live loading were well below the calculated stresses based on conventional design theory and distribution factors. The dis- tribution of the test load to each of the five stringers for five lateral positions of the test vehicle was similar to the distri- butions found in earlier studies, (see references 3 and 4), for composite spans.
iii

• 2326
2-327
A LOADING STUDY OF OLDER HIGHWAY BRIDGES IN VIRGINIA
Part 2
A Concrete Slab and Steel Beam Bridge in clarke County
by
H. L. Kinnier Faculty Research Engineer
and
L. L. Ichter Graduate Assistant
BACKGROUND..
A large number of highway bridges designed and constructed in the 1920-45 period for the AASHTO H-IS standard loading remain in use on both the Virginia primaryAnd secondary systems. Although truck loadings have generally increased since that period, there is some reluctance to post these bridges for limited live loading unless deterioration or deadweight overloads from excess asphalt wearing surfaces have developed. Periodically, proposals are made in the state legislature to increase the legal loads allowed on one or
more of the categories of Virginia highways, generally the interstate system or the primary system. It is recognized, however, that an increase in the allowed loading on one highway system has a spillover effect on the other, lower rated systems. Consequently, a proven method of accurately appraising the live load capacity of some of the older bridge types remaining in use would be of value to those technical personnel responsible for recommendations when legal high- way live load increases are being considered or when decisions are made on the granting of overload permits.
OBJECTIVE,.
The purpose of this study was to determine experimentally the live load stresses that are developed from standard design loadings in key members or critical locations of the three older bridge categories that exist in large numbers throughout the primary and secondary systems of Virginia; namely, (i) steel truss spans,

(2) steel beam spans, and (3) concrete beam spans. The Part i RePort, issued in February 1976, presented test results from a steel truss bridge tested in July 1974. Part 2 reports on a steel beam span testedin July 1925.
DESCRIPTION OF THE TEST STRUCTURE
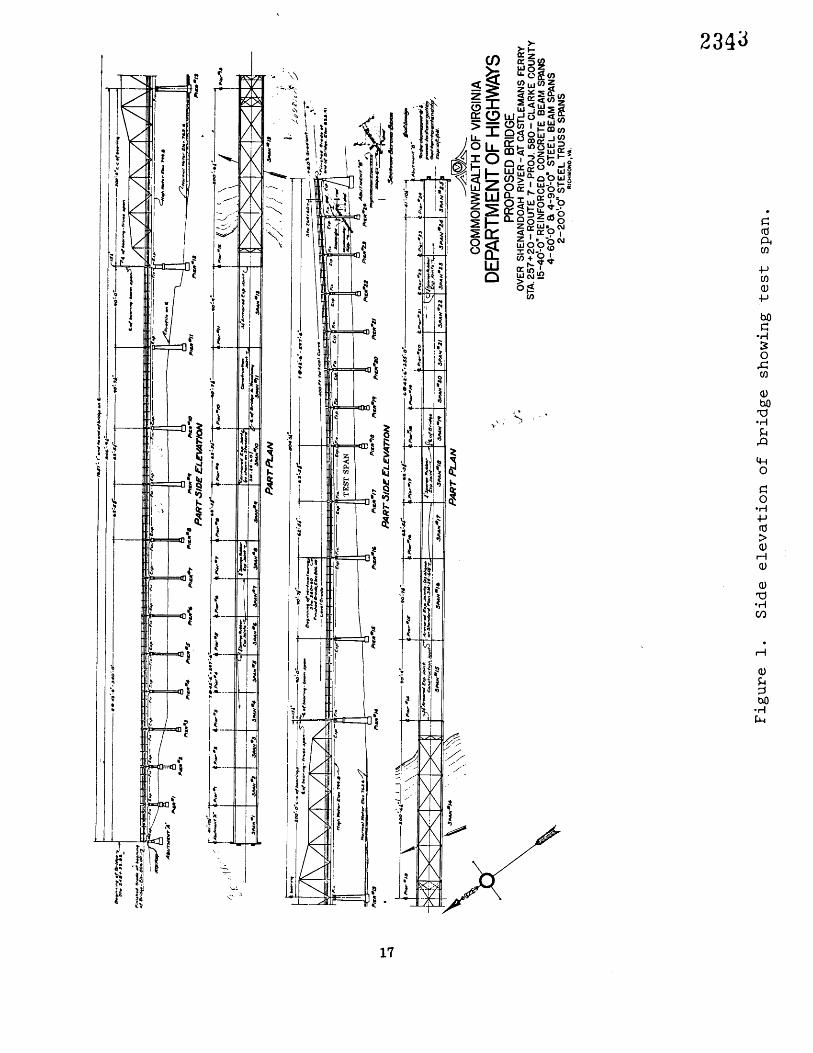
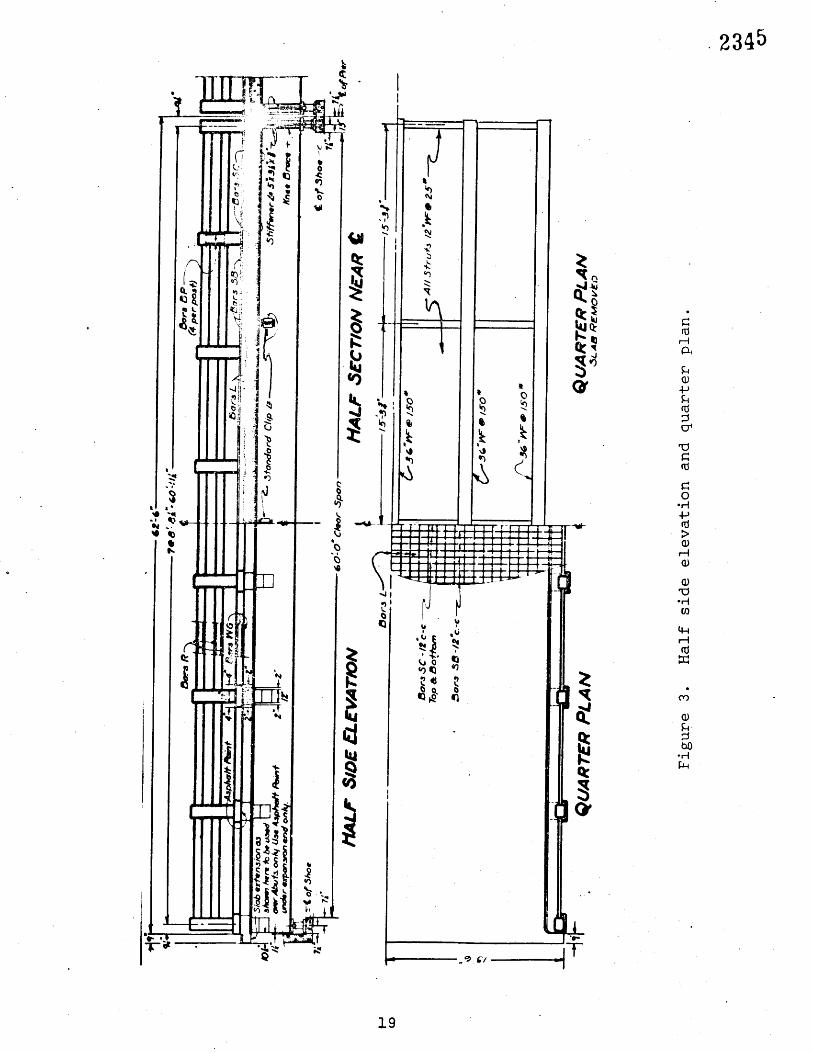
The structure selected for testing (a 60'-0" steel beam span) is one of 25 spans of the bridge on the eastbound roadway of Route 7 over the Shenandoah River in Clarke County,-5 miles east of Berry- ville. The bridge is made up of fifteen 40'-0"• reinforced concrete beam spans, four 60'-0" and four 90'-0" steel beam spans, and two 200'-0" steel truss spans. See Figures i and 2*. The structure was constructed in 1939 and plans are available from the Bridge Office of the Virginia Department of Highways and Transportation under the designation of LXXiV-25. dated October 20, 1938. The test span was constructed from the standard plan designated SM-24-60 dated July 1932. Figures 3 and 4 show a half side elevation, a quarter plan and a half transverse section of the superstructure.
The bridge was designed and constructed in accordance with the Virginia Department of Highways Bridge Specifications, 1932 for an H-15 Standard "AASHTO loading.
INSTRUMENTATION
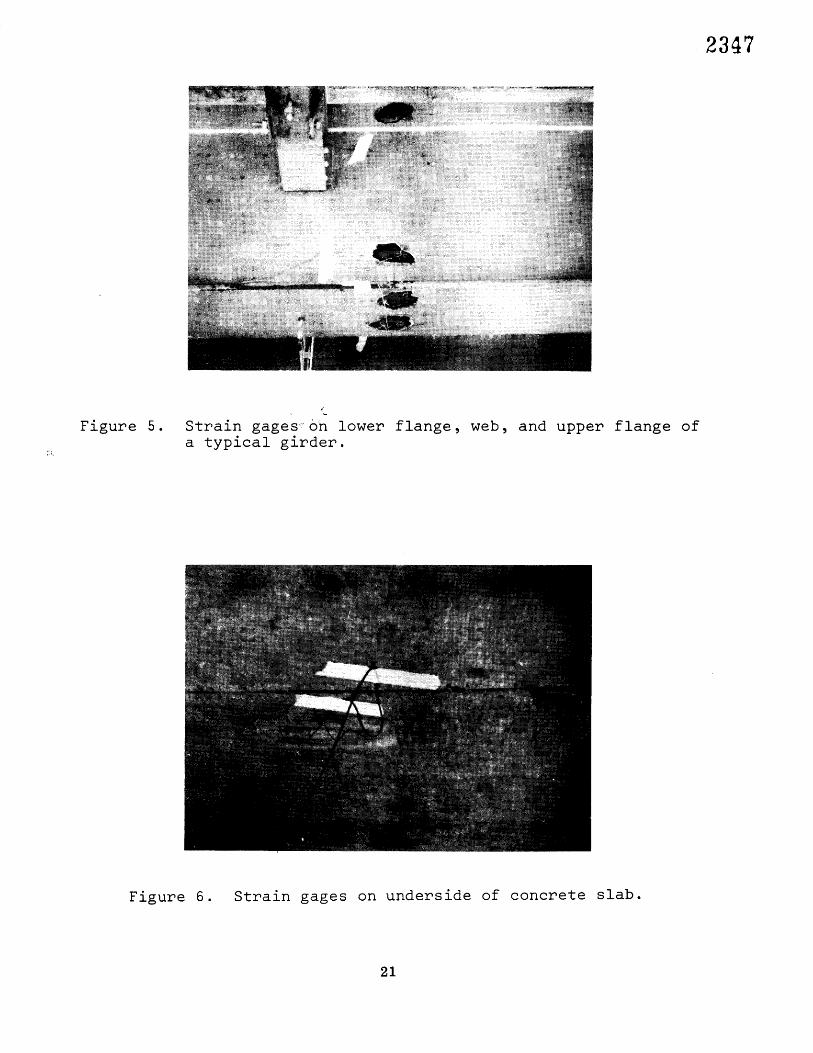
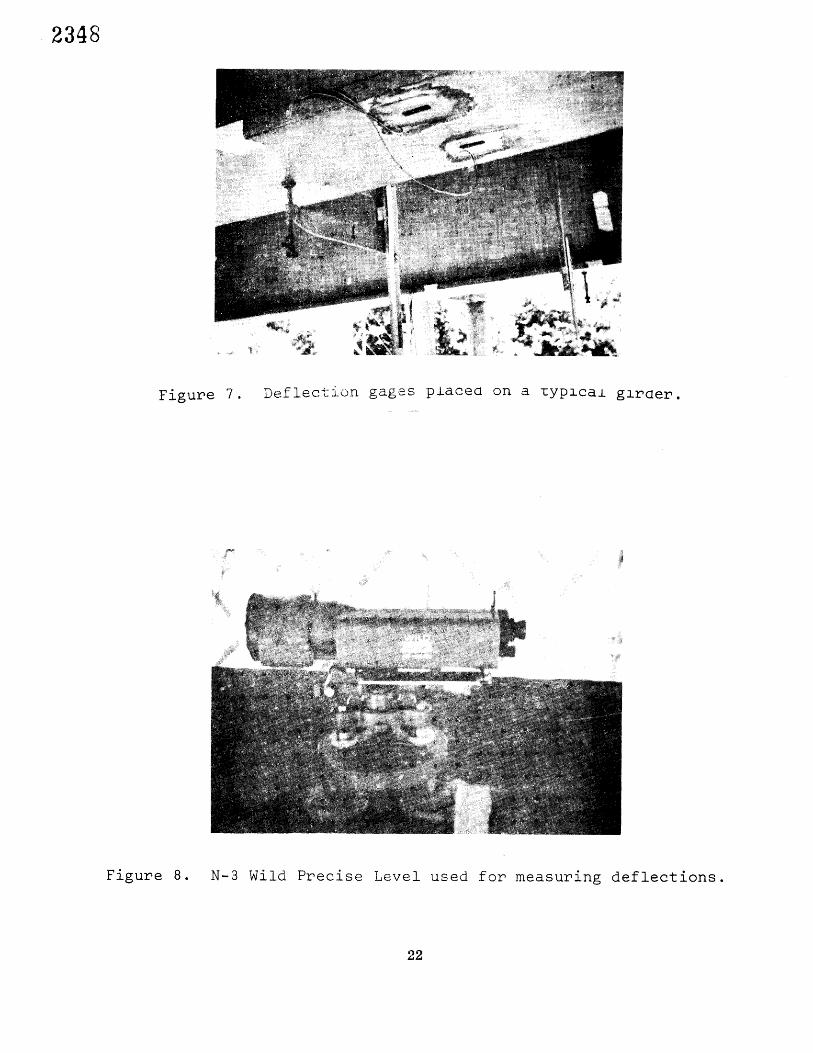
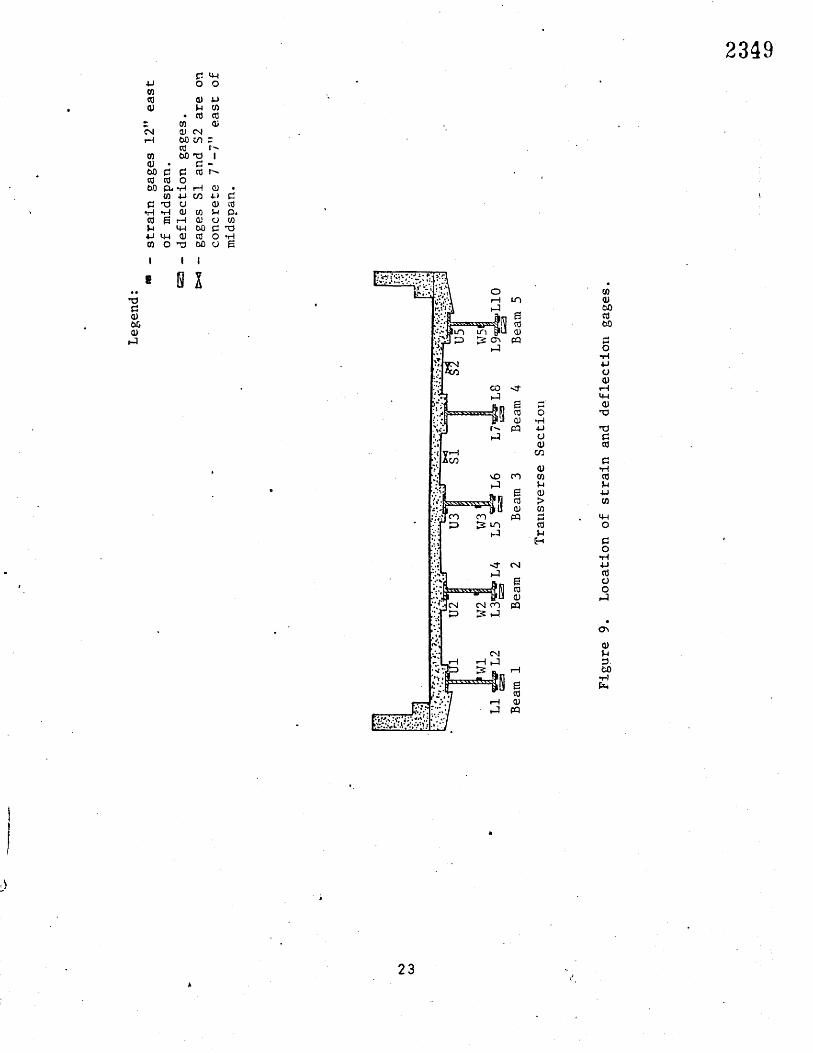
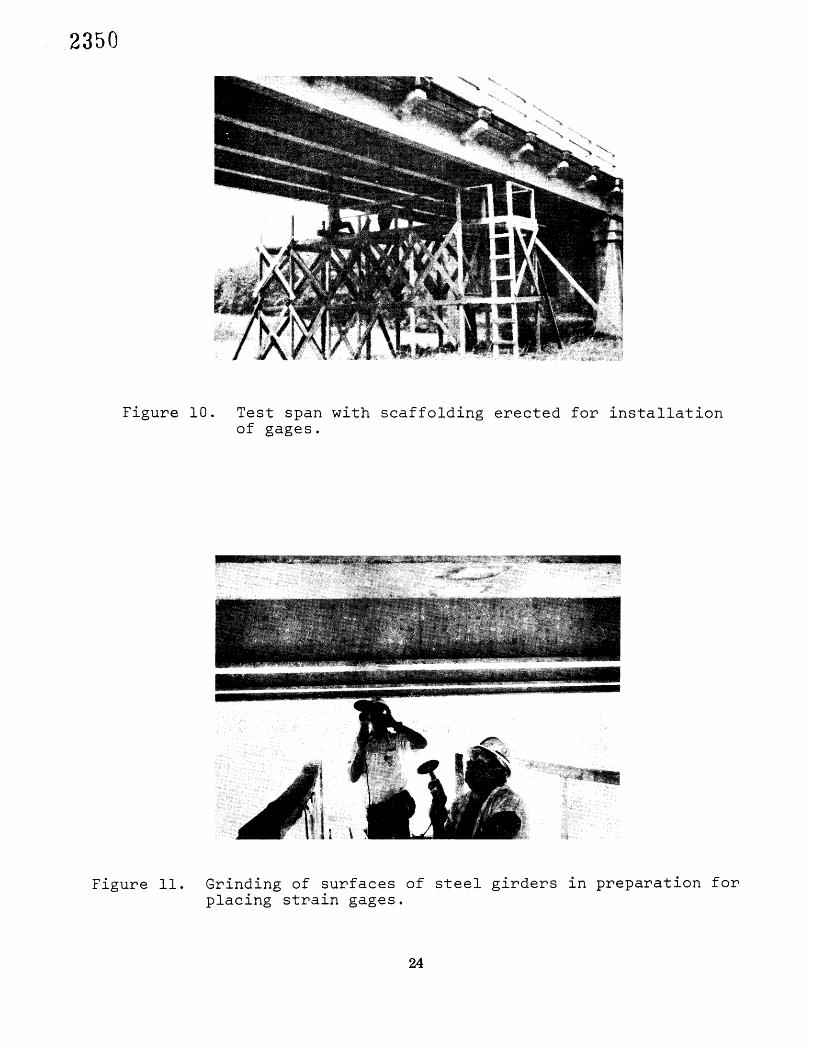
Eighteen SR-4 type A3-56 strain gages were placed on the five W36 x 150 steel girders (see Figure 5) and two SR-4 type A-9-3 strain gages were placed on the underside of the concrete dec• slab (see Figure 6). Engineer's scales with 20. divisions to an inch were attached to the lower flanges of the steel girders for measuring the deflections (Figure 7). The scales w•re read with a precise N-3 Wild Level (Figure 8) with a least reading of 0.001". Figure 9 shows the location of the strain and deflection gages. Figure i0 shows the scaffolding erected under the test span for installation of the gages, and Figure ii shows technicians grinding the steel surfaces for placement of the strain gages.
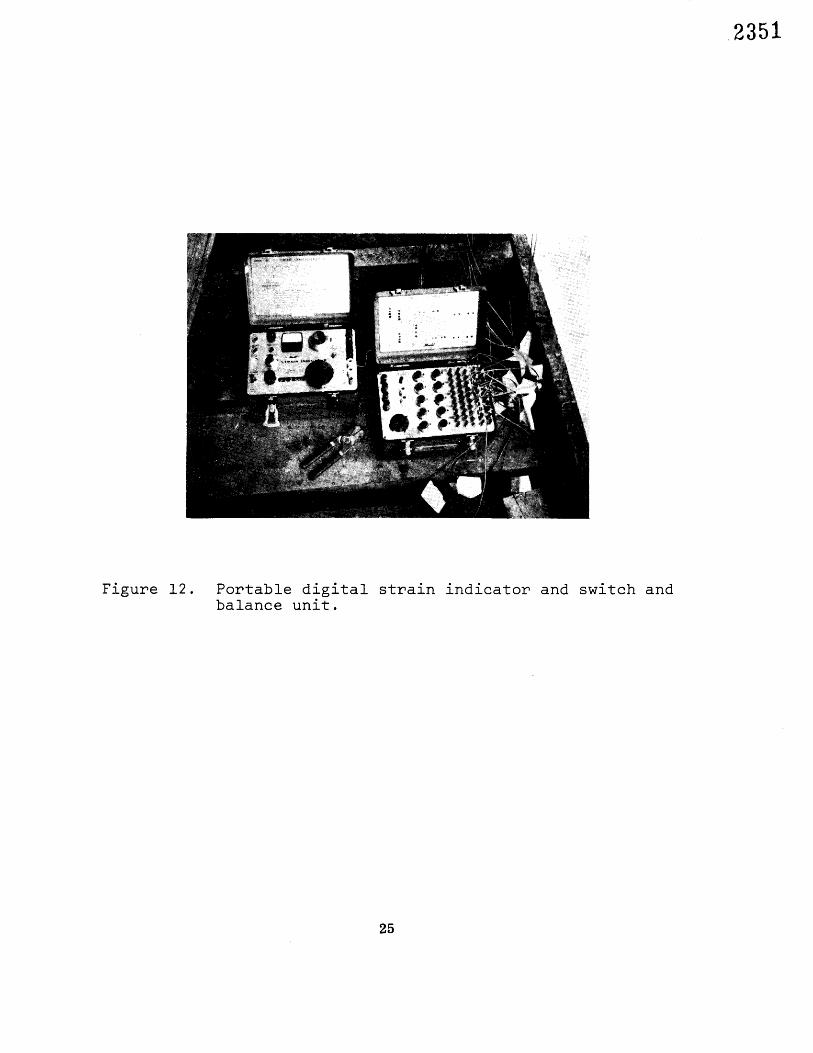
The 20 strain gages were wired into two 10-channel Model SB-I Switch and Balance Units manufactured byVishay Instruments, Inc.
*All figures and tables are attached.

.2329
A battery powered Model P-350 portable digital strain indicator was used to read the strains. See Figure 12.
TEST LOADING
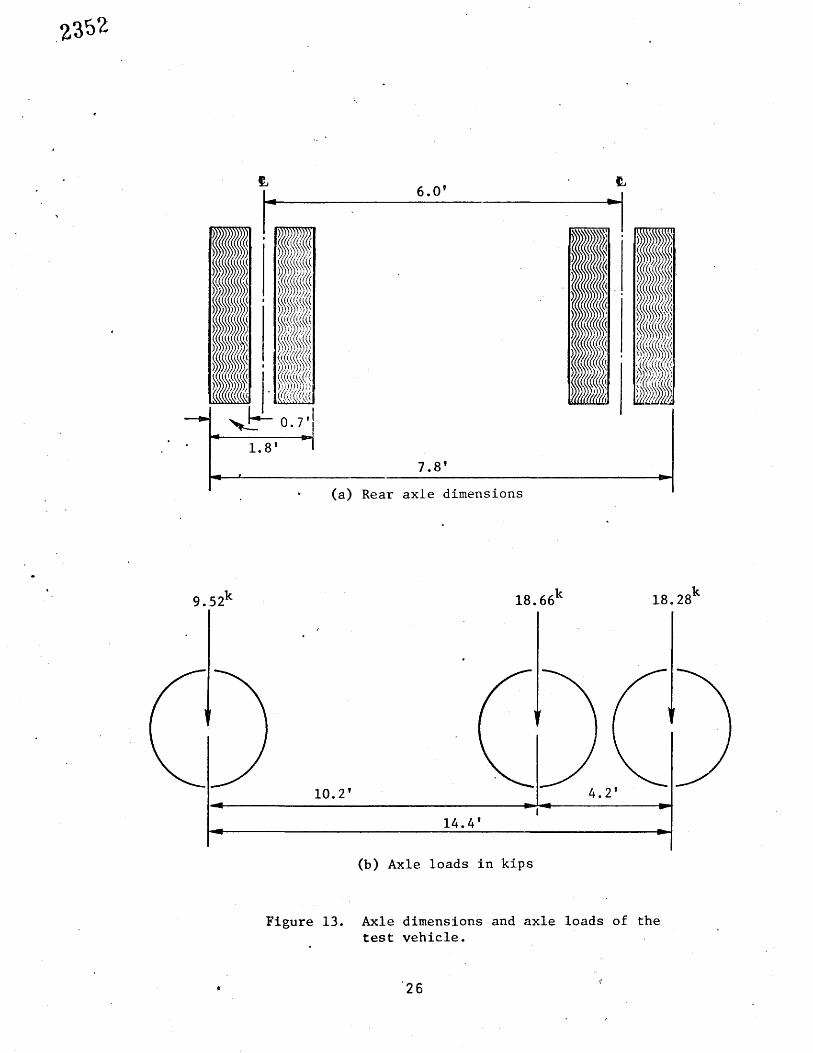
A Mack MB-400 gasoline truck with tandem rear axles was borrowed from the Staunton District Equipment Depot. of the Virginia Department of Highways and Transportation for use as the test vehicle. The truck axle dimensions and loads are detailed in Figure 13 and a photograph of the truck is shown in Figure 14. The truck weights and dimensions closely approxi- mated the Type 3 unit loading designated in the Manual for Mainte- nance Inspection of Brid•es, 1974.(1) The bending moment from the test veh•'6i• at •he g&ge positions was 311.7 ft. kips for a line ofwheels, which is about 10% in excess of the maximum bending moment of 284.5 ft. kips for a Type 3 loading on the same effective span length of 61.25'. The absolute maximum bending moment calculated for this loading on this span is 312.3 ft. kips at a position 0.22' from midspan. Thestrain gages on the steel girders were placed i' east of midspan to avoid inter- ference with the diaphragms located at midspan. It may be noted that the maximum legal load limit of 36. tons for a Type 3S2 ldading on this span length develops a bending moment of 323.1 ft. kips. This bending moment is only 3.5% in excess of the bending moment from the test loading.
TEST PROCEDURE
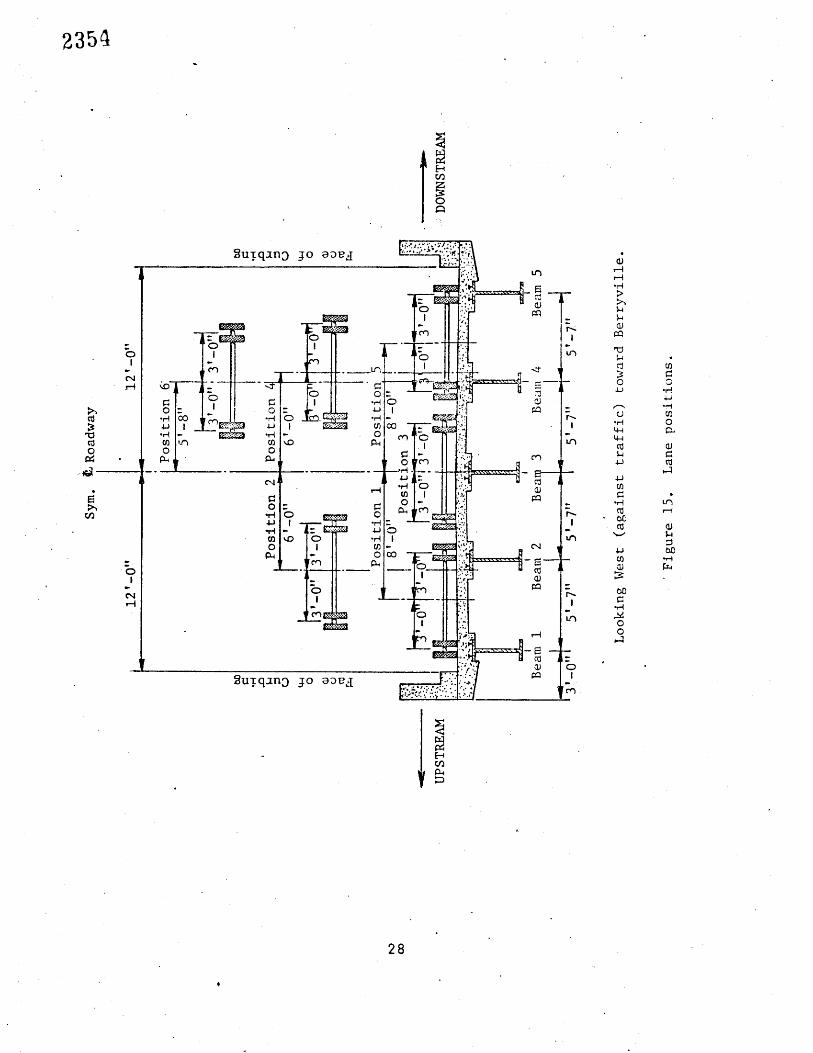
The test vehicle was placed at five lateral midspan positions (see Figure 15) to determine the distributi6n of strains and deflec- tions to each of the five girders for each of the load positions. The first rear axle was placed at the strain gage position to provide maximum bending moment there. Two type A-9-3 strain gages were placed 7'-7" east of midspan on the underside of the 8" concrete deck (Figures 6 and 9) in a position to be directly under the dual wheels when the test vehicle was located in position 6.
With the test vehicle placed in each of the five midspan positions, the 20 strain gages and 5 deflection scales were read and recorded. The procedure was-repeated in its entirety for a
Second set of readings, and repeated for positions 2 and 4 for a third set. The test vehicle was placed in position 6 for two sets of strain readings on the under- side of the concrete deck slab.
2330
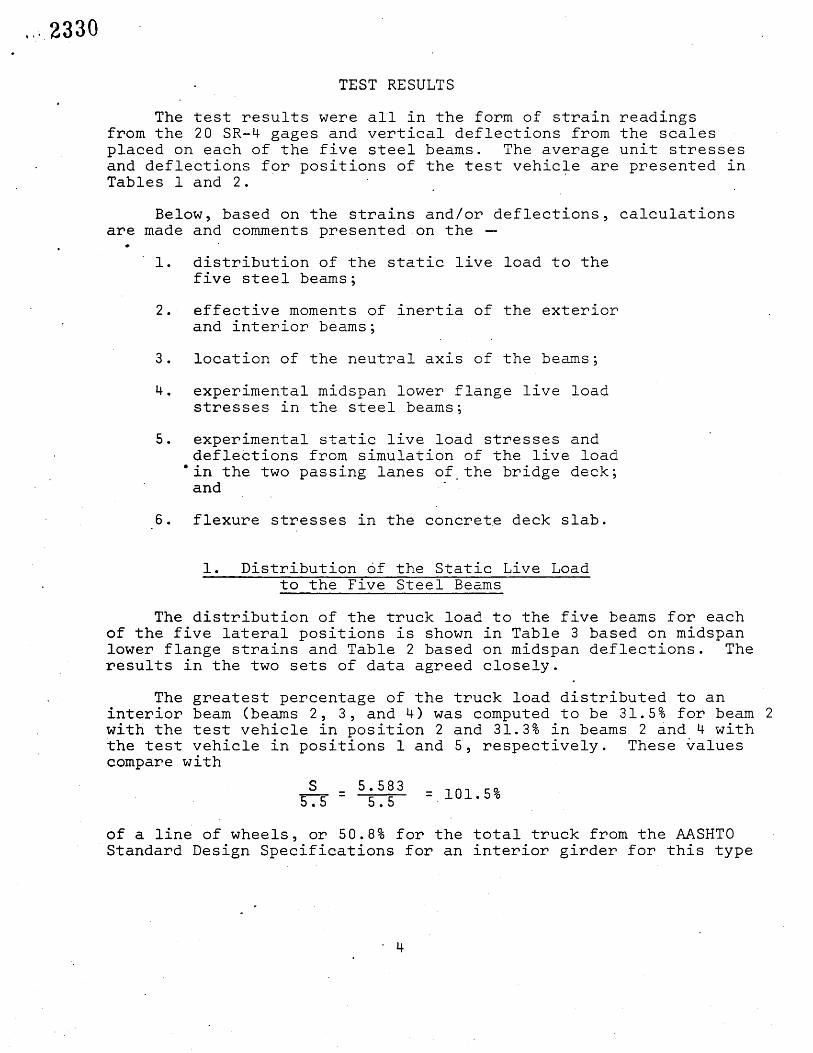
TEST RESULTS
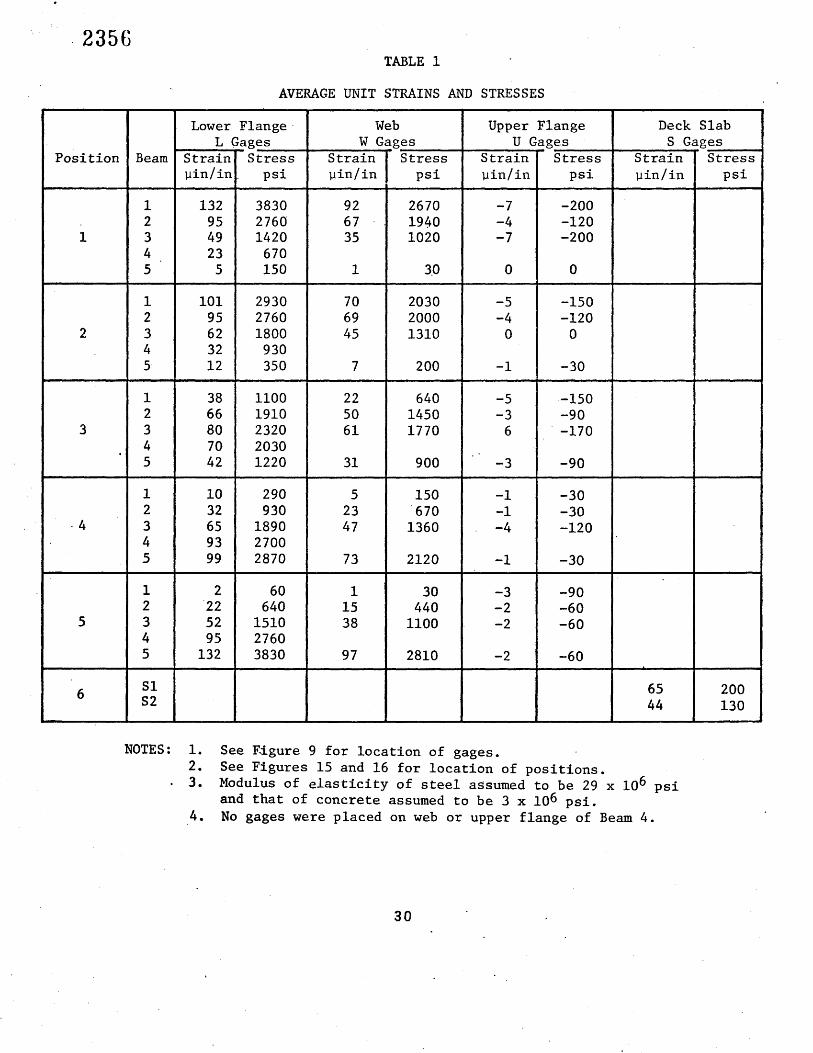
The test results were all in the form of strain readings from the 20 SR-4 gages and vertical deflections from the scales placed on each of the five steel beams. The average unit stresses and deflections for positions of the test vehicle are presented in Tables i and 2.
Below, based on the strains and/or deflections, calculations are made and comments presented on the
i. distribution of the static live load to the five steel beams;
2.. effective moments of inertia of the exterior and interior beams;
3. location of the neutral axis of the beams;
4. experimental midspan lower flange live load stresses in the steel beams;
5. experimental static live load stresses and deflections from simulation of the live load
"in the two passing lanes of the bridge deck; and
6. flexure stresses in the concrete deck slab.
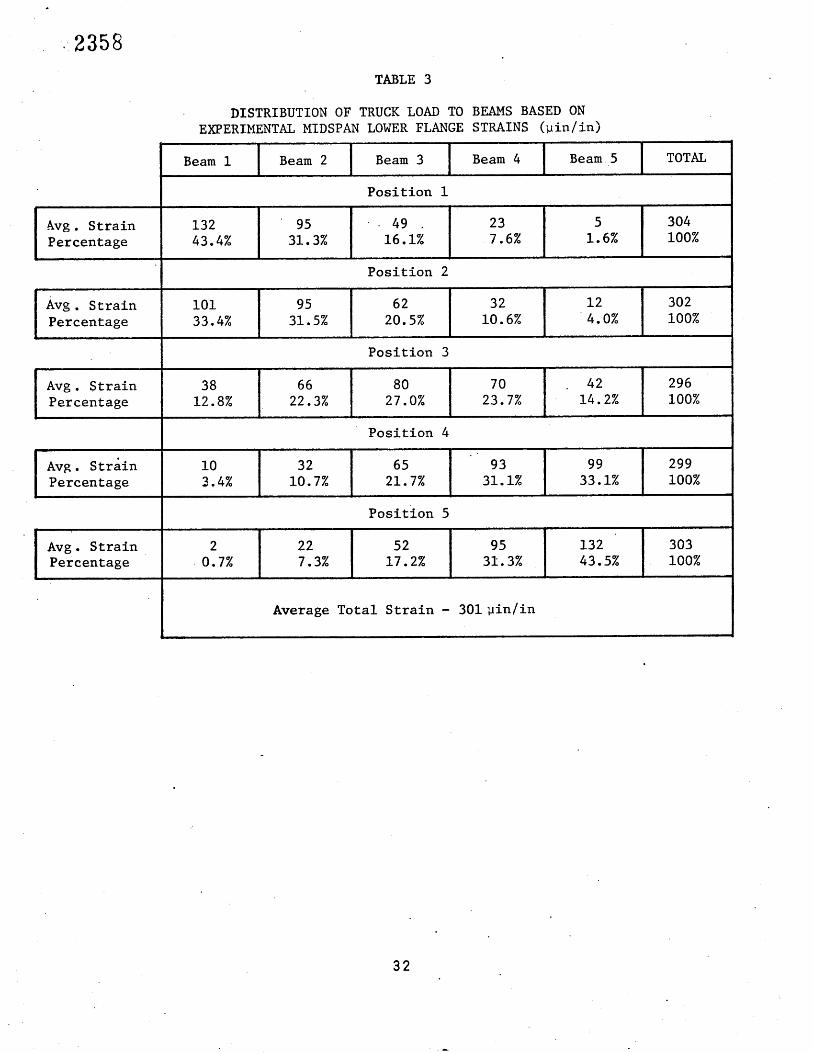
i. Distribution 6f the Static Live Load to the Five Steel Beams
The distribution of the truck load to the five beams for each of the five lateral positions is shown in Table 3 based on midspan lower flange strains and Table 2 based on midspan deflections. The results in the two sets of data agreed closely.
The greatest percentage of the truck load distributed to an interior beam (beams 2, 3, and 4) was computed to be 31.5% for beam 2 with the test vehicle in position 2 and 31.3% in beams 2 and 4 with the test vehicle in positions i and 5, respectively. These %alues compare with
S 5.583 : :
i01.5% 5.5 5.5
of a line of wheels, or 50.8• for the total truck from the AASHTO Standard Design Specifications for an interior girder for this type
2331
structure. The disparity between experimental data and design specifications is consistent with findings from previous experi- mental studies conducted by the Research Council. (3,4) For example, a study of the Hazel River Bridge(3) in 1962 showed the maximum experimental distribution to an interior girder to be 35.7% while the AASHTO Standard Design Specifications required 69.8%. The Hazel River Bridge consisted of 66'-5" composite spans and 7'-8" beam spacing.
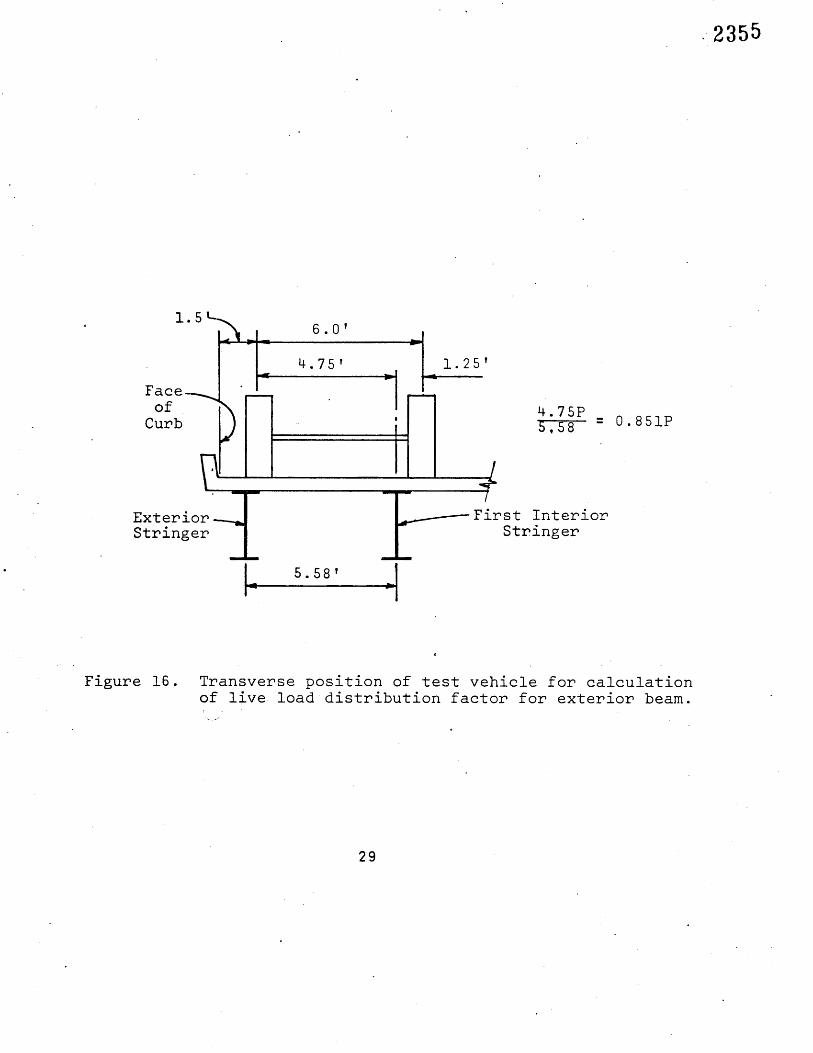
The greatest percentage of the truck load carried by an external beam (beams i and 5) was determined to be 43.5% (Table 3) for beam 5 with the test vehicle in position 5. From Section 5.2.2, Manua• for Maintenance Inspection of Bridges (1) 1974, 85.1• of a line of wheels (42.6% of a truck) is specified in rating a bridge structure on the basis of the exterior beam. See Figure 16. Unlike the interior •irder comparison, there is a very close correlation between the experimental and theoretical distributions of live load to the exterior beam. Similar results were obtained in the Hazel River Bridge test• 44.0% of a truck load to the exterior beam experimentally and 47.8% of the load from the Inspection Manual•Requirements.
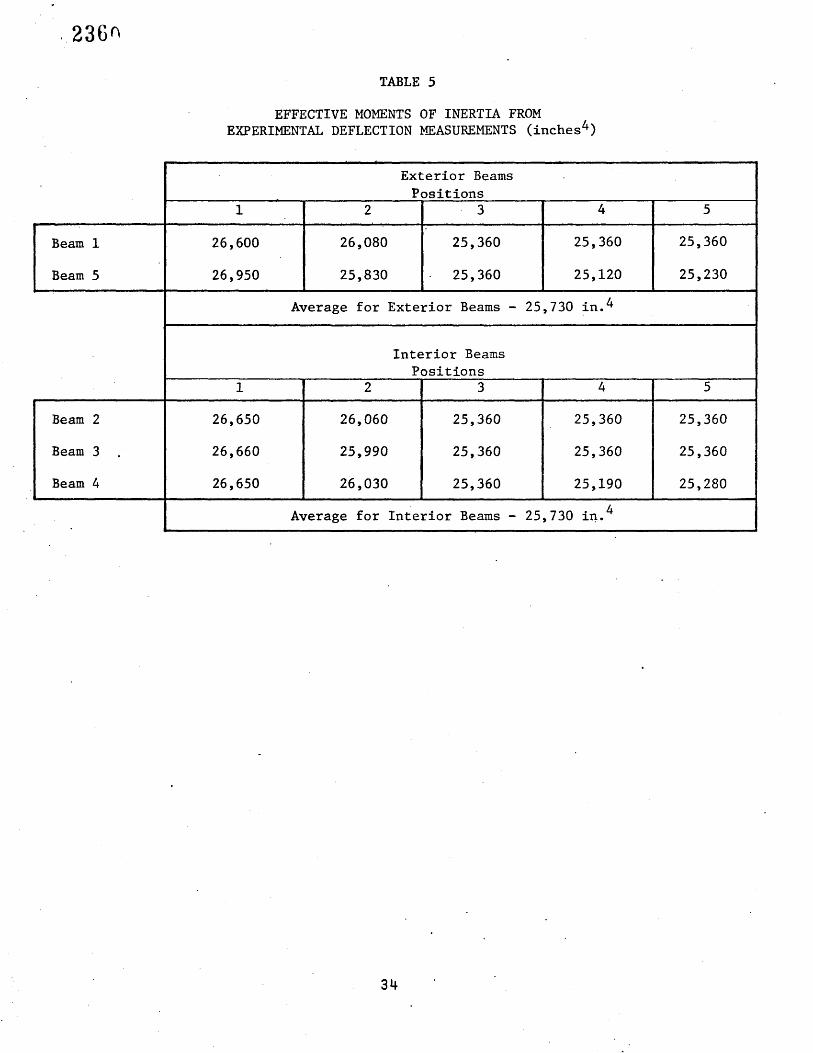
2. Effective Moments of Inertia of the Exterior and inter•i.or Beams
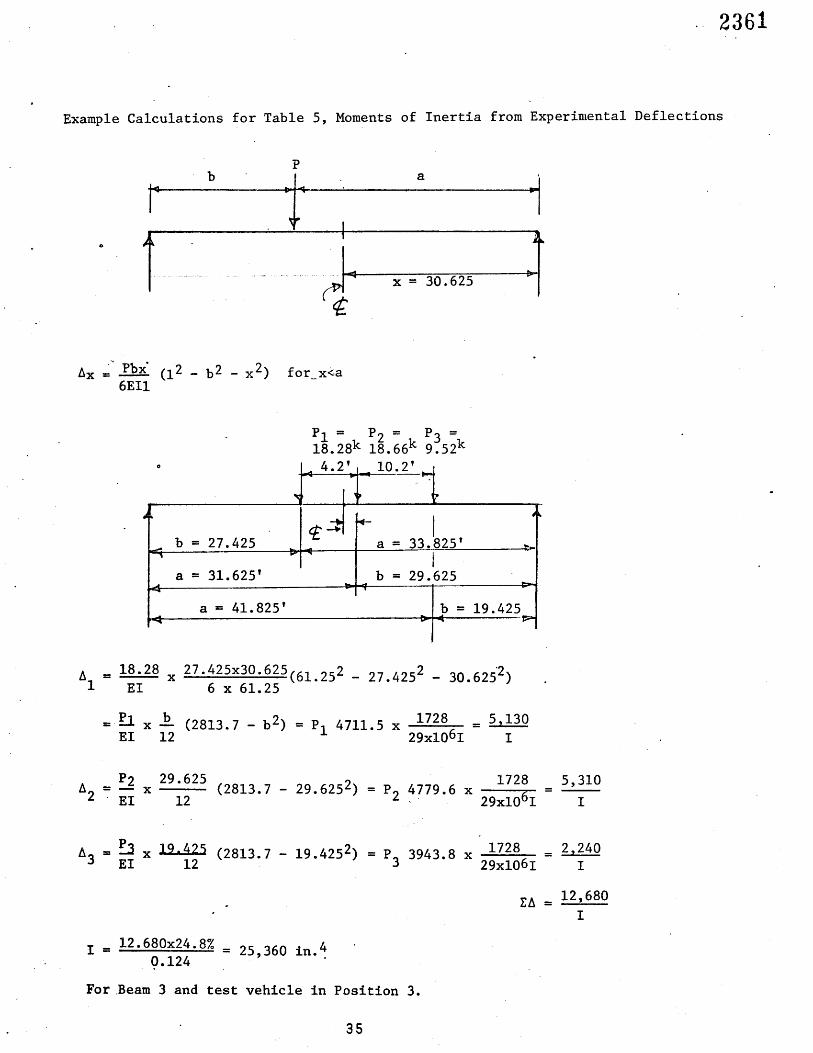
Based on conventional elastic beam theory, the moments of inertia of the exterior and interior beams were calculated from the measured strains and also from the measured deflections. These values of I are tabulated and averaged in Table 4 (from strains) and Table 5 (from deflections). The experimental values exceeded the theoretically calculated values somewhat, but they were remarkably close particularly for the experimental results for interior beams based on deflections, which were about 6% above the corresponding theoretical values.
Calculations for the moments of inertia of the exterior and interior beams follow. Full composit• action and a value of "n" (ratio of modulus of elasticity of steel to that of concrete) of 8
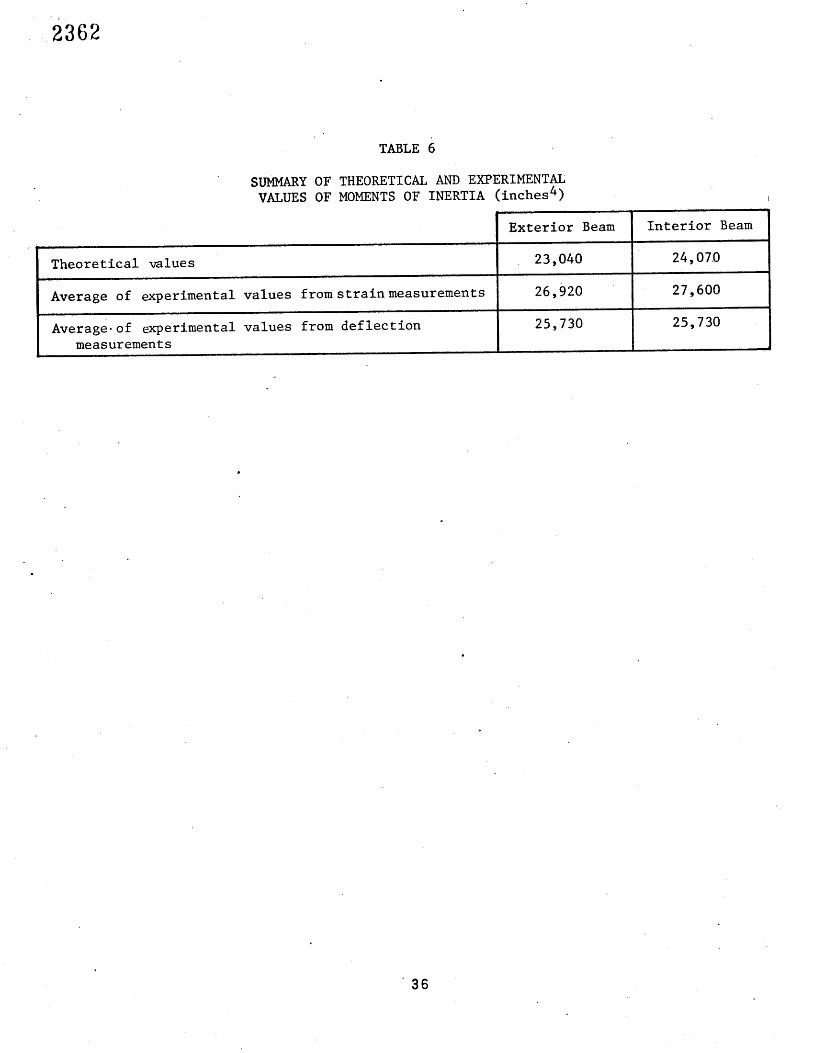
are assumed. Table 6 summarizes the corresponding data.
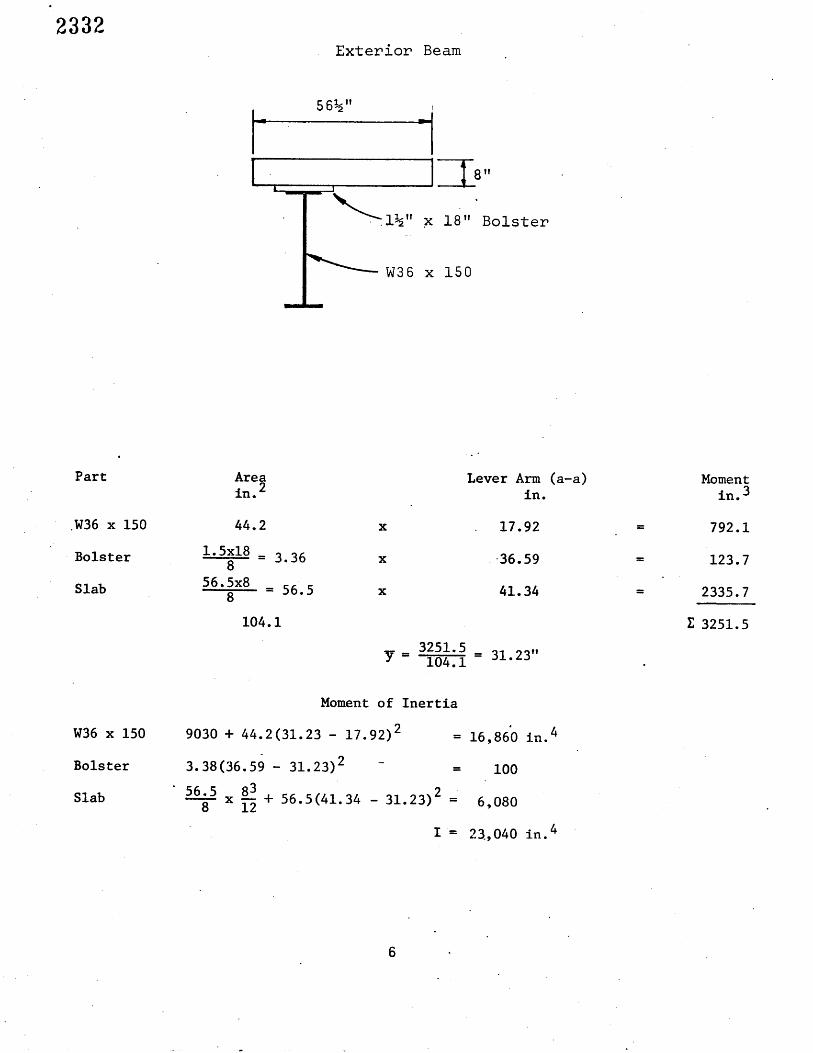
2332 Exterior Beam
L 56½"
x 18" Bolster
•-- W36 x 150
Part
.W36 x 150
Bolster
Slab
Area in. 2
44.2
i. 5x18 8
56.5x8 8
Lever Arm (a-a) in.
17.92
3.36 x 36.59
56.5 x 41.34
104.1
3251.5 Y 104.1 31.23"
Moment in. 3
792.1
123.7
2335.7
3251.5
W36 x 150
Bolster
Slab
Moment of Inertia
9030 + 44.2(31.23- 17.92) 2 16,86'0 in. 4
3.38(36.59- 31.23) 2 i00
56.5 83 • x • + 56.5(41.34 31.23) 2 6,080
I = 23.,040 in.4

Interior Beam
2333
67" _1
1½" x 18" Bolster
• W. 36 x 150
Part
W36 x 150
Bolster
Slab
Area in. 2
44.2
1.5x18 3.38 8 67x8 --67
114.6
Lever Arm (a-a) in.
x •:•--• 17.92
x 36.59
x 41.3
3685.6 Y 114.6. 32.16 in.
Moment in. 3
792.1
123.7
2769.8
3685.6
W36 x 150
Bolster
Moment of Inertia
9030 + 44.2(32.16 17.92) 2 18,000 in 4
3.38(36.59 32.16) 2 70
67 x
83 + 67(41.34 32.16) 2 6,000
8 12
I 24,070 in. 4
7
2334
3. Location o• the Neutral Axis
The neutral axis positions above the lower flange for an ext.erior and an interiCr beam are .calculated in the. previous section of the test results based on conventional elastic theory and assuming full composite action between the concrete deck and the wide flange steel beams. The theoretical values of 31.23" and 32.16" for an exterior and interior beam, respectively, agree very closely with the averages of the experimental values shown in Table 7.
The experimental values were calculated by assuming a linear variation in strain using three sets of strain readings, namely: Method i Using lower flange gages and web gages; Method 2 Using lower flange gages and upper flange gages; and Method 3 Using web gages and upper flange gages. There was only small dis- parity between the results of the three methods, and their closeness to theoretical values indicates the existence of complete composite action as assumed and the correctness of elastic theory for this type of bridge s•ructure.
4. Experimental Midspan Lower Flan•e Live Load Stresses in the Steel Beams
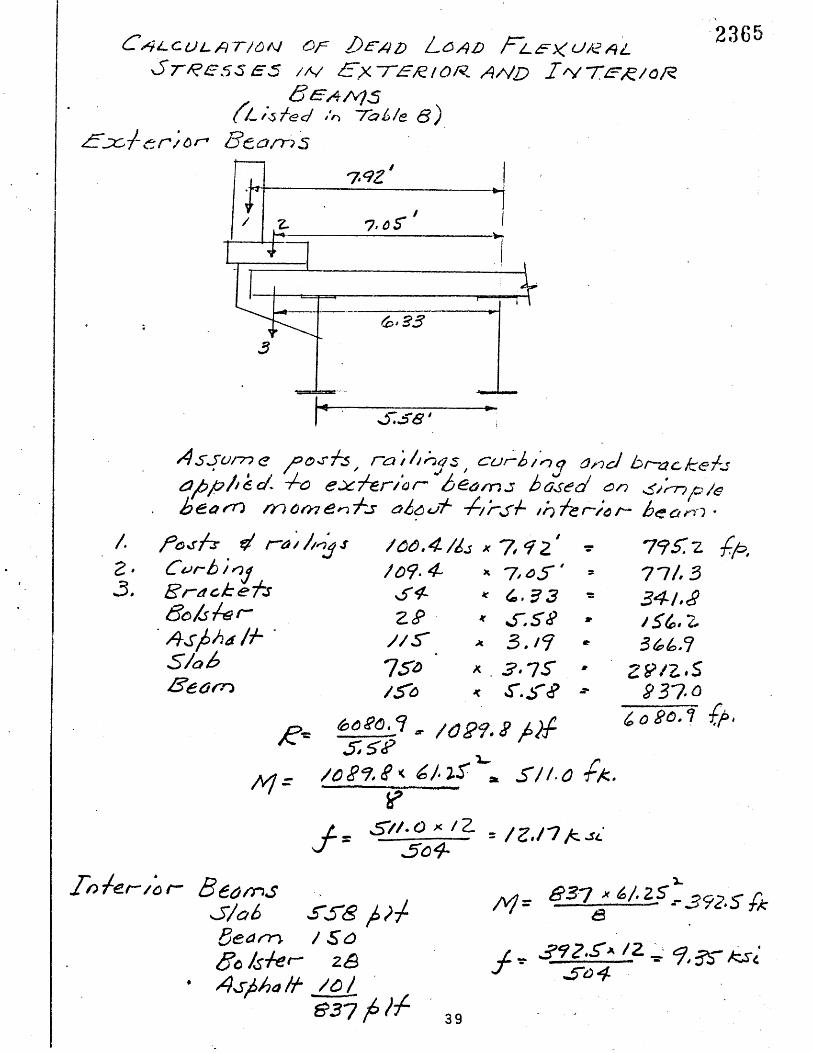
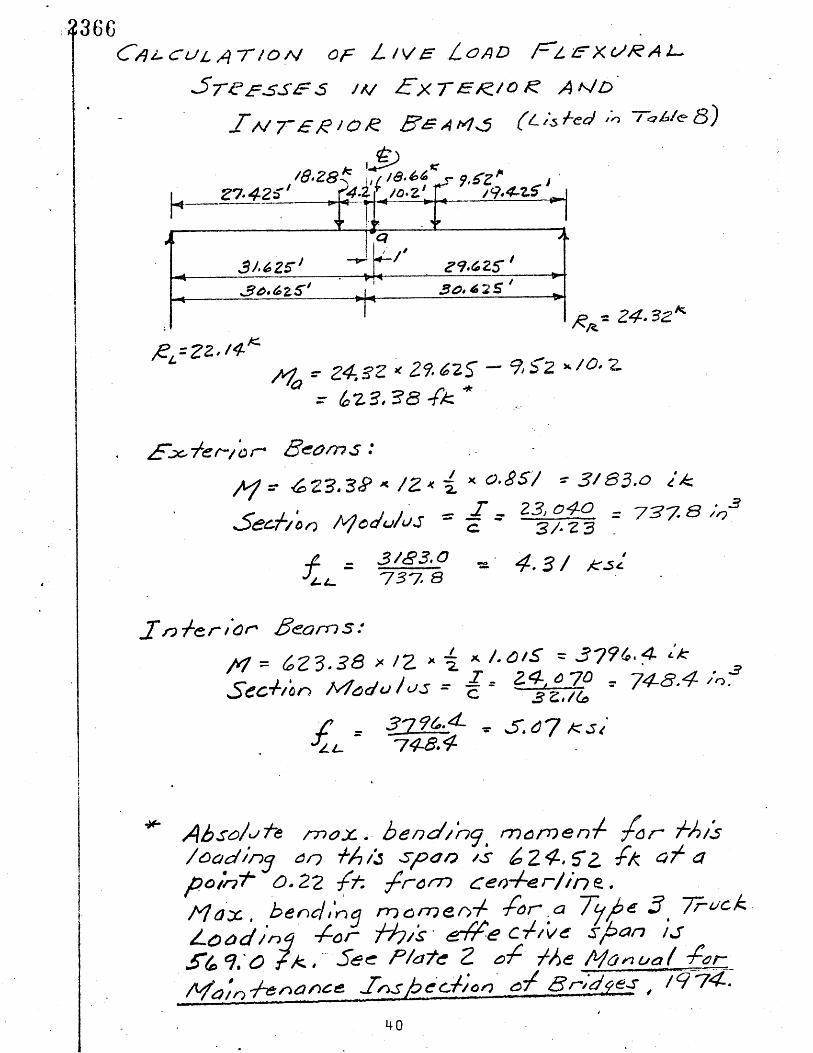
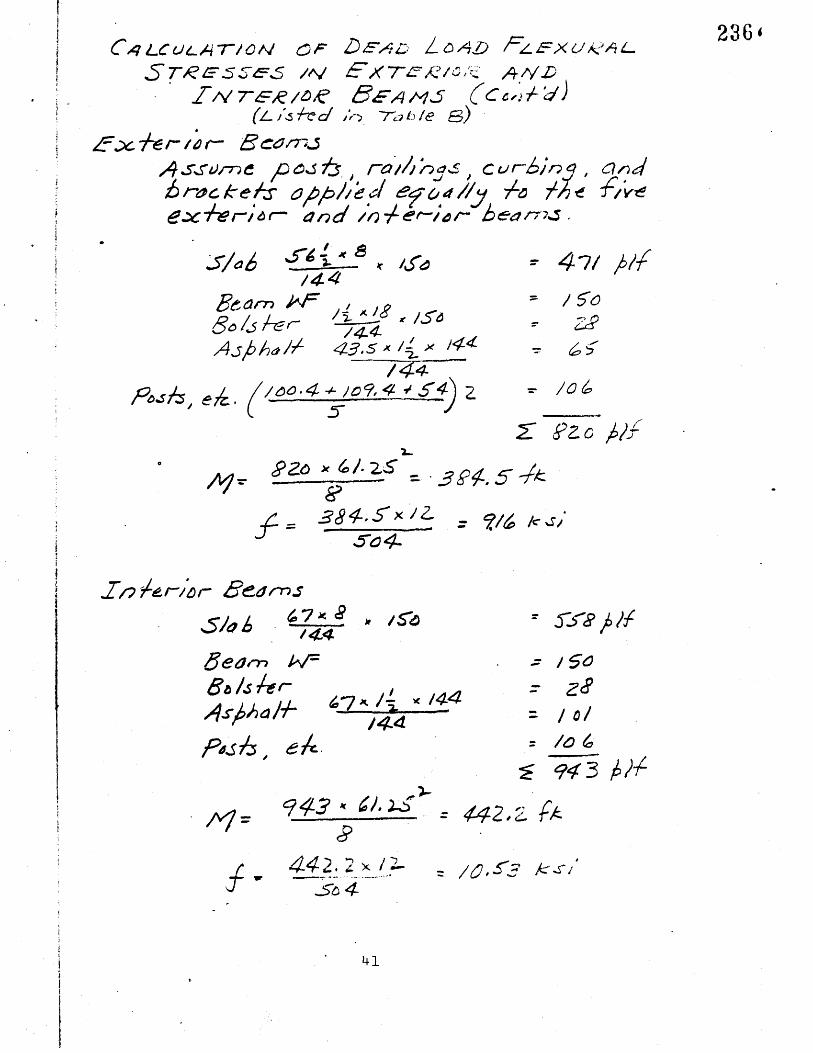
The exper.imental lower flange stresses from the placement of the static live load at the five midspan positions were low compared to the corresponding design stresses. The maximum average experi- mental values were 3.83 ksi in the exterior beam i for the test vehicle in position i, and 2.76 ksi in the interior beam 2 for the test vehicle in positions i and 2. The same average stress devel- oped in beam 4 for the test vehicle in Position 5. Table 8 lists these experimental stresses with dead load and live load stress•) calculated from conventional design theory and using the AASHTO recommendations for distributing dead and live loads to the exterior and interior beams. Supporting calculations for values listed in Table 8 are shown in the Appendix.
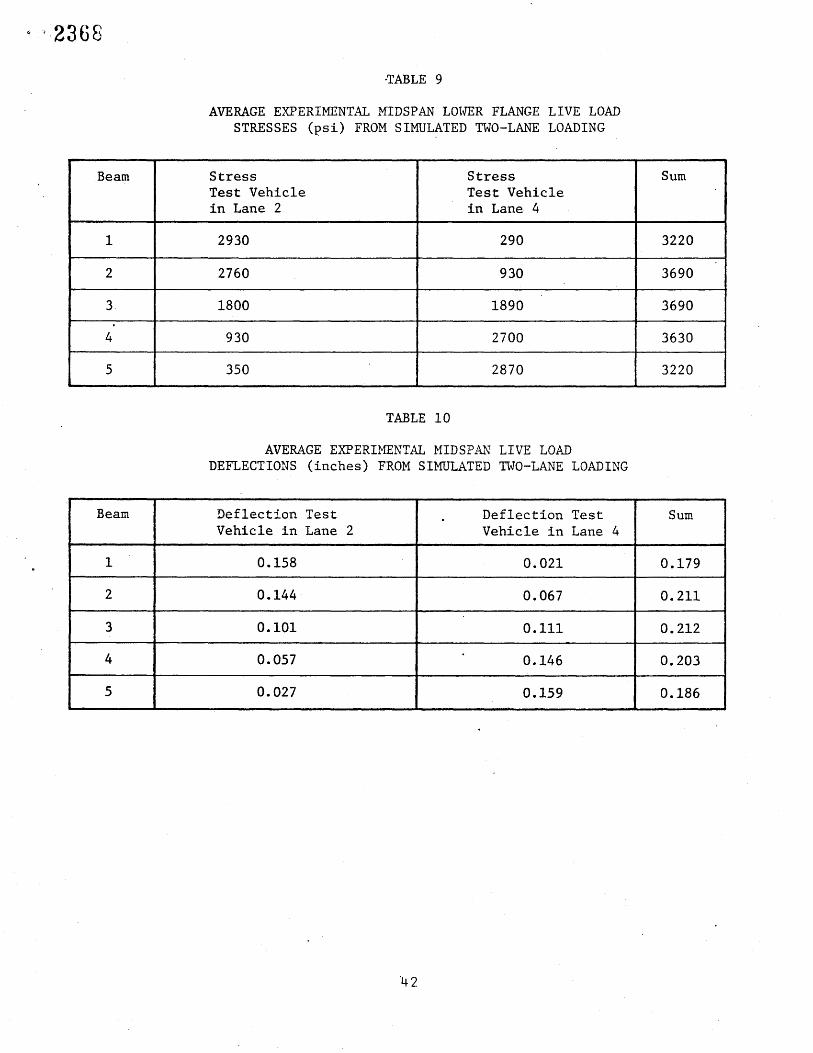
Experimental Static Live Load Stresses and Deflections from Simulation of the Live Load in the
Two Passing Lanes of the Bridge Deck
Table 9 lists the summation of the midspan live load stresses from simulating the test vehicle in the two passing lanes of the bridge deck, namely, positions 2 and 4. The maximum simulated stress in an exterior beam was 3,230 psi compared to 3,830 psi shown in Table 8 for the test vehicle in position i. For an interior beam,
2335
the maximum simulated stress from two positions of the test vehicle was 3,690 psi, compared to 2,760 psi for a measured stress from
a single position of the test vehicle.
The stresses developed in the beams from the placement of known live loads on the bridge deck can be reasonably and con- servatively predicted by conventional elastic beam theory and the AASHT0 Standard Specifications for live load distribution factors. The experimental live load stresses listed in both Tables 8 and 9 are less than the theoretically calculated live load stresses.
The response of the span to dynamic loading was not evaluated in this study. However, a number of previous bridge loading field studies have shown the AASHTO Standard Specifications (2) for impact factors to liberally predict the increase in live load stresses from moving vehicles. The only exceptions where the impact factors exceeded the specification values were in the inconsequential cases of very low live load stresses, and in the cases where the experi- ment was designed to develop large impact factors by running the test vehicle over small ramps. Even in these cases the specifica- tion impact factor was not greatly exceeded.
6. Flexure Stresses in the Cond•ete Deck Slab
Two SR-4 type A-9-3 strain gages (SI and $2) were placed on the underside of the deck midway between beams 4 and 5 as shown in Figure 9. Position 6 of the test vehicle placed a wheel of the first of the tandem axles directly over gages SI and $2. The center to center wheel spacing (6'-0") is essentially the same as the spacing of the gages (5'-7"). Figure 16 sho•ithe location of position 6. as well as that of the two gages.
The average measured strains are listed in•.Table i as 65 and 44 inches/inch for gages SI and $2, respectively,•which values corre spond to tensile stresses of 200 and 130 psi for a modulus of elasticity for concrete of 3 x
106 psi. No meaningful theoretical stress calculations can be made for this loading condition for a number of reasons including, (i) the four rather wide rubber tire wheels applying varying pressure to the slab at the gage position, (2) the additional four rubber tire wheels on the other tandem axle 4.2' away, ¢3) the questionable fixity condition of the concrete slab over the exterior beam, (4) the distribution of the loading over the length of the deck slab, and (5) the extent of cracking and nonhomogeneity of the concrete in flexure.
2336
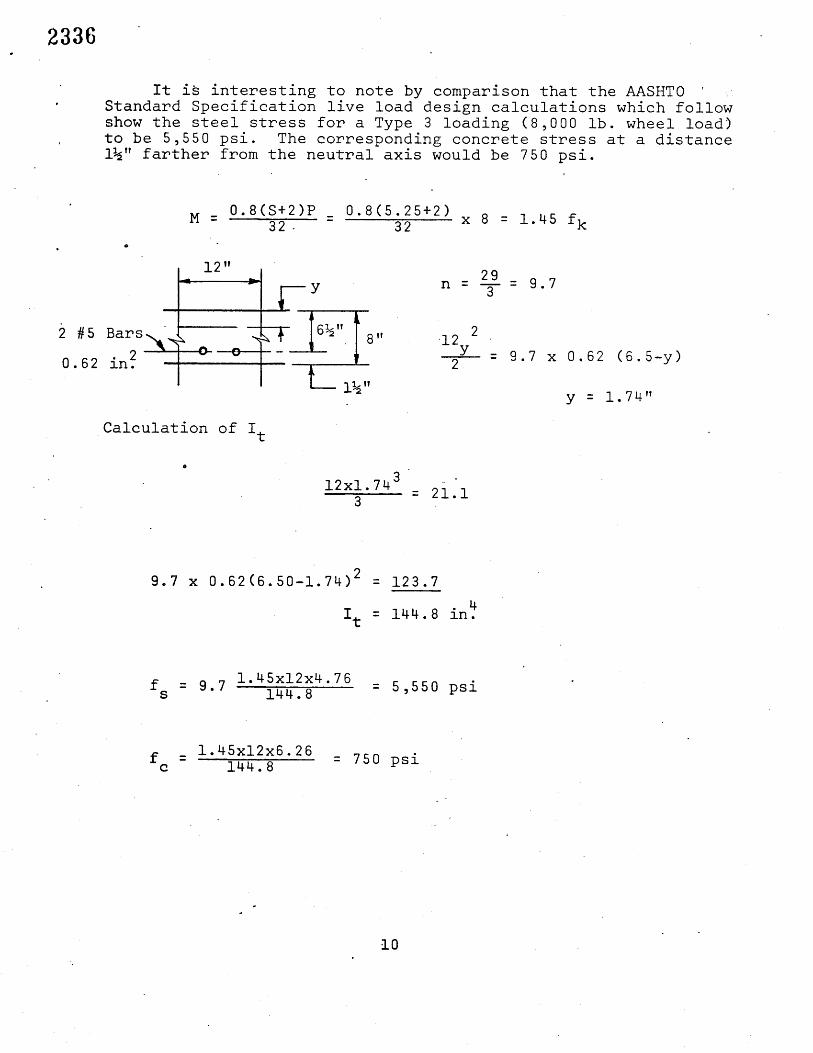
It i• interesting to note by comparison that the AASHT0 .
Standard Specification live load design calculations which follow show the steel stress for a Type 3 loading (8,000 lb. wheel load) to be 5,550 psi. The corresponding concrete stress at a distance 1½" farther from the neutral axis would be 750 psi.
i #5 Bars• 2 0.62 in.
0.8(S+2)P 0.8(5.25+2) : 32. 32
12 Y
Calculation of I t
3 12xi.74 = 21.i
x 8 = 1.45 f k
29 -9.7
3
9.7 x 0.62 (6.5-y)
y = i. 74"
9.7 x 0.62(6.50-i.74) 2 = 123.7
4 I t = 144.8 in.
= 9 ? 1.45x12x4.76 fs 144.8 = 5,550 psi
f =
1.45x12x6.26 = 750 psi
c 144.8
l0
2337
io
CONCLUSIONS
The percentage distributions of the static load to the five steel beams for the several lateral positions of the test vehicle were somewhat less than that prescribed by the design specifications. The percentage distributions based on strain and deflection measurements agreed closely.
The effective moments of inertia calculated from the measured strains and deflections agreed closely with the theoretical values based on composite action between the beams and the concrete deck, although composite action
was not providedin the design.
The locations of the neutral axis of the "non-composite" beams as determined by the measured strains agreed closely with the theoretically calculated locations based on elastic theory for composite beams.
The experimental midspan lower flange live load stresses in the steel .beams were less than, but not exceedingly so, the corre- sponding design stresses.
The stresses developed in the beams of concrete deck and steel beam bridges of short to moderate length can be reasonably and conservatively predicted, whether they are constructed with shear connectors or not, by conventional elastic theory and the AASHT0 Design Specifications.
The tensile flexure stresses on the bottom surface of the concrete deck slab were consistent with the tensile reinforce- ment steel stresses as calculated by conventional cracked concrete theory and the semiempirical rules for the distribution of the loading as specified by the AASHT0 Specifications.
II

2338

2339
ACKNOWLEDGMENTS
Theexperimental phase of this study required the assistance and cooperation of many persons in the Virginia Department of High- ways and Transportation. The authors particularly thank District Bridge: Engineer L. L. Misenheimer for his consultation and suggestions as well as for locating an appropriate test structure; Resident Engi- neer C. L. Ellington for his general assistance and suggestions; and Bernard Lohr, Gary.Cooper, Eddie Sours, Larry Kenney, and Donald Kipps for their fine assistance in constructing the necessary scaffolding, instrumenting the structure with strain gages, reading the strains and deflections, and managing the traffic while loading the structure. Further, the authors thank John Jacob Rohrer of the Staunton District who skillfully operated the test vehicle during the test.
The research project was conducted under the general supervision Of Jack H. Dillard, head, Virginia Highway and Transportation Research Council, and Harry E. Brown, research engineer. W. T. McKeel, Jr., research engineer, offered valuable suggestions and criticisms during both the field phase of the study and the preparation of the report.
13

2340

,,,.2341
lo
REFERENCES
•SHTO Operating Subcommittee on Bridge and Structures, Manual for Maintenance Inspection of Bridges, 1974.
AASHTO, Standard Specifications for Highway Bridges, llth ed., .1973.
Kinnier, H. L., and W. T. McKeel, Jr., "A Dynamic Stress Study of the Hazel River Bridge," Virginia Council of Highway Investi- gation and Research, 1964.
Kinnier, H. L., "A Dynamic Stress Study of the Weyer's Cave Bridge", Virginia Council of Highway Investigation and Research, Charlottesville., Virginia, 1963.
15

,.2342
234•
"H
0
.H
0
0 .H
°r•
17

2344
Figure 2. Eastbound roadway of bridge looking west.
18
2345
19

2346
2O
2347
Figure 5. Strain gages '.•On lower flange, web, and upper flange of a typical girder.
Figure 6. Strain gages on underside of concrete slab.
21
234S
Figure 7. Deflection gages p±acea on a ryplca± glr•er.
Figure 8. N-3 Wild Precise Level used for measuring deflections.
22
0
0
0
2349
23
.2350
Figure i0. Test span with scaffolding erected for installation of gages.
Figure ii. Grinding of surfaces of steel girders in preparation for placing strain gages.
24
.2351
Figure 12. Portable digital strain indicator and switch and balance unit.
25
6.0'
7.8'
(a) Rear axle dimensions
9.52 k 18 66 k 18 28 k
10.2'
14.4'
(b) Axle loads in kips
Figure 13. Axle dimensions and axle loads of the test vehicle.

2353
Figure 14. Gasoline truck test vehicle.
27
o
28
.2355
Exterior Stringer
6.0'
4.75'
5.58'
4.75P S,58
•_------First Interior Stringer
0.851P
Figure 16. Transverse position of test vehicle for calculation of live load distribution factor for exterior beam.
29
2356 TABLE 1
AVERAGE UNIT STRAINS AND STRESSES
Position Beam Strain .• in / in
Lower Flange L Gages
3
i 132 2 95 3 49 4 23 5 5
i I01 2 95 3 62 4 32 5 12
i 38 2 66 3 80 4 70 5 42
1 i0 2 32 3 65 4 93 5 99
i 2 2 22 3 52 4 95 5 132
Stress psi
3830 2760 1420 670 150
2930 2760 1800 930 350
ii00 1910 2320 2030 1220
290 930
1890 2700 2870
60 640
1510 2760 3830
Strain •in/in
92 67 35
70 69 45
22 5O 61
31
5 23 47
73
i 15 38
97
Sl S2
Web W Gages
Strehs psi
2670 19.40 1020
2030 2000 1310
200
640 1450 1770
150 670
1360
30 440
ii00
2810
Upper Flange U Gages
Strain Stress uin/in psi
-7 -4 -7
-5 -4
0
-i
-5 -3
6
-3
-i -i -4
-i
-3 -2 -2
-200 -120 -200
-150 -120
0
-30
--150 -90 -170
-90
-30 -30 -120
-30
-90 -60 -60
-60
Deck Slab S Gages Strain'[ Stress
•in/in psi
-2
65 44
200 130
NOTES: i. See F&gure 9 for location of gages. 2. See Figures 15 and 16 for location of positions. 3. Modulus of elasticity of steel assumed to be 29 x
106 psi and that of concrete assumed to be 3 x
106 psi. 4. No gages were placed on web or upper flange of Beam 4.
3O

2357
TABLE 2
DISTRIBUTION OF TRUCK LOAD TO BEAMS BASED ON AVERAGE EXPERIMENTAL MIDSPAN DEFLECTIONS (inches)
i•vg. Defl: Percentage
AQg- Defl. Percentage
Av•. Defl. Percentage
Evg. Defl. Percentage
Avg. Defl. Percentage
Beam I Beam 2 ]- Beam 3
Position i
Beam 4 I' Beam 5
0.194 40.7%
0.147 30.9%
0.088 18.5%
Position 2
0.039 8.2%
0.008 1.7%
0.158 32.5%
0.072 14.4%
0.144 0.I01 29.6%. 20.7%
0.ii0 22.0%
Position 3
0.124 24.8%
Position 4
0.057 ii.7%
0.027 5.5%
0.109 0.085 21.8% 17.0%
0.021 4.2%
0.067 13.3%
0. iii 22.0%
Position 5
0.146 29.0%
0.159 31.5%
0.005 1.00%
0.047 9.4%
0.I00 19.9%
0.158 31.5%
0.192 38.2%
Average Total Deflection 0.494 inch
TOTAL
0.476 100%
0.487 100%
0.500 100%
0.504 100%
0.502 100%
31
2358
TABLE 3
DISTRIBUTION OF TRUCK LOAD TO BEAMS BASED ON
EXPERIMENTAL MIDSPAN LOWER FLANGE STRAINS (•in/in)
.Evg. Strain Percentage
Avg. Strain Percentage
Avg. Strain Percentage
Avg. Strain Percentage
Avg. Strain Percentage
Beam i Beam 2 Beam 3 Beam 4 Beam 5 TOTAL
132 43.4%
i01 33.4%
38 12.8%
2 0.7%
95 31.3%
Position I
49 16.1%
23 7.6%
5 1.6%
304 100%
Position 2
32 i0.6%
62 20.5%
95 31.5%
Position 3
70 23.7%
66 80 22.3% 27.0%
Position 4
93 31.1%
32 i0.7%
65 21.7%
Position 5
95 31.3%
52 17.2%
22 7.3%
12 4.0%
42 14.2%
99 33.1%
132 43.5%
Average Total Strain 301 •in/in
302 100%
296 100%
299 100%
303 100%
32

2359
Beam I
TABLE 4
EFFECTIVE MOMENTSOF INERTIA FROM EXPERIMENT.AL STRAIN MEASUREMENTS (inches 4)
Exterior Beams Positions
i 2 3 4 5
26,490
25,780
26,640
26,850
27,140
27,240
27,390
26,930 Beam 5
Average for Exterior Beams 26,920
Interior Beams Positions
i 2 3 4 5
Beam 2
Beam 3
Beam 4
27,330
27,260
27,410
27,510
27,430
27,480
28,030
28,000
28,090
27,740
27,700
27,740
Average for Interior Beams 27,600
28,200
26,550
27,530
27,440
27,330
Example Calculation for above Table 4:
I i M_¢.c
f
M Bending moment from test vehicle on span multiplied by the distribution factor for the particular beam and particular lane of test vehicle.
Distance from neutral axis to extreme fiber
f Experimental strain x E
For beam 3 and test Vehicle in position 3
623.38 x 12 x 27% x 32.16 28,000 in. 4
80 x 29 x 103
.,236a
Beam i
Beam 5
Beam 2
Beam 3
Beam
TABLE 5
EFFECTIVE MOMENTS OF INERTIA FROM EXPERIMENTAL DEFLECTION M•ASUREMENTS (inches
26,600
26,950
Exterior Beams Positions
2
26,080
25,830
25,360
25,360
25,360
25,120
Average for Exterior Beams 25,730 in. 4
25,360
25,230
Interior Beams Positions
1 2 3 4 5
26,650
26,660
26,650
26,060
25,990
26,030
25,360
25,360
25,360
25,360
25,360
25,190
Average for Interior Beams 25,730 in. 4
25,360
25,360
25,280
2361
Example Calculations for Table 5, Moments of Inertia from Experimental Deflections
P
x 30.625
Ax "'" P•__x" (12 b 2 x
2) for_x•a 6Eli
b 27.425
a 31.625'
a 41.825'
PI P2 P3 18.28 k 18.66 k 9.52 k
b 29.625
18.28 E1
27.425x30.625(61.252 6 x 61.25
27.4252 30.625 .2 )
x (2813.7 b 2) •=I 4711.5 x EI 12
1728 5•130 29xi061 I
52 P2 29.625 x (2813.7 Pq •P• •--.v-• 2. P. 4779.6 x
EI 12
53 P3 x
19.425 (2813.7 19.4252 ) P3 3943.8 x E1 12
12.680x24.8% 25,360 in. 4 0.124
For.Beam 3 and test vehicle in Position 3.
1728 5,310 29xi061 I
1728 2•240 29xi061 I
12,680 i
35
2362
TABLE 6
Theoretical values
SUMMARY OF THEORETICAL AND EXPERIMENTAL VALUES OF MOMENTS OF INERTIA (inches 4)
Average of experimental values from strain measurements
Average. of experimental values from deflection
measurements
Exterior Beam
23,040
26,920
25,730
Interior Beam
24,070
27,600
25,730
36

236
TABLE 7
LOCATION OF NEUTRAL AXIS ABOVE LOWER SURFACE OF BOTTOM FLANGE (inches)
Exterior Beams
Interior Beams •2
Method I
29.51
34.19
32.17
33.62
Method 2
32.24
33.72
32,24
33.93
Method 3
31.73
33.63
32.20
33.94
Average
31.16
33.85 32.51
32.20
33.83 33.02
NOTES: interior Beam 4 was not instrumented with we• and upper flange gages.
Method 1 extrapolated between experimental strains from lower flange and web gages.
Method 2 interpolated between experimental strains from lower flange and upper flange gages.
Method 3 interpolated between experimental strains from web and upper flange gages.
37

TABLE 8
MIDSPAN LOWER FLANGE STRESS COMPARISONS (ksi)
Dead Load Stress
Experimental Live Load Stress (Max. From Table I)
•imulated Beam 5 stress with Test Vehicle in Positions i and 5
Simulated Beam 2 stress with Test Vehicle in Positions 2 and 4
Theoretical Live Load Stress
Impact (Exp. LL. 26.85%)6
Impact (Theor. LL. 26.85%)
Total Using Exper. LL stress
Total.Using Theor. LL stress
Ratio
Ratio
Exp. LL. Stress
Theor. LL. Stress
Total Stress (Exp. LL.) Total Stress (Theor. LL.)
Exterior Beam
9.16(1,2, 3 )
3.98
4.31(4, 5 )
1.06 (6)
14.20
14.63
92.3%
97.1%
Interior Beam
10.53(1,2, 3 )
3.69
5.07(4, 5 )
0.99
1.36
15.21
16,93
72.8%
89.8%
NOTES: i. Dead load stresses based on weights of curbs, posts and railings being equally distributed to all beams.
2. Dead load stresses are 12.17 ksi and 9.35 ksi for exterior and interior beams, respectively, based on exterior beam carrying all of the curbs, posts, and railings and simple beam reactions from first interior beam.
3. Dead load stresses based on beams not being shored during placement of concrete deck. The bridge was designed and constructed before shear connectors were generally in use.
4. Live load stresses based on complete composite action, which more •closely agrees with experimental results.
5. Theoretical live load stressesare 6.32 ksi and 7.53 ksi for exterior .and interior beams, [•spectively,=based on non-composite action.
• 26.85%. 6. Impact Factor 61.25+125
38
A
:
75•z 7"7L 5
,93"7.0 4ogo.• •.p,
39
366 C.4z. c'-u/z. ,4 7"/o ,,,/ OF /_ /v• /.o,nD
.Z" 23, o•o = 7•. 8 ,'v 3
= ,5", e7 •.r;
2361
/-4-'42. "2 ×
:
236
-TABLE 9
AVERAGE EXPERI•IENTAL MIDSPAN LOWER FLANGE LIVE LOAD STRESSES (psi) FROM SIMULATED TWO-LANE LOADING
Beam Stress Test Vehicle in Lane 2
Stress Test Vehicle in Lane 4
Sum
i 2930 290 3220
2 2760 930 3690
3, 1800 1890 3690
4 930 2700 3630
5 350 2870 3220
TABLE I0
AVERAGE EXPERIIIENTAL MIDSPAN LIVE LOAD DEFLECTIONS (inches) FROM SIMULATED TWO-LANE LOADING
Beam Deflection Test Vehicle in Lane 2
Deflection Test Vehicle in Lane 4
Sum
i 0,158 0.021 0.179
2 0.144 0.067 0.211
0.i01
0.057
0.iii
0.146
0.159 0. 027
0.212
0.203
0.186