Embed Size (px)
Citation preview
1
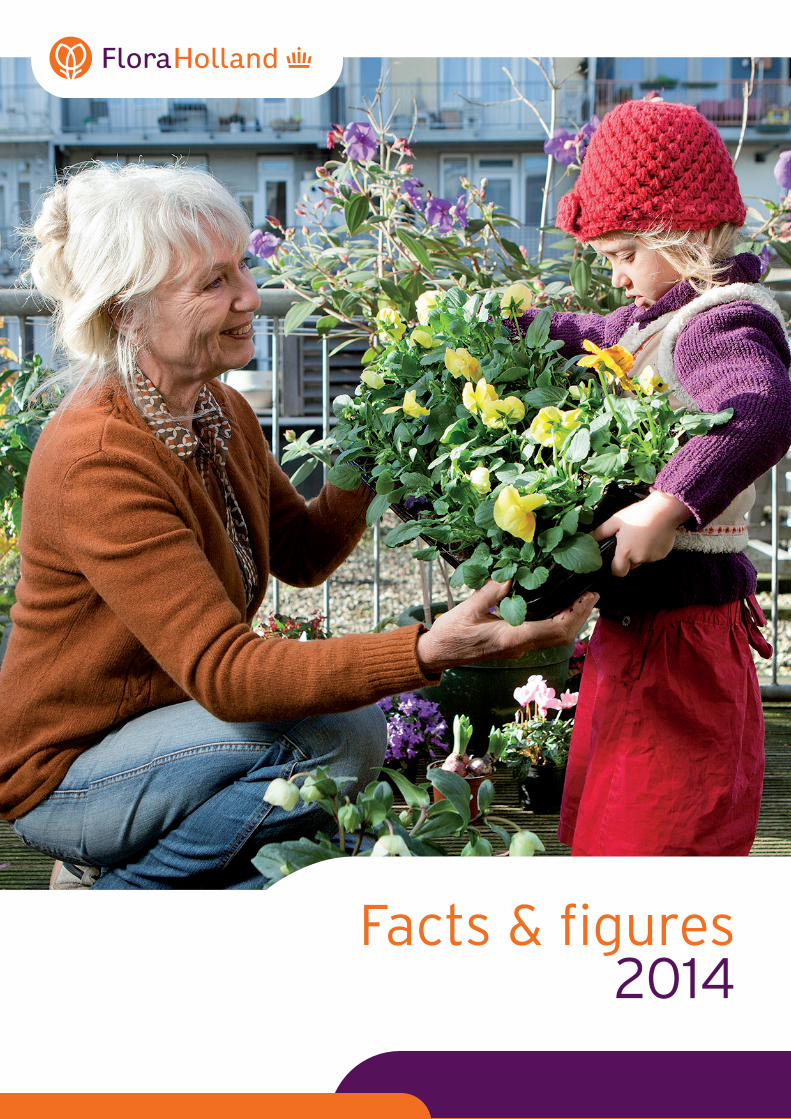
Facts & figures 2014
Facts & figures2014
2
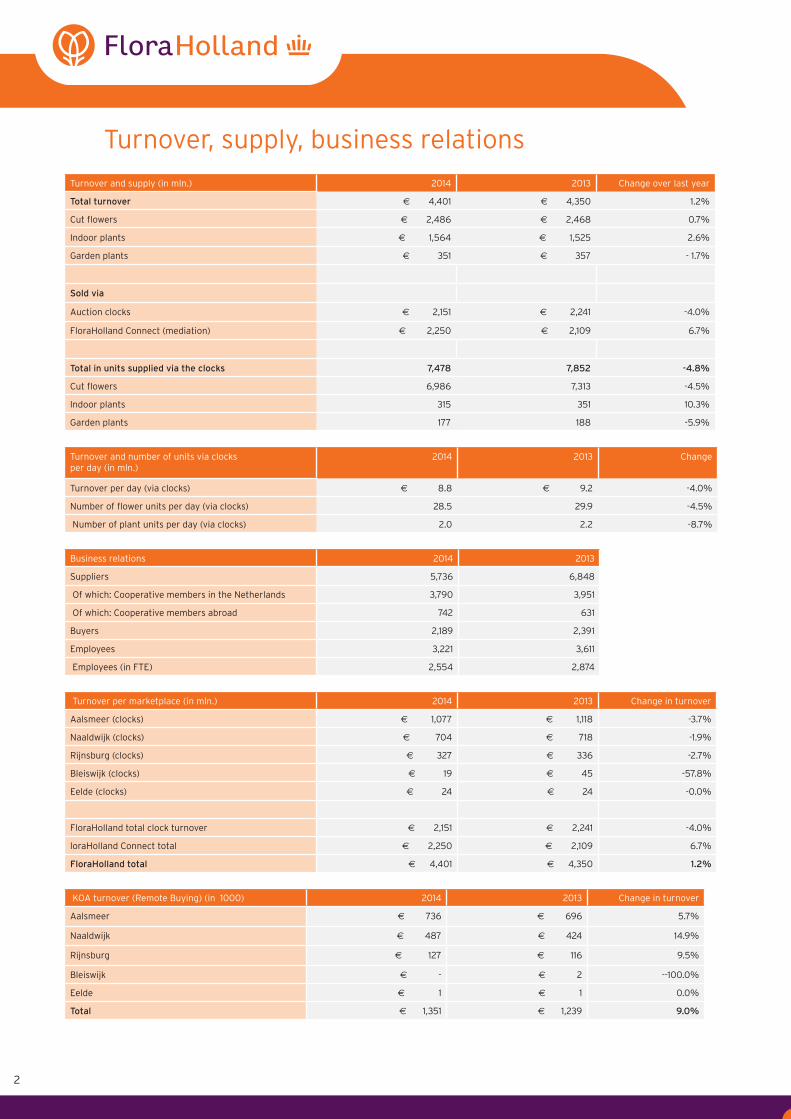
Turnover, supply, business relations
Turnover and supply (in mln.) 2014 2013 Change over last year
Total turnover � 4,401 � 4,350 1.2%
Cut flowers � 2,486 � 2,468 0.7%
Indoor plants � 1,564 � 1,525 2.6%
Garden plants � 351 � 357 - 1.7%
Sold via
Auction clocks � 2,151 � 2,241 -4.0%
FloraHolland Connect (mediation) � 2,250 � 2,109 6.7%
Total in units supplied via the clocks 7,478 7,852 -4.8%
Cut flowers 6,986 7,313 -4.5%
Indoor plants 315 351 10.3%
Garden plants 177 188 -5.9%
Turnover and number of units via clocksper day (in mln.)
2014 2013 Change
Turnover per day (via clocks) € 8.8 € 9.2 -4.0%
Number of flower units per day (via clocks) 28.5 29.9 -4.5%
Number of plant units per day (via clocks) 2.0 2.2 -8.7%
Business relations 2014 2013
Suppliers 5,736 6,848
Of which: Cooperative members in the Netherlands 3,790 3,951
Of which: Cooperative members abroad 742 631
Buyers 2,189 2,391
Employees 3,221 3,611
Employees (in FTE) 2,554 2,874
Turnover per marketplace (in mln.) 2014 2013 Change in turnover
Aalsmeer (clocks) € 1,077 € 1,118 -3.7%
Naaldwijk (clocks) € 704 € 718 -1.9%
Rijnsburg (clocks) € 327 € 336 -2.7%
Bleiswijk (clocks) € 19 € 45 -57.8%
Eelde (clocks) € 24 € 24 -0.0%
FloraHolland total clock turnover € 2,151 € 2,241 -4.0%
loraHolland Connect total € 2,250 € 2,109 6.7%
FloraHolland total € 4,401 € 4,350 1.2%
KOA turnover (Remote Buying) (in 1000) 2014 2013 Change in turnover
Aalsmeer € 736 € 696 5.7%
Naaldwijk € 487 € 424 14.9%
Rijnsburg € 127 € 116 9.5%
Bleiswijk € - € 2 --100.0%
Eelde € 1 € 1 0.0%
Total € 1,351 € 1,239 9.0%
3
Facts & figures 2014
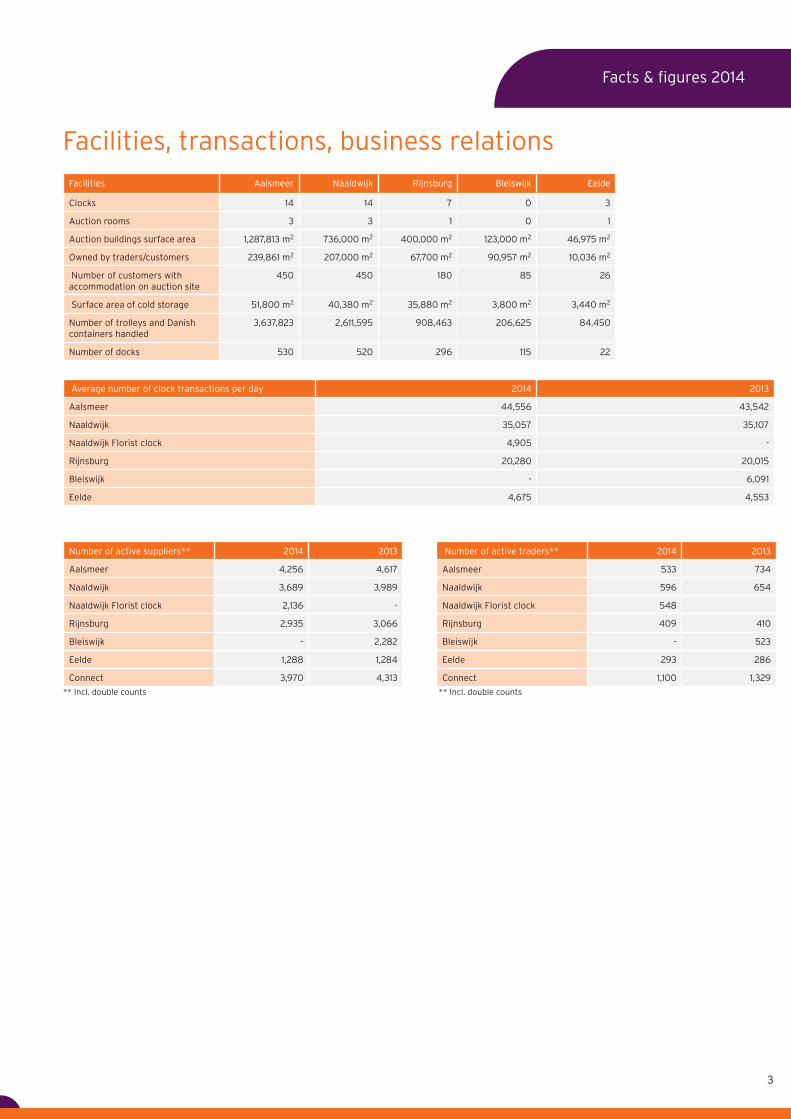
Facilities Aalsmeer Naaldwijk Rijnsburg Bleiswijk Eelde
Clocks 14 14 7 0 3
Auction rooms 3 3 1 0 1
Auction buildings surface area 1,287,813 m2 736,000 m2 400,000 m2 123,000 m2 46,975 m2
Owned by traders/customers 239,861 m2 207,000 m2 67,700 m2 90,957 m2 10,036 m2
Number of customers with accommodation on auction site
450 450 180 85 26
Surface area of cold storage 51,800 m2 40,380 m2 35,880 m2 3,800 m2 3,440 m2
Number of trolleys and Danish containers handled
3,637,823 2,611,595 908,463 206,625 84.450
Number of docks 530 520 296 115 22
Average number of clock transactions per day 2014 2013
Aalsmeer 44,556 43,542
Naaldwijk 35,057 35,107
Naaldwijk Florist clock 4,905 -
Rijnsburg 20,280 20,015
Bleiswijk - 6,091
Eelde 4,675 4,553
Number of active suppliers** 2014 2013 Number of active traders** 2014 2013
Aalsmeer 4,256 4,617 Aalsmeer 533 734
Naaldwijk 3,689 3,989 Naaldwijk 596 654
Naaldwijk Florist clock 2,136 - Naaldwijk Florist clock 548
Rijnsburg 2,935 3,066 Rijnsburg 409 410
Bleiswijk - 2,282 Bleiswijk - 523
Eelde 1,288 1,284 Eelde 293 286
Connect 3,970 4,313 Connect 1,100 1,329
** Incl. double counts ** Incl. double counts
Facilities, transactions, business relations
4
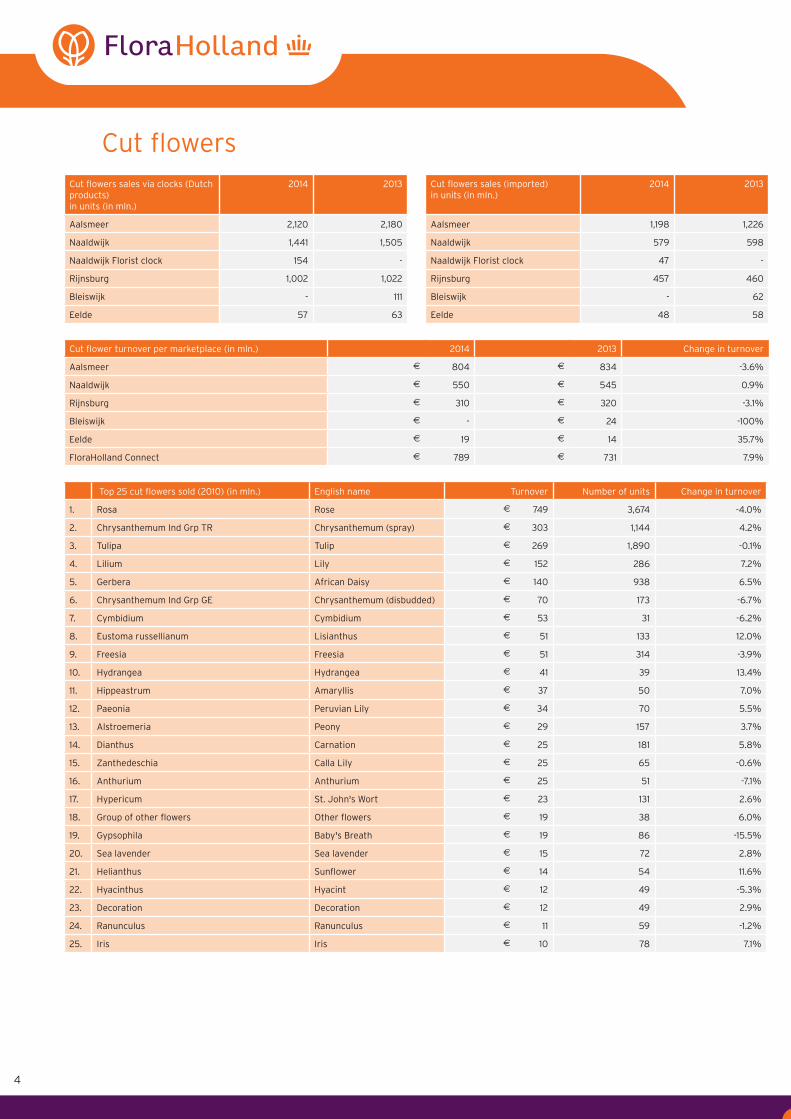
Cut flowersCut flowers sales via clocks (Dutch products) in units (in mln.)
2014 2013 Cut flowers sales (imported) in units (in mln.)
2014 2013
Aalsmeer 2,120 2,180 Aalsmeer 1,198 1,226
Naaldwijk 1,441 1,505 Naaldwijk 579 598
Naaldwijk Florist clock 154 - Naaldwijk Florist clock 47 -
Rijnsburg 1,002 1,022 Rijnsburg 457 460
Bleiswijk - 111 Bleiswijk - 62
Eelde 57 63 Eelde 48 58
Cut flower turnover per marketplace (in mln.) 2014 2013 Change in turnover
Aalsmeer � 804 � 834 -3.6%
Naaldwijk � 550 � 545 0.9%
Rijnsburg � 310 � 320 -3.1%
Bleiswijk � - � 24 -100%
Eelde � 19 � 14 35.7%
FloraHolland Connect � 789 � 731 7.9%
Top 25 cut flowers sold (2010) (in mln.) English name Turnover Number of units Change in turnover
1. Rosa Rose � 749 3,674 -4.0%
2. Chrysanthemum Ind Grp TR Chrysanthemum (spray) � 303 1,144 4.2%
3. Tulipa Tulip � 269 1,890 -0.1%
4. Lilium Lily � 152 286 7.2%
5. Gerbera African Daisy � 140 938 6.5%
6. Chrysanthemum Ind Grp GE Chrysanthemum (disbudded) � 70 173 -6.7%
7. Cymbidium Cymbidium � 53 31 -6.2%
8. Eustoma russellianum Lisianthus � 51 133 12.0%
9. Freesia Freesia � 51 314 -3.9%
10. Hydrangea Hydrangea � 41 39 13.4%
11. Hippeastrum Amaryllis � 37 50 7.0%
12. Paeonia Peruvian Lily € 34 70 5.5%
13. Alstroemeria Peony � 29 157 3.7%
14. Dianthus Carnation � 25 181 5.8%
15. Zanthedeschia Calla Lily � 25 65 -0.6%
16. Anthurium Anthurium � 25 51 -7.1%
17. Hypericum St. John's Wort � 23 131 2.6%
18. Group of other flowers Other flowers € 19 38 6.0%
19. Gypsophila Baby's Breath � 19 86 -15.5%
20. Sea lavender Sea lavender � 15 72 2.8%
21. Helianthus Sunflower � 14 54 11.6%
22. Hyacinthus Hyacint � 12 49 -5.3%
23. Decoration Decoration � 12 49 2.9%
24. Ranunculus Ranunculus � 11 59 -1.2%
25. Iris Iris � 10 78 7.1%
5
Facts & figures 2014
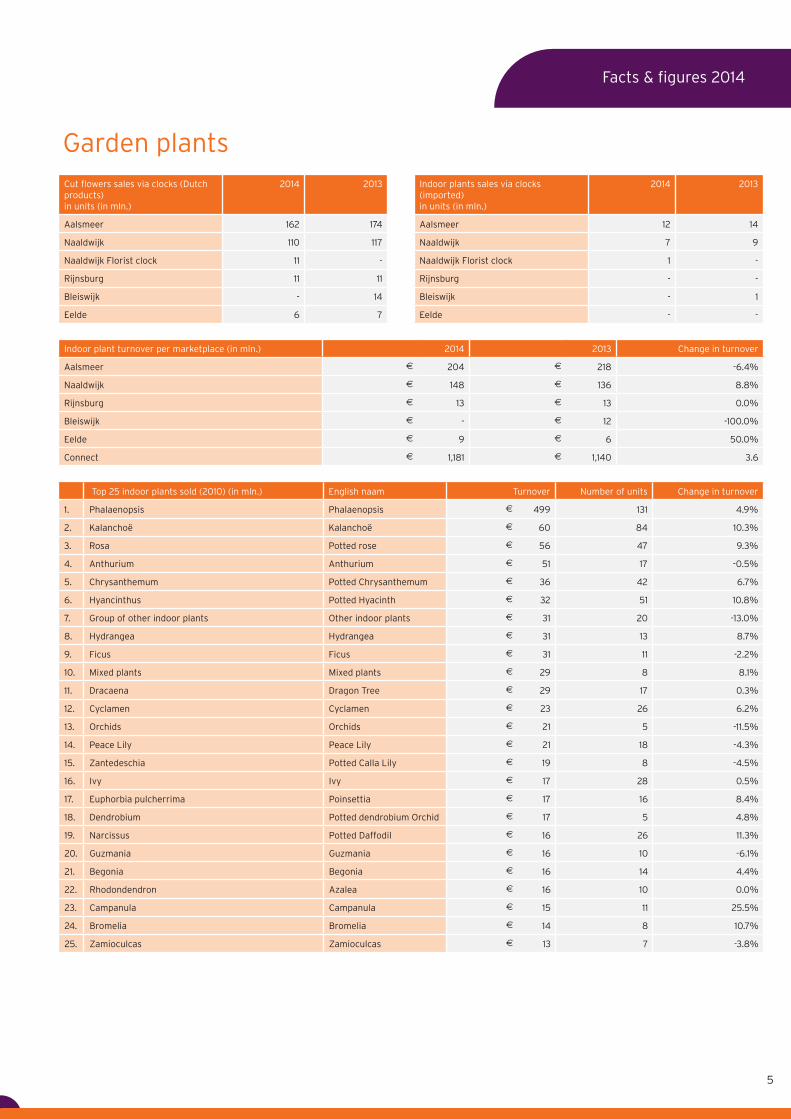
Cut flowers sales via clocks (Dutch products) in units (in mln.)
2014 2013 Indoor plants sales via clocks (imported) in units (in mln.)
2014 2013
Aalsmeer 162 174 Aalsmeer 12 14
Naaldwijk 110 117 Naaldwijk 7 9
Naaldwijk Florist clock 11 - Naaldwijk Florist clock 1 -
Rijnsburg 11 11 Rijnsburg - -
Bleiswijk - 14 Bleiswijk - 1
Eelde 6 7 Eelde - -
Indoor plant turnover per marketplace (in mln.) 2014 2013 Change in turnover
Aalsmeer � 204 � 218 -6.4%
Naaldwijk � 148 � 136 8.8%
Rijnsburg � 13 � 13 0.0%
Bleiswijk � - � 12 -100.0%
Eelde � 9 � 6 50.0%
Connect � 1,181 � 1,140 3.6
Top 25 indoor plants sold (2010) (in mln.) English naam Turnover Number of units Change in turnover
1. Phalaenopsis Phalaenopsis � 499 131 4.9%
2. Kalanchoë Kalanchoë � 60 84 10.3%
3. Rosa Potted rose � 56 47 9.3%
4. Anthurium Anthurium � 51 17 -0.5%
5. Chrysanthemum Potted Chrysanthemum � 36 42 6.7%
6. Hyancinthus Potted Hyacinth � 32 51 10.8%
7. Group of other indoor plants Other indoor plants � 31 20 -13.0%
8. Hydrangea Hydrangea � 31 13 8.7%
9. Ficus Ficus � 31 11 -2.2%
10. Mixed plants Mixed plants € 29 8 8.1%
11. Dracaena Dragon Tree � 29 17 0.3%
12. Cyclamen Cyclamen � 23 26 6.2%
13. Orchids Orchids � 21 5 -11.5%
14. Peace Lily Peace Lily � 21 18 -4.3%
15. Zantedeschia Potted Calla Lily � 19 8 -4.5%
16. Ivy Ivy � 17 28 0.5%
17. Euphorbia pulcherrima Poinsettia � 17 16 8.4%
18. Dendrobium Potted dendrobium Orchid � 17 5 4.8%
19. Narcissus Potted Daffodil � 16 26 11.3%
20. Guzmania Guzmania � 16 10 -6.1%
21. Begonia Begonia � 16 14 4.4%
22. Rhodondendron Azalea � 16 10 0.0%
23. Campanula Campanula � 15 11 25.5%
24. Bromelia Bromelia � 14 8 10.7%
25. Zamioculcas Zamioculcas � 13 7 -3.8%
Garden plants
6
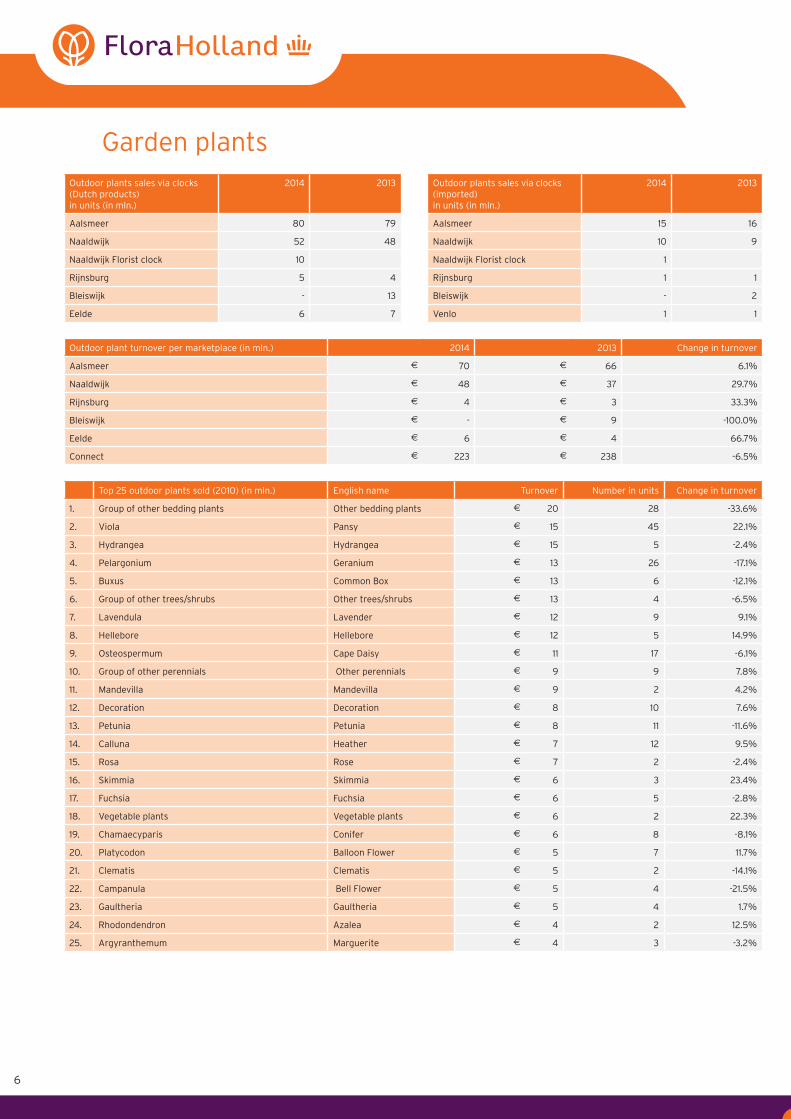
Garden plantsOutdoor plants sales via clocks (Dutch products) in units (in mln.)
2014 2013 Outdoor plants sales via clocks (imported) in units (in mln.)
2014 2013
Aalsmeer 80 79 Aalsmeer 15 16
Naaldwijk 52 48 Naaldwijk 10 9
Naaldwijk Florist clock 10 Naaldwijk Florist clock 1
Rijnsburg 5 4 Rijnsburg 1 1
Bleiswijk - 13 Bleiswijk - 2
Eelde 6 7 Venlo 1 1
Outdoor plant turnover per marketplace (in mln.) 2014 2013 Change in turnover
Aalsmeer � 70 � 66 6.1%
Naaldwijk � 48 � 37 29.7%
Rijnsburg � 4 � 3 33.3%
Bleiswijk � - � 9 -100.0%
Eelde � 6 � 4 66.7%
Connect � 223 � 238 -6.5%
Top 25 outdoor plants sold (2010) (in mln.) English name Turnover Number in units Change in turnover
1. Group of other bedding plants Other bedding plants � 20 28 -33.6%
2. Viola Pansy � 15 45 22.1%
3. Hydrangea Hydrangea � 15 5 -2.4%
4. Pelargonium Geranium � 13 26 -17.1%
5. Buxus Common Box � 13 6 -12.1%
6. Group of other trees/shrubs Other trees/shrubs � 13 4 -6.5%
7. Lavendula Lavender � 12 9 9.1%
8. Hellebore Hellebore � 12 5 14.9%
9. Osteospermum Cape Daisy � 11 17 -6.1%
10. Group of other perennials Other perennials � 9 9 7.8%
11. Mandevilla Mandevilla � 9 2 4.2%
12. Decoration Decoration � 8 10 7.6%
13. Petunia Petunia � 8 11 -11.6%
14. Calluna Heather � 7 12 9.5%
15. Rosa Rose � 7 2 -2.4%
16. Skimmia Skimmia � 6 3 23.4%
17. Fuchsia Fuchsia � 6 5 -2.8%
18. Vegetable plants Vegetable plants � 6 2 22.3%
19. Chamaecyparis Conifer � 6 8 -8.1%
20. Platycodon Balloon Flower � 5 7 11.7%
21. Clematis Clematis � 5 2 -14.1%
22. Campanula Bell Flower � 5 4 -21.5%
23. Gaultheria Gaultheria � 5 4 1.7%
24. Rhodondendron Azalea � 4 2 12.5%
25. Argyranthemum Marguerite � 4 3 -3.2%
7
Facts & figures 2014
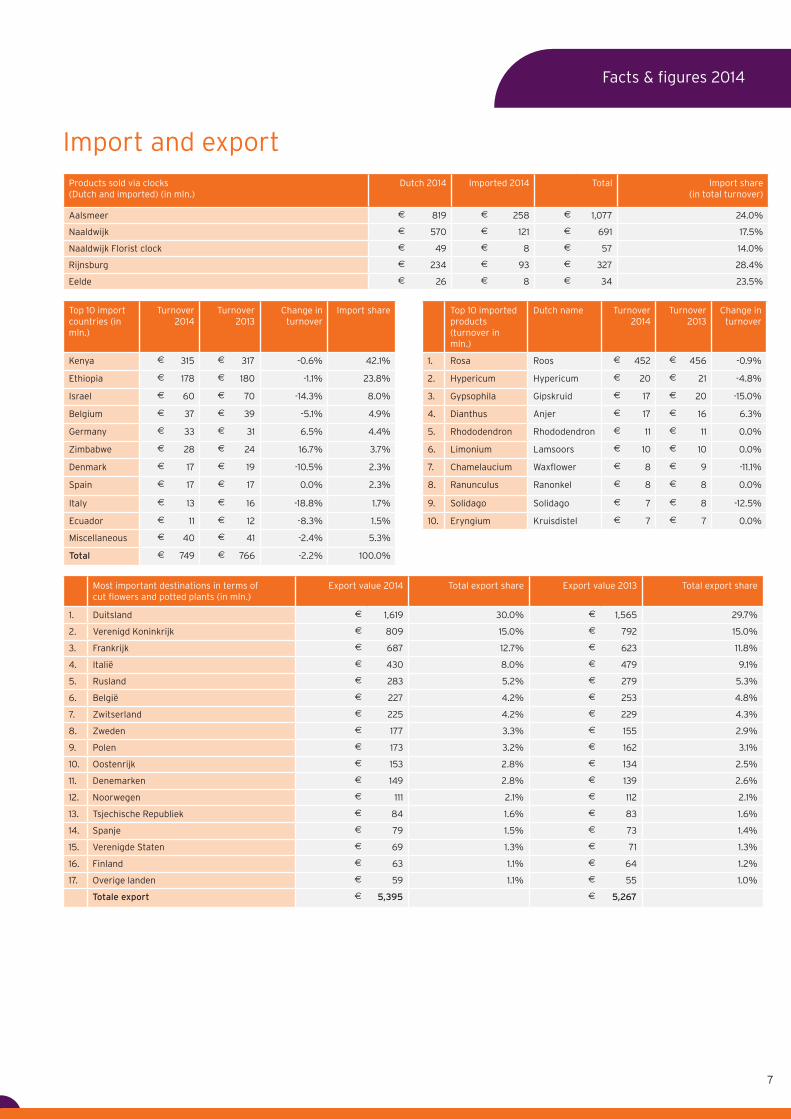
Products sold via clocks (Dutch and imported) (in mln.)
Dutch 2014 Imported 2014 Total Import share (in total turnover)
Aalsmeer � 819 � 258 � 1,077 24.0%
Naaldwijk � 570 � 121 � 691 17.5%
Naaldwijk Florist clock � 49 � 8 � 57 14.0%
Rijnsburg � 234 � 93 � 327 28.4%
Eelde � 26 � 8 2 34 23.5%
Top 10 import countries (in mln.)
Turnover 2014
Turnover2013
Change in turnover
Import share Top 10 imported products (turnover in mln.)
Dutch name Turnover 2014
Turnover 2013
Change in turnover
Kenya � 315 � 317 -0.6% 42.1% 1. Rosa Roos � 452 � 456 -0.9%
Ethiopia � 178 � 180 -1.1% 23.8% 2. Hypericum Hypericum � 20 � 21 -4.8%
Israel � 60 � 70 -14.3% 8.0% 3. Gypsophila Gipskruid � 17 2 20 -15.0%
Belgium � 37 � 39 -5.1% 4.9% 4. Dianthus Anjer � 17 � 16 6.3%
Germany � 33 � 31 6.5% 4.4% 5. Rhododendron Rhododendron � 11 1 11 0.0%
Zimbabwe � 28 � 24 16.7% 3.7% 6. Limonium Lamsoors � 10 � 10 0.0%
Denmark � 17 � 19 -10.5% 2.3% 7. Chamelaucium Waxflower � 8 � 9 -11.1%
Spain � 17 � 17 0.0% 2.3% 8. Ranunculus Ranonkel � 8 � 8 0.0%
Italy � 13 � 16 -18.8% 1.7% 9. Solidago Solidago � 7 � 8 -12.5%
Ecuador � 11 � 12 -8.3% 1.5% 10. Eryngium Kruisdistel � 7 � 7 0.0%
Miscellaneous � 40 � 41 -2.4% 5.3%
Total � 749 � 766 -2.2% 100.0%
Most important destinations in terms of cut flowers and potted plants (in mln.)
Export value 2014 Total export share Export value 2013 Total export share
1. Duitsland � 1,619 30.0% � 1,565 29.7%
2. Verenigd Koninkrijk � 809 15.0% � 792 15.0%
3. Frankrijk � 687 12.7% � 623 11.8%
4. Italië � 430 8.0% � 479 9.1%
5. Rusland � 283 5.2% � 279 5.3%
6. België � 227 4.2% � 253 4.8%
7. Zwitserland � 225 4.2% � 229 4.3%
8. Zweden � 177 3.3% � 155 2.9%
9. Polen � 173 3.2% � 162 3.1%
10. Oostenrijk � 153 2.8% 1 134 2.5%
11. Denemarken � 149 2.8% � 139 2.6%
12. Noorwegen � 111 2.1% 1 112 2.1%
13. Tsjechische Republiek � 84 1.6% 3 83 1.6%
14. Spanje � 79 1.5% � 73 1.4%
15. Verenigde Staten � 69 1.3% � 71 1.3%
16. Finland � 63 1.1% � 64 1.2%
17. Overige landen � 59 1.1% � 55 1.0%
Totale export � 5,395 � 5,267
Import and export
floraholland.com
FloraHolland in facts and figuresFloraHolland flower auction (Koninklijke Coöperatieve Bloemenveiling FloraHolland U.A.) is the international market leader in floriculture sales. FloraHolland has since then been offering its growers and customers six national and international marketplaces that are close to the most important Dutch production regions. The locations Aalsmeer, Naaldwijk and Rijnsburg are primarily focused on export customers, while Eelde is geared towards the domestic Dutch market and Bleiswijk is a logistic center. Veiling Rhein-Maas (Herongen, Germany) is a joint venture between FloraHolland and Landgard.
The auctions offer their customers the broadest and deepest assortment of flowers and plants (20,000 different varieties every day), produced all over the world. From the auctions the Dutch and European market are serviced by wholesalers and exporters. After Amsterdam Schiphol Airport and the Port of Rotterdam, Greenport Holland (of which FloraHolland is part) is the third largest mainport in the Netherlands.
FloraHolland is a cooperative, owned by nearly 5,000 members from the Netherlands and other flower-producing countries. Daily, more than 7000 growers from all over the globe supply their flowers and plants to the various locations. The aim of the cooperative is to achieve the best possible market position for its member-growers at the lowest possible cost.
FloraHolland employs approx. 3,200 people. The network of market locations has a combined annual turnover in flowers and plants of more than €4.5bn.FloraHolland is market-oriented, flexible and proactive. Key features of the auction organization include the quality and the cost level of its services, and the commitment of its employees.
Sources:FloraHolland departments Finance and MiMa (Market Information & Market Analysis); ; International Statistics Flowers and Plants (Bloemen en Planten AIPH)
Disclaimer:FloraHolland does its utmost to present the information included in this publication accurately and completely. It is, however, possible that some information may prove to be incorrect or incomplete. FloraHolland cannot be held liable for any such errors or for any misprints.
AalsmeerLegmeerdijk 313P.O.Box 1000 1430 BA AalsmeerT +31 (0)297 39 70 00F +31 (0)297 39 00 39E [email protected]
NaaldwijkMiddel Broekweg 29P.O. Box 220 2670 AE NaaldwijkT +31 (0)174 63 20 00F +31 (0)174 63 22 22E [email protected]
RijnsburgLaan van Verhof 3P.O. Box 10 2230 AA RijnsburgT +31 (0)71 409 40 00F +31 (0)71 409 45 33E [email protected]
BleiswijkKlappolder 130P.O. Box 500 2665 ZM BleiswijkT +31 (0)10 529 77 77F +31 (0)10 529 78 78E [email protected]
EeldeBurg. J.G. Legroweg 80 9761 TD EeldeT +31 (0)50 309 77 77F +31 (0)50 309 10 62E [email protected]
Veiling Rhein-MaasVeilingstrasse A-147638 Straelen-Herongen, DuitslandT +49 (0)2839-59 32 00F +49 (0)2839-59 12 11E [email protected] www.veilingrheinmaas.com