Embed Size (px)
Citation preview
I
I'IFII'ITIBIR UNIVERSITY
OF SCIEFICE Rl'lD TECHNOLOGY
Faculty of Health and Applied Sciences
Department of Mathematics and Statistics
QUALIFICATIONS: B. Business Admin, B. Marketing, B. Human Resource Management, B. Public
Management and B. Logistics and Supply Chain Management
QUALIFICATION CODES: ZlBBAD / O7BMAR/-
LEVEL: 607BHR / 24BPN / O7BLSM
COURSE: BASIC BUSINESS STATISTICS 1A COURSE CODE: BBSlllS
DATE:JUNE 2017 SESSION: 1
DURATION: 3 HOURS MARKS: 100
FIRST OPPORTUNITY EXAMINATION QUESTION PAPER
EXAMINER(S) MR EM MWAHI, DR 0 OYEDELE, DR | MAPOSA, MR J AMUNYELA, MR R MUMBUU,
MR C MAPIRA, MR A ROUX
MODERATOR: DR IKO AJIBOLA
THIS QUESTION PAPER CONSISTS OF 7 PAGES
(Including this front page)
INSTRUCTIONS
1. Answer all the questions and number your solutions correctly.2. Question 1 of this question paper entails multiple choice questions with options A to
D. Write down the letter corresponding to the best option for each question.3. For Question 2 & 3 you are required to show clearly all the steps used in the
calculations.
4. All written work MUST be done in blue or black ink.
5. Untidy/ illegible work will attract no marks.
PERMISSIBLE MATERIALS
1. Non-Programmable Calculator without the cover
ATTACHMENTS
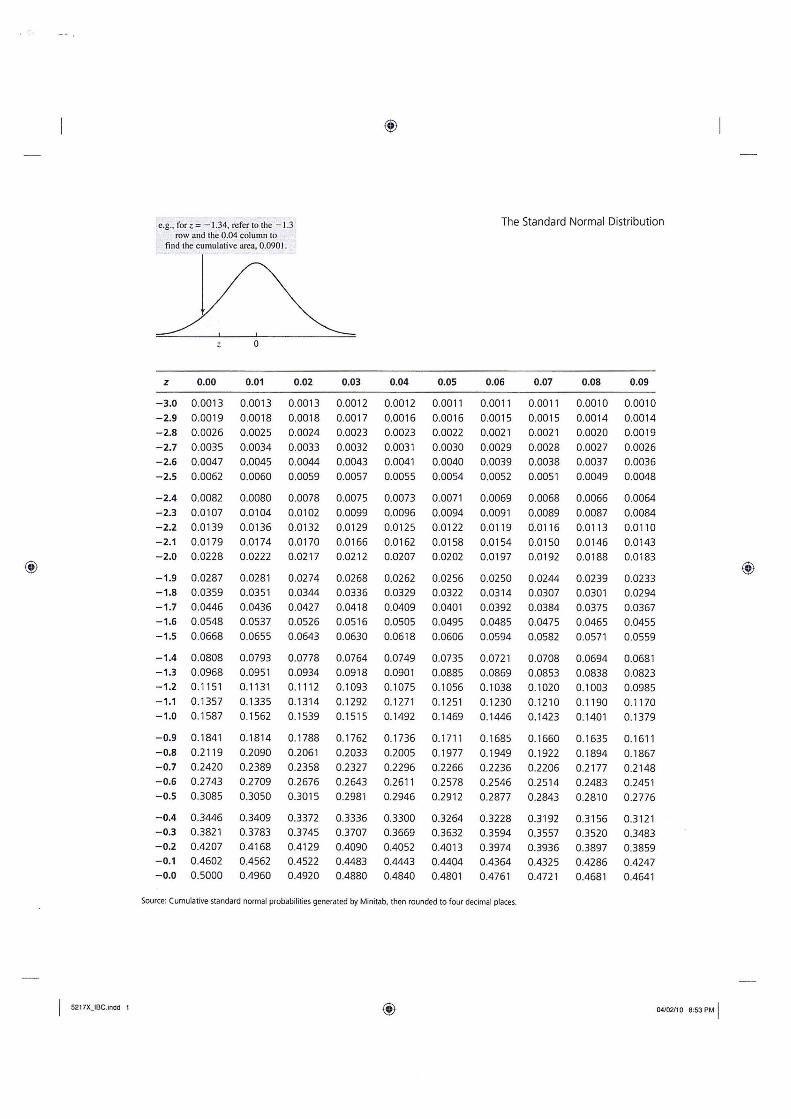
1. Standard normal Z-table
QUESTION 1 [30 MARKS]
Write down the letter corresponding to the best answer for each question.
1.1
1.2
1.3
1.4
1.5
1.6
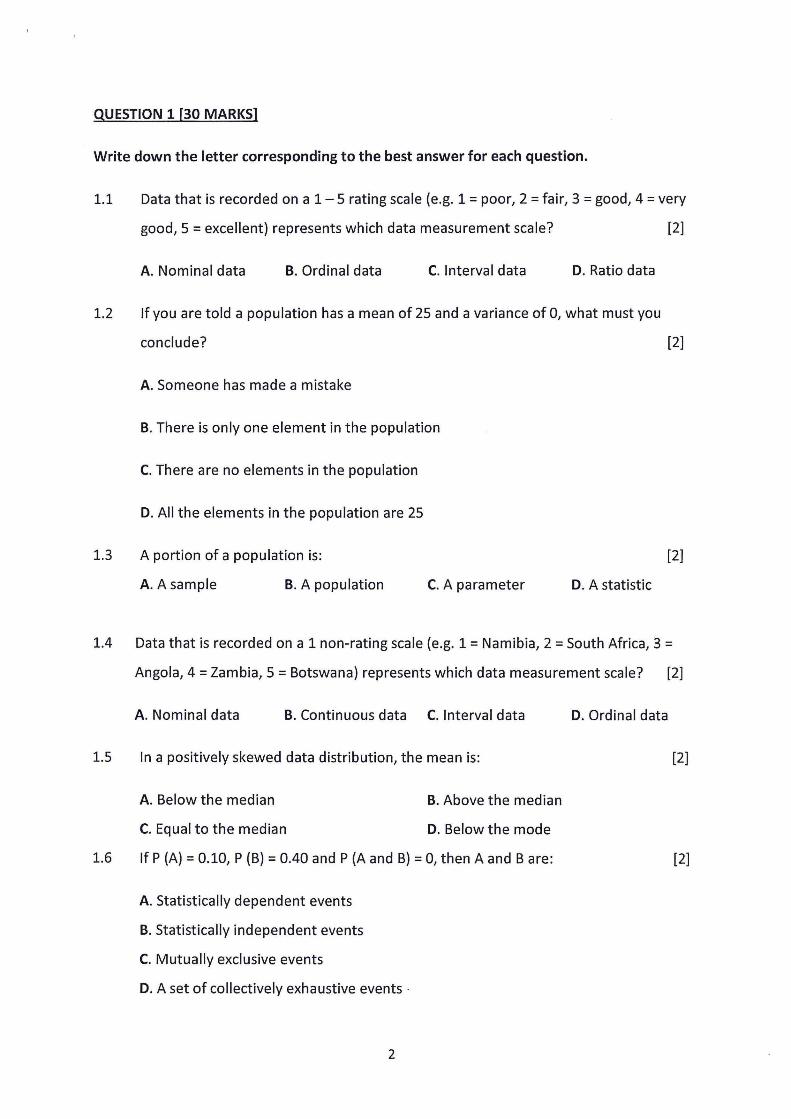
Data that is recorded on a 1 — 5 rating scale (e.g. 1 = poor, 2 = fair, 3 = good, 4 = very
good, 5 = excellent) represents which data measurement scale? [2]
A. Nominal data B. Ordinal data C. Interval data D. Ratio data
If you are told a population has a mean of 25 and a variance of 0, what must you
conclude? [2]
A. Someone has made a mistake
B. There is only one element in the population
C. There are no elements in the population
D. All the elements in the population are 25
A portion of a population is: [2]
A. A sample B. A population C. A parameter D. A statistic
Data that is recorded on a 1 non-rating scale (e.g. 1 = Namibia, 2 = South Africa, 3 =
Angola, 4 = Zambia, 5 = Botswana) represents which data measurement scale? [2]
A. Nominal data B. Continuous data C. Interval data D. Ordinal data
In a positively skewed data distribution, the mean is: [2]
A. Below the median B. Above the median
C. Equal to the median D. Below the mode
If P (A) = 0.10, P (B) = 0.40 and P (A and B) = 0, then A and B are: [2]
A. Statistically dependent events
B. Statistically independent events
C. Mutually exclusive events
D. A set of collectively exhaustive events -
1.7
1.8
1.9
1.10
1.11
1.12
1.13
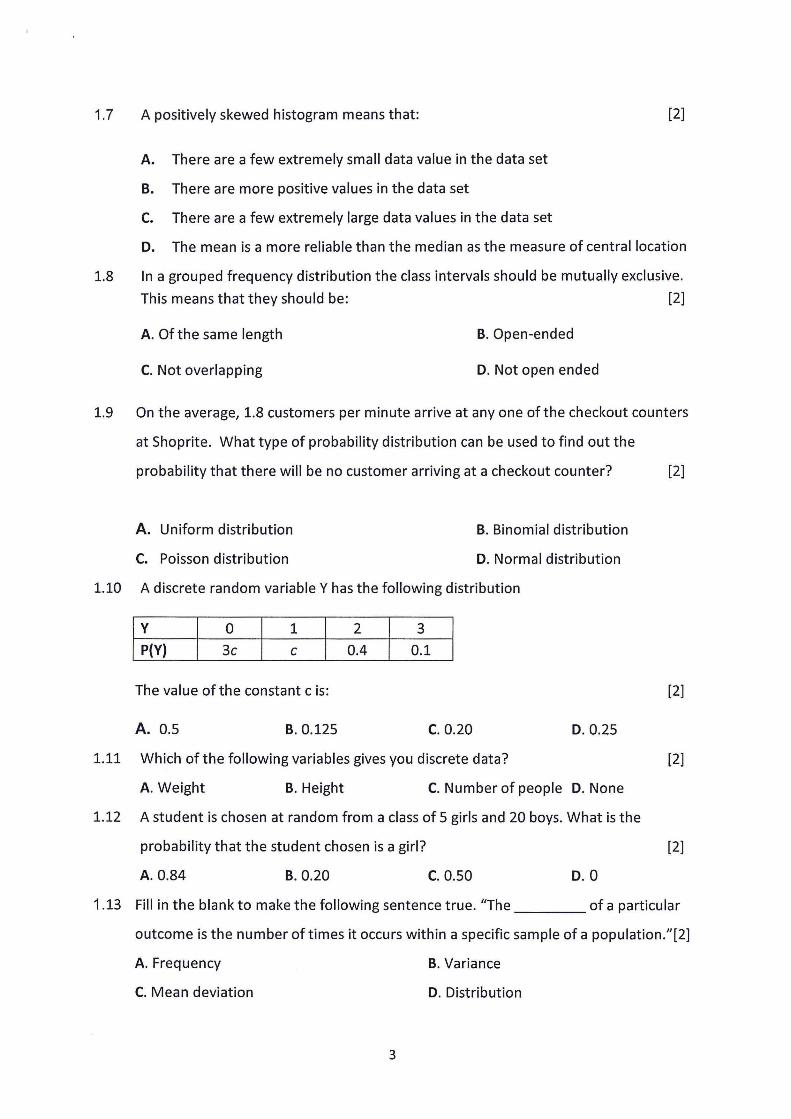
A positively skewed histogram means that: [2]
A There are a few extremely small data value in the data set
B. There are more positive values in the data set
C There are a few extremely large data values in the data set
D. The mean is a more reliable than the median as the measure of central location
In a grouped frequency distribution the class intervals should be mutually exclusive.
This means that they should be: [2]
A. Of the same length B. Open-ended
C. Not overlapping D. Not open ended
On the average, 1.8 customers per minute arrive at any one of the checkout counters
at Shoprite. What type of probability distribution can be used to find out the
probability that there will be no customer arriving at a checkout counter? [2]
A. Uniform distribution B. Binomial distribution
C. Poisson distribution D. Normal distribution
A discrete random variable Y has the following distribution
Y 0 1 2 3
P(Y) 3c c 0.4 0.1
The value of the constant c is: [2]
A. 0.5 B. 0.125 C. 0.20 D. 0.25
Which of the following variables gives you discrete data? [2]
A. Weight B. Height C. Number of people D. None
A student is chosen at random from a class of5 girls and 20 boys. What is the
probability that the student chosen is a girl? [2]
A. 0.84 B. 0.20 C. 0.50 D. 0
Fill in the blank to make the following sentence true. ”The of a particular
outcome is the number of times it occurs within a specific sample of a population.”[2]
A. Frequency B. Variance
C. Mean deviation D. Distribution
1.14
1.15
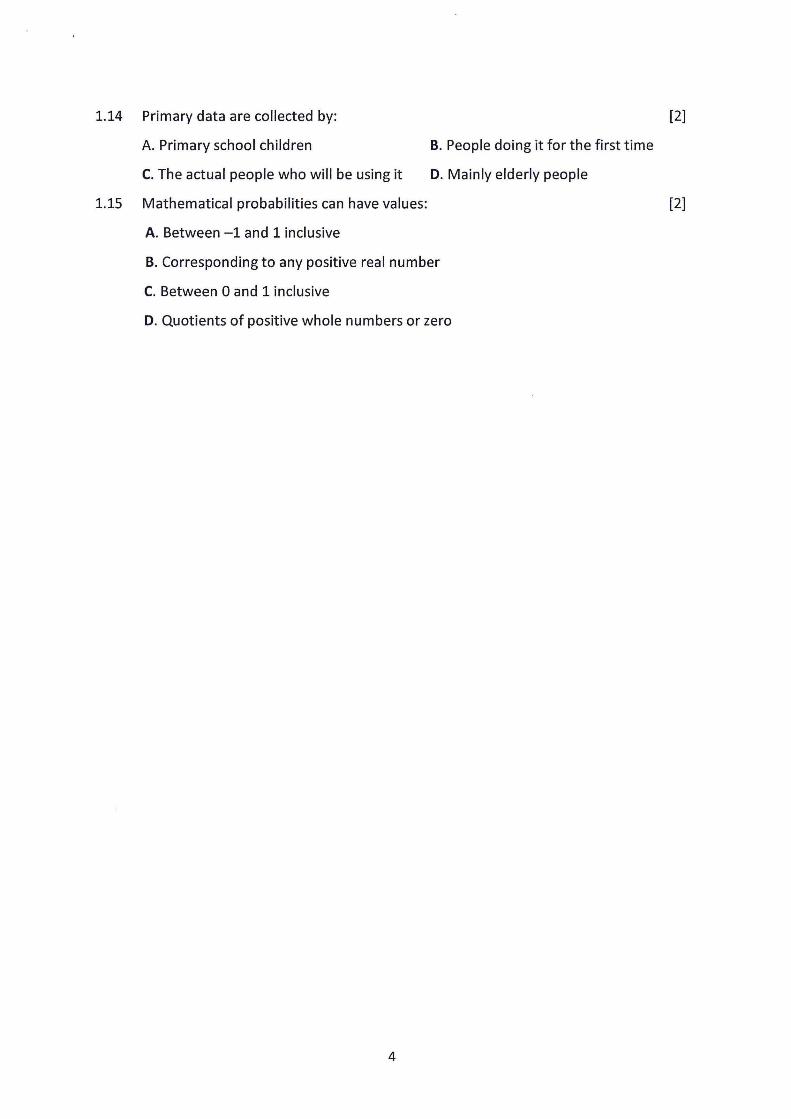
Primary data are collected by: [2]
A. Primary school children B. People doing it for the first time
C. The actual people who will be using it D. Mainly elderly people
Mathematical probabilities can have values: [2]
A. Between —1 and 1 inclusive
B. Corresponding to any positive real number
C. Between 0 and 1 inclusive
D. Quotients of positive whole numbers or zero
QUESTION 2 [33 MARKS]
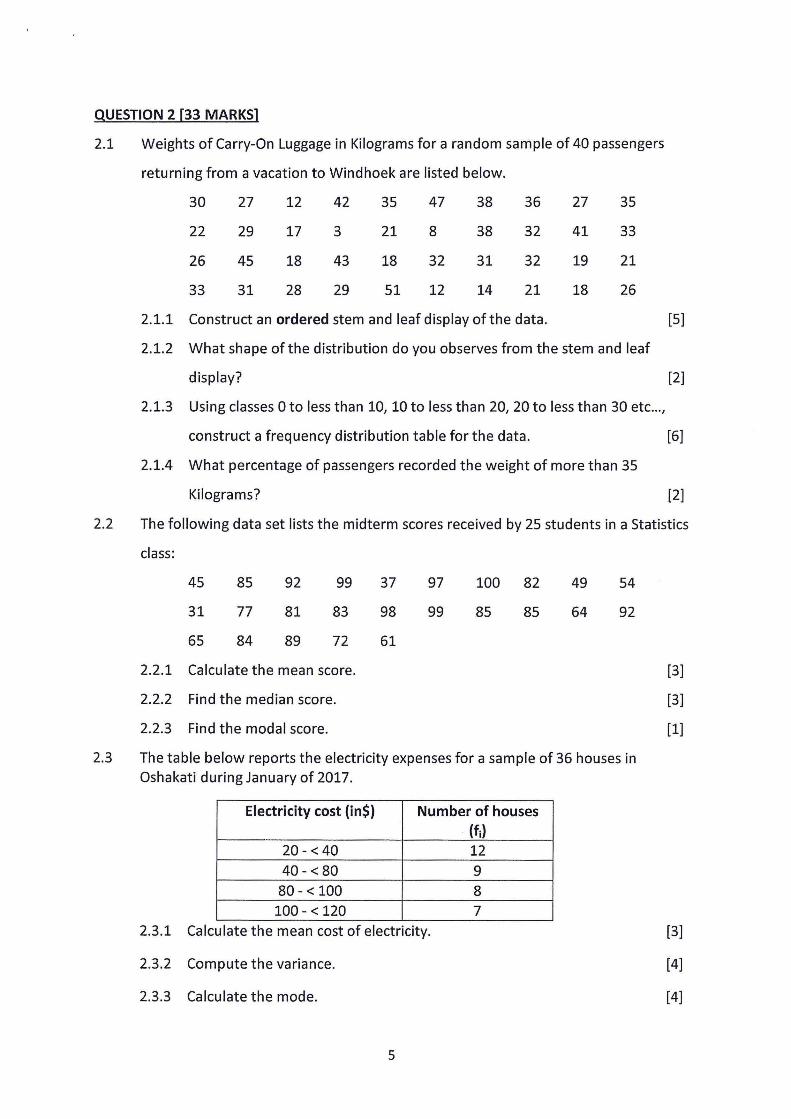
2.1 Weights of Carry-On Luggage in Kilograms for a random sample of 40 passengers
returning from a vacation to Windhoek are listed below.
30 27 12 42 35 47 38 36 27 35
22 29 17 3 21 8 38 32 41 33
26 45 18 43 18 32 31 32 19 21
33 31 28 29 51 12 14 21 18 26
2.1.1 Construct an ordered stem and leaf display ofthe data. [5]
2.1.2 What shape ofthe distribution do you observes from the stem and leaf
display? [2]
2.1.3 Using classes 0 to less than 10, 10 to less than 20, 20 to less than 30 etc...,
construct a frequency distribution table for the data. [6]
2.1.4 What percentage of passengers recorded the weight of more than 35
Kilograms? [7-]
2.2 The following data set lists the midterm scores received by 25 students in a Statistics
class:
45 85 92 99 37 97 100 82 49 54
31 77 81 83 98 99 85 85 64 92
65 84 89 72 61
2.2.1 Calculate the mean score. [3]
2.2.2 Find the median score. [3]
2.2.3 Find the modal score. [1]
2.3 The table below reports the electricity expenses for a sample of 36 houses in
Oshakati during January of 2017.
Electricity cost (in$) Number of houses
(fi)20 - < 40 12
40 - < 80 9
80 - < 100 8
100 — < 120 7
2.3.1 Calculate the mean cost of electricity. [3]
2.3.2 Compute the variance. [4]
2.3.3 Calculate the mode. [4]
QUESTION 3 [37 MARKS]
3.1
3.2
3.3
3.4
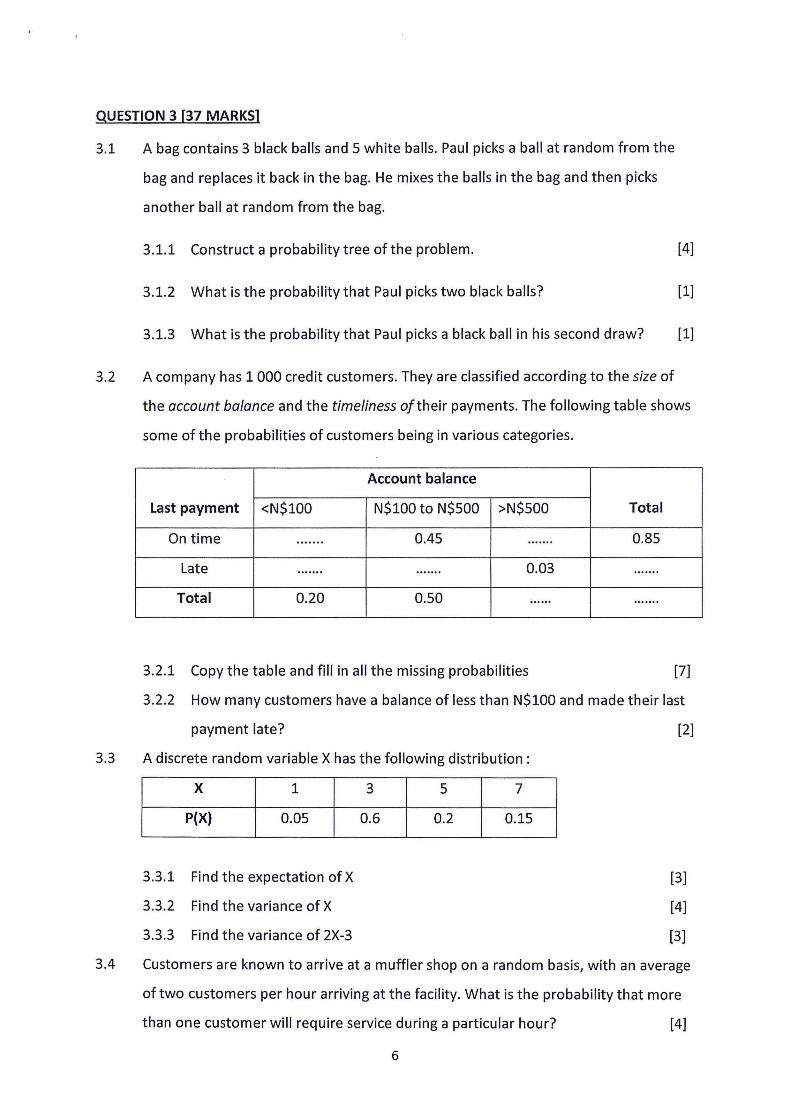
A bag contains 3 black balls and 5 white balls. Paul picks a ball at random from the
bag and replaces it back in the bag. He mixes the balls in the bag and then picks
another ball at random from the bag.
3.1.1 Construct a probability tree ofthe problem. [4]
3.1.2 What is the probability that Paul picks two black balls? [1]
3.1.3 What is the probability that Paul picks a black ball in his second draw? [1]
A company has 1 000 credit customers. They are classified according to the size of
the account balance and the timeliness oftheir payments. The following table shows
some of the probabilities of customers being in various categories.
Account balance
Last payment <N$100 N$100 to N$500 >N$500 Total
On time ....... 0.45 ....... 0.85
Late .............. 0.03 .......
Total 0.20 0.50 .............
3.2.1 Copy the table and fill in all the missing probabilities [7]
3.2.2 How many customers have a balance of less than N$100 and made their last
payment late? [2]
A discrete random variable X has the following distribution:
X 1 3 5 7
P(X) 0.05 0.6 0.2 0.15
3.3.1 Find the expectation ofX [3]
3.3.2 Find the variance ofX [4]
3.3.3 Find the variance of 2X-3 [3]
Customers are known to arrive at a muffler shop on a random basis, with an average
of two customers per hour arriving at the facility. What is the probability that more
than one customer will require service during a particular hour? [4]
6

3.5 A luxury passenger liner has passengers on board whose ages are normally
distributed around a mean of 60 years with a standard deviation of 12 years. If a
passenger is picked at random, what is the probability that:
3.5.1 He/she is between 45 and 78 years old? [4]
3.5.2 He/she is older than 78 years? [2]
3.5.6 He/she is younger than 45 years? [2]
:::::::=::::::::::END OF EXAMINATION:::::::::::::::::::
5217X-IBC.indd 1
e.g., for z = -l.34, refer to the - 1.3
row and the 0.04 column to
find the cumulative area, 0.090l.
m
The Standard Normal Distribution
z 0.00 0.01 0.02 0.03 0.04 0.05 0.06 0.07 0.08 0.09
—3.0 0.0013 0.0013 0.0013 0.0012 0.0012 0.0011 0.0011 0.0011 0.0010 0.0010
—2.9 0.0019 0.0018 0.0018 0.0017 0.0016 0.0016 0.0015 0.0015 0.0014 0.0014
—2.8 0.0026 0.0025 0.0024 0.0023 0.0023 0.0022 0.0021 0.0021 0.0020 0.0019
—2.7 0.0035 0.0034 0.0033 0.0032 0.0031 0.0030 0.0029 0.0028 0.0027 0.0026
—2.6 0.0047 0.0045 0.0044 0.0043 0.0041 0.0040 0.0039 0.0038 0.0037 0.0036
-—2.5 0.0062 0.0060 0.0059 0.0057 0.0055 0.0054 0.0052 0.0051 0.0049 0.0048
—2.4 0.0082 0.0080 0.0078 0.0075 0.0073 0.0071 0.0069 0.0068 0.0066 0.0064
—2.3 0.0107 0.0104 0.0102 0.0099 0.0096 0.0094 0.0091 0.0089 0.0087 0.0084
—2.2 0.0139 0.0136 0.0132 0.0129 0.0125 0.0122 0.0119 0.0116 0.0113 0.0110
—2.1 0.0179 0.0174 0.0170 0.0166 0.0162 0.0158 0.0154 0.0150 0.0146 0.0143
—2.0 0.0228 0.0222 0.0217 0.0212 0.0207 0.0202 0.0197 0.0192 0.0188 0.0183
—1.9 0.0287 0.0281 0.0274 0.0268 0.0262 0.0256 0.0250 0.0244 0.0239 0.0233
—1.8 0.0359 0.0351 0.0344 0.0336 0.0329 0.0322 0.0314 0.0307 0.0301 0.0294
—1.7 0.0446 0.0436 0.0427 0.0418 0.0409 0.0401 0.0392 0.0384 0.0375 0.0367
—1.6 0.0548 0.0537 0.0526 0.0516 0.0505 0.0495 0.0485 0.0475 0.0465 0.0455
—1.5 0.0668 0.0655 0.0643 0.0630 0.0618 0.0606 0.0594 0.0582 0.0571 0.0559
—1.4 0.0808 0.0793 0.0778 0.0764 0.0749 0.0735 0.0721 0.0708 0.0694 0.0681
—1.3 0.0968 0.0951 0.0934 0.0918 0.0901 0.0885 0.0869 0.0853 0.0838 0.0823
—1.2 0.1151 0.1131 0.1112 0.1093 0.1075 0.1056 0.1038 0.1020 0.1003 0.0985
-—1.1 0.1357 0.1335 0.1314 0.1292 0.1271 0.1251 0.1230 0.1210 0.1190 0.1170
—1.0 0.1587 0.1562 0.1539 0.1515 0.1492 0.1469 0.1446 0.1423 0.1401 0.1379
—0.9 0.1841 0.1814 0.1788 0.1762 0.1736 0.1711 0.1685 0.1660 0.1635 0.1611
—0.8 0.2119 0.2090 0.2061 0.2033 0.2005 0.1977 0.1949 0.1922 0.1894 0.1867
—0.7 0.2420 0.2389 0.2358 0.2327 0.2296 0.2266 0.2236 0.2206 0.2177 0.2148
—0.6 0.2743 0.2709 0.2676 0.2643 0.2611 0.2578 0.2546 0.2514 0.2483 0.2451
—0.5 0.3085 0.3050 0.3015 0.2981 0.2946 0.2912 0.2877 0.2843 0.2810 0.2776
—0.4 0.3446 0.3409 0.3372 0.3336 0.3300 0.3264 0.3228 0.3192 0.3156 0.3121
—0.3 0.3821 0.3783 0.3745 0.3707 0.3669 0.3632 0.3594 0.3557 0.3520 0.3483
—0.2 0.4207 0.4168 0.4129 0.4090 0.4052 0.4013 0.3974 0.3936 0.3897 0.3859
—0.1 0.4602 0.4562 0.4522 0.4483 0.4443 0.4404 0.4364 0.4325 0.4286 0.4247
—0.0 0.5000 0.4960 0.4920 0.4880 0.4840 0.4801 0.4761 0.4721 0.4681 0.4641
Source: Cumulative standard normal probabilities generated by Minitab. then rounded to four decimal places.
04/02/10 8:53 PM
![COMPUTING AND INFORMATICS - exampapers.nust.naexampapers.nust.na/greenstone3/sites/localsite/collect/exampape/index... · possible? [6 marks] (d) Why do you think mutual exclusion](https://img.pdfslide.net/doc/110x75/5e1546ebb6a01f70bc54fd6c/computing-and-informatics-possible-6-marks-d-why-do-you-think-mutual-exclusion.jpg)