Embed Size (px)
Citation preview
Faculty of Behavioural, Management and
Social Sciences
Cost analysis of the Wound
Expertise Centre at the Isala
clinics in Zwolle
F. van der Vegt
Master Thesis
August 2017
ii
Cost analysis of the Wound Expertise Centre at the
Isala clinics in Zwolle
F. (Femke) van der Vegt
Industrial Engineering and Management, University of Twente
Specialization: Healthcare Technology and Management
Supervisory committee
University of Twente
Dr. R.A.M.G. (Reinoud) Joosten
Dr. B. (Berend) Roorda
MST Enschede
R. (Robbert) Meerwaldt

iii
Management summary
Introduction
This study focuses on the analysis of costs regarding the treatment of chronic wounds at
the Wound Expertise Centre (WEC) at the Isala clinics in Zwolle. A patient’s health care
pathway consists of regular appointments at this WEC combined with home care visits by
nurses of QualityZorg. We divide the analysed expenses into costs of specialized medical
home care [Medisch Specialistische Verpleging in Thuissituatie (MSVT)] and into costs of
medical aids [Hulpmiddelen (HLP)] used during home care.
Problem description
Treatment of patients with chronic wounds involves enormous costs caused by the time-
consuming and complex process of care. The implementation of the WEC in Zwolle is one
of the measurements that have been taken to reduce these costs, and to improve
efficiency and quality of wound care. We conduct this research to gain insights in the
average treatment costs of patients who received wound care at the WEC in the Isala
clinics.
Approach
We analyse the costs of treatment of the most common types of chronic wounds. Given
the skewed data, we use the non-parametric bootstrap method for the calculations of our
statistics of interests. For the determination of the composition and size of the bootstrap
samples we define four different scenarios. These four scenarios are performed for each
type of wound. We create 1000 resamples drawn by random sampling with replacement
for the execution of each scenario. We define the following scenarios:
Scenario I: The size of each bootstrap sample is equal to eleven.
Scenario II: The size of each bootstrap sample is equal to ¼ part of the population
size of the corresponding type of wound.
Scenario III: The size of each bootstrap sample is equal to the population size of
the corresponding type of wound.
Scenario IV: The size of each bootstrap sample is equal to the population size of
the corresponding type of wound. The first resample consists of X observations
that are drawn by sampling with replacement from the population. Where X
defines the total number of patients in this population. The next samples consists
of X observations that are drawn from a group composed of the observations of
the population plus the previous resamples.

iv
This scenario is clearly explained below, where S denotes the resample number
and X is equal to the population size of the corresponding type of chronic wound.
S1 - X patients from P0
S2 - X patients from P0 S1
S3 - X patients from P0 S1 S2
S1000 - X patients from P0 S1 S2 ,….., S999
We estimate the average costs of treatment of each type of wound by calculating the
average of all these resample means.
Results
The table below shows the most important results of our cost analysis based on the non-
parametric bootstrap method. The total costs that are used for bootstrapping are based
on the sum of the MSVT and HLP costs.
Conclusion
The most expensive treatment in terms of MSVT and HLP costs is the venous ulcer
(average total costs range between € 2,015.51 (Scenario IV) to € 2,617.41 (Scenario II)).
Followed by the arterial ulcer and the pressure ulcer.
However, our results are based on very small populations, which range between 22 and
65 patients. Therefore, caution is necessary when interpreting our results. In future
research more data of MSVT and HLP costs should be used. Then, estimating the average
costs can be done more precisely. Our results are based on the created 1000 bootstrap
samples within each scenario. We also recommend performing significant more runs of
each bootstrap scenario.
Type of wound (n)
Arithmetic mean costs
population (SD)
Bootstrapped average costs Scenario I (SD)
Bootstrapped average costs
Scenario II (SD)
Bootstrapped average costs
Scenario III (SD)
Bootstrapped average costs
Scenario IV (SD)
Venous ulcer (22) € 2,592.27
(€ 3,091.21) € 2,555.19 (€ 905.55)
€ 2,617.41 (€ 1,271.78)
€ 2,563.57 (€ 698.02)
€ 2,015.51 (€ 430.91)
Arterial ulcer (33) € 2,531.07
(€ 2,466.05) € 2,540.68 (€ 716.74)
€ 2,561.84 (€ 893.78)
€ 2,535.78 (€ 427.38)
€ 2,417.43 (€ 416.36)
Pressure ulcer (29) € 2,009.05
(€ 1,760.67) € 1,993.18 (€ 537.61)
€ 2,027.10 (€ 670.47)
€ 2,010.83 (€ 325.86)
€ 1,998.67 (€ 318.11)
Traumatic ulcer (53) € 1,961.35
(€ 2,108.46) € 1,955.36 (€ 615.38)
€ 1,943.17 (€ 576.97)
€ 1,961.32 (€ 285.86)
€ 1,771.09 (€ 247.87)
Diabetic mellitus ulcer (65)
€ 1,650.53 (€ 1,546.60)
€ 1,676.22 (€ 453.90)
€ 1,638.48 (€ 384.00)
€ 1,658.51 (€ 195.56)
€ 1,702.06 (€ 176.18)
POWI ulcer (47) € 1,507.40 (€ 997.66)
€ 1,505.20 (€ 292.34)
€ 1,495.30 (€ 291.37)
€ 1,511.17 (€ 138.75)
€ 1,625.54 (€ 145.87)
Surgical wound (55) € 1,476.52
(€ 1,451.68) € 1,494.59 (€ 456.21)
€ 1,459.52 (€ 377.62)
€ 1,477.26 (€ 186.39)
€ 1,350.96 (€ 191.92)

v
Management samenvatting
Introductie
Dit onderzoek richt zich op het analyseren van de kosten van de behandeling van een
chronische wond. De patiënten van wie wij de kosten analyseren zijn allemaal behandeld
in het Wond Expertise Centrum (WEC) van de Isala kliniek in Zwolle. Deze patiënten
hebben reguliere behandelingen in het WEC, daarnaast ontvangen zij medisch
specialistische verpleging in de thuissituatie (MSVT) verzorgd door de verpleegkundigen
van QualityZorg. De kosten die wij analyseren zijn onder te verdelen in kosten van de
MSVT en kosten met betrekking tot de medische hulpmiddelen (HLP) die tijdens de
thuiszorg zijn gebruikt.
Probleembeschrijving
De behandeling van patiënten met chronische wonden gaat gepaard met enorme kosten
die veroorzaakt worden door het tijdrovende en complexe genezingsproces. Dit
onderzoek voeren wij uit om beter inzicht te krijgen in de gemiddelde kosten van de
behandeling van patiënten in het WEC in Zwolle.
Aanpak
We analyseren de behandelingskosten van de meest voorkomende type chronische
wonden. Gezien de scheve verdelingen van deze data, gebruiken wij de niet-
parametrische bootstrap methode. Voor deze methode hebben wij vier verschillende
scenario’s opgesteld die de grootte en de samenstelling van de bootstrap steekproeven
bepalen. Deze verschillende scenario’s worden voor elk type wond uitgevoerd. Voor elk
scenario creëren wij 1000 bootstrap steekproeven die door middel van trekken met
teruglegging zijn gegenereerd. Wij definiëren de volgende vier scenario’s:
Scenario I: De grootte van elke bootstrap steekproef is gelijk aan elf.
Scenario II: De grootte van elke bootstrap steekproef is gelijk aan ¼ deel van de
populatie van de desbetreffende wond.
Scenario III: De grootte van elke bootstrap steekproef is gelijk aan de gehele
populatie van de desbetreffende wond.
Scenario IV: De grootte van elke bootstrap steekproef is gelijk aan de gehele
populatie van de desbetreffende wond. De populatie van de eerste bootstrap
steekproef bestaat uit een X aantal observaties die getrokken zijn door middel van
trekken met teruglegging uit de populatie, waar X het aantal patiënten in de
populatie definieert. De volgende bootstrap steekproeven bestaan uit X
observaties getrokken uit een groep van observaties die bestaat uit de populatie
plus de voorgaande bootstrap steekproef populaties.
vi
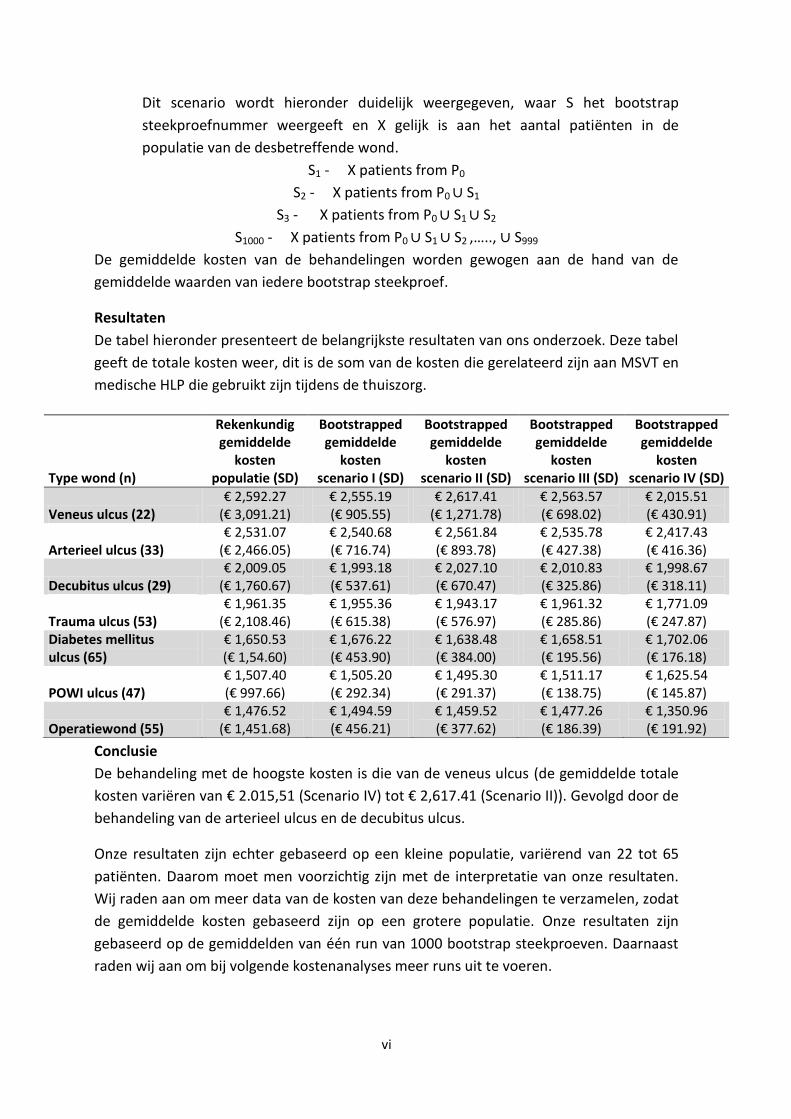
Dit scenario wordt hieronder duidelijk weergegeven, waar S het bootstrap
steekproefnummer weergeeft en X gelijk is aan het aantal patiënten in de
populatie van de desbetreffende wond.
S1 - X patients from P0
S2 - X patients from P0 S1
S3 - X patients from P0 S1 S2
S1000 - X patients from P0 S1 S2 ,….., S999
De gemiddelde kosten van de behandelingen worden gewogen aan de hand van de
gemiddelde waarden van iedere bootstrap steekproef.
Resultaten
De tabel hieronder presenteert de belangrijkste resultaten van ons onderzoek. Deze tabel
geeft de totale kosten weer, dit is de som van de kosten die gerelateerd zijn aan MSVT en
medische HLP die gebruikt zijn tijdens de thuiszorg.
Conclusie
De behandeling met de hoogste kosten is die van de veneus ulcus (de gemiddelde totale
kosten variëren van € 2.015,51 (Scenario IV) tot € 2,617.41 (Scenario II)). Gevolgd door de
behandeling van de arterieel ulcus en de decubitus ulcus.
Onze resultaten zijn echter gebaseerd op een kleine populatie, variërend van 22 tot 65
patiënten. Daarom moet men voorzichtig zijn met de interpretatie van onze resultaten.
Wij raden aan om meer data van de kosten van deze behandelingen te verzamelen, zodat
de gemiddelde kosten gebaseerd zijn op een grotere populatie. Onze resultaten zijn
gebaseerd op de gemiddelden van één run van 1000 bootstrap steekproeven. Daarnaast
raden wij aan om bij volgende kostenanalyses meer runs uit te voeren.
Type wond (n)
Rekenkundig gemiddelde
kosten populatie (SD)
Bootstrapped gemiddelde
kosten scenario I (SD)
Bootstrapped gemiddelde
kosten scenario II (SD)
Bootstrapped gemiddelde
kosten scenario III (SD)
Bootstrapped gemiddelde
kosten scenario IV (SD)
Veneus ulcus (22) € 2,592.27
(€ 3,091.21) € 2,555.19 (€ 905.55)
€ 2,617.41 (€ 1,271.78)
€ 2,563.57 (€ 698.02)
€ 2,015.51 (€ 430.91)
Arterieel ulcus (33) € 2,531.07
(€ 2,466.05) € 2,540.68 (€ 716.74)
€ 2,561.84 (€ 893.78)
€ 2,535.78 (€ 427.38)
€ 2,417.43 (€ 416.36)
Decubitus ulcus (29) € 2,009.05
(€ 1,760.67) € 1,993.18 (€ 537.61)
€ 2,027.10 (€ 670.47)
€ 2,010.83 (€ 325.86)
€ 1,998.67 (€ 318.11)
Trauma ulcus (53) € 1,961.35
(€ 2,108.46) € 1,955.36 (€ 615.38)
€ 1,943.17 (€ 576.97)
€ 1,961.32 (€ 285.86)
€ 1,771.09 (€ 247.87)
Diabetes mellitus ulcus (65)
€ 1,650.53 (€ 1,54.60)
€ 1,676.22 (€ 453.90)
€ 1,638.48 (€ 384.00)
€ 1,658.51 (€ 195.56)
€ 1,702.06 (€ 176.18)
POWI ulcus (47) € 1,507.40 (€ 997.66)
€ 1,505.20 (€ 292.34)
€ 1,495.30 (€ 291.37)
€ 1,511.17 (€ 138.75)
€ 1,625.54 (€ 145.87)
Operatiewond (55) € 1,476.52
(€ 1,451.68) € 1,494.59 (€ 456.21)
€ 1,459.52 (€ 377.62)
€ 1,477.26 (€ 186.39)
€ 1,350.96 (€ 191.92)

vii
Preface
Dear reader,
This report is the result of my graduation project of the master program Industrial
Engineering and Management at the University of Twente (specialization Health Care
Technology and Management).
I could not have conducted this research without the help of many people. So, I want to
thank all those who helped me carrying out this research. First, I want to thank my
Medisch Spectrum Twente supervisor Robbert Meerwaldt for his feedback and insights in
the world of (chronic) wounds. Our meetings helped me to understand the organization
of wound care in the Netherlands, and the challenges it faces. My grateful thanks also to
Abhishta for answering my questions and providing tips for modelling in Excel and
Matlab.
Furthermore, I would like to thank my first supervisor Reinoud Joosten from the
University of Twente. When I struggled with my research, your advice and feedback has
been very helpful. Your feedback and tips encouraged me to continue working on my
report. I would like to thank my second supervisor Berend Roorda for your willingness to
participate as second supervisor at the last moment.
Finally, I would like to thank my family for their support, encouragement and motivation
during my study years and graduating.
I hope you enjoy reading this report. If there are any further questions, please feel free to
contact me.
Kind regards,
Femke van der Vegt
Enschede, August 2017
viii
Contents
Management summary ..................................................................................................................... iii
Management samenvatting ............................................................................................................... v
Preface ............................................................................................................................................... vii
Contents ........................................................................................................................................... viii
List of abbreviations ........................................................................................................................... x
List of figures ...................................................................................................................................... xi
List of tables ..................................................................................................................................... xiv
1. Research introduction ................................................................................................................ 2
1.1 Background to the research ............................................................................................... 2
1.2 Introduction to the MST ..................................................................................................... 2
1.3 Methodology ...................................................................................................................... 3
1.4 Remainder of the report .................................................................................................... 5
2. Literature research ..................................................................................................................... 7
2.1 Wound healing process ...................................................................................................... 7
2.2 Definition chronic wound ................................................................................................... 8
2.3 Prevalence of chronic wounds ........................................................................................... 9
2.4 Wound care in the Netherlands ....................................................................................... 13
2.4.1 Organization of wound care ..................................................................................... 13
2.4.2 Wound expertise centre ........................................................................................... 14
2.5 Costs of chronic wound care ............................................................................................ 15
2.5.1 Dutch health insurance system ................................................................................ 15
2.5.2 Costs of chronic wound care .................................................................................... 16
2.6 Previous conducted cost analyses of wound care centres in the Netherlands ............... 16
2.6.1 Cost analysis of the Knowledge Centre in Wound care at Venray ........................... 17
2.6.2 Cost analysis conducted by Capgemini Consulting .................................................. 21
2.7 Wound expertise centre at the Isala clinics ..................................................................... 23
2.8 Bootstrap method ............................................................................................................ 23
3. Method ..................................................................................................................................... 27
3.1 Available data ................................................................................................................... 27
3.2 Sample size scenarios ....................................................................................................... 30
3.3 Excel .................................................................................................................................. 32
4. Results ...................................................................................................................................... 35
4.1 Arterial ulcer ..................................................................................................................... 35

ix
4.2 Diabetic mellitus ulcer ...................................................................................................... 38
4.3 POWI ulcer ........................................................................................................................ 42
4.4 Pressure ulcer ................................................................................................................... 45
4.5 Surgical wound ................................................................................................................. 48
4.6 Traumatic ulcer ................................................................................................................. 50
4.7 Venous ulcer ..................................................................................................................... 53
4.8 Comparison of the average total costs............................................................................. 57
5. Conclusion and recommendations ........................................................................................... 59
5.1 Conclusion ........................................................................................................................ 59
5.2 Discussion ......................................................................................................................... 62
5.3 Recommendations............................................................................................................ 63
5.4 Future research ................................................................................................................ 64
Bibliography ...................................................................................................................................... 65
Appendix A: Total costs arterial ulcer .............................................................................................. 68
Appendix B: MSVT costs arterial ulcer ............................................................................................. 71
Appendix C: HLP costs arterial ulcer ................................................................................................. 74
Appendix D: Total costs diabetic mellitus ulcer ............................................................................... 77
Appendix E: MSVT costs diabetic mellitus ulcer ............................................................................... 80
Appendix F: HLP costs diabetic mellitus ulcer .................................................................................. 83
Appendix G: Total costs POWI ulcer ................................................................................................. 86
Appendix H: MSVT costs POWI ulcer ............................................................................................... 89
Appendix I: HLP costs POWI ulcer .................................................................................................... 92
Appendix J: Total costs pressure ulcer ............................................................................................. 95
Appendix K: MSVT costs pressure ulcer ........................................................................................... 98
Appendix L: HLP costs pressure ulcer ............................................................................................. 101
Appendix M: Total costs surgical wound ........................................................................................ 104
Appendix N: MSVT costs surgical wound ....................................................................................... 107
Appendix O: HLP costs surgical wound .......................................................................................... 110
Appendix P: Total costs traumatic ulcer ......................................................................................... 113
Appendix Q: MSVT costs traumatic ulcer ....................................................................................... 116
Appendix R: HLP costs traumatic ulcer........................................................................................... 119
Appendix S: Total costs venous ulcer ............................................................................................. 122
Appendix T: MSVT costs venous ulcer ............................................................................................ 125
Appendix U: HLP costs venous ulcer .............................................................................................. 128

x
List of abbreviations
CI - Confidence interval
HLP Hulpmiddelen
KCWC - Knowledge Centre in Wound Care
LPZ - Landelijke Prevalentiemeting Zorgproblemen
MSVT - Medisch Specialistische Verpleging in de Thuissituatie
SD - Standard deviation
WEC - Wound Expertise Centre
Wlz - Wet langdurige zorg
ZIN - Zorginstituut Nederland
Zvw - Zorgverzerkeringswet
xi
List of figures
Figure 1 Prevalence of different chronic type of wounds in the Netherlands in 2015 .................... 11
Figure 2 Wound duration of the LPZ 2015 measurements. ............................................................. 12
Figure 3 Aetiology of the most common types of wounds of patients included in our research. ... 29
Figure 4 Histogram of the total costs of the treatment of the arterial ulcer (Population). ............. 36
Figure 5 Histogram of the total costs of the treatment of the arterial ulcer (Scenario IV). ............ 36
Figure 6 Histogram of the average total costs of treatment of the arterial ulcer (all scenarios). ... 37
Figure 7 Histogram total costs of the treatment of the diabetic mellitus ulcer (Population).......... 39
Figure 8 Histogram average total costs of treatment of the diabetic mellitus ulcer (Scenario IV) .. 39
Figure 9 Histogram average total costs of treatment of the diabetic mellitus ulcer (all scenarios).41
Figure 10 Histogram of the total costs of the treatment of the POWI ulcer (Population). ............. 42
Figure 11 Histogram of the average total costs of the treatment of the POWI ulcer (Scenario IV). 43
Figure 12 Histogram of the average total costs of treatment of the POWI ulcer (all scenarios). .... 44
Figure 13 Histogram of the total costs of the treatment of the pressure ulcer (Population). ......... 45
Figure 14 Histogram of the average total costs of treatment of the pressure ulcer (Scenario IV). . 46
Figure 15 Histogram of the average total costs of treatment of the pressure ulcer (all scenarios). 47
Figure 16 Histogram of the total costs of the treatment of the surgical wound (Population). ....... 48
Figure 17 Histogram of the average total costs of treatment of the surgical wound (Scenario IV). 48
Figure 18 Histogram of the total costs of the treatment of the surgical wound (all scenarios). ..... 49
Figure 19 Histogram of the total costs of the treatment of the traumatic ulcer (Population). ....... 51
Figure 20 Histogram of the average total costs of treatment of the traumatic ulcer (Scenario IV). 51
Figure 21 Histogram of the average total costs of treatment of traumatic ulcer (all scenarios). .... 52
Figure 22 Histogram of the total costs of the treatment of the venous ulcer (Population). ........... 54
Figure 23 Histogram of the average total costs of treatment of the venous ulcer (Scenario IV). ... 54
Figure 24 Histogram of the average total costs of treatment of the venous ulcer (all scenarios). . 55
Figure 25 Histogram of total costs of the arterial ulcer (Population, n=33). ................................... 68
Figure 26 Histogram of the average total costs of the arterial ulcer (Scenario I, n=33). ................. 68
Figure 27 Histogram of the average total costs of the arterial ulcer (Scenario II, n=33). ................ 69
Figure 28 Histogram of the average total costs of the arterial ulcer (Scenario III, n=33). ............... 69
Figure 29 Histogram of the average total costs of the arterial ulcer (Scenario IV, n=33). ............... 70
Figure 30 Histogram of the MSVT costs of the arterial ulcer (Population, n=33). ........................... 71
Figure 31 Histogram of the average MSVT costs of the arterial ulcer (Scenario I, n=33). ............... 71
Figure 32 Histogram of the average MSVT costs of the arterial ulcer (Scenario II, n=33). .............. 72
Figure 33 Histogram of the average MSVT costs of the arterial ulcer (Scenario III, n=33). ............. 72
Figure 34 Histogram of the MSVT costs of the arterial ulcer (Scenario IV, n=33). ........................... 73
Figure 35 Histogram of the HLP costs of the arterial ulcer (Population, n=33). .............................. 74
Figure 36 Histogram of the average HLP costs of the arterial ulcer (Scenario I, n=33). .................. 74
Figure 37 Histogram of the average HLP costs of the arterial ulcer (Scenario II, n=33). ................. 75
Figure 38 Histogram of the average HLP costs of the arterial ulcer (Scenario III, n=33). ................ 75
Figure 39 Histogram of the average HLP costs of the arterial ulcer (Scenario IV, n=33). ................ 76
Figure 40 Histogram of the total costs of the diabetic mellitus ulcer (Population, n=65). .............. 77
Figure 41 Histogram of the average total costs of the diabetic mellitus ulcer (Scenario I, n= 65). . 77
Figure 42 Histogram of the average total costs of the diabetic mellitus ulcer (Scenario II, n=65). . 78
xii
Figure 43 Histogram of the average total costs of the diabetic mellitus ulcer (Scenario III, n=65). 78
Figure 44 Histogram of the average total costs of the diabetic mellitus ulcer (Scenario IV, n=65). 79
Figure 45 Histogram of the MSVT costs of the diabetic mellitus ulcer (Population, n=65). ............ 80
Figure 46 Histogram of the average MSVT costs of the diabetic mellitus ulcer (Scenario I, n=65). 80
Figure 47 Histogram of the average MSVT costs of the diabetic mellitus ulcer (Scenario II, n=65). 81
Figure 48 Histogram of the average MSVT costs of the diabetic mellitus ulcer (Scenario III, n=65) 81
Figure 49 Histogram of the average MSVT costs of the diabetic mellitus ulcer (Scenario IV, n=65)82
Figure 50 Histogram of the HLP costs of the diabetic mellitus ulcer (Population, n=65). ............... 83
Figure 51 Histogram of the average HLP costs of the diabetic mellitus ulcer (Scenario I, n=65). ... 83
Figure 52 Histogram of the average HLP costs of the diabetic mellitus ulcer (Scenario II, n=65). .. 84
Figure 53 Histogram of the average HLP costs of the diabetic mellitus ulcer (Scenario III, n=65). . 84
Figure 54 Histogram of the average HLP costs of the diabetic mellitus ulcer (Scenario IV, n=65). . 85
Figure 55 Histogram of the total costs of the POWI ulcer (Population, n=47). ............................... 86
Figure 56 Histogram of the average total costs of the POWI ulcer (Scenario I, n=47). ................... 86
Figure 57 Histogram of the average total costs of the POWI ulcer (Scenario II, n=47). .................. 87
Figure 58 Histogram of the average total costs of the POWI ulcer (Scenario III, n=47). ................. 87
Figure 59 Histogram of the average total costs of the POWI ulcer (Scenario IV, n=47). ................. 88
Figure 60 Histogram of the average MSVT costs of the POWI ulcer (Population, n=47). ................ 89
Figure 61 Histogram of the average MSVT costs of the POWI ulcer (Scenario I, n=47). .................. 89
Figure 62 Histogram of the average MSVT costs of the POWI ulcer (Scenario II, n=47). ................. 90
Figure 63 Histogram of the average MSVT costs of the POWI ulcer (Scenario III, n=47). ................ 90
Figure 64 Histogram of the average MSVT costs of the POWI ulcer (Scenario IV, n=47). ............... 91
Figure 65 Histogram of the HLP costs of the POWI ulcer (Population, n=47). ................................. 92
Figure 66 Histogram of the average HLP costs of the POWI ulcer (Scenario I, n=47). ..................... 92
Figure 67 Histogram of the average HLP costs of the POWI ulcer (Scenario II, n=47). .................... 93
Figure 68 Histogram of the average HLP costs of the POWI ulcer (Scenario III, n=47). ................... 93
Figure 69 Histogram of the average HLP costs of the POWI ulcer (Scenario IV, n=47). ................... 94
Figure 70 Histogram of the total costs of the pressure ulcer (Population, n=29). ........................... 95
Figure 71 Histogram of the average total costs of the pressure ulcer (Scenario I, n=29). ............... 95
Figure 72 Histogram of the average total costs of the pressure ulcer (Scenario II, n=29). .............. 96
Figure 73 Histogram of the average total costs of the pressure ulcer (Scenario III, n=29). ............. 96
Figure 74 Histogram of the average total costs of the pressure ulcer (Scenario IV, n=29). ............ 97
Figure 75 Histogram of the MSVT costs of the pressure ulcer (Population, n=29). ......................... 98
Figure 76 Histogram of the average MSVT costs of the pressure ulcer (Scenario I, n=29). ............. 98
Figure 77 Histogram of the average MSVT costs of the pressure ulcer (Scenario I, n=29). ............. 99
Figure 78 Histogram of the average MSVT costs of the pressure ulcer (Scenario III, n=29). ........... 99
Figure 79 Histogram of the average MSVT costs of the pressure ulcer (Scenario IV, n=29).......... 100
Figure 80 Histogram of the HLP costs of the pressure ulcer (Population, n=29). .......................... 101
Figure 81 Histogram of the average HLP costs of the pressure ulcer (Scenario I, n=29). .............. 101
Figure 82 Histogram of the average HLP costs of the pressure ulcer (Scenario II, n=29). ............. 102
Figure 83 Histogram of the average HLP costs of the pressure ulcer (Scenario III, n=29). ............ 102
Figure 84 Histogram of the average HLP costs of the pressure ulcer (Scenario IV, n=29). ............ 103
Figure 85 Histogram of the total costs of the surgical wound (Population, n=55). ....................... 104
Figure 86 Histogram of the average total costs of the surgical wound (Scenario I, n=55). ........... 104
Figure 87 Histogram of the average total costs of the surgical wound (Scenario II, n=55). .......... 105

xiii
Figure 88 Histogram of the average total costs of the surgical wound (Scenario III, n=55). ......... 105
Figure 89 Histogram of the average total costs of the surgical wound (Scenario IV, n=55). ......... 106
Figure 90 Histogram of the MSVT costs of the surgical wound (Population, n=55). ..................... 107
Figure 91 Histogram of the average MSVT costs of the surgical wound (Scenario I, n=55). ......... 107
Figure 92 Histogram of the average MSVT costs of the surgical wound (Scenario II, n=55). ........ 108
Figure 93 Histogram of the average MSVT costs of the surgical wound (Scenario III, n=55). ....... 108
Figure 94 Histogram of the average MSVT costs of the surgical wound (Scenario IV, n=55). ....... 109
Figure 95 Histogram of the HLP costs of the surgical wound (Population, n=55).......................... 110
Figure 96 Histogram of the average HLP costs of the surgical wound (Scenario I, n=55).............. 110
Figure 97 Histogram of the average HLP costs of the surgical wound (Scenario II, n=55)............. 111
Figure 98 Histogram of the average HLP costs of the surgical wound (Scenario III, n=55)............ 111
Figure 99 Histogram of the average HLP costs of the surgical wound (Scenario IV, n=55). .......... 112
Figure 100 Histogram of the total costs of the traumatic ulcer (Population, n=53). ..................... 113
Figure 101 Histogram of average total costs of the traumatic ulcer (Scenario I, n=53). ............... 113
Figure 102 Histogram of the average total costs of the traumatic ulcer (Scenario II, n=53). ........ 114
Figure 103 Histogram of the average total costs of the traumatic ulcer (Scenario III, n=53). ....... 114
Figure 104 Histogram of the average total costs of the traumatic ulcer (Scenario IV, n=53). ....... 115
Figure 105 Histogram of the MSVT costs of the traumatic ulcer (Population, n=53). ................... 116
Figure 106 Histogram of the average MSVT costs of the traumatic ulcer (Scenario I, n=53). ....... 116
Figure 107 Histogram of the average MSVT costs of the traumatic ulcer (Scenario II, n=53). ...... 117
Figure 108 Histogram of the average MSVT costs of the traumatic ulcer (Scenario III, n=53). ..... 117
Figure 109 Histogram of the average MSVT costs of the traumatic ulcer (Scenario IV, n=53). ..... 118
Figure 110 Histogram of the HLP costs of the traumatic ulcer (Population, n=53). ...................... 119
Figure 111 Histogram of the average HLP costs of the traumatic ulcer (Scenario I, n=53). .......... 119
Figure 112 Histogram of the average HLP costs of the traumatic ulcer (Scenario II, n=53). ......... 120
Figure 113 Histogram of the average HLP costs of the traumatic ulcer (Scenario III, n=53). ........ 120
Figure 114 Histogram of the average HLP costs of the traumatic ulcer (Scenario IV, n=53). ........ 121
Figure 115 Histogram of the total costs of the venous ulcer (Population, n=22). ......................... 122
Figure 116 Histogram of the average total costs of the venous ulcer (Scenario I, n=22). ............. 122
Figure 117 Histogram of the average total costs of the venous ulcer (Scenario II, n=22). ............ 123
Figure 118 Histogram of the average total costs of the venous ulcer (Scenario III, n=22). ........... 123
Figure 119 Histogram of the average total costs of the venous ulcer (Scenario IV, n=22). ........... 124
Figure 120 Histogram of the MSVT costs of the venous ulcer (Population, n=22). ....................... 125
Figure 121 Histogram of the average MSVT costs of the venous ulcer (Scenario I, n=22). ........... 125
Figure 122 Histogram of the average MSVT costs of the venous ulcer (Scenario II, n=22). .......... 126
Figure 123 Histogram of the average MSVT costs of the venous ulcer (Scenario III, n=22). ......... 126
Figure 124 Histogram of the average MSVT costs of the venous ulcer (Scenario IV, n=22). ......... 127
Figure 125 Histogram of the HLP costs of the venous ulcer (Population, n=22). .......................... 128
Figure 126 Histogram of the average HLP costs of the venous ulcer (Scenario I, n22). ................ 128
Figure 127 Histogram of the average HLP costs of the venous ulcer (Scenario II, n=22). ............. 129
Figure 128 Histogram of the average HLP costs of the venous ulcer (Scenario III, n=22). ............ 129
Figure 129 Histogram of the HLP costs of the venous ulcer (Scenario IV, n=22). .......................... 130

xiv
List of tables
Table 1 Overview characteristics of the LPZ 2015 measurements .................................................. 10
Table 2 Wound duration of the LPZ 2015 measurements . ............................................................. 12
Table 3 Arithmetic and bootstrapped costs per patient of year before admission to the KCWC ... 19
Table 4 Arithmetic and bootstrapped costs per patient of the year after admission to the KCWC. 19
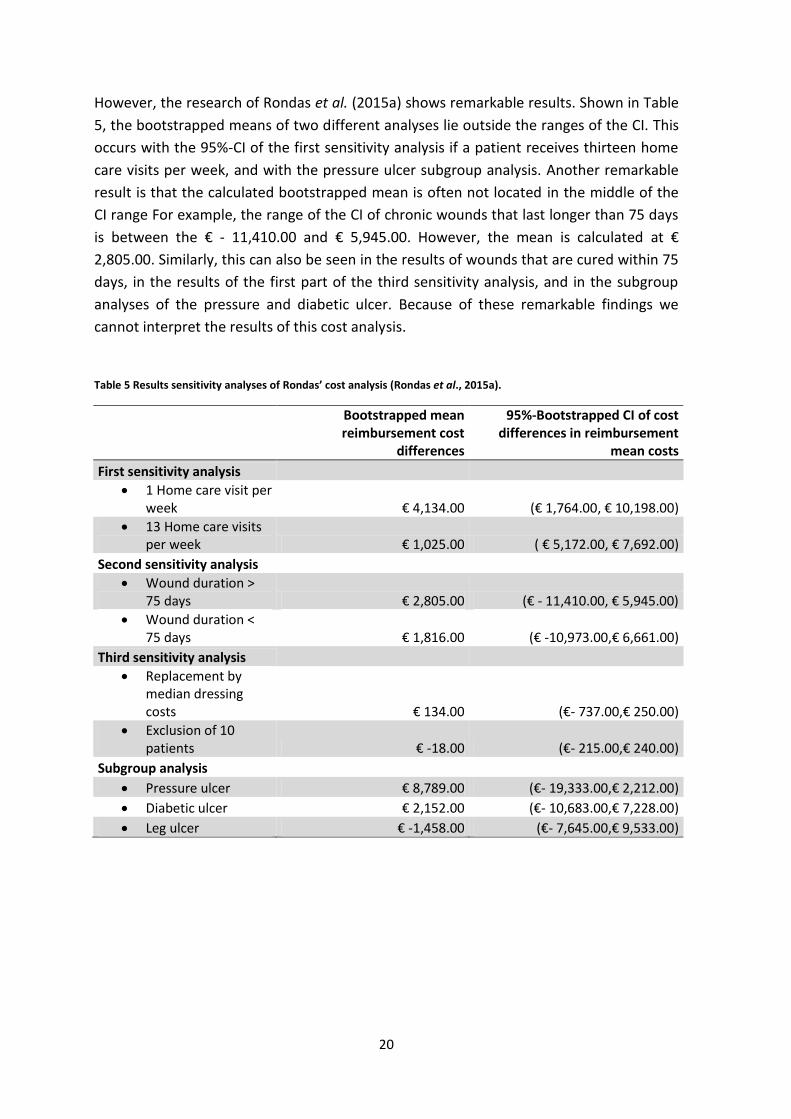
Table 5 Results sensitivity analyses of Rondas’ cost analysis . ......................................................... 20
Table 6 Results of the cost analysis conducted by Capgemini Consulting ....................................... 22
Table 7 Baseline characteristics of all included patients (n=487). ................................................... 28
Table 8 Aetiology of the most common types of chronic wounds of our cost analysis. .................. 29
Table 9 Overview of the number of observations in a bootstrap sample. ...................................... 31
Table 10 Standard deviations of the average costs of the treatment of the arterial ulcer. ............ 37
Table 11 Average costs of the treatment of the arterial ulcer. ........................................................ 38
Table 12 95% Confidence intervals of the average costs of the treatment of the arterial ulcer. .... 38
Table 13 Standard deviations of the average costs of treatment of the diabetic mellitus ulcer. .... 40
Table 14 Average costs of the treatment of the diabetic mellitus ulcer. ......................................... 41
Table 15 95% Confidence intervals of the average costs of treatment of diabetic mellitus ulcer. . 41
Table 16 Standard deviations of the average costs of the treatment of the POWI ulcer. ............... 43
Table 17 Average costs of the treatment of the POWI ulcer. .......................................................... 44
Table 18 95% Confidence intervals of the average costs of the treatment of the POWI ulcer. ...... 45
Table 19 Standard deviations of the average costs of the treatment of the pressure ulcer. .......... 46
Table 20 Average costs of the treatment of the pressure ulcer. ..................................................... 47
Table 21 95% Confidence intervals of the average costs of the treatment of the pressure ulcer. . 47
Table 22 Standard deviations of the average costs of the treatment of the surgical wound. ......... 49
Table 23 Average costs of the treatment of the surgical wound. .................................................... 50
Table 24 95% Confidence intervals of the average costs of the treatment of the surgical wound. 50
Table 25 Standard deviations of the average costs of the treatment of the traumatic ulcer. ........ 52
Table 26 Average costs of the treatment of the traumatic ulcer. .................................................... 52
Table 27 95% Confidence intervals of the average costs of the treatment of the traumatic ulcer. 53
Table 28 Standard deviations of the average costs of the treatment of the venous ulcer. ............ 55
Table 29 Average costs of the treatment of the venous ulcer. ........................................................ 56
Table 30 95% Confidence interval of the average costs of the treatment of venous ulcer. ............ 56
Table 31 Comparison of the bootstrapped average total costs of treatment of diabetic mellitus
ulcers. ............................................................................................................................................... 57
Table 32 Comparison of the bootstrapped average total costs of treatment of venous ulcers. ..... 57
Table 33 Overview of the average MSVT costs of the treatment of chronic wounds. .................... 60
Table 34 Overview of the average HLP costs of the treatment of complex wounds. ...................... 60
Table 35 Overview of the average total costs of the treatment of chronic wounds. ...................... 61

1
Research introduction
2
1. Research introduction
This research focuses on the Wound Expertise Centre (WEC) integrated in the Isala clinics
at Zwolle. The objective of this master thesis is to estimate the average costs associated
to specialized medical home care [Medisch Specialistische Verpleging in de Thuissituatie
(MSVT)] and medical aids [Hulpmiddelen (HLP)] used during home care.
This chapter is structured as follows: Section 1.1 describes the background to this
research and Section 1.2 is an introduction to the Medisch Spectrum Twente. In Section
1.3 we define the methodology, including the research questions and Section 1.4
describes the outline of this report.
1.1 Background to the research
Chronic wound care involves enormous costs caused by the time-consuming and complex
process of care, delay in hospital discharge, complications, long-term commitment of
health care professionals, and high costs of medical devices and medical aids (Capgemini
Consulting, 2014). Several measures have been taken in the organization of wound care in
the Netherlands to improve quality of care, and to reduce the wound expenditures. One
of the measures is for example the implementation of WECs in the Netherlands
(Capgemini Consulting, 2014; Heyer et al., 2016; Rondas et al., 2015a).
1.2 Introduction to the MST
The Medisch Spectrum Twente (MST) has been created by a merger between the
hospitals at Enschede and Oldenzaal. Nowadays, the hospital at Enschede is the main
location and the MST has outpatient clinics at Oldenzaal, Losser and Haaksbergen. In
January 2016 the MST opened a new hospital located in the city centre of Enschede. One
of the main differences in the organization of care is the difference in bed capacity
between the two old departments and the new location. The capacity in the current
hospital is 620 beds, which is a reduction of 43.6% (MST, 2016).
The MST stated that it wants to achieve the title of the ‘Best improvement hospital of the
Netherlands’ (MST, 2016). Therefore, quality and safety are important parts of the vision
of the MST. In addition, one of the improvements which the MST recently established is
the opening of a WEC led by surgeons, reconstructive surgeons and dermatologists.

3
1.3 Methodology
The problem that we are going to solve is a knowledge problem. A knowledge problem
can be described as a situation in which you want to know something. Heerkens (1999)
stated that a problem statement contains a description of the variable and of the
research population. The knowledge problem of this research is a descriptive problem
because we want to obtain one or more values. The descriptive problem of this master
assignment is ‘What are the average total costs of treatment for patients who had been
treated at the Wound Expertise Centre at the Isala clinics in Zwolle?’. The total costs
consist of costs associated with MSVT and medical aids used during home care.
One well-known method to solve a knowledge problem is the research cycle. This cycle
consists of the following phases (Heerkens, 1999):
Investigating the research goal.
Defining the problem statement.
Defining the research questions.
Defining the research design.
Operationalize.
Gathering of data.
Processing the data.
Drawing of conclusions (answering of the problem statement).
Due to time constraints we set different priorities for solving the sub questions. Our
biggest challenge is to accurately determine the average costs of MSVT and medical HLP
used during home care. We determine these two cost items together as the total costs of
treatment. On the other hand, answering the other sub questions is important to review
the current problem of the enormous costs critically.
The main research question is the problem statement of the knowledge problem and it is
defined as:
What are the average total costs of treatment for patients who had been treated at the
Wound Expertise Centre at the Isala clinics in Zwolle?
A few sub questions are defined below in order to answer the main research question. To
understand the importance of efficient wound care it is important to gain more
knowledge about chronic wounds in general. Thus the first research questions focus on
the healing process, the definition of a chronic wound and how it affects the patient’s
quality of life. We answer these questions by conducting a literature research.

4
Research Question 1: What are the different phases of a normal wound healing process?
Research Question 2: What is the definition of a chronic wound?
In order that we ensure a full understanding of the impact of cost-effective wound care it
is important to gain knowledge about the prevalence, organization of care, and the costs
involved with treatment of chronic wounds. In addition, we conduct a literature research
about previously conducted costs analyses of WECs in the Netherlands. This provides us
information how to perform a cost analysis and which costs to include. In addition, it
gives an overview of previously estimated costs and (potential) savings of wound care in
the Netherlands.
Research Question 3: What is the total prevalence of chronic wounds in the Netherlands?
Research Question 4: What is the current situation of the organization of wound care in
the Netherlands?
Research Question 5: What are the average costs of (chronic) wound care at this moment
in the Netherlands?
Research Question 6: How have previous cost analyses of chronic wound care in the
Netherlands been conducted?
Answering these general research questions is important because it gives full
understanding about the importance of a good and cost-effective wound care
organization. So, Research Questions 1-6 form the background for our research.
Now that all general research questions have been defined, the next step is to focus on
the WEC at the Isala clinics in Zwolle. Therefore, it is important to obtain information
about the organization of care at this WEC. Excen is an organization that facilitates more
than forty WECs in the Netherlands, including the WEC at the Isala clinics. In addition, the
company provides advice how to obtain specialized and organized wound care (Excen,
2017).
Research Question 7: What is the current organization of wound care at the Isala clinics in
Zwolle?
Research Question 8: What are the average costs of specialized medical home care
[Medisch Specialistische Verpleging in de Thuissituatie (MSVT)] provided by QualityZorg
for patients of the Wound Expertise Centre at the Isala clinics in Zwolle?
Research Question 9: What are the average costs of medical aids [Hulpmiddelen (HLP)]
used during home care for patients of the Wound Expertise Centre at the Isala clinics in
Zwolle?

5
1.4 Remainder of the report
Chapter 2 outlines the literature research and the background to the research problem. In
addition, this chapter critically assess the existing literature on previous conducted cost
analyses. We discuss the data gathered and we outline the results of our cost analysis in
Chapter 3. In Chapter 4 we provide the overall conclusion as the interpretation of the
results, the discussion and we provide recommendations for further cost analyses of
chronic wounds.

6
Literature research

7
2. Literature research
In this chapter we give an overview of the wound healing process, the definition of a
(chronic) wound, and their prevalence rate in the Netherlands. Sections 2.1 and 2.2
provide general information about (chronic) wounds and the healing processes. Their
prevalence rates are summarized in Section 2.3. Furthermore, in Section 2.4 we present
the organizational structure of wound care in the Netherlands, and Section 2.5 presents
the current costs related to wound care. In Section 2.6 we describe the two previous cost
analyses that have been conducted the Netherlands. Finally, in Section 2.8 we introduce
the bootstrap method that is used to analyse our data gathered.
2.1 Wound healing process
The skin is the largest organ of the human body and functions as a protective barrier
against harmful external environmental factors. Therefore, damaged tissue must be
restored properly and efficiently (Na et al., 2017). A wound is a breakdown of this
protective barrier with or without loss of underlying connective tissue. Injuries can be
caused by traumas, burns, animal bites or stings, connective tissues disorders, metabolic
disease, psychosocial disorders, and nutritional deficiencies (Shankar et al., 2014).
The wound healing process consists of three different and overlapping phases:
inflammatory reaction, proliferation and remodelling (Flanagan, 2000; Van Mierlo- van
den Broek & De Laat, 2012). The inflammatory reaction is subdivided into haemostasis
and inflammation. Haemostasis is the first step of the healing process and it is the body’s
natural response to an injury (Li et al., 2007). Blood vessels in the wound contract and this
result in a decreased or restricted flow of blood, and blood loss will be minimized. Once
haemostasis is achieved, blood vessels in the wound bed dilate to allow essential cells to
reach the damaged tissue (Shankar et al., 2014). The function of the inflammation phase
is to break down and remove the blood clot, cellular debris and microorganisms. In
addition, it prepares the growth of new tissue (Flanagan, 2000). Subsequently, the
proliferation starts. It’s main function is to create a permeability barrier and to establish
an appropriate blood supply (Flanagan, 2000; Li et al., 2007; Van Mierlo- van den Broek &
De Laat, 2012).

8
Remodelling is the last part of this complex process and starts when new tissue within the
wound bed is formed. The focus of remodelling is to restore tissue structural integrity and
functional competence (Li et al., 2007). The tissue function and its shape is restored and
new tissue slowly gains flexibility and strength (Van Mierlo- van den Broek & De Laat,
2012).
The healing process is called uncomplicated if all phases are completed without problems,
recovery is within a certain duration, and if the anatomical and functional structure is
restored (Van Mierlo- van den Broek & De Laat, 2012). However, healing can be affected
by different factors. The European Wound Management Association composed an
overview of four different categories of indicators that affect this process (European
Wound Management Association, 2008):
Patient-related factors.
Wound-related factors.
Professional-related factors.
Resources and treatment-related factors.
The patient-related factors composed by the European Wound Management association
are subdivided into physical, psychological and social factors (European Wound
Management Association, 2008). Examples of physical factors are obesity, general health,
malnutrition, and ageing (European Wound Management Association, 2008; Flanagan,
2000). Psychological and social factors are for example social isolation, economic status,
depression, psychosis, profession, and pain experience (European Wound Management
Association, 2008; Van Mierlo- van den Broek & De Laat, 2012). The European Wound
Management Associated (2008) defines under the wound-related factors specific
characteristics that affect the complexity of the healing process. For example the wound
diagnosis, size and depth, wound bed condition, presence of an infection or
inflammation, and ischemia. In addition, professional-related factors are related to the
knowledge and skills of disciplines who are involved with the patient’s treatment. At last,
the organization of care and the provision of training are covered by the resources and
treatment-related factors.
2.2 Definition chronic wound
The Dutch National Health Care Institute [Zorginstituut Nederland (ZIN)] defines a chronic
wound as follows ‘A chronic wound is a wound with an impaired healing tendency as a
result of pathophysiological factors’ (Dutch National Health Care Institute, 2013, p9). The
healing process is delayed and incomplete, resulting in a poor functional and anatomical
outcome of the injured skin (Graves & Zheng, 2014).
9
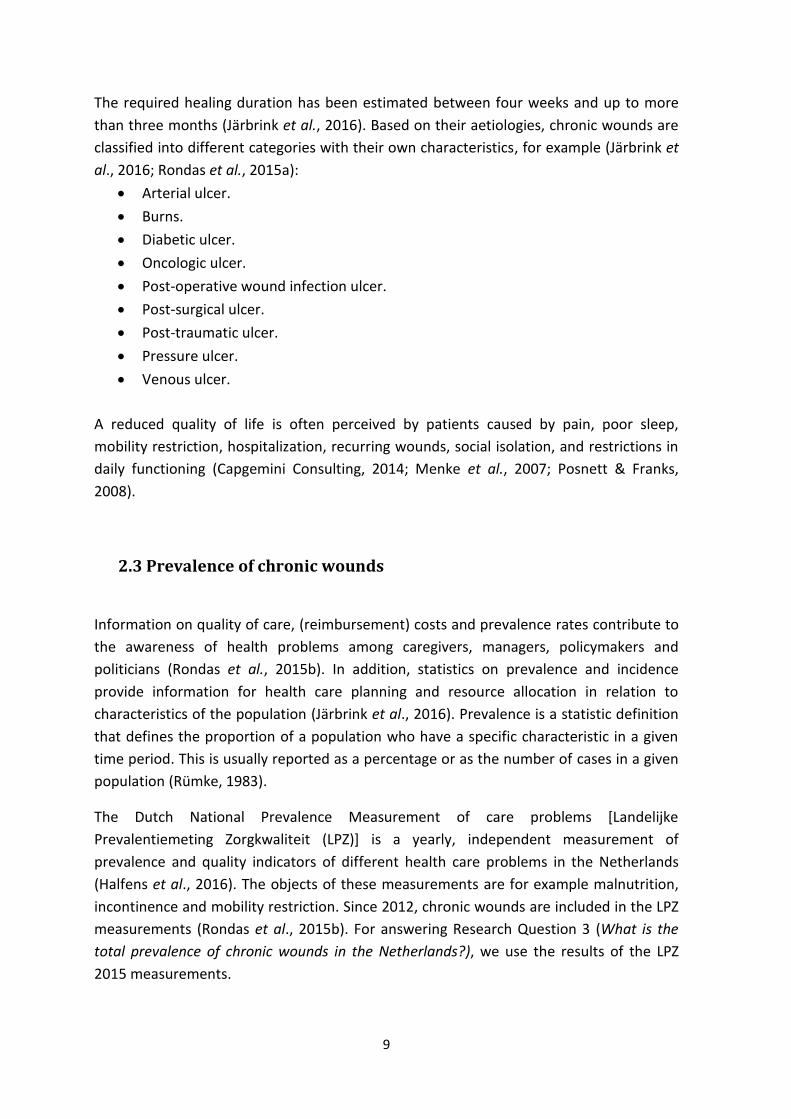
The required healing duration has been estimated between four weeks and up to more
than three months (Järbrink et al., 2016). Based on their aetiologies, chronic wounds are
classified into different categories with their own characteristics, for example (Järbrink et
al., 2016; Rondas et al., 2015a):
Arterial ulcer.
Burns.
Diabetic ulcer.
Oncologic ulcer.
Post-operative wound infection ulcer.
Post-surgical ulcer.
Post-traumatic ulcer.
Pressure ulcer.
Venous ulcer.
A reduced quality of life is often perceived by patients caused by pain, poor sleep,
mobility restriction, hospitalization, recurring wounds, social isolation, and restrictions in
daily functioning (Capgemini Consulting, 2014; Menke et al., 2007; Posnett & Franks,
2008).
2.3 Prevalence of chronic wounds
Information on quality of care, (reimbursement) costs and prevalence rates contribute to
the awareness of health problems among caregivers, managers, policymakers and
politicians (Rondas et al., 2015b). In addition, statistics on prevalence and incidence
provide information for health care planning and resource allocation in relation to
characteristics of the population (Järbrink et al., 2016). Prevalence is a statistic definition
that defines the proportion of a population who have a specific characteristic in a given
time period. This is usually reported as a percentage or as the number of cases in a given
population (Rümke, 1983).
The Dutch National Prevalence Measurement of care problems [Landelijke
Prevalentiemeting Zorgkwaliteit (LPZ)] is a yearly, independent measurement of
prevalence and quality indicators of different health care problems in the Netherlands
(Halfens et al., 2016). The objects of these measurements are for example malnutrition,
incontinence and mobility restriction. Since 2012, chronic wounds are included in the LPZ
measurements (Rondas et al., 2015b). For answering Research Question 3 (What is the
total prevalence of chronic wounds in the Netherlands?), we use the results of the LPZ
2015 measurements.
10
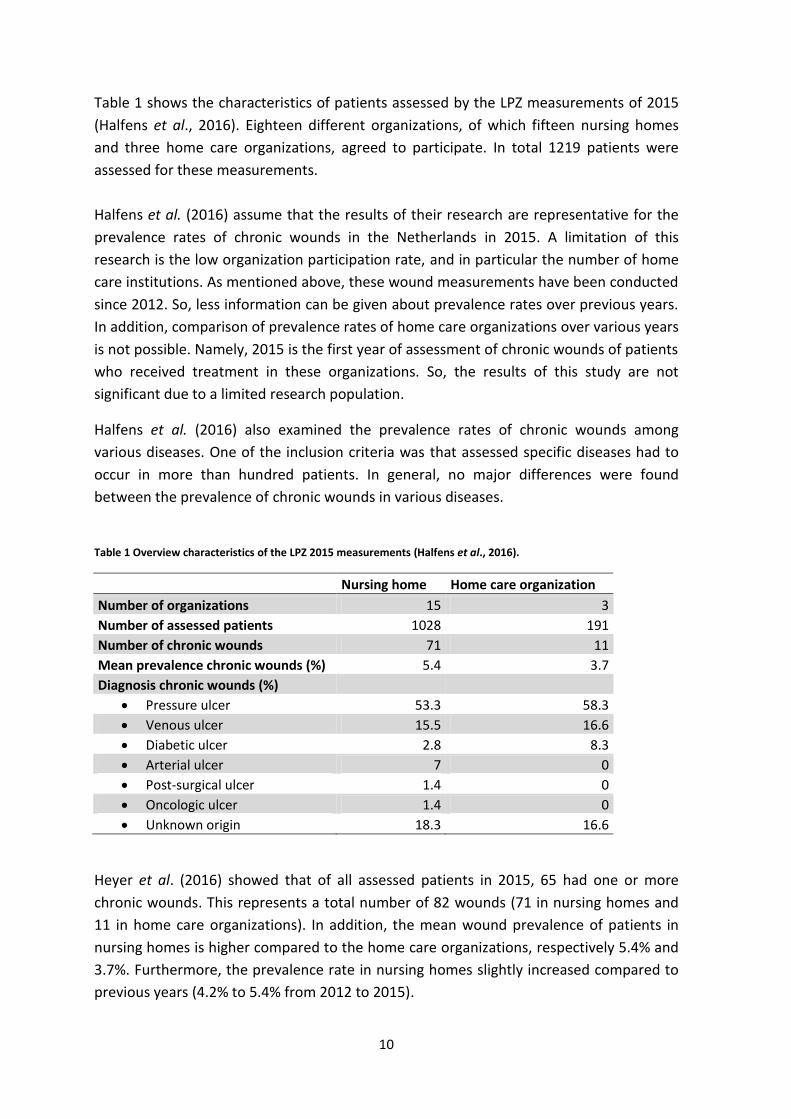
Table 1 shows the characteristics of patients assessed by the LPZ measurements of 2015
(Halfens et al., 2016). Eighteen different organizations, of which fifteen nursing homes
and three home care organizations, agreed to participate. In total 1219 patients were
assessed for these measurements.
Halfens et al. (2016) assume that the results of their research are representative for the
prevalence rates of chronic wounds in the Netherlands in 2015. A limitation of this
research is the low organization participation rate, and in particular the number of home
care institutions. As mentioned above, these wound measurements have been conducted
since 2012. So, less information can be given about prevalence rates over previous years.
In addition, comparison of prevalence rates of home care organizations over various years
is not possible. Namely, 2015 is the first year of assessment of chronic wounds of patients
who received treatment in these organizations. So, the results of this study are not
significant due to a limited research population.
Halfens et al. (2016) also examined the prevalence rates of chronic wounds among
various diseases. One of the inclusion criteria was that assessed specific diseases had to
occur in more than hundred patients. In general, no major differences were found
between the prevalence of chronic wounds in various diseases.
Table 1 Overview characteristics of the LPZ 2015 measurements (Halfens et al., 2016).
Nursing home Home care organization
Number of organizations 15 3
Number of assessed patients 1028 191
Number of chronic wounds 71 11
Mean prevalence chronic wounds (%) 5.4 3.7
Diagnosis chronic wounds (%) Pressure ulcer 53.3 58.3
Venous ulcer 15.5 16.6
Diabetic ulcer 2.8 8.3
Arterial ulcer 7 0
Post-surgical ulcer 1.4 0
Oncologic ulcer 1.4 0
Unknown origin 18.3 16.6
Heyer et al. (2016) showed that of all assessed patients in 2015, 65 had one or more
chronic wounds. This represents a total number of 82 wounds (71 in nursing homes and
11 in home care organizations). In addition, the mean wound prevalence of patients in
nursing homes is higher compared to the home care organizations, respectively 5.4% and
3.7%. Furthermore, the prevalence rate in nursing homes slightly increased compared to
previous years (4.2% to 5.4% from 2012 to 2015).

11
Posnett & Franks (2008) stated that rising of prevalence is explained by ageing of the
population, demographic changes, and an increased risk of diseases such as diabetes
mellitus, obesity and cardiovascular diseases.
Figure 1 shows an overview of the prevalence of different types of wounds compared to
the total number of wounds of the LPZ measurements in 2015 (Halfens et al., 2016). As
shown in Figure 1, the most common types of wounds were pressure ulcers followed by
venous ulcers. Only four out of seven types of wounds were discovered in patients who
received home care. The arterial ulcer, the post-surgical ulcer and the oncologic ulcer
occurred only in patients who received treatment in nursing homes. However, the
diagnosis is unknown in one out of six wounds. The researchers stated that the most
chronic wounds occurred on the tailbone, heels and ankles. This is logical because the
pressure ulcer is the most frequently diagnosed wound of the LPZ 2015 measurements.
Figure 1 Prevalence of different chronic type of wounds in the Netherlands in 2015 (Halfens et al., 2016).
0
10
20
30
40
50
60
70
Number of diagnosed wounds
(%) Nursing home
Home care organization
12
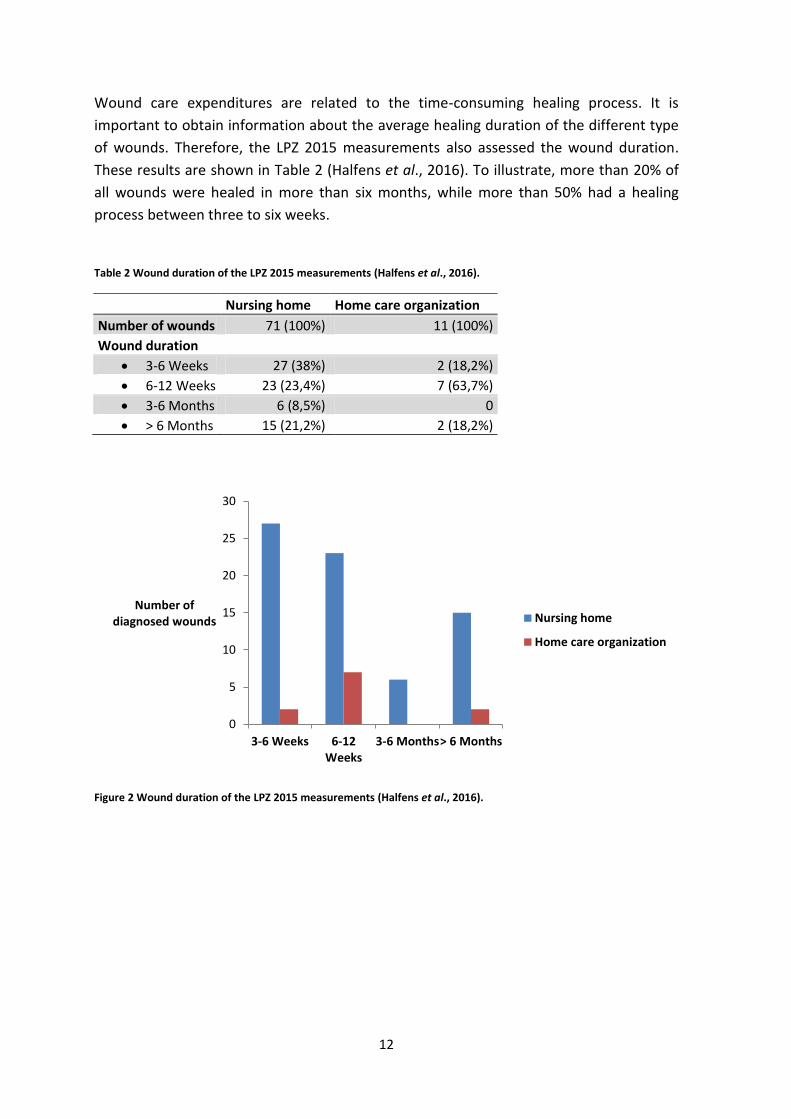
Wound care expenditures are related to the time-consuming healing process. It is
important to obtain information about the average healing duration of the different type
of wounds. Therefore, the LPZ 2015 measurements also assessed the wound duration.
These results are shown in Table 2 (Halfens et al., 2016). To illustrate, more than 20% of
all wounds were healed in more than six months, while more than 50% had a healing
process between three to six weeks.
Table 2 Wound duration of the LPZ 2015 measurements (Halfens et al., 2016).
Nursing home Home care organization
Number of wounds 71 (100%) 11 (100%)
Wound duration 3-6 Weeks 27 (38%) 2 (18,2%)
6-12 Weeks 23 (23,4%) 7 (63,7%)
3-6 Months 6 (8,5%) 0
> 6 Months 15 (21,2%) 2 (18,2%)
Figure 2 Wound duration of the LPZ 2015 measurements (Halfens et al., 2016).
0
5
10
15
20
25
30
3-6 Weeks 6-12Weeks
3-6 Months> 6 Months
Number of diagnosed wounds Nursing home
Home care organization
13
2.4 Wound care in the Netherlands
Section 2.4 provides information about the organization of wound care in the
Netherlands. At first, Section 2.4.1 defines the organization related to these treatments in
general. Disadvantages and deficiencies are also prescribed. Subsequently, in Section
2.4.2 we describe the idea of a wound expertise centre (WEC).
2.4.1 Organization of wound care
Rondas et al. (2015a) mentioned that wound care is given in (long-term) health
institutions, secondary care and in the community. In addition, treatment of these
patients involves different health care disciplines, for example the general practitioner,
(vascular/reconstructive) surgeons, dermatologists, nurse practitioner, wound consultant,
paramedic, elderly care specialist, pharmacist, or caregiver. However, the composition of
this multidisciplinary team depends on the diagnosis and severity of the wound.
Usually, a patient with a (chronic) wound visits the general practitioner and is treated by
home care nurses. An important downside of this approach is that many patients receive
this type of treatment for more than thirty weeks before they are referred to a medical
specialist at the hospital. So, the organization of wound care is multi-professional, multi-
disciplinary and transmural. Therefore, coordination and communication are very
important aspects to enhance quality and efficiency of care (Kenniscentrum Wondzorg,
2017).
Often insufficient and inefficient communication occurs across the health care pathway of
a patient (Van Mierlo- van den Broek & De Laat, 2012). A delay in the healing process
often occurs, with even hospitalization as a result. This results in more burdens for a
patient and reduces quality of life (Quataert, 2012). However, a delayed healing process
does not only affect the physical and psychological condition of a patient. It involves
enormous costs as well (Van Mierlo- van den Broek & De Laat, 2012). Graves & Zheng
(2014) have investigated possibilities in the organization of care that will lead to an
improvement of quality of care, and to a reduction of costs. This research stated that the
implementation of multidisciplinary teams, specialized nurses, control and guidance of
patients result in an improved quality of care, shorter healing process, and a reduction of
costs.

14
2.4.2 Wound expertise centre
In the 1990s, the United Kingdom founded specialized leg ulcer clinics within their
community (Moffatt et al., 1992). Different studies investigated the impact of these clinics
on healing duration, cost-effectiveness and quality of care (Gottrup et al., 2001; Moffatt
et al., 1992). Conclusions drawn from these studies are that treatment of patients at
these clinics increase healing rates, improve efficiency of care, and reduce costs regarding
wound care (Harrison et al., 2005; Moffatt et al., 1992).
Mierlo-van den Broek & De Laat (2012) analysed the Dutch wound care organization. One
of their conclusions is that the organization in the Netherlands is ineffective, fragmented
and has a lack of standardization. They recommend the implementation of an innovative
organization structure of chronic wound care in the Netherlands, which focus on the
possibility of a quick patient’s referral to a WEC, or to a wound care specialist team. In
addition, quick referral leads to a faster healing process, fewer burdens for patients and a
higher patient satisfaction. Consequently, the researchers expect a reduction of costs
regarding wound care in the Netherlands.
The positive research results of the cost-effectiveness of leg ulcer clinics in the United
Kingdom, and the exploration of the Dutch wound care organization by Mierlo-van den
Broek & De Laat, have led to the establishment of WECs in the Netherlands in the past
years (Quataert, 2012). Capgemini consulting (2014) mentioned that differences in the
organization’s structure and the anchoring of care are seen between various WECs in the
Netherlands. A number of WECs is connected to institutions for medical specialized care
and others are positioned outside these institutions. However, each WEC has to fulfil
specific and important agreements registered in quality indicators for chronic wound
care, for example:
The WEC should consist of a multidisciplinary collaboration between various
disciplines.
Specialized wound care nurses should be involved in the treatment of (chronic)
wounds.
The WEC should provide a plan for triage and case management, which are
practical means of sorting patients according to severity.
The stimulation of expertise enhancing and the work with protocols by health care
providers in the region.

15
2.5 Costs of chronic wound care
This section provides more information about the costs of chronic wound care. Section
2.5.1 defines the organization of the Dutch health insurance system. So, the four different
basic laws regarding health care are explained. Section 2.5.2 provides information about
the expenses related to wound treatment nationally and internationally.
2.5.1 Dutch health insurance system
The Dutch health insurance system consists of public and private insurances and is
regulated by four different basic laws (Ministerie of VWS, 2016):
Health Insurance Act [Zorgverzerkeringswet (Zvw)].
Long-Term Act [Wet langdurige zorg (Wlz)].
Social Support Act [Wet maatschappelijke ondersteuning (Wmo)].
Youth Act [Jeugdwet] (Ministerie of VWS, 2016).
Wound care is funded by the Zvw and the Wlz (Van Mierlo- van den Broek & De Laat,
2012). The Zvw consists of the basic health insurance, which is obligatory for the Dutch
population. This insurance covers costs associated by essential curative care provided by
the general practitioner or the medical specialist, hospitalization of patients, used
medications and medical aids, or ambulance support. In 2015, the WLZ replaced the
Exceptional Medical Expenses Act [Algemene Wet Bijzondere Ziektekosten]. The Wlz
provides financing for long-term expensive home care, and institutional care (Ministerie
of VWS, 2016; Rondas et al., 2015a). Local authorities are primarily responsible of the
Wmo. The Wmo provides support to people who are struggling to be a part of the Dutch
society, for example people with learning, physical, mental, or psychological disabilities.
The Youth Act provides support for families with children, up to 18 years old, who cope
with development and psychological disorders (Ministerie of VWS, 2016).

16
2.5.2 Costs of chronic wound care
No large-scale, population based studies have been conducted to examine the health care
expenditures related to the treatment of chronic wounds in the Netherlands. It is hard to
accurately examine expenditures of these treatments, because they are divided across
different cost categories. For example, costs of medical consultations with health
professionals, hospitalization, home care, and the use of medication, medical devices and
wound dressings etc.
However, it is known that the treatment of chronic wounds is an enormous drain on
health care resources. The expenditures consist mainly of costs regarding hospitalization,
delay in hospital admission, or delay in hospital discharge (Gruen et al., 1996). This cost
burden does not only affect the Netherlands, it is a public health issue across the world
(Harding & Queen, 2010). Gottrup et al. (2001) estimated the worldwide prevalence of
these wounds at 1%. In addition, costs associated with these treatments are estimated
between 2% to 4% of the total health care expenditures in 2001. Sen et al. (2009) expect
that expenditures in wound care will rapidly grow, because of the ageing of the
population and the increasing incidence rate of for example diabetic mellitus.
Since 2011, it has been possible to determine out of health insurance declarations
whether a patient used dressings for the treatment of a chronic or a regular wound. Costs
of dressings used for the treatment of chronic wounds are reimbursed by the Zvw. On the
other hand, dressings used for the treatment of regular wounds have to be paid by the
patient (Capgemini Consulting, 2014). The costs for used wound dressings were estimated
at € 83 million in the Netherlands for the year 2015 (Zorginstituut Nederland, 2015).
2.6 Previous conducted cost analyses of wound care centres in the
Netherlands
Two different cost analyses have been conducted to determine the differences in
(wound) care expenditures after the implementation of the WECs in the Netherlands.
Section 2.6 outlines these two different cost analyses and describes their methods, results
and conclusions. Section 2.6.1 focuses on the analysis conducted by Rondas in 2015.
Section 2.6.2 focuses on the analysis conducted by Capgemini Consulting between 2013
and 2014.
17
2.6.1 Cost analysis of the Knowledge Centre in Wound care at Venray
The Knowledge Centre in Wound Care (KCWC) is one of the first specialized community-
based outpatient wound care clinics in the Netherlands. This KCWC is located at Venray
and was founded in 2009. A patient’s health care pathway consists of regular
appointments at the KCWC and home care visits by specialized nurses. The aim of this
study is to determine the differences in costs between the year before a patient’s initial
visit to the KCWC and the year following this consultation (Rondas et al., 2015a).
Rondas et al. (2015a) assessed the costs of 172 patients, who all had their initial
consultation at the KCWC between 15 September 2009 and 15 September 2010. These
patients were all insured at the Dutch health insurance company VGZ.
This study only included reimbursement costs that were qualified under the Zvw. They
subdivided those expenditures into four different categories (Rondas et al., 2015a):
Costs related to contact with health care professionals, such as the general
practitioner, the medical specialist and the paramedic.
Costs associated with medications used.
Costs associated with the use of medical devices (costs for wound dressings were
taken separately).
Costs associated with hospitalization of patients.
Rondas et al. (2015a) mentioned that cost data usually have a skewed distribution and it
might be difficult to provide accurate comparisons and inferences. Therefore, the
researchers used the non-parametric bootstrap method to estimate the mean and
median reimbursed costs. All diagnosed wounds have been included in this cost analysis,
even when the research population was very small (for example a population that only
consist of two patients). The researchers replicated 1000 bootstrap samples. The 95%-CI
was calculated using the percentile method and was based on the 2.5th and 97.5th
percentile. Section 2.8 of our report describes the bootstrap method more in detail.
Rondas et al. (2015a) also estimated costs of wound care treatment for the most
probable estimation of the case, which was called the base case analysis. The base case
analysis consisted of five home care nurse visits per week per patient, and one outpatient
visit to the KCWC per week per patient. However, the frequency of home care visits had
to be estimated because costs reimbursed under the Exceptional Medical Expenses Act
were not available for this research. Besides this base case analysis, several sensitivity
analyses were conducted to determine the likely impact of different values of variables.
18
The sensitivity analyses are as follows (Rondas et al., 2015a):
The first sensitivity analysis: The researchers determined the influence of different
frequencies of home care visits on the total wound care expenditures. So, they
calculated the total costs for one and for thirteen home care visits per week per
patient.
The second sensitivity analysis: The researchers were interested in the impact of
different wound durations on the difference in costs between the two years.
Therefore, the research population was subdivided into two groups. The first
group of patients had a healing duration of less than 75 days, and the second
group had a duration that lasted longer.
The third sensitivity analysis: The researchers determined the effect of expensive
wound dressings on the outcome of expenditures between the two years. This
particular analysis consisted of two different parts. Firstly, the researchers
pinpoint all patients whose dressings cost more than €5,000.00 (n=10). The
dressing costs of these ten patients were replaced by the calculated median
dressing costs of all patients, which was €1,689.00. Secondly, patients whose
dressings cost more than €5,000.00 (n=10) were excluded for the calculations.
Subsequently, the researchers performed a subgroup analysis to determine the difference
in reimbursement costs of different types of wounds between the two years. The most
common types of wounds were selected for this analysis, namely the leg ulcers, the
pressure ulcers and the diabetic ulcers.
Rondas et al. (2015a) calculated the arithmetic and bootstrapped costs for the base case
analysis for the year before admission to the KCWC, and the year after this initial visit.
The results of these calculations are given in terms of mean, median and standard
deviation (SD). Table 3 shows the calculated arithmetic and bootstrapped costs per
patient for the year before admission. Next, Table 4 shows the results per patient for the
year after admission to the KCWC. The mean and median arithmetic reimbursement costs
are calculated based on the population. Thus, the SD of the arithmetic mean
reimbursement costs is also based on the wound treatment costs of the population. The
mean and median bootstrapped reimbursement costs are calculated based on the
outcomes of the created 1000 bootstrap samples using the non-parametric bootstrap
method, as well the bootstrapped SD. As shown in these tables, the calculated mean
bootstrapped costs per patient were respectively € 23,226.00 and € 20,693.00. These
costs are calculated based on the means of 1000 bootstrap samples. The researchers
showed a decrease in total bootstrapped mean costs of 9% if patients received treatment
at the KCWC. In reality, this decrease in costs might by greater. The researchers assumed
that the expenditures for home care visits in the year before a patient’s initial visit were
zero. However, these patients might receive home care visits by specialized nurses for
wound dressing changes.

19
This assumption has been made because of the inability of the inclusion of cost related
data other than those qualified under the Zvw. As mentioned above, reimbursement
costs qualified under the Wlz were not included in this cost analysis.
Table 3 Arithmetic and bootstrapped costs per patient of the year before admission to the KCWC (Rondas et al., 2015a).
Arithmetic reimbursement costs Bootstrapped reimbursement costs
Mean(SD) Median Mean (SD) Median € 23,283.00 € 10,940.00 € 23,226.00 € 23,238.00 (€ 32,441.00) (€ 2,469.00)
Table 4 Arithmetic and bootstrapped costs per patient of the year after admission to the KCWC (Rondas et al., 2015a).
Arithmetic reimbursement costs Bootstrapped reimbursement costs
Mean (SD) Median Mean (SD) Median € 18,712.00 € 8,777.00 € 20,693.00 € 20,612.00 (€ 25,911.00)
(€ 1,973.00)
Rondas et al. (2015a) performed different sensitivity and subgroup analyses, there results
are shown in Table 5. For these analyses, the researchers also used the non-parametric
bootstrap approach to calculate the differences in reimbursement costs between the two
years. The results given in Table 5 are the differences in costs per patient per year if a
patients received treatment at the KCWC. As shown in Table 5, even if home care visits
were estimated at thirteen visits per week per patient, the reimbursement costs were still
lower if patient received wound treatment at the KCWC. In addition, another conclusion
is that the cost reduction in reimbursement costs is higher for patients whose wound
treatment lasted longer than 75 days, compared to a shorter healing duration. The
subgroup analysis showed a reduction in reimbursement costs if patients with pressure
ulcers or diabetic ulcers received wound treatment at the KCWC. However, an increase in
expenses associated with the treatment of patients with leg ulcers is noticed in the year
after admission to the KCWC.
20
However, the research of Rondas et al. (2015a) shows remarkable results. Shown in Table
5, the bootstrapped means of two different analyses lie outside the ranges of the CI. This
occurs with the 95%-CI of the first sensitivity analysis if a patient receives thirteen home
care visits per week, and with the pressure ulcer subgroup analysis. Another remarkable
result is that the calculated bootstrapped mean is often not located in the middle of the
CI range For example, the range of the CI of chronic wounds that last longer than 75 days
is between the € - 11,410.00 and € 5,945.00. However, the mean is calculated at €
2,805.00. Similarly, this can also be seen in the results of wounds that are cured within 75
days, in the results of the first part of the third sensitivity analysis, and in the subgroup
analyses of the pressure and diabetic ulcer. Because of these remarkable findings we
cannot interpret the results of this cost analysis.
Table 5 Results sensitivity analyses of Rondas’ cost analysis (Rondas et al., 2015a).
Bootstrapped mean reimbursement cost
differences
95%-Bootstrapped CI of cost differences in reimbursement
mean costs
First sensitivity analysis 1 Home care visit per
week € 4,134.00 (€ 1,764.00, € 10,198.00)
13 Home care visits per week € 1,025.00 ( € 5,172.00, € 7,692.00)
Second sensitivity analysis Wound duration >
75 days € 2,805.00 (€ - 11,410.00, € 5,945.00)
Wound duration < 75 days € 1,816.00 (€ -10,973.00,€ 6,661.00)
Third sensitivity analysis Replacement by
median dressing costs € 134.00 (€- 737.00,€ 250.00)
Exclusion of 10 patients € -18.00 (€- 215.00,€ 240.00)
Subgroup analysis Pressure ulcer € 8,789.00 (€- 19,333.00,€ 2,212.00)
Diabetic ulcer € 2,152.00 (€- 10,683.00,€ 7,228.00)
Leg ulcer € -1,458.00 (€- 7,645.00,€ 9,533.00)

21
2.6.2 Cost analysis conducted by Capgemini Consulting
On behalf of the Dutch Healthcare Authority, Capgemini Consulting investigated the
possible (potential) savings related to innovative wound care. This study has been
conducted from November 2013 till March 2014 and consisted of two different parts,
namely (Capgemini Consulting, 2014):
Cost-benefit analysis: The researchers determined the difference in costs and
benefits between patients who are treated regularly or innovatively.
The prospective analysis: This part estimated the potential savings related to
innovative wound care that can be expected between 2015 and 2025.
Capgemini Consulting (2014) mentioned that this innovative approach contains wound
care that is delivered in WECs, in which they fulfilled the quality indicators set up by the
Dutch Health Care Inspectorate. In the regular situation, a part of home care is being
provided by home care nurses and the other part is the patient’s or caregiver’s
responsibility. To determine the average costs regarding to innovative wound care the
researchers obtained data from two different experiments. The first experiment was
performed by Mitralis Expertise Centre in Wound care and the second one by the
Knowledge Centre in Wound Care of Zorggroep. The data obtained for this research
gained insight in the patient’s gender and age, the type of wound, the healing duration,
the number of clinic visits, the total costs of all clinic visits, the costs of used wound
dressings, and the total wound care expenditures. In addition, the researchers obtained
data provided by Dutch health care insurances of patients who received regularly wound
care.
The available data for the research conducted by Capgemini Consulting (2014) provided
the ability to conduct a cost-benefit analysis, where expected costs were weighted
against the expected benefits of innovative wound care. The wound expenses per patient
were calculated based on the amount of weeks which the patients received treatment,
multiplied by the average number of weekly medical consultations, multiplied by the rate
per consultation. The expected net savings per patient were estimated at a minimum of
€1,280.00 if the patient received wound care at a WEC. These savings are mainly due to a
reduction in treatment duration of an average of four weeks.
Capgemini Consulting (2014) also calculated potential savings for the years 2015 to 2025.
The first step of this prospective analysis was the estimation of the total number of
patients who will receive innovative wound care in the future.

22
Therefore, a state transition diagram has been used. In this diagram, the system is
defined as the Dutch population and three different states were distinguished:
State 1: An individual does not receive chronic wound care.
State 2: An individual receives regular wound care.
State 3: An individual receives innovative wound care.
Subsequently, the transition probabilities and the population size of the different states
were calculated based on national wound statistics, such as the incidence rate. The
researchers calculated the potential savings for five different scenarios, with a
differentiation to the implementation rate of innovative care in the Netherlands. The five
different scenarios are as follows (Capgemini Consulting, 2014):
Scenario 1: A minimum yearly growth of approximately 3000 patients with
chronic wounds.
Scenario 2: Twenty per cent of all patients receive innovative wound care
within ten years since 2015.
Scenario 3: Twenty per cent of all patients receive the innovative wound care
within five years since 2015.
Scenario 4: Twenty per cent of all patients receive the innovative wound care
in 2015.
Scenario 5: Maximum of 40% of all patients receive the innovative wound care
in 2015.
Table 6 shows the results of the Capgemini Consulting cost analysis (Capgemini
Consulting, 2014). We take Scenario 3 as an example to better understand the results of
the Capgemini analysis. This scenario assumes that twenty per cent of all patients should
receive innovative wound care within five years. This provides a saving of € 29,434,571.00
in 2015, € 64,654,711.00 in 2020, and € 69,131,890.00 in 2025. Assuming scenario 3, the
total costs that can be saved are estimated at € 653,291,665.00 in the time period
between 2015 and 2025. However, the implementation of WECs in the Netherlands
requires investments. Such as the foundation of new WECs, the refurbishment of WECs,
training of employees, or hiring new staff. The costs of these investments are not
included in these calculations.
Table 6 Results of the cost analysis conducted by Capgemini Consulting (Capgemini Consulting, 2014).
Year Scenario 1 Scenario 2 Scenario 3 Scenario 4 Scenario 5
2015 € 5,248,715.00 € 7,087,690.00 € 29,434,571.00 € 57,375,251.00 € 102,912,264.00
2020 € 14,795,905.00 € 49,489,514.00 € 64,654,711.00 € 63,273,292.00 € 113,494,495.00
2025 € 24,439,035.00 € 68,786,982.00 € 69,131,890.00 € 70,465,774.00 € 126,400,010.00
Total 2015-2025 € 162,790,265.00 € 469,379,431.00 € 653,291,665.00 € 700,062,441.00 € 1,255,718,877.00
23
2.7 Wound expertise centre at the Isala clinics
Our cost analysis focuses on the WEC at the Isala clinics in Zwolle. The main aim of the
involved therapists is to ensure a fast diagnose, a clear treatment structure and an
unambiguous treatment of patients with chronic wounds. Cost-effectiveness is an
important part of the vision of this WEC. That is, patients with chronic wounds should
receive the most efficient treatment at the lowest possible price (Isala, 2016). Referral of
patients to the WEC is done by a general practitioner or medical specialist. A patient’s
health care pathway consists of regular appointments at the WEC combined with home
care visits by nurses of QualityZorg. QualityZorg is a specialized home care organization
with wound treatment as expertise (QualityZorg, 2017). They collaborate closely with
Excen. Excen is an organization that facilitates more than forty wound expertise centres in
the Netherlands, including the WEC at the Isala clinics. Excen provides advice how to
obtain the specialized and organized wound care (Excen, 2017).
The home care nurses of QualityZorg consult intensively with the general practitioner,
and the specialized nurses and specialists from the WEC, about the patient’s treatment,
progress or deterioration. Furthermore, there is a high involvement of therapists in the
patient’s health care pathway due to the multidisciplinary character and their joint
responsibility (Isala, 2016). Communication between disciplines of the multidisciplinary
team is possible by the use of the online integral patient record called ‘PatDoc’.
Information regarding the diagnosis, the treatment, the use of materials, the wound
images, and the appointments are contained in this record (QualityZorg, 2017). So, by
using PatDoc, all involved therapists are informed of the patient’s executed diagnostics
and treatments. In addition, the amounts of medical aids used during home care are
accurately recorded in PatDoc. This ensures a clear overview of the exact use and costs of
dressings per patient (Excen, 2017).
2.8 Bootstrap method
Economic health evaluation is important to obtain information about the allocation of
health care resources. Estimates of the cost of treatments, and the quantities of
resources used by each patient guide health policy decisions. Especially the arithmetic
mean cost for a particular treatment is an important measure in the economic health
analysis (Barber & Thompson, 2000). The definition of the arithmetic mean is the sum of
values of every observation divided by the total number of observations. This equation is
shown in Equation 2.8.1, where N is the total number of observations and whose values
are represented by a1, a2,…, aN.
24
∑
(2.8.1)
The distribution of cost data is usually positively skewed. Positive skewness is often
caused by a minority of patients who utilize large quantities of resources. Another cause
of skewness might be the presence of a specific group of patients with zero or small cost
values (Barber & Thompson, 2000). It is often difficult to provide an accurate estimation
of the arithmetic mean due to a skewed data distribution (Rondas et al., 2015a).
The bootstrap method has been by developed by Efron in 1979. This method can be used
if the sampling distribution of a statistical estimator cannot be defined mathematically
and is therefore unknown (Barber & Thompson, 2000). The bootstrap resampling method
is often used to estimate the CI, but it can also be used to estimate the standard errors,
the variance, and to calibrate hypothesis tests (Dixon, 2001). The basic idea of this
method is to find the bootstrap distribution that approximates the sampling distribution.
This sample should represent the population from which it was originally drawn. It is
important to realize that this method is not a substitute for gathering more data to
improve accuracy of the results (Hesterberg et al., 2003).
Haukoos & Lewis (2005) stated that for a better understanding of the bootstrap method it
is important to gain more knowledge about the different distributions. In statistics there
are two different distributions to consider. The first one is the underlying distribution of
the given data, which is often described as the probability function. This function shows
all values and the probability that each value occurs. The second distribution is the
distribution of the statistic of interest. This distribution shows all possible values of the
estimated statistic of interest that are calculated from a sample of a given population.
Hesterberg et al. (2003) described that the first step of the bootstrap approach is the
creation of new samples, also called bootstrap samples or resamples. Suppose x1, x2, x3,…,
xn are the observations of the original sample, which is drawn randomly from a
population. Their resamples are represented by x1*, x2*, x3*,…,xn*. These resamples are
originated by sampling with replacement of the observations from the original random
sample. Sampling with replacement means that we randomly choose an observation from
the original group and replace it before drawing the next one. Therefore, it is possible
that any observation can be drawn once, more than once, or not at all.
25
The statistic of interest (e.g. the mean) is calculated for each bootstrap sample, which
results in a set of bootstrap values. The empirical distribution of all these values make up
an estimation of the theoretical sampling distribution (Briggs et al., 1997; Tong et al.,
2016). This distribution provides information about skewness, kurtosis, centre and
dispersion of the sampling distribution (Hesterberg et al., 2003).
Barber &Thompson (2000) stated that the number of required resamples depends on the
statistic of interest. They recommend at least 1000 resamples to accurately determine the
bootstrap confidence interval (CI). To calculate the bootstrap standard error between 25
and 200 resamples are required.
One of the advantages of this approach is the avoidance of distributional assumptions
such as normality (Barber & Thompson, 2000). Therefore, this approach does not rely on
assumptions concerning the underlying distribution (Briggs et al.,1997). However, the
only assumption to consider is that the sample distribution is a good approximation of the
population distribution. So, this means that the sample is a good representation of the
population (Barber & Thompson, 2000).

26
Method
27
3. Method
This chapter presents the method of our research. Section 3.1 describes the data
obtained from the Dutch company Excen and it provides information regarding the
different data, which is available of each patient. In Section 3.2 we describe the different
scenarios that we use for the non-parametric bootstrap method. Section 3.3 provides
information regarding the implementation of this method in the program Excel.
3.1 Available data
The main aim of our research is the determination of the average costs of specialized
medical home care [Medisch Specialistische Verpleging in the Thuissituatie (MSVT)] and
the costs of medical aids [Hulpmiddelen (HLP)] used during home care. All assessed
patients received wound treatment at the Wound Expertise Centre (WEC) at the Isala
clinics in Zwolle. In addition, these patients received home care provided by specialized
nurses of QualityZorg.
We obtained data from the company Excen. As mentioned before, Excen facilitates more
than forty WECs in the Netherlands, including the WEC at the Isala clinics in Zwolle. Our
obtained database includes 487 patients who all received wound care at this WEC in the
last couple of years. These patients were insured by different health insurance companies
in the Netherlands.
For each patient the following information is available for our research:
ID: The unique patient’s identification number.
Diagnosis: The aetiology of the wound.
Wnd: The total number of wounds.
Creation: The date on which the MSVT request for a patient is processed.
MSVT Euro: The costs of received MSVT that is claimed on the health insurances.
Unit 5 min: The total number of five minutes units of received MSVT.
Hours: The total number of received MSVT hours that is claimed on the health
insurances.
HLP MSVT: The costs of wound dressing used during home care that is claimed on
the health insurances.
Start: The data on which the patient received MSVT for the first time.
End: The data on which the patients received MSVT for the last time.
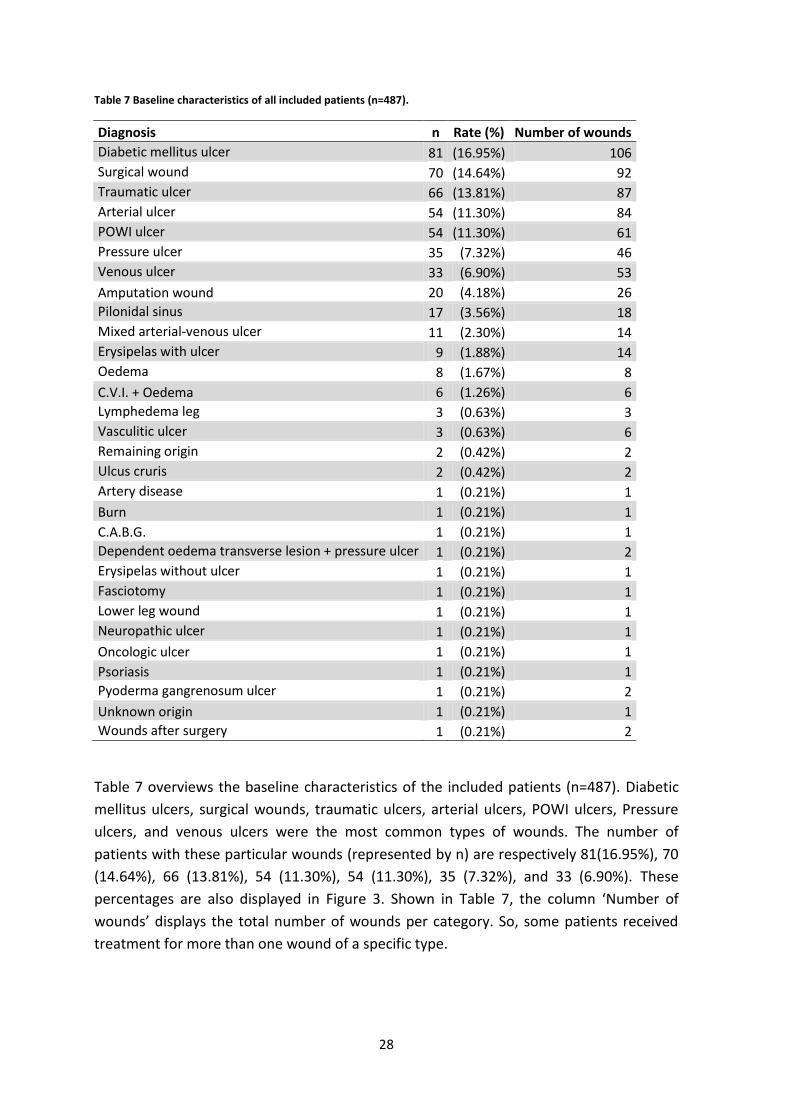
28
Table 7 Baseline characteristics of all included patients (n=487).
Diagnosis n Rate (%) Number of wounds
Diabetic mellitus ulcer 81 (16.95%) 106
Surgical wound 70 (14.64%) 92
Traumatic ulcer 66 (13.81%) 87
Arterial ulcer 54 (11.30%) 84
POWI ulcer 54 (11.30%) 61
Pressure ulcer 35 (7.32%) 46
Venous ulcer 33 (6.90%) 53
Amputation wound 20 (4.18%) 26
Pilonidal sinus 17 (3.56%) 18
Mixed arterial-venous ulcer 11 (2.30%) 14
Erysipelas with ulcer 9 (1.88%) 14
Oedema 8 (1.67%) 8
C.V.I. + Oedema 6 (1.26%) 6
Lymphedema leg 3 (0.63%) 3
Vasculitic ulcer 3 (0.63%) 6
Remaining origin 2 (0.42%) 2
Ulcus cruris 2 (0.42%) 2
Artery disease 1 (0.21%) 1
Burn 1 (0.21%) 1
C.A.B.G. 1 (0.21%) 1
Dependent oedema transverse lesion + pressure ulcer 1 (0.21%) 2
Erysipelas without ulcer 1 (0.21%) 1
Fasciotomy 1 (0.21%) 1
Lower leg wound 1 (0.21%) 1
Neuropathic ulcer 1 (0.21%) 1
Oncologic ulcer 1 (0.21%) 1
Psoriasis 1 (0.21%) 1
Pyoderma gangrenosum ulcer 1 (0.21%) 2
Unknown origin 1 (0.21%) 1
Wounds after surgery 1 (0.21%) 2
Table 7 overviews the baseline characteristics of the included patients (n=487). Diabetic
mellitus ulcers, surgical wounds, traumatic ulcers, arterial ulcers, POWI ulcers, Pressure
ulcers, and venous ulcers were the most common types of wounds. The number of
patients with these particular wounds (represented by n) are respectively 81(16.95%), 70
(14.64%), 66 (13.81%), 54 (11.30%), 54 (11.30%), 35 (7.32%), and 33 (6.90%). These
percentages are also displayed in Figure 3. Shown in Table 7, the column ‘Number of
wounds’ displays the total number of wounds per category. So, some patients received
treatment for more than one wound of a specific type.
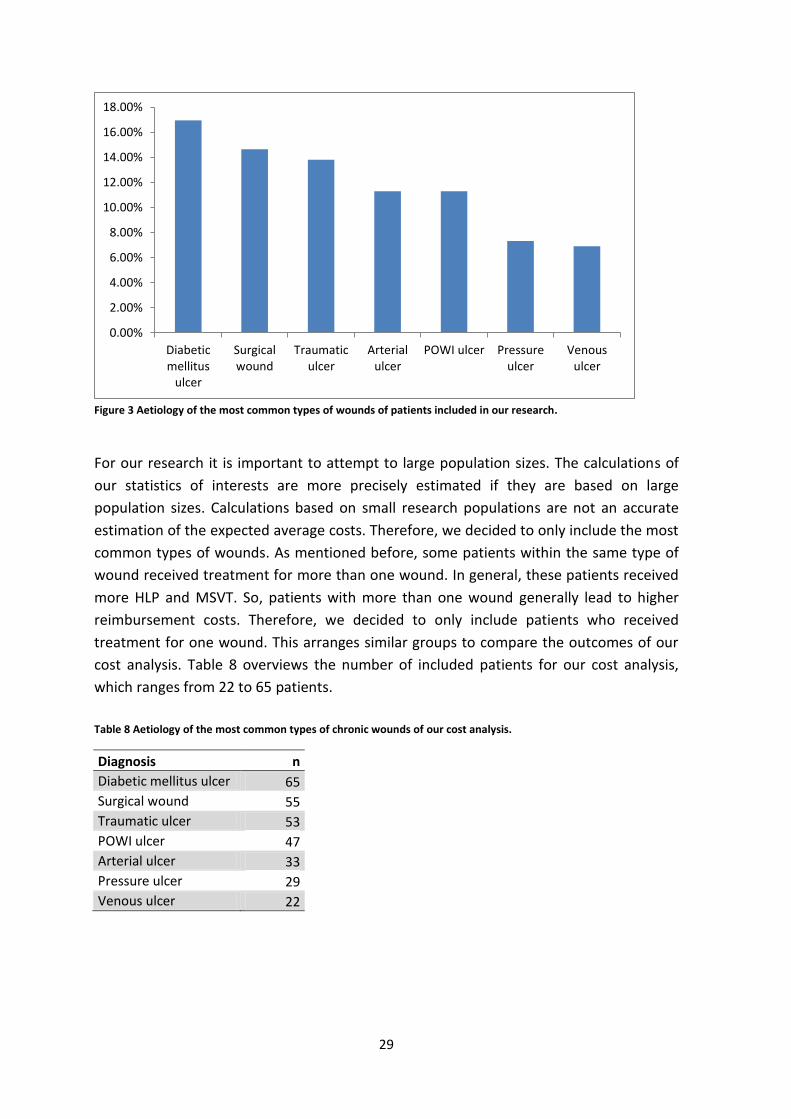
29
Figure 3 Aetiology of the most common types of wounds of patients included in our research.
For our research it is important to attempt to large population sizes. The calculations of
our statistics of interests are more precisely estimated if they are based on large
population sizes. Calculations based on small research populations are not an accurate
estimation of the expected average costs. Therefore, we decided to only include the most
common types of wounds. As mentioned before, some patients within the same type of
wound received treatment for more than one wound. In general, these patients received
more HLP and MSVT. So, patients with more than one wound generally lead to higher
reimbursement costs. Therefore, we decided to only include patients who received
treatment for one wound. This arranges similar groups to compare the outcomes of our
cost analysis. Table 8 overviews the number of included patients for our cost analysis,
which ranges from 22 to 65 patients.
Table 8 Aetiology of the most common types of chronic wounds of our cost analysis.
Diagnosis n
Diabetic mellitus ulcer 65
Surgical wound 55
Traumatic ulcer 53
POWI ulcer 47
Arterial ulcer 33
Pressure ulcer 29
Venous ulcer 22
0.00%
2.00%
4.00%
6.00%
8.00%
10.00%
12.00%
14.00%
16.00%
18.00%
Diabeticmellitus
ulcer
Surgicalwound
Traumaticulcer
Arterialulcer
POWI ulcer Pressureulcer
Venousulcer
30
Each wound type category showed costs outliers, whose treatment of some patients are
even significantly expensive. Hospitals and health insurances should not only determine
their purchasing policies and their budget overview based on the expected costs of the
average patient. They experience problems with the funding of treatment if they do not
take the outliers into account. We are as interested in the dispersion of the distribution
on the right side of the average. Therefore, we decided to include cost data of all selected
patients who received treatment for the most common types of chronic wounds. So, the
impact of cost outliers is included in the calculations of the statistics of interest.
3.2 Sample size scenarios
For each type of wound we estimate the mean, the standard deviation (SD) and the 95%
confidence interval (CI). For each patient the costs of treatment are subdivided into three
categories, namely:
Total costs: The sum of MSVT costs and HLP costs.
MSVT costs: The costs of MSVT. These costs are determined based on the hours
received MSVT multiplied by the rate per hour.
HLP costs: The costs for medical aids used during home care. These expenses are
calculated by the number of used aids multiplied by their unit prices.
The data obtained is limited because the number of included patients per type of wound
ranges from 22 to 65. As mentioned before, cost data is usually skewed and has many
outliers. We conduct a literature research to get an idea of possibilities how to carry out a
cost analysis if the research population is limited, and if the underlying distribution is
unknown. Our literature research showed that the non-parametric bootstrap method
offers a possible solution to these problems.
For our cost analysis we use the non-parametric bootstrap method. This contains that we
created for every scenario 1000 bootstrap samples, drawn by sampling with replacement
from the population of the corresponding type of wound. The different scenarios are as
follow:
Scenario I: The sample size of each bootstrap sample is equal to eleven.
Scenario II: The sample size of each bootstrap sample is equal to ¼ part of the
population of the corresponding type of wound.
Scenario III: The sample size of each bootstrap sample is equal to the population
of the corresponding type of wound.
Scenario IV: For the first bootstrap sample we draw with replacement the same
number of observations as the size of the population of the corresponding type of
wound. To explain this scenario more clearly we use the diabetic mellitus
population (n=65) as example. So, the first bootstrap sample consists of 65
observations that are drawn by sampling with replacement from the diabetic
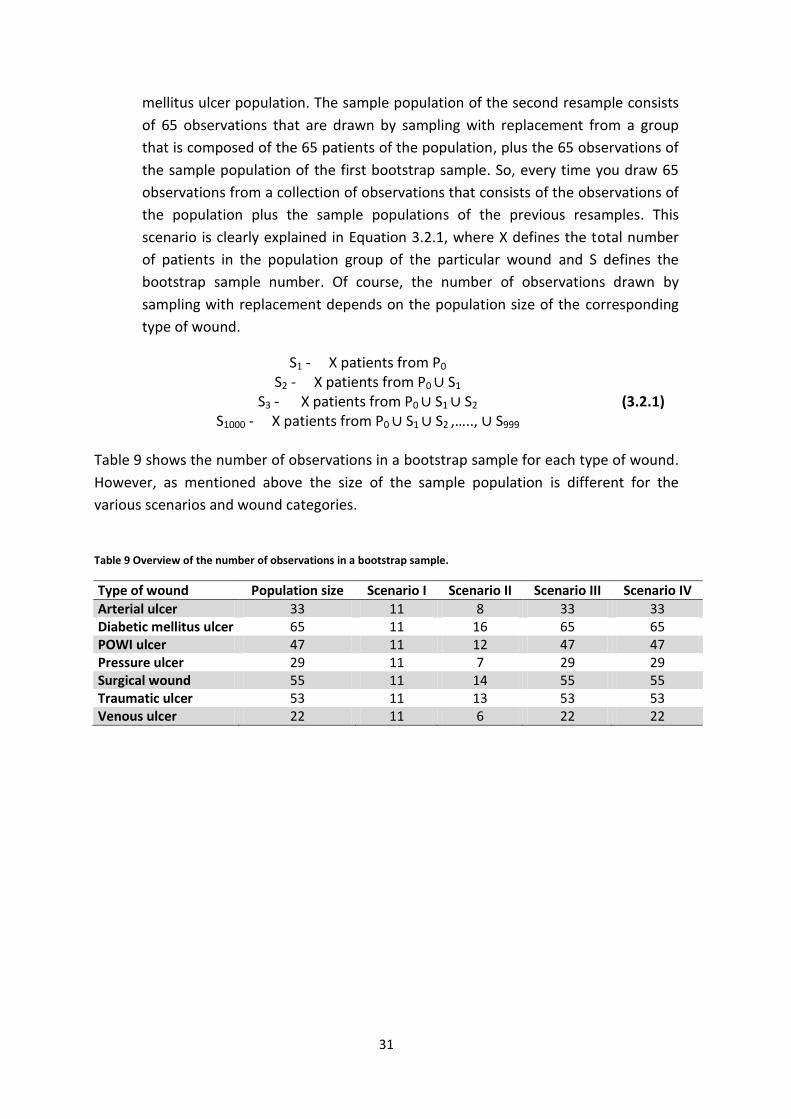
31
mellitus ulcer population. The sample population of the second resample consists
of 65 observations that are drawn by sampling with replacement from a group
that is composed of the 65 patients of the population, plus the 65 observations of
the sample population of the first bootstrap sample. So, every time you draw 65
observations from a collection of observations that consists of the observations of
the population plus the sample populations of the previous resamples. This
scenario is clearly explained in Equation 3.2.1, where X defines the total number
of patients in the population group of the particular wound and S defines the
bootstrap sample number. Of course, the number of observations drawn by
sampling with replacement depends on the population size of the corresponding
type of wound.
S1 - X patients from P0
S2 - X patients from P0 S1
S3 - X patients from P0 S1 S2
S1000 - X patients from P0 S1 S2 ,….., S999
(3.2.1)
Table 9 shows the number of observations in a bootstrap sample for each type of wound.
However, as mentioned above the size of the sample population is different for the
various scenarios and wound categories.
Table 9 Overview of the number of observations in a bootstrap sample.
Type of wound Population size Scenario I Scenario II Scenario III Scenario IV
Arterial ulcer 33 11 8 33 33 Diabetic mellitus ulcer 65 11 16 65 65 POWI ulcer 47 11 12 47 47 Pressure ulcer 29 11 7 29 29 Surgical wound 55 11 14 55 55 Traumatic ulcer 53 11 13 53 53 Venous ulcer 22 11 6 22 22
32
3.3 Excel
For our research we are interested in the outcome of the following statistics:
The average total costs per type of chronic wound, as well as SD and 95%-CI of the
average total costs.
The average MSVT costs per type of chronic wound, as well as SD and 95%-CI of
the average MSVT costs.
The average costs of medical HLP used during home care per type of chronic
wound, as well as SD and 95%-CI of the average HLP costs.
Our statistics of interest are calculated using the program Excel. The first step of our
calculations is the classification of patients by their type of wound. This gives us an
overview of the costs of treatment per patient. Subsequently, we add per patient the
MSVT and the HLP costs. This represents the total costs of wound care per patient. These
cost totals are calculated before performing the non-parametric bootstrap method. This
is decided because we assume some correlation between the number of received MSVT
hours and the amount of medical aids used during home care.
The non-parametric bootstrap method is performed for every cost category of a
particular type of wound. Then, we calculate the mean of every bootstrap sample. The
average costs of a cost category are calculated by the determination of the average of all
1000 bootstrap samples means. Thereafter, we calculate the SD and give an estimation of
the 95%-CI.
The distribution and the frequencies of the resample means are displayed in a histogram.
These histograms display a graphical representation of the distribution of our cost data
and it shows an estimation of the density of the underlying probability density function.
To create a histogram we divide bootstrap sample means into bins. The mean of a
resample is included in a specific bin, if this value is greater than the lower bound of the
interval, and equal or less than the upper bound.
Normally you would calculate a confidence interval, with an assumption about the
underlying distribution. However, the non-parametric bootstrap approach does not rely
on any assumption. Therefore, the 95%-CI is calculated using the percentile method,
based on the 2.5th and 97.5th percentile. We determine the two-tailed 2.5% cut-off point,
so 2.5 per cent of the resample means are cut off at the left and at the right side of the
distribution. The smallest and largest value that remain between these two cut-off points
estimate the range of the 95%-CI.

33
Besides the calculation of the average costs and the estimation of the 95%-CI, we
calculate the SD. This statistical parameter represents a measure that is used to quantify
the amount of variation. A small value indicates a low dispersion around the mean, and
the exact opposite applies to high values. Our calculations of the SD are based on the
bootstrap sample means.
)
(3.3.1)
In our analysis the parameters are unknown; therefore we estimate the arithmetic mean
with Formula 3.3.2.
∑
(3.3.2)
The estimator of is defined by . Suppose N=1000, than the equation of the estimator
of the mean is given in Formula 3.3.3.
∑
(3.3.3)
The estimator of the SD of the estimator of the mean is calculated using Formula 3.3.4.
√
∑
(3.3.4)

34
Results
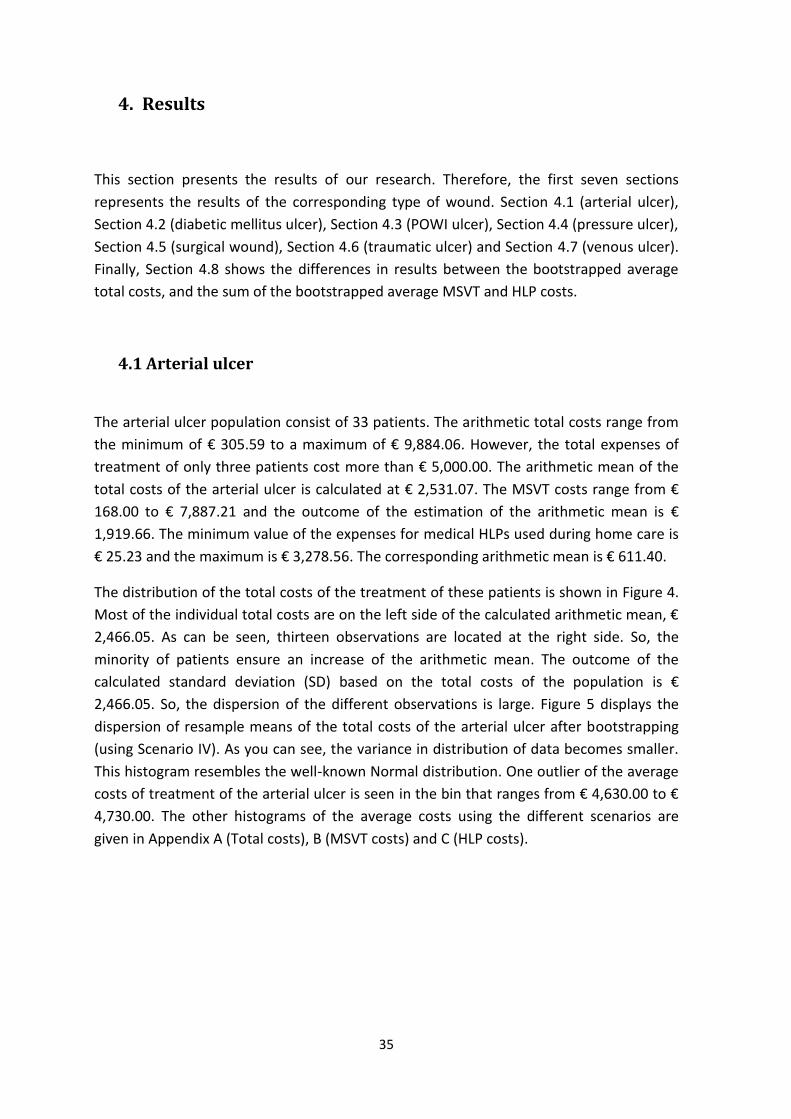
35
4. Results
This section presents the results of our research. Therefore, the first seven sections
represents the results of the corresponding type of wound. Section 4.1 (arterial ulcer),
Section 4.2 (diabetic mellitus ulcer), Section 4.3 (POWI ulcer), Section 4.4 (pressure ulcer),
Section 4.5 (surgical wound), Section 4.6 (traumatic ulcer) and Section 4.7 (venous ulcer).
Finally, Section 4.8 shows the differences in results between the bootstrapped average
total costs, and the sum of the bootstrapped average MSVT and HLP costs.
4.1 Arterial ulcer
The arterial ulcer population consist of 33 patients. The arithmetic total costs range from
the minimum of € 305.59 to a maximum of € 9,884.06. However, the total expenses of
treatment of only three patients cost more than € 5,000.00. The arithmetic mean of the
total costs of the arterial ulcer is calculated at € 2,531.07. The MSVT costs range from €
168.00 to € 7,887.21 and the outcome of the estimation of the arithmetic mean is €
1,919.66. The minimum value of the expenses for medical HLPs used during home care is
€ 25.23 and the maximum is € 3,278.56. The corresponding arithmetic mean is € 611.40.
The distribution of the total costs of the treatment of these patients is shown in Figure 4.
Most of the individual total costs are on the left side of the calculated arithmetic mean, €
2,466.05. As can be seen, thirteen observations are located at the right side. So, the
minority of patients ensure an increase of the arithmetic mean. The outcome of the
calculated standard deviation (SD) based on the total costs of the population is €
2,466.05. So, the dispersion of the different observations is large. Figure 5 displays the
dispersion of resample means of the total costs of the arterial ulcer after bootstrapping
(using Scenario IV). As you can see, the variance in distribution of data becomes smaller.
This histogram resembles the well-known Normal distribution. One outlier of the average
costs of treatment of the arterial ulcer is seen in the bin that ranges from € 4,630.00 to €
4,730.00. The other histograms of the average costs using the different scenarios are
given in Appendix A (Total costs), B (MSVT costs) and C (HLP costs).
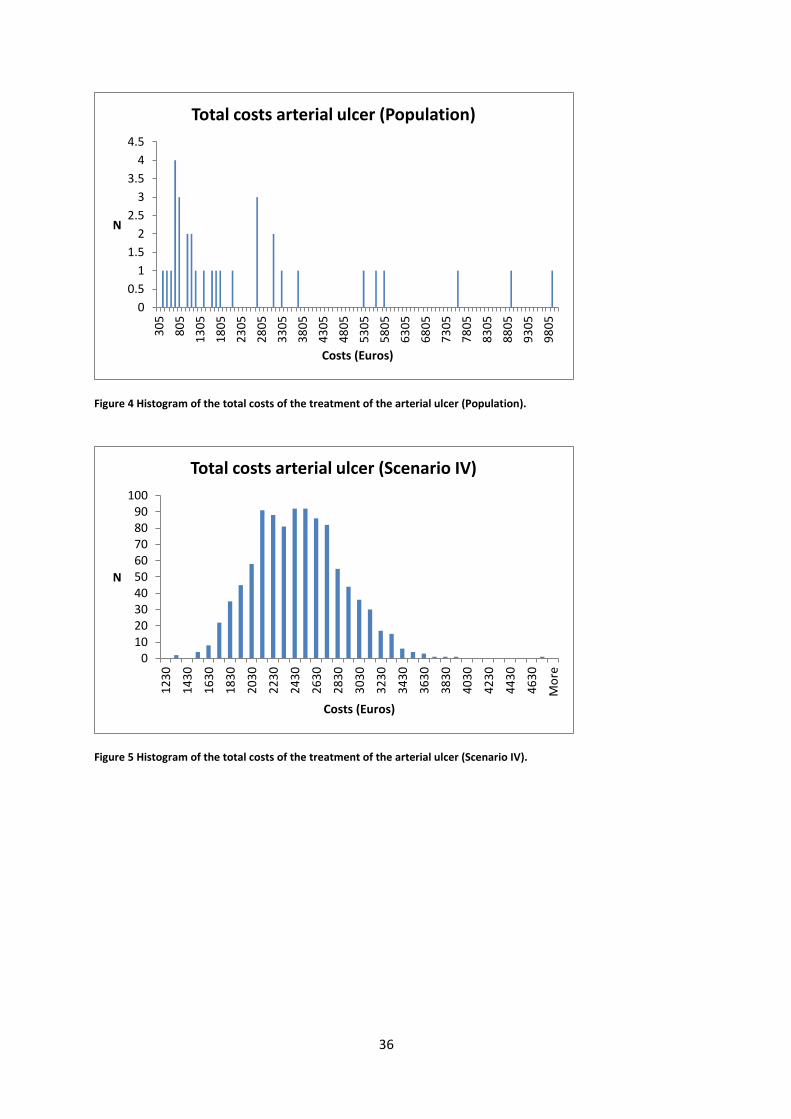
36
Figure 4 Histogram of the total costs of the treatment of the arterial ulcer (Population).
Figure 5 Histogram of the total costs of the treatment of the arterial ulcer (Scenario IV).
0
0.5
1
1.5
2
2.5
3
3.5
4
4.53
05
80
5
13
05
18
05
23
05
28
05
33
05
38
05
43
05
48
05
53
05
58
05
63
05
68
05
73
05
78
05
83
05
88
05
93
05
98
05
N
Costs (Euros)
Total costs arterial ulcer (Population)
0102030405060708090
100
12
30
14
30
16
30
18
30
20
30
22
30
24
30
26
30
28
30
30
30
32
30
34
30
36
30
38
30
40
30
42
30
44
30
46
30
Mo
re
N
Costs (Euros)
Total costs arterial ulcer (Scenario IV)
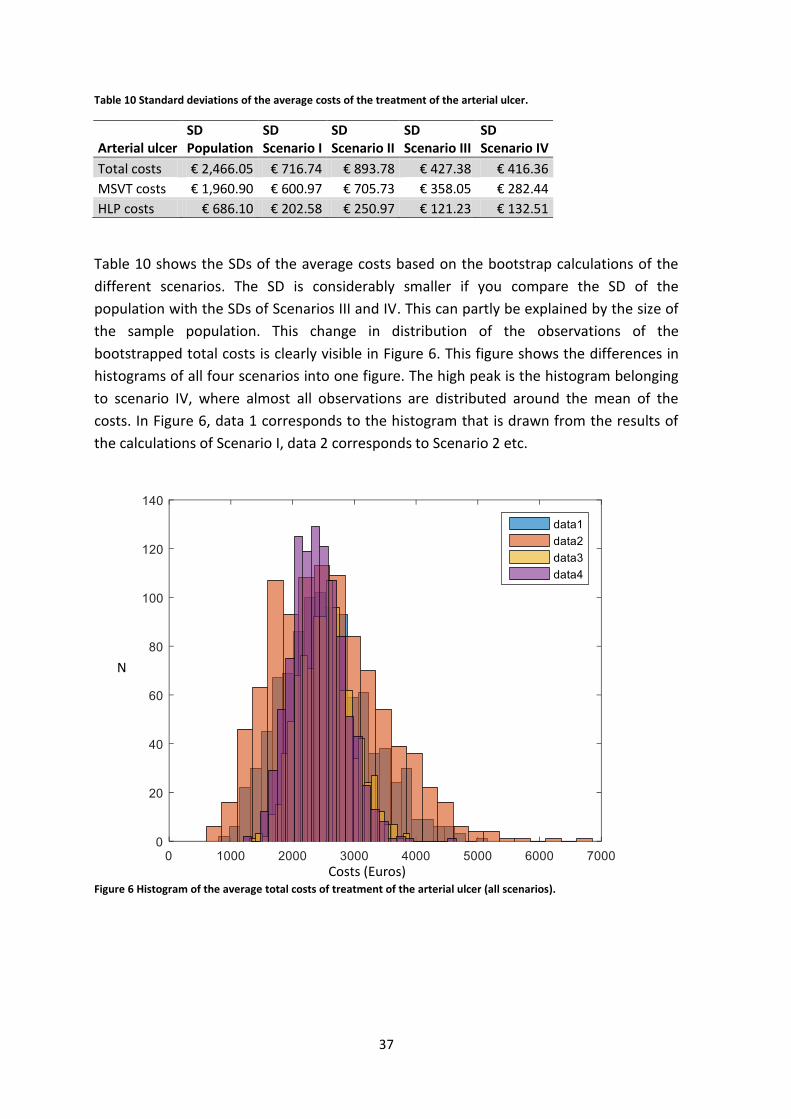
37
Table 10 Standard deviations of the average costs of the treatment of the arterial ulcer.
Arterial ulcer SD Population
SD Scenario I
SD Scenario II
SD Scenario III
SD Scenario IV
Total costs € 2,466.05 € 716.74 € 893.78 € 427.38 € 416.36
MSVT costs € 1,960.90 € 600.97 € 705.73 € 358.05 € 282.44
HLP costs € 686.10 € 202.58 € 250.97 € 121.23 € 132.51
Table 10 shows the SDs of the average costs based on the bootstrap calculations of the
different scenarios. The SD is considerably smaller if you compare the SD of the
population with the SDs of Scenarios III and IV. This can partly be explained by the size of
the sample population. This change in distribution of the observations of the
bootstrapped total costs is clearly visible in Figure 6. This figure shows the differences in
histograms of all four scenarios into one figure. The high peak is the histogram belonging
to scenario IV, where almost all observations are distributed around the mean of the
costs. In Figure 6, data 1 corresponds to the histogram that is drawn from the results of
the calculations of Scenario I, data 2 corresponds to Scenario 2 etc.
Figure 6 Histogram of the average total costs of treatment of the arterial ulcer (all scenarios).
Costs (Euros)
N

38
Table 11 Average costs of the treatment of the arterial ulcer.
Arterial ulcer
Arithmetic mean costs population
Bootstrapped average costs Scenario I
Bootstrapped average costs Scenario II
Bootstrapped average costs Scenario III
Bootstrapped average costs Scenario IV
Total costs € 2,531.07 € 2,540.68 € 2,561.84 € 2,535.78 € 2,417.43 MSVT costs € 1,919.66 € 1,976.65 € 1,912.22 € 1,925.74 € 1,608.54 HLP costs € 611.40 € 607.31 € 622.07 € 608.04 € 696.61
Table 11 shows the average costs that are calculated using the scenarios. These averages
are calculated based on all 1000 resample means. The MSVT costs are approximately
three higher than the expenses for medical HLP used during home care. The bootstrapped
average MSVT and HLP costs calculated using Scenario IV are located relatively far from
the calculated averages of the other scenarios. Scenario IV is the only scenario where the
population of the bootstrap sample depends on the previous sample populations. In
addition, the population of the first bootstrap sample is relatively decisive for the
calculated averages. So, the change of higher average costs is somewhat higher if the first
resample population consists of patients whose treatments were relatively expensive.
Table 12 95% Confidence intervals of the average costs of the treatment of the arterial ulcer.
Arterial ulcer 95%-CI Scenario I
95%-CI Scenario II
95%-CI Scenario III
95%-CI Scenario IV
Total costs (1,253.02-4,112.51) (1,139.03-4,424.70) (1,778.53-3,414.78) (1,667.49-3,280.12)
MSVT costs (948.25-3.307.15) (790.91-3,403.06) (1,286.02-2,653.59) (1,122.73-2,182.42)
HLP costs (287.52-1,067.36) (236.14-1,222.77) (588.74-625.86) (465.79-980.94)
The ranges of the 95%-CI are estimated using the percentile method, explained in Section
3.3. Table 12 shows the 95%-CIs based on the means of the 1000 resamples. The intervals
are bigger for the first two scenarios. This also corresponds to the higher value of the SDs
of the average bootstrapped costs calculated. The interval that is calculated using
bootstrap Scenario IV is relatively small. This is logical because most of the resample
means are located around the average of all resamples. Therefore, you see a reduction in
values of the variance and SD and this results in a small 95%-CI range.
4.2 Diabetic mellitus ulcer
We analysed data of 65 patients who received wound treatment for their diabetic
mellitus ulcer at the KCWC. The total costs vary between € 123.71 and € 7,629.91, with a
calculated arithmetic mean of € 1,650.53. The total costs of treatment of eighteen
patients lay at the right sight of the mean. So, this indicates a distribution of the average

39
total costs to the right. The minimum of MSVT cost is € 33.60, and a maximum of €
6,099.90. We calculated the arithmetic mean of the MSVT costs at € 1,195.93. The
difference in minimum and maximum costs for medical HLP used during home care is
large. The costs of HLP vary between € 11.20 and € 6,060.93 and their average is
estimated at € 454.60. A remarkable point is our data is the patient who received five
hours of MSVT, which corresponds to € 302.40. However, this patient received significant
expensive medical HLP, respectively € 6,060.93. So, there is not always a correlation
between the MSVT and the HLP costs. Again, these cost outliers ensure a significant
increase in the average costs of treatment.
Figure 7 Histogram total costs of the treatment of the diabetic mellitus ulcer (Population)
Figure 8 Histogram average total costs of treatment of the diabetic mellitus ulcer (Scenario IV)
0
12
34
56
789
10
12
3
52
3
92
3
13
23
17
23
21
23
25
23
29
23
33
23
37
23
41
23
45
23
49
23
53
23
57
23
61
23
65
23
69
23
73
23
77
23
N
Costs (Euros)
Total costs diabetic mellitus (Population)
0
50
100
150
200
250
N
Costs (Euros)
Total costs diabetic mellitus ulcer (Scenario IV)
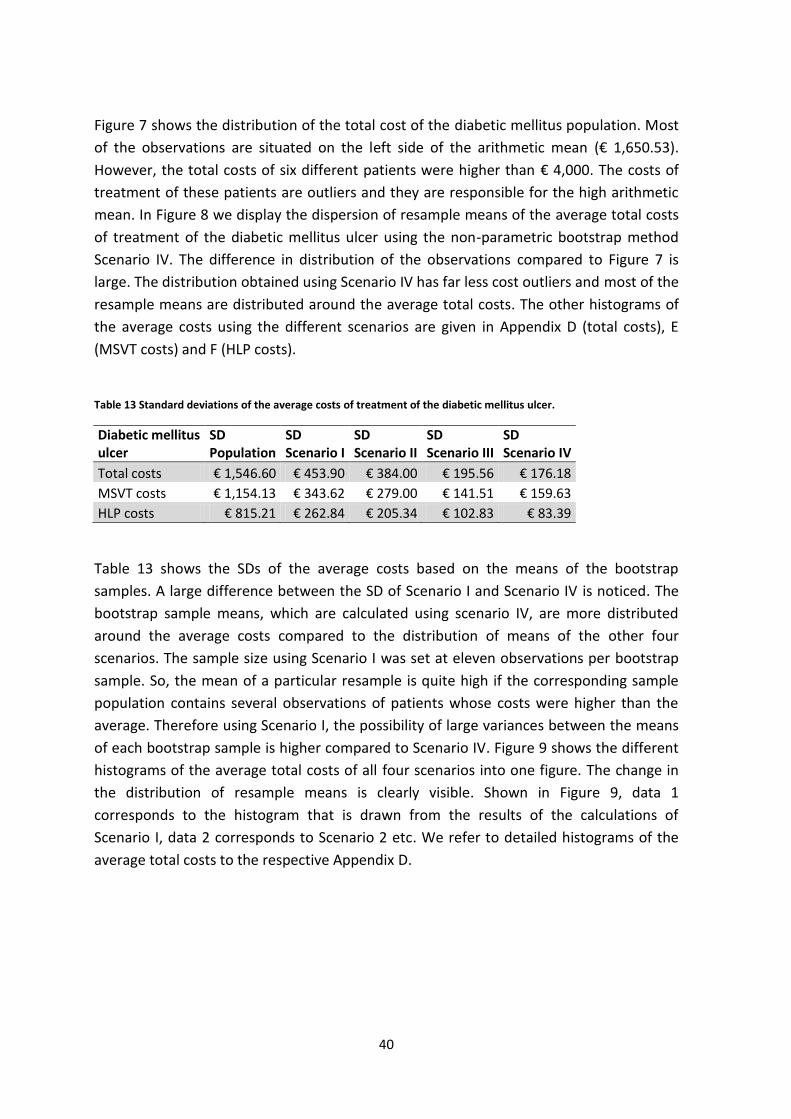
40
Figure 7 shows the distribution of the total cost of the diabetic mellitus population. Most
of the observations are situated on the left side of the arithmetic mean (€ 1,650.53).
However, the total costs of six different patients were higher than € 4,000. The costs of
treatment of these patients are outliers and they are responsible for the high arithmetic
mean. In Figure 8 we display the dispersion of resample means of the average total costs
of treatment of the diabetic mellitus ulcer using the non-parametric bootstrap method
Scenario IV. The difference in distribution of the observations compared to Figure 7 is
large. The distribution obtained using Scenario IV has far less cost outliers and most of the
resample means are distributed around the average total costs. The other histograms of
the average costs using the different scenarios are given in Appendix D (total costs), E
(MSVT costs) and F (HLP costs).
Table 13 Standard deviations of the average costs of treatment of the diabetic mellitus ulcer.
Diabetic mellitus ulcer
SD Population
SD Scenario I
SD Scenario II
SD Scenario III
SD Scenario IV
Total costs € 1,546.60 € 453.90 € 384.00 € 195.56 € 176.18
MSVT costs € 1,154.13 € 343.62 € 279.00 € 141.51 € 159.63
HLP costs € 815.21 € 262.84 € 205.34 € 102.83 € 83.39
Table 13 shows the SDs of the average costs based on the means of the bootstrap
samples. A large difference between the SD of Scenario I and Scenario IV is noticed. The
bootstrap sample means, which are calculated using scenario IV, are more distributed
around the average costs compared to the distribution of means of the other four
scenarios. The sample size using Scenario I was set at eleven observations per bootstrap
sample. So, the mean of a particular resample is quite high if the corresponding sample
population contains several observations of patients whose costs were higher than the
average. Therefore using Scenario I, the possibility of large variances between the means
of each bootstrap sample is higher compared to Scenario IV. Figure 9 shows the different
histograms of the average total costs of all four scenarios into one figure. The change in
the distribution of resample means is clearly visible. Shown in Figure 9, data 1
corresponds to the histogram that is drawn from the results of the calculations of
Scenario I, data 2 corresponds to Scenario 2 etc. We refer to detailed histograms of the
average total costs to the respective Appendix D.

41
Figure 9 Histogram average total costs of treatment of the diabetic mellitus ulcer (all scenarios).
Table 14 Average costs of the treatment of the diabetic mellitus ulcer.
Diabetic mellitus ulcer
Arithmetic mean costs population
Bootstrapped average costs Scenario I
Bootstrapped average costs Scenario II
Bootstrapped average costs Scenario III
Bootstrapped average costs Scenario IV
Total costs € 1,650.53 € 1,676.22 € 1,638.48 € 1,658.51 € 1.702,06 MSVT costs € 1,195.93 € 1,194.80 € 1,204.37 € 1,196.09 € 1.275,78 HLP costs € 454.60 € 468.74 € 450.53 € 454.34 € 377,57
Table 14 shows the average costs that are calculated ulcer using the non-parametric
bootstrap scenarios. These averages are calculated based on all 1000 resample means.
Table 15 shows for each bootstrap scenario the 95%-CIs based on the means of all 1000
resamples. These intervals are calculated using the percentile method. The interval that is
calculation using bootstrap Scenario IV is relatively small. This is logical because less
dispersion between resample means is noticed using this scenario.
Table 15 95% Confidence intervals of the average costs of treatment of diabetic mellitus ulcer.
Diabetic mellitus ulcer
95%-CI Scenario I
95%-CI Scenario II
95%-CI Scenario III
95%-CI Scenario IV
Total costs (921.05-2,748.98) (1,021.31-2,541.88) (1,286.21-2,047.77) (1,395.30-2,068.82)
MSVT costs (662.30-1,970.17) (742.64-1,808.31) (938.43-1,485.71) (970.31-1,616.58)
HLP costs (167.01-1,096.32) (209.49-954.13) (298.57-701.51) (248.96-566.07)
N
Costs (Euros)

42
4.3 POWI ulcer
We obtained data of 47 patients who all received wound care for the treatment of POWI
ulcers at the KCWC in Zwolle. The minimum and maximum total costs are respectively €
140.54 and € 3,823.60. We estimated the arithmetic mean of the total costs at €
1,507.40. The MSVT costs vary between € 134.40 and € 3,109.50, and the arithmetic
mean is calculated at € 1,142.56. The HLP costs vary between € 6.14 and € 1,713.75 and
we determined an arithmetic mean of € 364.84. In general, most patients whose total
costs are higher than average received many hours MSVT and medical HLP. However, this
does not apply to one patient. This patient received few hours of MSVT (eight hours
which corresponds to € 537.60), but the costs for medical HLP were relatively quite
expensive (€ 1,713.75).
Figure 10 Histogram of the total costs of the treatment of the POWI ulcer (Population).
Figure 10 shows the distribution of the total costs of the POWI ulcer population. This
dispersion of data does not show a known distribution. One remarkable point is the
presence of some expensive outliers. For example, the three observations located in the
bin that ranges from €3,540.00 to €3,590.00.
0
0.5
1
1.5
2
2.5
3
3.5
4
4.5
14
0
34
0
54
0
74
0
94
0
11
40
13
40
15
40
17
40
19
40
21
40
23
40
25
40
27
40
29
40
31
40
33
40
35
40
37
40
N
Costs (Euros)
Total costs POWI ulcer (Population)
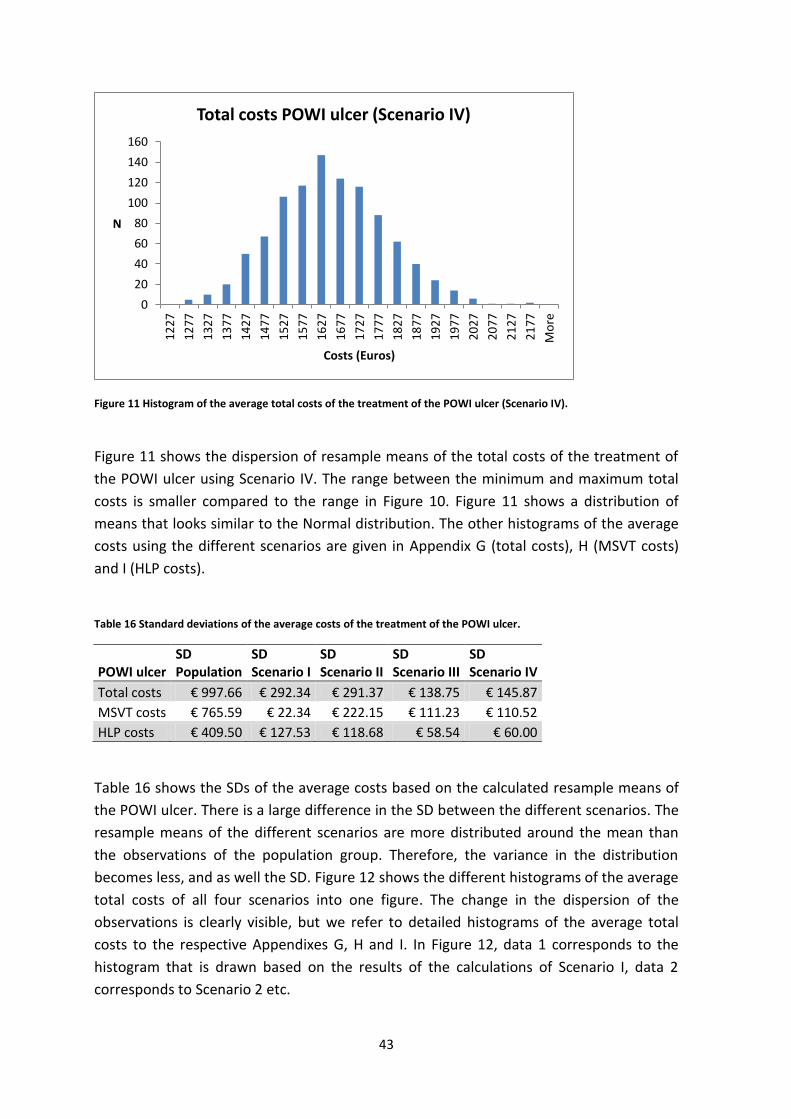
43
Figure 11 Histogram of the average total costs of the treatment of the POWI ulcer (Scenario IV).
Figure 11 shows the dispersion of resample means of the total costs of the treatment of
the POWI ulcer using Scenario IV. The range between the minimum and maximum total
costs is smaller compared to the range in Figure 10. Figure 11 shows a distribution of
means that looks similar to the Normal distribution. The other histograms of the average
costs using the different scenarios are given in Appendix G (total costs), H (MSVT costs)
and I (HLP costs).
Table 16 Standard deviations of the average costs of the treatment of the POWI ulcer.
POWI ulcer SD Population
SD Scenario I
SD Scenario II
SD Scenario III
SD Scenario IV
Total costs € 997.66 € 292.34 € 291.37 € 138.75 € 145.87
MSVT costs € 765.59 € 22.34 € 222.15 € 111.23 € 110.52
HLP costs € 409.50 € 127.53 € 118.68 € 58.54 € 60.00
Table 16 shows the SDs of the average costs based on the calculated resample means of
the POWI ulcer. There is a large difference in the SD between the different scenarios. The
resample means of the different scenarios are more distributed around the mean than
the observations of the population group. Therefore, the variance in the distribution
becomes less, and as well the SD. Figure 12 shows the different histograms of the average
total costs of all four scenarios into one figure. The change in the dispersion of the
observations is clearly visible, but we refer to detailed histograms of the average total
costs to the respective Appendixes G, H and I. In Figure 12, data 1 corresponds to the
histogram that is drawn based on the results of the calculations of Scenario I, data 2
corresponds to Scenario 2 etc.
0
20
40
60
80
100
120
140
160
12
27
12
77
13
27
13
77
14
27
14
77
15
27
15
77
16
27
16
77
17
27
17
77
18
27
18
77
19
27
19
77
20
27
20
77
21
27
21
77
Mo
re
N
Costs (Euros)
Total costs POWI ulcer (Scenario IV)

44
Figure 12 Histogram of the average total costs of treatment of the POWI ulcer (all scenarios).
Table 17 Average costs of the treatment of the POWI ulcer.
Arithmetic mean costs population
Bootstrapped average costs Scenario I
Bootstrapped average costs Scenario II
Bootstrapped average costs Scenario III
Bootstrapped average costs Scenario IV
Total costs € 1,507.40 € 1,505.20 € 1,495.30 € 1,511.17 € 1.625,54
MSVT costs € 1,142.56 € 1,145.05 € 1,133.59 € 1,144.31 € 1.190,41
HLP costs € 364.84 € 363.54 € 362.91 € 363.87 € 376,86
An overview of the average costs that are calculated using the non-parametric bootstrap
scenarios is given in Table 17. The MSVT costs are approximately three times more
expensive than the costs for medical HLP used during home care. The bootstrapped
average total and MSVT costs calculated using Scenario IV are located relatively far from
the calculated averages of the other scenarios. Scenario IV is the only scenario where the
population of the bootstrap sample depends on the previous sample populations. So, the
change of higher average costs is somewhat higher if the first resample population
consists of patients whose treatments were relatively expensive. Probably the first
resample of these calculations consisted of the observations of patients whose
treatments were relatively more expensive that those of the other patients. The 95%-CIs
estimated using the percentile method are given in Table 18. These CIs are based on the
resample means. The intervals are significantly bigger for the Scenarios I, II and V.
N
Costs (Euros)
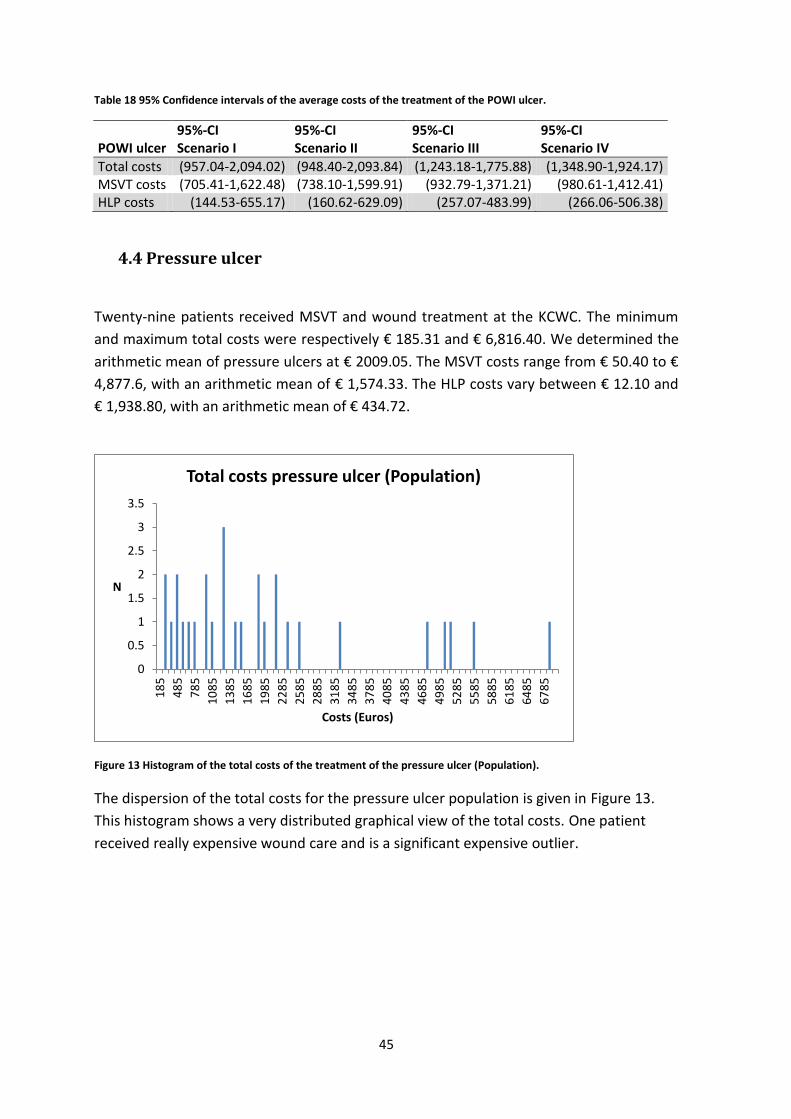
45
Table 18 95% Confidence intervals of the average costs of the treatment of the POWI ulcer.
POWI ulcer 95%-CI Scenario I
95%-CI Scenario II
95%-CI Scenario III
95%-CI Scenario IV
Total costs (957.04-2,094.02) (948.40-2,093.84) (1,243.18-1,775.88) (1,348.90-1,924.17) MSVT costs (705.41-1,622.48) (738.10-1,599.91) (932.79-1,371.21) (980.61-1,412.41) HLP costs (144.53-655.17) (160.62-629.09) (257.07-483.99) (266.06-506.38)
4.4 Pressure ulcer
Twenty-nine patients received MSVT and wound treatment at the KCWC. The minimum
and maximum total costs were respectively € 185.31 and € 6,816.40. We determined the
arithmetic mean of pressure ulcers at € 2009.05. The MSVT costs range from € 50.40 to €
4,877.6, with an arithmetic mean of € 1,574.33. The HLP costs vary between € 12.10 and
€ 1,938.80, with an arithmetic mean of € 434.72.
Figure 13 Histogram of the total costs of the treatment of the pressure ulcer (Population).
The dispersion of the total costs for the pressure ulcer population is given in Figure 13.
This histogram shows a very distributed graphical view of the total costs. One patient
received really expensive wound care and is a significant expensive outlier.
0
0.5
1
1.5
2
2.5
3
3.5
18
5
48
5
78
5
10
85
13
85
16
85
19
85
22
85
25
85
28
85
31
85
34
85
37
85
40
85
43
85
46
85
49
85
52
85
55
85
58
85
61
85
64
85
67
85
N
Costs (Euros)
Total costs pressure ulcer (Population)
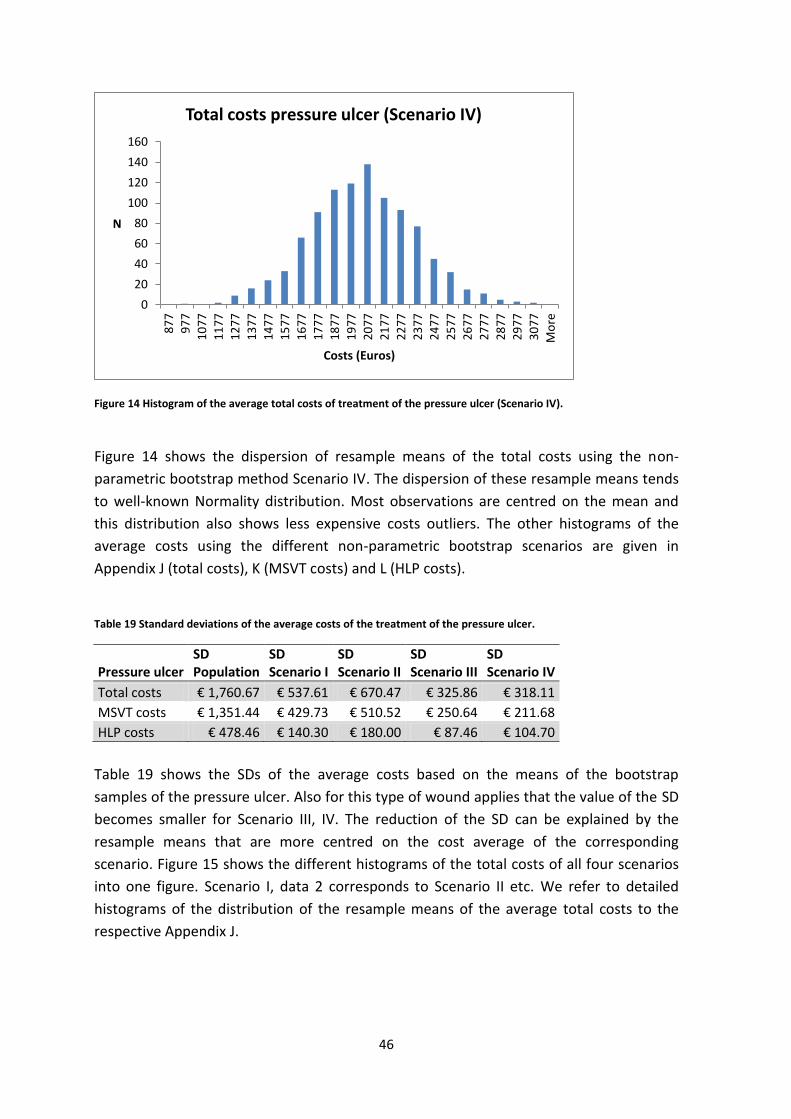
46
Figure 14 Histogram of the average total costs of treatment of the pressure ulcer (Scenario IV).
Figure 14 shows the dispersion of resample means of the total costs using the non-
parametric bootstrap method Scenario IV. The dispersion of these resample means tends
to well-known Normality distribution. Most observations are centred on the mean and
this distribution also shows less expensive costs outliers. The other histograms of the
average costs using the different non-parametric bootstrap scenarios are given in
Appendix J (total costs), K (MSVT costs) and L (HLP costs).
Table 19 Standard deviations of the average costs of the treatment of the pressure ulcer.
Pressure ulcer SD Population
SD Scenario I
SD Scenario II
SD Scenario III
SD Scenario IV
Total costs € 1,760.67 € 537.61 € 670.47 € 325.86 € 318.11
MSVT costs € 1,351.44 € 429.73 € 510.52 € 250.64 € 211.68
HLP costs € 478.46 € 140.30 € 180.00 € 87.46 € 104.70
Table 19 shows the SDs of the average costs based on the means of the bootstrap
samples of the pressure ulcer. Also for this type of wound applies that the value of the SD
becomes smaller for Scenario III, IV. The reduction of the SD can be explained by the
resample means that are more centred on the cost average of the corresponding
scenario. Figure 15 shows the different histograms of the total costs of all four scenarios
into one figure. Scenario I, data 2 corresponds to Scenario II etc. We refer to detailed
histograms of the distribution of the resample means of the average total costs to the
respective Appendix J.
0
20
40
60
80
100
120
140
160
87
7
97
7
10
77
11
77
12
77
13
77
14
77
15
77
16
77
17
77
18
77
19
77
20
77
21
77
22
77
23
77
24
77
25
77
26
77
27
77
28
77
29
77
30
77
Mo
re
N
Costs (Euros)
Total costs pressure ulcer (Scenario IV)

47
Figure 15 Histogram of the average total costs of treatment of the pressure ulcer (all scenarios).
Table 20 Average costs of the treatment of the pressure ulcer.
Pressure ulcer
Arithmetic mean costs population
Bootstrapped average costs Scenario I
Bootstrapped average costs Scenario II
Bootstrapped average costs Scenario III
Bootstrapped average costs Scenario IV
Total costs € 2,009.05 € 1,993.18 € 2,027.10 € 2,010.83 € 1.998,67
MSVT costs € 1,574.33 € 1,570.96 € 1,588.41 € 1,569.02 € 1.455,29
HLP costs € 434.72 € 436.07 € 442.76 € 433.67 € 532,09
An overview of the average costs based on the resample means is given in Table 20. Some
fluctuations between the averages costs using different scenarios are seen. The
bootstrapped average MSVT and HLP costs calculated using Scenario IV are located
relatively far from the calculated averages of the other scenarios. Probably the first
resample of these calculations consisted of the observations of patients whose
treatments were relatively more expensive that those of the other patients. Table 21
shows for each bootstrap scenario the 95%-CI based on the 1000 bootstrap sample
means.
Table 21 95% Confidence intervals of the average costs of the treatment of the pressure ulcer.
Pressure ulcer 95%-CI Scenario I
95%-CI Scenario II
95%-CI Scenario III
95%-CI Scenario IV
Total costs (1,059.95-3,125.99) (948.40-2,093.84) (1,243.18-1,775.88) (1,355.04-2,640.23) MSVT costs (792.22-2,474.71) (738.10-1,599.91) (932.79-1,371.21) (1.048.66-1,873.34) HLP costs (175.20-726.80) (160.62-629.09) (257.07-483.99) (338.72-744.64)
N
Costs (Euros)

48
4.5 Surgical wound
We obtained cost data of 55 patients who all received wound care for their surgical
wound at the KCWC. The total costs vary between € 86.39 and € 7,707.38, with an
arithmetic mean of € 1,476.52. The variation in minimum and maximum MSVT costs is
respectively between € 33.60 and € 6,195.48, with an arithmetic mean of € 1,150.90. The
costs for medical HLP used during home care range from € 6.20 to € 1,809.02, with an
arithmetic mean of € 325.62. The total costs of the most expensive patient are € 7,707.38,
and the maximum MSVT costs also belong to this patient. The highest expenses on
medical HLP belong to another patient, who also received many hours of MSVT.
Figure 16 Histogram of the total costs of the treatment of the surgical wound (Population).
Figure 17 Histogram of the average total costs of treatment of the surgical wound (Scenario IV).
0
1
2
3
4
5
6
86
48
6
88
6
12
86
16
86
20
86
24
86
28
86
32
86
36
86
40
86
44
86
48
86
52
86
56
86
60
86
64
86
68
86
72
86
76
86
N
Costs (Euros)
Total costs surgical wound (Population)
0
50
100
150
200
250
N
Costs (Euros)
Total costs surgical wound (Scenario IV)
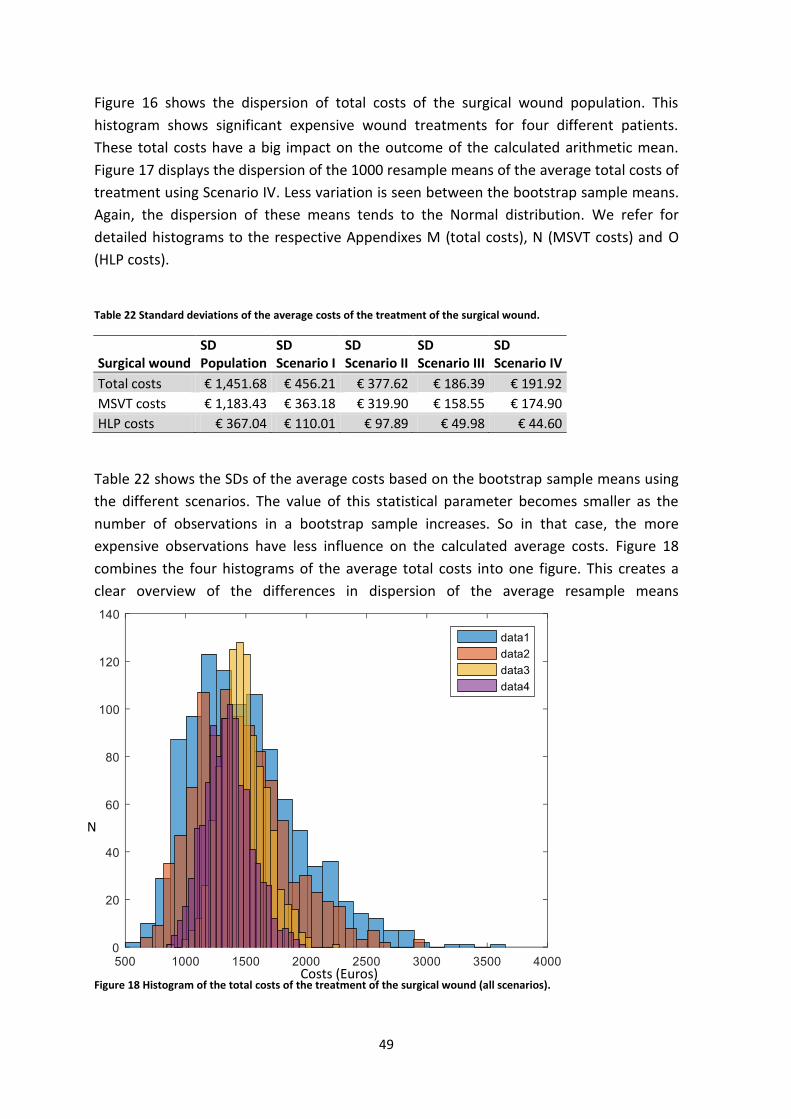
49
Figure 16 shows the dispersion of total costs of the surgical wound population. This
histogram shows significant expensive wound treatments for four different patients.
These total costs have a big impact on the outcome of the calculated arithmetic mean.
Figure 17 displays the dispersion of the 1000 resample means of the average total costs of
treatment using Scenario IV. Less variation is seen between the bootstrap sample means.
Again, the dispersion of these means tends to the Normal distribution. We refer for
detailed histograms to the respective Appendixes M (total costs), N (MSVT costs) and O
(HLP costs).
Table 22 Standard deviations of the average costs of the treatment of the surgical wound.
Surgical wound SD Population
SD Scenario I
SD Scenario II
SD Scenario III
SD Scenario IV
Total costs € 1,451.68 € 456.21 € 377.62 € 186.39 € 191.92
MSVT costs € 1,183.43 € 363.18 € 319.90 € 158.55 € 174.90
HLP costs € 367.04 € 110.01 € 97.89 € 49.98 € 44.60
Table 22 shows the SDs of the average costs based on the bootstrap sample means using
the different scenarios. The value of this statistical parameter becomes smaller as the
number of observations in a bootstrap sample increases. So in that case, the more
expensive observations have less influence on the calculated average costs. Figure 18
combines the four histograms of the average total costs into one figure. This creates a
clear overview of the differences in dispersion of the average resample means
Figure 18 Histogram of the total costs of the treatment of the surgical wound (all scenarios).
N
Costs (Euros)

50
Table 23 Average costs of the treatment of the surgical wound.
Surgical wound
Arithmetic mean costs population
Bootstrapped average costs Scenario I
Bootstrapped average costs Scenario II
Bootstrapped average costs Scenario III
Bootstrapped average costs Scenario IV
Total costs € 1,476.52 € 1,494.59 € 1,459.52 € 1,477.26 € 1.350,96
MSVT costs € 1,150.90 € 1,138.06 € 1,162.21 € 1,145.05 € 1.091,32
HLP costs € 325.62 € 324.55 € 328.85 € 324.01 € 298,52
An overview of the average costs of the surgical ulcer for the three different cost
categories is given in Table 23. We see that the MSVT costs are approximately three times
more expensive than the costs for medical HLP used during home care. This was also
visible in the previous type of wounds. The 95%-CIs estimated using the percentile
method are given in Table 24. These CI are based on the means of all 1000 resamples
within a scenario. This table shows that these intervals are larger Scenario I and II. This
also corresponds to the corresponding higher values of the variance and the SDs.
Table 24 95% Confidence intervals of the average costs of the treatment of the surgical wound.
Surgical wound 95%-CI Scenario I
95%-CI Scenario II
95%-CI Scenario III
95%-CI Scenario IV
Total costs (812.93-2,576.37) (859.58-2,301.65) (1,136.41-1,883.15) (1,004.04-1.763.54) MSVT costs (611.06-1,942.61) (667.66-1,931.12) (868.99-1,480.39) (786.49-1,466.41) HLP costs (155.33-571.87) (175.12-540.32) (230.58-430.50) (223.68-394.59)
4.6 Traumatic ulcer
The population of the traumatic ulcer consists of 53 patients who all received wound
treatment at the KCWC at the Isala clinics. The minimum and maximum total costs are
respectively € 228.99 and € 9,982.95, with an arithmetic mean of € 1,961.35. The MSVT
costs vary between € 33.60 and € 7,308.84, and their arithmetic mean is estimated at €
1,385.18. The range of the HLP costs lies between the € 60.31 and € 3,983.43, and the
arithmetic mean is respectively € 576.17.
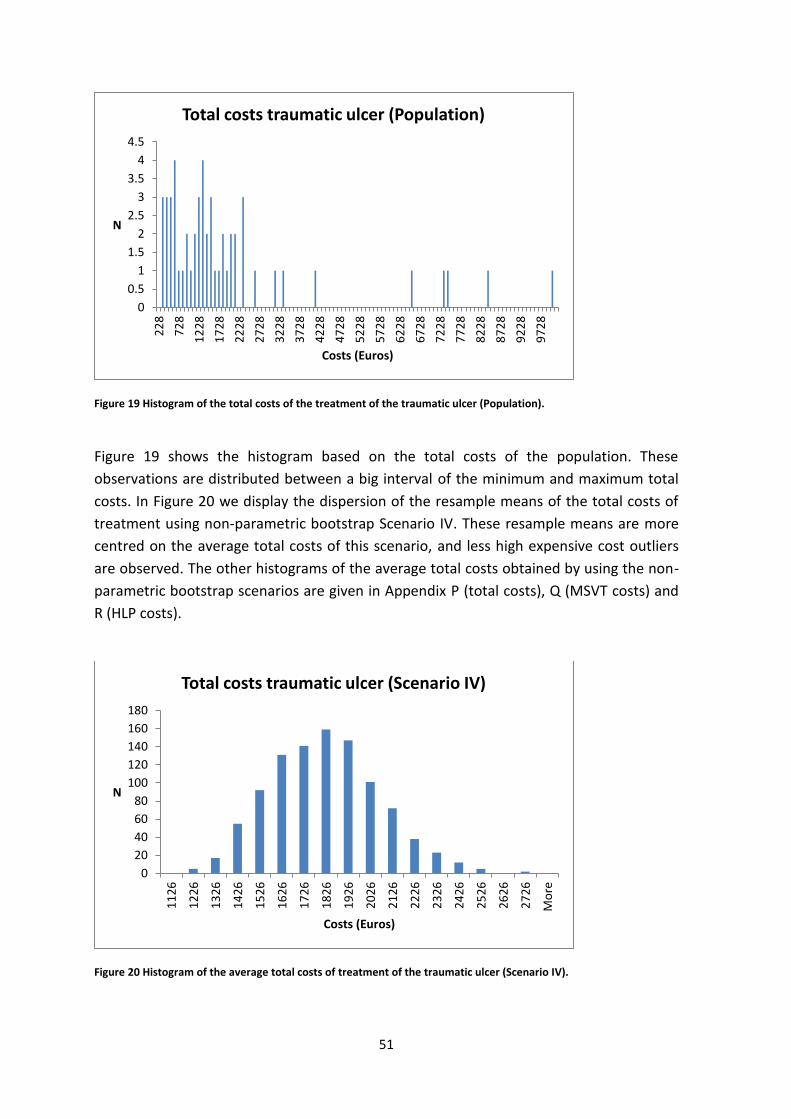
51
Figure 19 Histogram of the total costs of the treatment of the traumatic ulcer (Population).
Figure 19 shows the histogram based on the total costs of the population. These
observations are distributed between a big interval of the minimum and maximum total
costs. In Figure 20 we display the dispersion of the resample means of the total costs of
treatment using non-parametric bootstrap Scenario IV. These resample means are more
centred on the average total costs of this scenario, and less high expensive cost outliers
are observed. The other histograms of the average total costs obtained by using the non-
parametric bootstrap scenarios are given in Appendix P (total costs), Q (MSVT costs) and
R (HLP costs).
Figure 20 Histogram of the average total costs of treatment of the traumatic ulcer (Scenario IV).
0
0.5
1
1.5
2
2.5
3
3.5
4
4.52
28
72
8
12
28
17
28
22
28
27
28
32
28
37
28
42
28
47
28
52
28
57
28
62
28
67
28
72
28
77
28
82
28
87
28
92
28
97
28
N
Costs (Euros)
Total costs traumatic ulcer (Population)
0
20
40
60
80
100
120
140
160
180
11
26
12
26
13
26
14
26
15
26
16
26
17
26
18
26
19
26
20
26
21
26
22
26
23
26
24
26
25
26
26
26
27
26
Mo
re
N
Costs (Euros)
Total costs traumatic ulcer (Scenario IV)
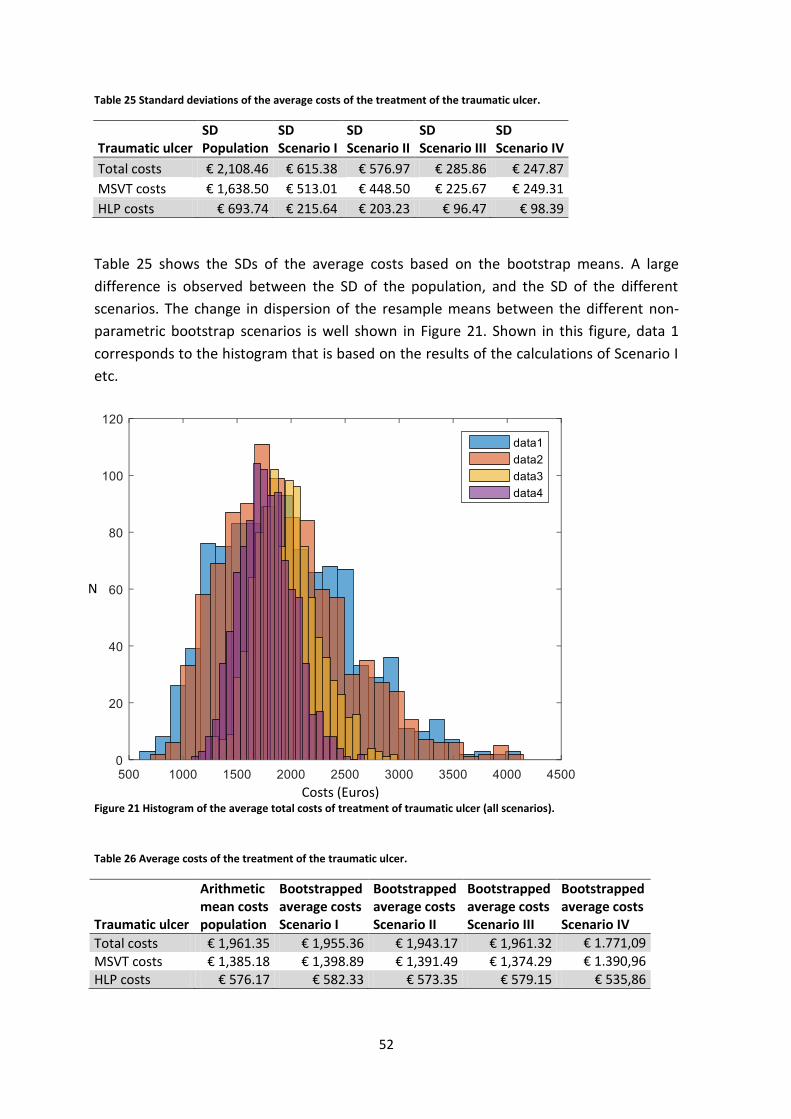
52
Table 25 Standard deviations of the average costs of the treatment of the traumatic ulcer.
Traumatic ulcer SD Population
SD Scenario I
SD Scenario II
SD Scenario III
SD Scenario IV
Total costs € 2,108.46 € 615.38 € 576.97 € 285.86 € 247.87
MSVT costs € 1,638.50 € 513.01 € 448.50 € 225.67 € 249.31
HLP costs € 693.74 € 215.64 € 203.23 € 96.47 € 98.39
Table 25 shows the SDs of the average costs based on the bootstrap means. A large
difference is observed between the SD of the population, and the SD of the different
scenarios. The change in dispersion of the resample means between the different non-
parametric bootstrap scenarios is well shown in Figure 21. Shown in this figure, data 1
corresponds to the histogram that is based on the results of the calculations of Scenario I
etc.
Figure 21 Histogram of the average total costs of treatment of traumatic ulcer (all scenarios).
Table 26 Average costs of the treatment of the traumatic ulcer.
Traumatic ulcer
Arithmetic mean costs population
Bootstrapped average costs Scenario I
Bootstrapped average costs Scenario II
Bootstrapped average costs Scenario III
Bootstrapped average costs Scenario IV
Total costs € 1,961.35 € 1,955.36 € 1,943.17 € 1,961.32 € 1.771,09
MSVT costs € 1,385.18 € 1,398.89 € 1,391.49 € 1,374.29 € 1.390,96 HLP costs € 576.17 € 582.33 € 573.35 € 579.15 € 535,86
N
Costs (Euros)
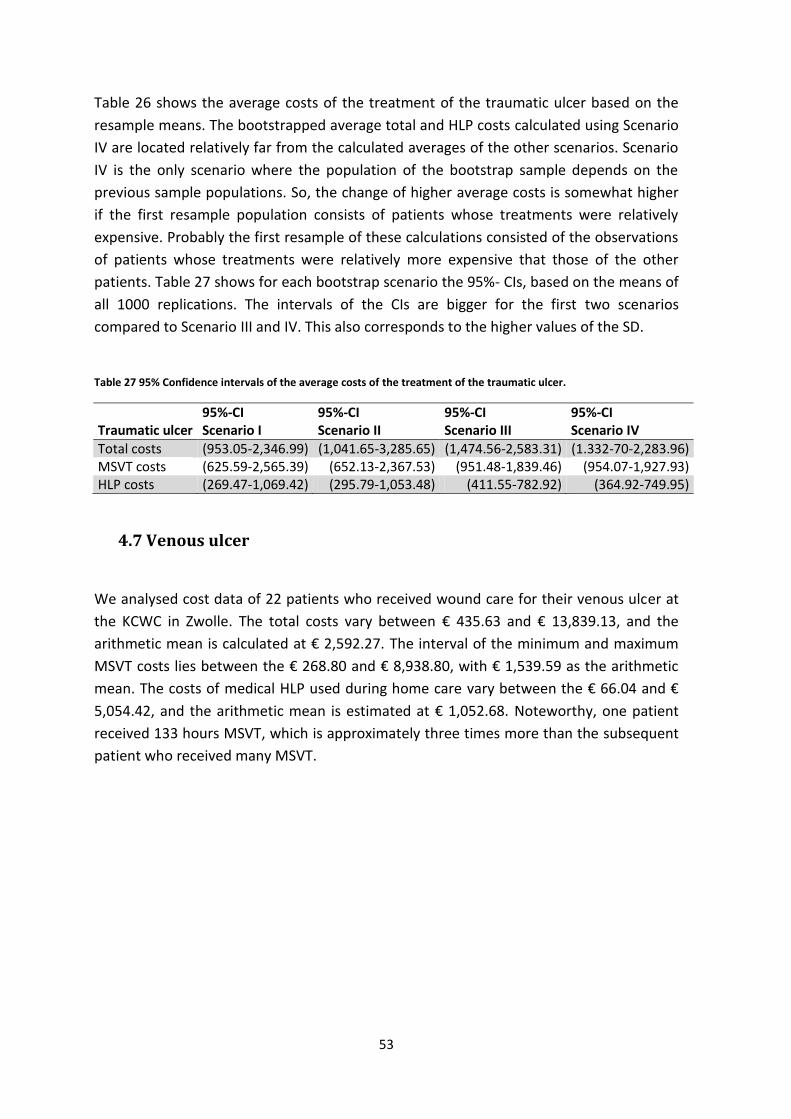
53
Table 26 shows the average costs of the treatment of the traumatic ulcer based on the
resample means. The bootstrapped average total and HLP costs calculated using Scenario
IV are located relatively far from the calculated averages of the other scenarios. Scenario
IV is the only scenario where the population of the bootstrap sample depends on the
previous sample populations. So, the change of higher average costs is somewhat higher
if the first resample population consists of patients whose treatments were relatively
expensive. Probably the first resample of these calculations consisted of the observations
of patients whose treatments were relatively more expensive that those of the other
patients. Table 27 shows for each bootstrap scenario the 95%- CIs, based on the means of
all 1000 replications. The intervals of the CIs are bigger for the first two scenarios
compared to Scenario III and IV. This also corresponds to the higher values of the SD.
Table 27 95% Confidence intervals of the average costs of the treatment of the traumatic ulcer.
Traumatic ulcer 95%-CI Scenario I
95%-CI Scenario II
95%-CI Scenario III
95%-CI Scenario IV
Total costs (953.05-2,346.99) (1,041.65-3,285.65) (1,474.56-2,583.31) (1.332-70-2,283.96) MSVT costs (625.59-2,565.39) (652.13-2,367.53) (951.48-1,839.46) (954.07-1,927.93) HLP costs (269.47-1,069.42) (295.79-1,053.48) (411.55-782.92) (364.92-749.95)
4.7 Venous ulcer
We analysed cost data of 22 patients who received wound care for their venous ulcer at
the KCWC in Zwolle. The total costs vary between € 435.63 and € 13,839.13, and the
arithmetic mean is calculated at € 2,592.27. The interval of the minimum and maximum
MSVT costs lies between the € 268.80 and € 8,938.80, with € 1,539.59 as the arithmetic
mean. The costs of medical HLP used during home care vary between the € 66.04 and €
5,054.42, and the arithmetic mean is estimated at € 1,052.68. Noteworthy, one patient
received 133 hours MSVT, which is approximately three times more than the subsequent
patient who received many MSVT.

54
Figure 22 Histogram of the total costs of the treatment of the venous ulcer (Population).
Figure 22 shows the dispersion of the total costs of the venous ulcer population.
Noticeable, there are three outliers whose treatment cost more € 5,000. Figure 23
displays the dispersion of resample means of the total costs using the non-parametric
bootstrap method Scenario IV. The variance in dispersion of the calculated bootstrap
sample means is smaller compared to Figure 22. Besides, this distribution obtained a clear
frequency peak and tends towards the Normal distribution. We refer for detailed
histograms of the others scenarios to the respective Appendixes S (total costs), T (MSVT
costs) and U (HLP costs).
Figure 23 Histogram of the average total costs of treatment of the venous ulcer (Scenario IV).
0
0.5
1
1.5
2
2.5
3
3.5
43
5
10
35
16
35
22
35
28
35
34
35
40
35
46
35
52
35
58
35
64
35
70
35
76
35
82
35
88
35
94
35
10
03
5
10
63
5
11
23
5
11
83
5
12
43
5
13
03
5
13
63
5
Mo
re
N
Costs (Euros)
Total costs venous ulcer (Population)
020406080
100120140160180200
N
Costs (Euros)
Total costs veneus ulcer (Scenario IV)
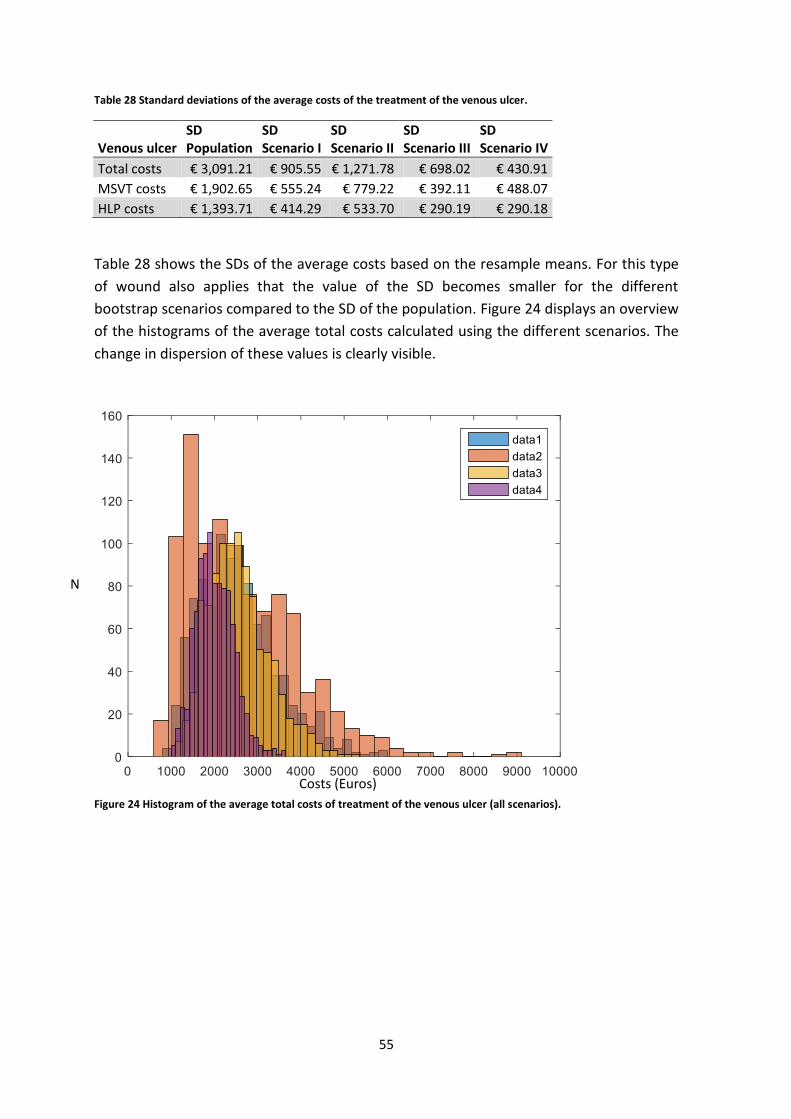
55
Table 28 Standard deviations of the average costs of the treatment of the venous ulcer.
Venous ulcer SD Population
SD Scenario I
SD Scenario II
SD Scenario III
SD Scenario IV
Total costs € 3,091.21 € 905.55 € 1,271.78 € 698.02 € 430.91
MSVT costs € 1,902.65 € 555.24 € 779.22 € 392.11 € 488.07
HLP costs € 1,393.71 € 414.29 € 533.70 € 290.19 € 290.18
Table 28 shows the SDs of the average costs based on the resample means. For this type
of wound also applies that the value of the SD becomes smaller for the different
bootstrap scenarios compared to the SD of the population. Figure 24 displays an overview
of the histograms of the average total costs calculated using the different scenarios. The
change in dispersion of these values is clearly visible.
Figure 24 Histogram of the average total costs of treatment of the venous ulcer (all scenarios).
N
Costs (Euros)

56
Table 29 Average costs of the treatment of the venous ulcer.
Venous ulcer
Arithmetic mean costs population
Bootstrapped average costs Scenario I
Bootstrapped average costs Scenario II
Bootstrapped average costs Scenario III
Bootstrapped average costs Scenario IV
Total costs € 2,592.27 € 2,555.19 € 2,617.41 € 2,563.57 € 2.015,51
MSVT costs € 1,539.59 € 1,551.59 € 1,543.36 € 1,552.77 € 1.598,83
HLP costs € 1,052.68 € 1,054.07 € 1,011.86 € 1,056.65 € 1.112,51
An overview of the average costs of treatment of the venous ulcer is given in Table 29.
We see that the MSVT costs are approximately three times more expensive than the costs
of medical HLP used during home care. This was also noticed in the estimated average
costs of previous discussed different types of chronic wounds. Besides, we also noticed
that the average costs calculated using Scenario IV are less close to the average costs
calculated using the other scenarios. This can be explained by the design of this scenario.
The population of the first bootstrap sample is relatively decisive for the calculated
averages. Table 30 shows for each bootstrap scenario the 95%-CIs based on the means of
all 1000 resamples.
Table 30 95% Confidence interval of the average costs of the treatment of venous ulcer.
Venous ulcer 95%-CI Scenario I
95%-CI Scenario II
95%-CI Scenario III
95%-CI Scenario IV
Total costs (1,173.59-4,704.66) (982.69-5,641.21) (1,456.60-4,165.59) (1,261-10-2,960.30) MSVT costs (705.77-2,856.42) (527.78-3,559.36) (880.57-2,384.99) (908.16-2,721.67) HLP costs (414.21-1,981.30) (289.27-2,259.64) (502.16-1,694.37) (589.98-1,741.19)

57
4.8 Comparison of the average total costs
We calculated the total costs (the sum of the MSVT and HLP costs) of each patient of the
population of the corresponding type of wound, before performing the non-parametric
bootstrap method. Small differences between the bootstrapped total costs, and the sum
of the bootstrapped MSVT and HLP costs are noticed. Table 31 shows the bootstrapped
average total costs, and the sum of the bootstrapped average MSVT and HLP costs of the
diabetic mellitus ulcer. Similarly, Table 32 shows these results of the venous ulcer. We
choose these two type of wounds since the venous ulcer has the smallest population, and
the diabetic mellitus ulcer the largest. Between the first three scenarios the differences in
average costs are very small. However, this difference becomes larger using the results
obtained by the non-parametric bootstrap method Scenario IV. As explained in Section
3.3, you draw with replacement observations from a group that consists of the population
of the corresponding type of wound plus the sample populations from the previous
bootstrap samples. Therefore, the formation of the sample population of the first
resample has a large impact on the composition of the sample populations of the
following bootstrap samples. So using this scenario, it is logical that larger differences
occur between the sum of the bootstrapped average MSVT and HLP costs, and the
bootstrapped average total costs. In particular, this becomes larger if the population of
the corresponding type of wound consists of more patients. This presumption
corresponds to our results, shown in Table 31 and Table 32.
Table 31 Comparison of the bootstrapped average total costs of treatment of diabetic mellitus ulcers.
Table 32 Comparison of the bootstrapped average total costs of treatment of venous ulcers.
Diabetic mellitus ulcer Scenario I Scenario II Scenario III Scenario IV
Bootstrapped MSVT costs € 1,194.80 € 1,204.37 € 1,196.09 € 1,275.78
Bootstrapped HLP costs € 468.74 € 450.53 € 454.34 € 377.57
Sum Bootstrapped MSVT and HLP costs € 1,663.54 € 1,654.90 € 1,650.43 € 1,653.35
Bootstrapped average total costs € 1,676.22 € 1,638.48 € 1,658.51 € 1,702.06
Venous ulcer Scenario I Scenario II Scenario III Scenario IV
Bootstrapped MSVT costs € 1,551.59 € 1,543.36 € 1,552.77 € 1,598.83
Bootstrapped HLP costs € 1,054.07 € 1,011.86 € 1,056.65 € 1,112.51
Sum Bootstrapped MSVT and HLP costs € 2,605.66 € 2,555.22 € 2,609.42 € 2,711.34
Bootstrapped average total costs € 2,555.19 € 2,617.41 € 2,563.57 € 2,015.51

58
Conclusions and recommendations

59
5. Conclusion and recommendations
The aim of this research is to estimate the average costs of medical aids [Hulpmiddelen
(HLP)] used during home care, the average costs associated to specialized medical home
care [Medisch Specialistische Verpleging in de Thuissituatie (MSVT)], and the total costs
of treatment for the most common types of chronic wounds. In Section 1 we introduced
our research and defined nine research questions. Each question has been answered in
one of our sections. Combining the answers to our research questions would fulfil our
research aim. The answers on research questions that we obtained by conducting a
literature research are given in Section 2. Section 3 described the method that is used for
our research. Section 4 shows our results of the non-parametric bootstrap method. In
Section 5 we provide conclusions, limitations and recommendations. Section 5.1 provides
the answer of the main research question. In Section 5.2 we discuss the study limitations
and in Section 5.3 we define recommendations based on the conclusion and discussion. In
Section 5.4 we give directions for further research.
5.1 Conclusion
Chronic wound care involves enormous costs caused by the time-consuming and complex
process of care, delay in hospital discharge, complications, long-term commitment of
health care professionals, and high costs of medical devices and aids. Therefore, the
implementation of cost-efficient wound care is of great significance in the Netherlands.
The Dutch government, health insurances, and the management of wound expertise
centres (WECs) and hospitals are aware of the importance of this implementation.
However, when we started this research the average costs of the treatment of chronic
wounds were not known of patients who received wound care at the WEC at the Isala
clinics in Zwolle. The objective of our research is as follows:
‘To determine the average total costs of treatment for patients who received wound
treatment at the Wound Expertise Centre at the Isala clinics in Zwolle’.
Nine research questions give direction to our research. We review the literature to gain
more knowledge about the wound healing process (1), the definition of a chronic wound
(2), the prevalence (3) and the current organization of wound care in the Netherlands (4),
the estimated average costs regarding these treatments (5), results and conclusions of
previously conducted cost analyses (6), and about the organization of care at the WEC in
the Isala clinics in Zwolle (7). We designed four different scenarios the implementation of
the non-parametric bootstrap method. The results obtained using this method gave the
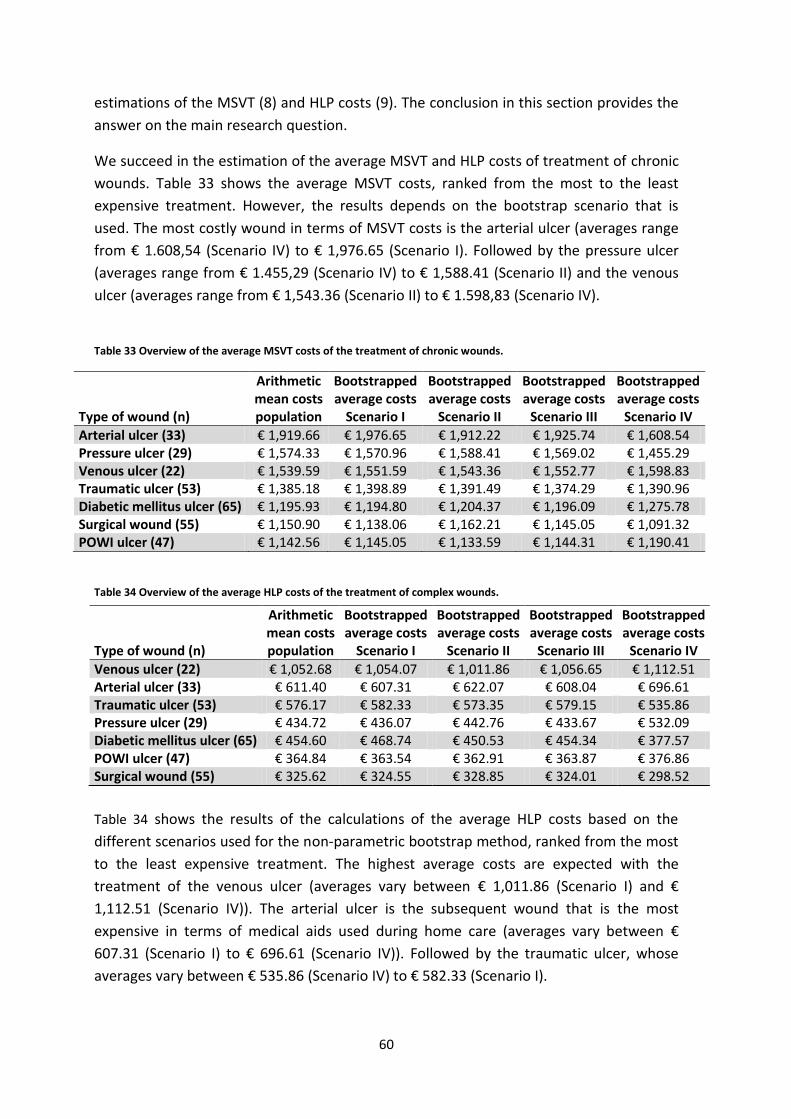
60
estimations of the MSVT (8) and HLP costs (9). The conclusion in this section provides the
answer on the main research question.
We succeed in the estimation of the average MSVT and HLP costs of treatment of chronic
wounds. Table 33 shows the average MSVT costs, ranked from the most to the least
expensive treatment. However, the results depends on the bootstrap scenario that is
used. The most costly wound in terms of MSVT costs is the arterial ulcer (averages range
from € 1.608,54 (Scenario IV) to € 1,976.65 (Scenario I). Followed by the pressure ulcer
(averages range from € 1.455,29 (Scenario IV) to € 1,588.41 (Scenario II) and the venous
ulcer (averages range from € 1,543.36 (Scenario II) to € 1.598,83 (Scenario IV).
Table 33 Overview of the average MSVT costs of the treatment of chronic wounds.
Type of wound (n)
Arithmetic mean costs population
Bootstrapped average costs
Scenario I
Bootstrapped average costs
Scenario II
Bootstrapped average costs
Scenario III
Bootstrapped average costs
Scenario IV
Arterial ulcer (33) € 1,919.66 € 1,976.65 € 1,912.22 € 1,925.74 € 1,608.54 Pressure ulcer (29) € 1,574.33 € 1,570.96 € 1,588.41 € 1,569.02 € 1,455.29 Venous ulcer (22) € 1,539.59 € 1,551.59 € 1,543.36 € 1,552.77 € 1,598.83 Traumatic ulcer (53) € 1,385.18 € 1,398.89 € 1,391.49 € 1,374.29 € 1,390.96 Diabetic mellitus ulcer (65) € 1,195.93 € 1,194.80 € 1,204.37 € 1,196.09 € 1,275.78 Surgical wound (55) € 1,150.90 € 1,138.06 € 1,162.21 € 1,145.05 € 1,091.32 POWI ulcer (47) € 1,142.56 € 1,145.05 € 1,133.59 € 1,144.31 € 1,190.41
Table 34 Overview of the average HLP costs of the treatment of complex wounds.
Table 34 shows the results of the calculations of the average HLP costs based on the
different scenarios used for the non-parametric bootstrap method, ranked from the most
to the least expensive treatment. The highest average costs are expected with the
treatment of the venous ulcer (averages vary between € 1,011.86 (Scenario I) and €
1,112.51 (Scenario IV)). The arterial ulcer is the subsequent wound that is the most
expensive in terms of medical aids used during home care (averages vary between €
607.31 (Scenario I) to € 696.61 (Scenario IV)). Followed by the traumatic ulcer, whose
averages vary between € 535.86 (Scenario IV) to € 582.33 (Scenario I).
Type of wound (n)
Arithmetic mean costs population
Bootstrapped average costs
Scenario I
Bootstrapped average costs
Scenario II
Bootstrapped average costs
Scenario III
Bootstrapped average costs
Scenario IV
Venous ulcer (22) € 1,052.68 € 1,054.07 € 1,011.86 € 1,056.65 € 1,112.51 Arterial ulcer (33) € 611.40 € 607.31 € 622.07 € 608.04 € 696.61 Traumatic ulcer (53) € 576.17 € 582.33 € 573.35 € 579.15 € 535.86 Pressure ulcer (29) € 434.72 € 436.07 € 442.76 € 433.67 € 532.09 Diabetic mellitus ulcer (65) € 454.60 € 468.74 € 450.53 € 454.34 € 377.57 POWI ulcer (47) € 364.84 € 363.54 € 362.91 € 363.87 € 376.86 Surgical wound (55) € 325.62 € 324.55 € 328.85 € 324.01 € 298.52

61
Table 35 shows the average total costs for the most common types of chronic wounds,
ranked from the most to the least expensive treatment. The most costly treatments in
terms of the average total costs is that of venous ulcers, followed by the arterial and the
pressure ulcers. The average costs of the venous ulcer range between € 2,015.51
(Scenario IV) to € 2,617.41 (Scenario II). The estimates vary between € 2,417.43 (Scenario
IV) to € 2,561.84 (Scenario II) concerning the treatment of the arterial ulcer, and between
€ 1,993.18 (Scenario I) to € 2,027.10 (Scenario II) regarding wound care of the pressure
ulcer. So in general, the treatment of the venous ulcer is the most expensive. This is in
line with our expectations, because the healing duration is generally quite long for this
type of wound. We expected less high average total costs of the treatment of the arterial
ulcer. In general, the wound healing process is relatively fast. However, the research
population consist of 33 patients with a considerable number of expensive costs outliers.
So, these costs outliers had large impact on the calculations of the expected average
costs. The diabetic mellitus population consisted of a mix between the diabetic
neuropathic and the diabetic arterial ulcer. We expected the average costs regarding
these treatment higher. However, this reduction in average costs might be caused by a
referral of patients whose wound were not healed to a podiatrist in Zwolle. The costs of
these referrals are not included in our research.
Table 35 Overview of the average total costs of the treatment of chronic wounds.
Type of wound (n)
Arithmetic mean costs population
Bootstrapped average costs
Scenario I
Bootstrapped average costs
Scenario II
Bootstrapped average costs
Scenario III
Bootstrapped average costs
Scenario IV
Venous ulcer (22) € 2,592.27 € 2,555.19 € 2,617.41 € 2,563.57 € 2,015.51 Arterial ulcer (33) € 2,531.07 € 2,540.68 € 2,561.84 € 2,535.78 € 2,417.43 Pressure ulcer (29) € 2,009.05 € 1,993.18 € 2,027.10 € 2,010.83 € 1,998.67 Traumatic ulcer (53) € 1,961.35 € 1,955.36 € 1,943.17 € 1,961.32 € 1,771.09 Diabetic mellitus ulcer (65) € 1,650.53 € 1,676.22 € 1,638.48 € 1,658.51 € 1,702.06 POWI ulcer (47) € 1,507.40 € 1,505.20 € 1,495.30 € 1,511.17 € 1,625.54 Surgical wound (55) € 1,476.52 € 1,494.59 € 1,459.52 € 1,477.26 € 1,350.96
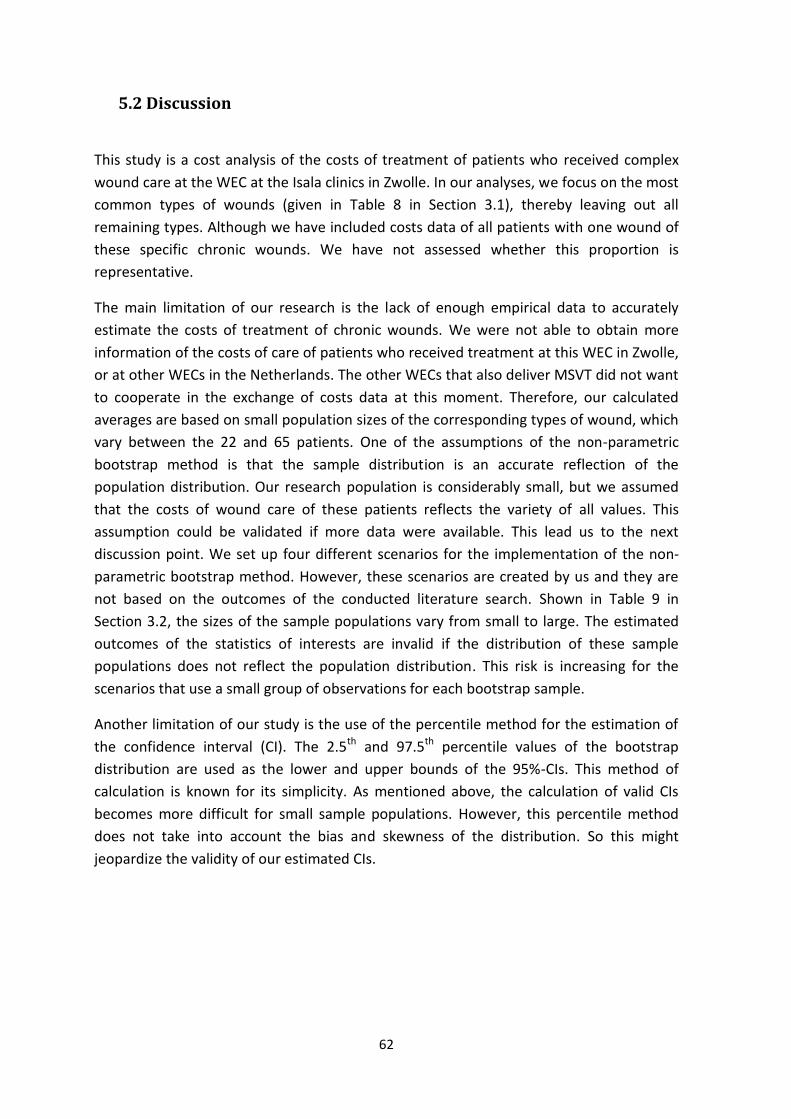
62
5.2 Discussion
This study is a cost analysis of the costs of treatment of patients who received complex
wound care at the WEC at the Isala clinics in Zwolle. In our analyses, we focus on the most
common types of wounds (given in Table 8 in Section 3.1), thereby leaving out all
remaining types. Although we have included costs data of all patients with one wound of
these specific chronic wounds. We have not assessed whether this proportion is
representative.
The main limitation of our research is the lack of enough empirical data to accurately
estimate the costs of treatment of chronic wounds. We were not able to obtain more
information of the costs of care of patients who received treatment at this WEC in Zwolle,
or at other WECs in the Netherlands. The other WECs that also deliver MSVT did not want
to cooperate in the exchange of costs data at this moment. Therefore, our calculated
averages are based on small population sizes of the corresponding types of wound, which
vary between the 22 and 65 patients. One of the assumptions of the non-parametric
bootstrap method is that the sample distribution is an accurate reflection of the
population distribution. Our research population is considerably small, but we assumed
that the costs of wound care of these patients reflects the variety of all values. This
assumption could be validated if more data were available. This lead us to the next
discussion point. We set up four different scenarios for the implementation of the non-
parametric bootstrap method. However, these scenarios are created by us and they are
not based on the outcomes of the conducted literature search. Shown in Table 9 in
Section 3.2, the sizes of the sample populations vary from small to large. The estimated
outcomes of the statistics of interests are invalid if the distribution of these sample
populations does not reflect the population distribution. This risk is increasing for the
scenarios that use a small group of observations for each bootstrap sample.
Another limitation of our study is the use of the percentile method for the estimation of
the confidence interval (CI). The 2.5th and 97.5th percentile values of the bootstrap
distribution are used as the lower and upper bounds of the 95%-CIs. This method of
calculation is known for its simplicity. As mentioned above, the calculation of valid CIs
becomes more difficult for small sample populations. However, this percentile method
does not take into account the bias and skewness of the distribution. So this might
jeopardize the validity of our estimated CIs.
63
The random sampling method with replacement is used for the composition of the
bootstrap samples. So in every resample population, it is possible that any observation of
the population can be drawn once, more than once, or not at all. We did not perform a
statistical test to consider whether the distributions of the samples reflect the population
distributions. If a sample consists of many low or high costs outliers, then this affects the
calculated average costs. So, this must be taken into account when interpreting our
results.
A last remark is intended to the reproducibility of our results. We only executed one run
of 1000 bootstrap samples of each scenario. The results of the calculated resample means
of Scenario IV are to some extent depending on the composition of the sample
population of the first bootstrap sample. So, the creation of 1000 new resamples
generates other outcomes of our statistics of interests. When performing multiple runs,
differences in average costs between runs will be larger for Scenario IV, compared to
other bootstrap scenarios. For the first three scenarios applies that the sample population
of each individual bootstrap sample does not depend on the composition of the first
resample.
5.3 Recommendations
Perhaps the most important conclusion is, that large-scale measurements of the exact
calculations of the total, MSVT and HLP costs are currently not possible due to lack of
enough data. To allow the determination of the exact costs, gathering of more data
should have the highest priority. The first step for the WEC at the Isala clinics in Zwolle is
to collect more costs data of patient over the next years. The second step would be the
collaboration between the various WECs, which also deliver MSVT, concerning the
exchange of cost data. The availability of more information leads to a more accurate
estimation regarding the costs of treatment. However, even with more available data we
still recommend the use of the non-parametric bootstrap method. Even then it is useful
to compare the bootstrap distributions to the empirical distribution of the data gathered.
We recommend performing significantly more runs of 1000 bootstrap samples of each
non-parametric bootstrap scenario. In our research we run each scenario only once. As
mentioned above, the reproducibility of the results of some of the scenarios is small.
When performing more runs, the average costs of treatment can be determined based on
the averages of each individual run.
Another recommendation is the implementation of the chi-squared test. This test checks
whether the population distribution of the corresponding type of wound and the sample
distribution of a created bootstrap sample fits. If the two distributions fit, then the
composition of the sample population of the resample is approved. If not, then remove
64
this sample and again draw by sampling with replacement a certain number of
observations of the population. Using the chi-squared test avoids the inclusion of
bootstrap sample populations that do not reflect the population. If you include the chi-
squared test, the determination of the average costs of wound care will be more
accurate.
A last recommendation is intended for the estimation of the 95%-CIs. We recommend the
use of the bias-corrected and accelerated method. Haukoos & Lewis (2005) stated that
this method calculates two different coefficients, namely the ‘bias correction’ and the
‘acceleration’ coefficient. The first coefficient adapts for the skewness in the bootstrap
sampling distribution and the second one adjusts for the non-constant variances within
the data of the bootstrap samples. So, this method involves adjustments to the two
selected percentiles that serves as the lower and upper bound of the CIs. The ranges of
the CIs would probably be more accurate by using this method instead of the percentile
method.
5.4 Future research
For further research we recommend more research of the use of the non-parametric
bootstrap method for costs calculations of treatments in health care settings. Especially,
focus on the validity and accurately of results if bootstrapping is based on small
population sizes. And we recommend literature research on the use of other statistical
methods that are used for cost analyses of data with small population sizes.

65
Bibliography
Barber, J. A., & Thompson, S. G. (2000). Analysis of cost data in randomized trials: an application of the non-parametric bootstrap. Statistics in Medicine, 19, 3219–3236.
Briggs, A. H., Wonderling, D. E., & Mooney, C. Z. (1997). Pulling cost-effectiveness analysis up by its bootstraps: A non-parametric approach to confidence interval estimation. Health Economics, 6, 327–340.
Capgemini Consulting (2014). Innovatie van complexe wondzorg. Retrieved from https://www.nza.nl/1048076/1048181/Rapport_Innovatie_van_complexe_wondzorg.pdf
Dixon, P. M. (2001). The Bootstrap. Statistics Preprints, 53, 1–19.
European Wound Management Association (2008). Hard-to-heal wounds a holistic approach. Retrieved February 28, 2017, from http://www.woundsinternational.com/media/issues/83/files/content_45.pdf
Excen (2017). Excen partner in de zorg. Retrieved March 9, 2017, from http://www.excen.nl/patient/partner-in-de-zorg/
Flanagan, M. (2000). The physiology of wound healing. Journal of Wound Care, 9, 299–300.
Gottrup, F., Holstein, P., Jørgensen, B., Lohmann, M., & Karlsmark, T. (2001). A new concept of a multidisciplinary wound healing center and a national expert function of wound healing. Archives of Surgery, 136, 765–772.
Graves, N., & Zheng, H. (2014). Modelling the direct health care costs of chronic wounds in Australia. Wound Practice & Research, 22, 20–33.
Gruen, R. L., Chang, S., & MacLellan, D. G. (1996). Optimizing the hospital management of leg ulcers. The Australian and New Zealand Journal of Surgery, 66, 171–174.
Halfens, R. J. G., Meesterberends, E., Neyens, J. C. L., Rondas, A. A. L. M., Rijcken, S., Wolters, S., & Schols, J. M. G. A. (2016). Landelijke prevalentiemeting zorgproblemen rapportage resultaten 2015. Retrieved from https://nl.lpz-um.eu/Content/Public/NL/Publications/LPZ Rapport 2015.pdf
Harding, K. G., & Queen, D. (2010). Chronic wounds and their management and prevention is a significiant public health issue. International Wound Journal, 7, 125–126.
Harrison, M. B., Graham, I. D., Lorimer, K., Friedberg, E., Pierscianowski, T., & Brandys, T. (2005). Leg-ulcer care in the community, before and after implementation of an evidence-based service. Canadian Medical Association Journal, 172, 1447–1452.
Haukoos, J. S., & Lewis, R. J. (2005). Advanced statistics: Bootstrapping confidence intervals for statistics with “difficult” distributions. Academic Emergency Medicine, 12, 360–365.
Heerkens, J. M. G. (1999). Bedrijfskundige methodologie; steen der wijzen of steen des aanstoots? In M. J. Riemswijk (Ed.), Dilemma’s in de bedrijfskundige wetenschap (pp. 101–121). Assen: Van Gorcum.

66
Hesterberg, T., Monaghan, S., Moore, D. S., Clipson, A., & Epstein, R. (2003). Bootstrap methods and permutation tests. In P. Farace, T. Ward, D. Swearengin, B. Donnellan, & M. Byrd (Eds.), The practice of business statistics. New York: W.H. Freeman.
Heyer, K., Herberger, K., Protz, K., Glaeske, G., & Augustin, M. (2016). Epidemiology of chronic wounds in Germany: Analysis of statutory health insurance data. Wound Repair and Regeneration, 24, 434–442.
Isala (2016). Wond expertise centrum. Retrieved March 9, 2017, from http://www.isala.nl/patienten/folders/5596-wondexpertisecentrum
Järbrink, K., Ni, G., Sönnergren, H., Schmidtchen, A., Pang, C., Bajpai, R., & Car, J. (2016). Prevalence and incidence of chronic wounds and related complications: a protocol for a systematic review. Systematic Reviews, 5, 1–6.
Kenniscentrum Wondzorg (2017). Wond Expertise Centra. Retrieved November 4, 2017, from http://www.wcs.nl/over-wcs/wond-expertise-centra.html
Li, J., Chen, J., & Kirsner, R. S. (2007). Pathophysiology of acute wound healing. Clinics in Dermatology, 25, 9–18.
Menke, N. B., Ward, K. R., Witten, T. M., Bonchev, D. G., & Diegelmann, R. F. (2007). Impaired wound healing. Clinics in Dermatology, 25, 19–25.
Ministerie of VWS (2016). Healthcare in the Netherlands. Retrieved from https://www.government.nl/topics/health-insurance/documents/leaflets/2016/02/09/healthcare-in-the-netherlands
Moffatt, C. J., Franks, P. J., Oldroyd, M., Bosanquet, N., Brown, P., Greenhalgh, R. M., & McCollum, C. N. (1992). Community clinics for leg ulcers and impact on healing. British Medical Journal, 305, 1389–1392.
MST (2016). Topklinisch Ziekenhuis Medisch Spectrum Twente. Retrieved March 9, 2017, from https://www.mst.nl/p/over-mst
Na, Y. K., Ban, J., Lee, M., Im, W., & Kim, M. (2017). Wound healing potential of adipose tissue stem cell extract. Biochemical and Biophysical Research Communications, 485, 30–34.
Posnett, J., & Franks, P. J. (2008). The burden of chronic wounds in the UK. Nursing Times, 104, 44–45.
QualityZorg (2017). QualityZorg, gespecialiseerde thuiszorg dichter bij huis. Retrieved March 9, 2017, from https://www.qualityzorg.nl/home/
Quataert, P. (2012). Kwaliteitscriteria wondexpertise - centra als onderdeel van IGZ prestatie-indicatorenset. WCS Nieuws, 28, 28–29.
Rondas, A. A. L. M., Schols, J. M. G. A., Halfens, R. J. G., Hull, H. R., Stobberingh, E. E., & Evers, S. M. A. A. (2015a). Cost analysis of one of the first outpatient wound clinics in the Netherlands. Journal of Wound Care, 24, 426–436.
Rondas, A. A. L. M., Schols, J. M. G. A., Stobberingh, E. E., & Halfens, R. J. G. (2015b). Prevalence of chronic wounds and structural quality indicators of chronic wound care in Dutch nursing homes. International Wound Journal, 12, 630–635.
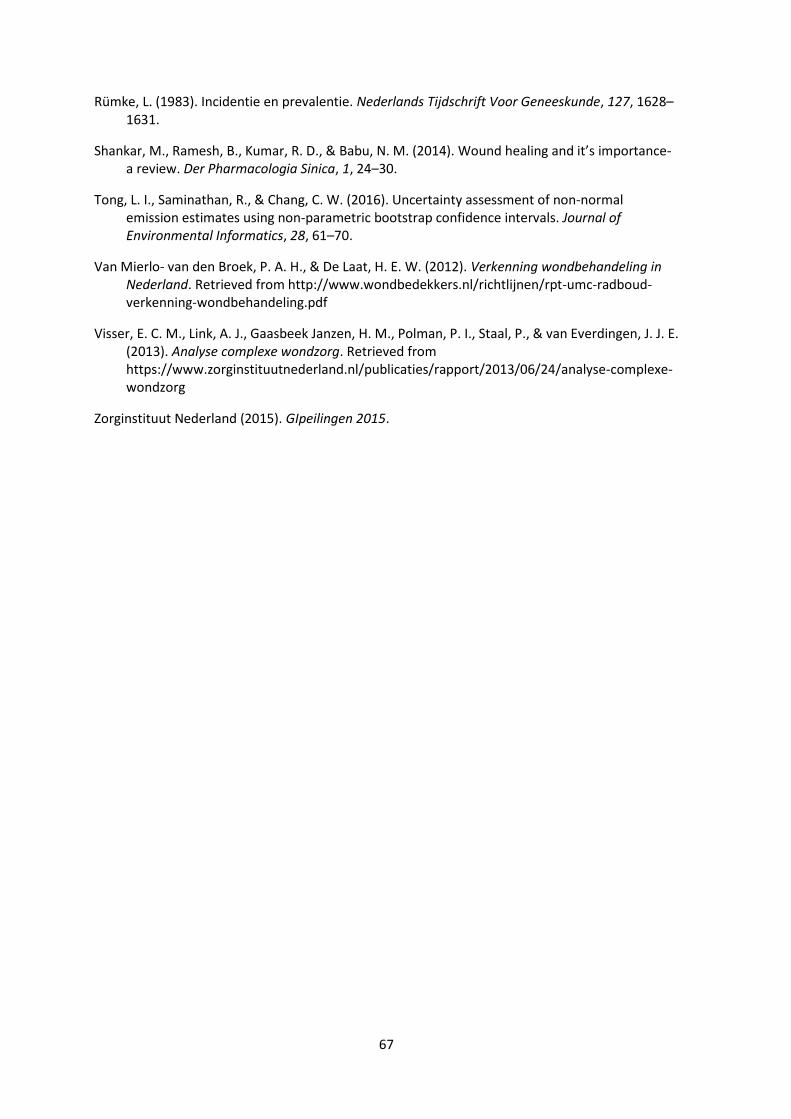
67
Rümke, L. (1983). Incidentie en prevalentie. Nederlands Tijdschrift Voor Geneeskunde, 127, 1628–1631.
Shankar, M., Ramesh, B., Kumar, R. D., & Babu, N. M. (2014). Wound healing and it’s importance- a review. Der Pharmacologia Sinica, 1, 24–30.
Tong, L. I., Saminathan, R., & Chang, C. W. (2016). Uncertainty assessment of non-normal emission estimates using non-parametric bootstrap confidence intervals. Journal of Environmental Informatics, 28, 61–70.
Van Mierlo- van den Broek, P. A. H., & De Laat, H. E. W. (2012). Verkenning wondbehandeling in Nederland. Retrieved from http://www.wondbedekkers.nl/richtlijnen/rpt-umc-radboud-verkenning-wondbehandeling.pdf
Visser, E. C. M., Link, A. J., Gaasbeek Janzen, H. M., Polman, P. I., Staal, P., & van Everdingen, J. J. E. (2013). Analyse complexe wondzorg. Retrieved from https://www.zorginstituutnederland.nl/publicaties/rapport/2013/06/24/analyse-complexe-wondzorg
Zorginstituut Nederland (2015). GIpeilingen 2015.
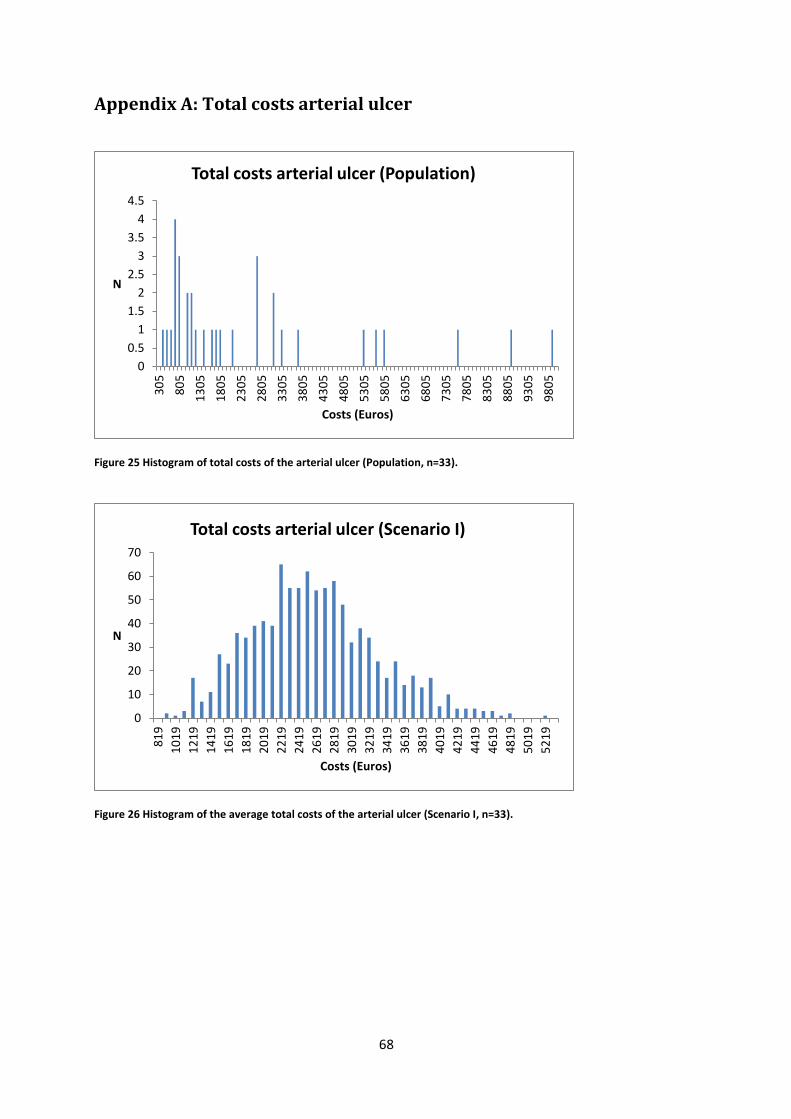
68
Appendix A: Total costs arterial ulcer
Figure 25 Histogram of total costs of the arterial ulcer (Population, n=33).
Figure 26 Histogram of the average total costs of the arterial ulcer (Scenario I, n=33).
0
0.5
1
1.5
2
2.5
3
3.5
4
4.5
30
5
80
5
13
05
18
05
23
05
28
05
33
05
38
05
43
05
48
05
53
05
58
05
63
05
68
05
73
05
78
05
83
05
88
05
93
05
98
05
N
Costs (Euros)
Total costs arterial ulcer (Population)
0
10
20
30
40
50
60
70
81
9
10
19
12
19
14
19
16
19
18
19
20
19
22
19
24
19
26
19
28
19
30
19
32
19
34
19
36
19
38
19
40
19
42
19
44
19
46
19
48
19
50
19
52
19
N
Costs (Euros)
Total costs arterial ulcer (Scenario I)
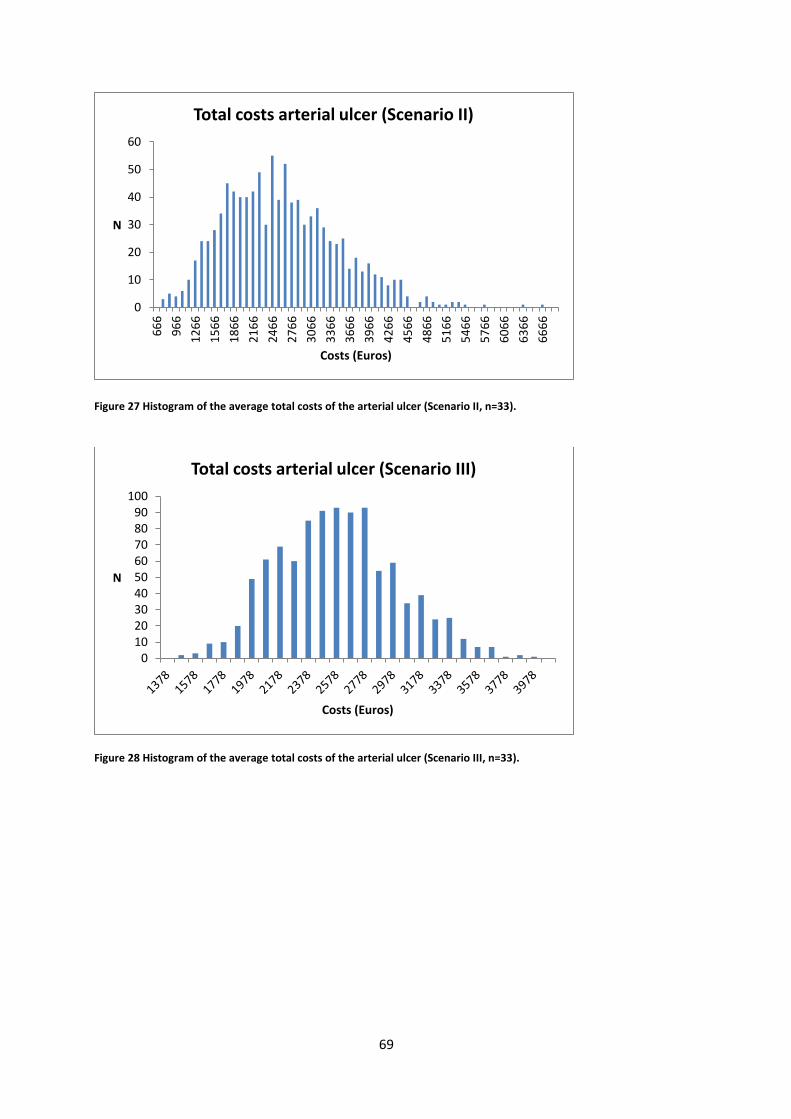
69
Figure 27 Histogram of the average total costs of the arterial ulcer (Scenario II, n=33).
Figure 28 Histogram of the average total costs of the arterial ulcer (Scenario III, n=33).
0
10
20
30
40
50
606
66
96
6
12
66
15
66
18
66
21
66
24
66
27
66
30
66
33
66
36
66
39
66
42
66
45
66
48
66
51
66
54
66
57
66
60
66
63
66
66
66
N
Costs (Euros)
Total costs arterial ulcer (Scenario II)
0102030405060708090
100
N
Costs (Euros)
Total costs arterial ulcer (Scenario III)
70
Figure 29 Histogram of the average total costs of the arterial ulcer (Scenario IV, n=33).
0102030405060708090
100
12
30
14
30
16
30
18
30
20
30
22
30
24
30
26
30
28
30
30
30
32
30
34
30
36
30
38
30
40
30
42
30
44
30
46
30
Mo
re
N
Costs (Euros)
Total costs arterial ulcer (Scenario IV)

71
Appendix B: MSVT costs arterial ulcer
Figure 30 Histogram of the MSVT costs of the arterial ulcer (Population, n=33).
Figure 31 Histogram of the average MSVT costs of the arterial ulcer (Scenario I, n=33).
0
0.5
1
1.5
2
2.5
3
3.5
16
7
56
7
96
7
13
67
17
67
21
67
25
67
29
67
33
67
37
67
41
67
45
67
49
67
53
67
57
67
61
67
65
67
69
67
73
67
77
67
N
Costs (Euros)
MSVT costs arterial ulcer (Population)
0
10
20
30
40
50
60
70
80
55
9
75
9
95
9
11
59
13
59
15
59
17
59
19
59
21
59
23
59
25
59
27
59
29
59
31
59
33
59
35
59
37
59
39
59
41
59
N
Costs (Euros)
MSVT costs arterial ulcer (Scenario I)
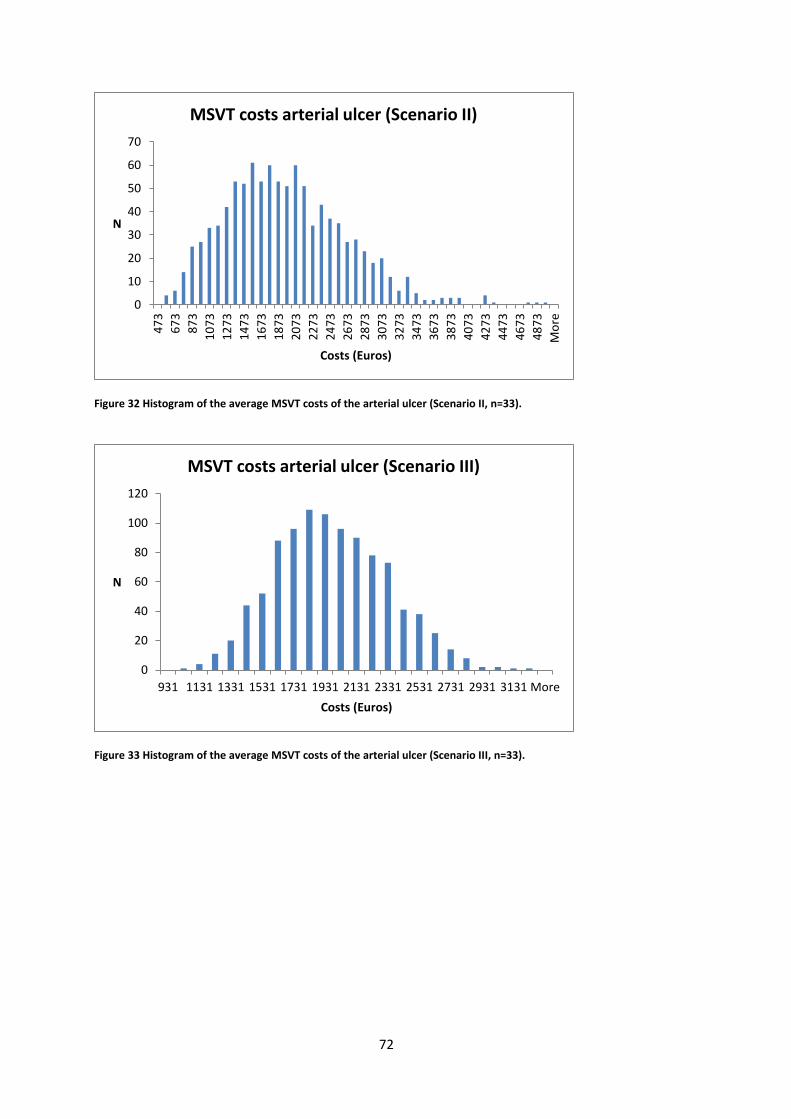
72
Figure 32 Histogram of the average MSVT costs of the arterial ulcer (Scenario II, n=33).
Figure 33 Histogram of the average MSVT costs of the arterial ulcer (Scenario III, n=33).
0
10
20
30
40
50
60
704
73
67
3
87
3
10
73
12
73
14
73
16
73
18
73
20
73
22
73
24
73
26
73
28
73
30
73
32
73
34
73
36
73
38
73
40
73
42
73
44
73
46
73
48
73
Mo
re
N
Costs (Euros)
MSVT costs arterial ulcer (Scenario II)
0
20
40
60
80
100
120
931 1131 1331 1531 1731 1931 2131 2331 2531 2731 2931 3131 More
N
Costs (Euros)
MSVT costs arterial ulcer (Scenario III)
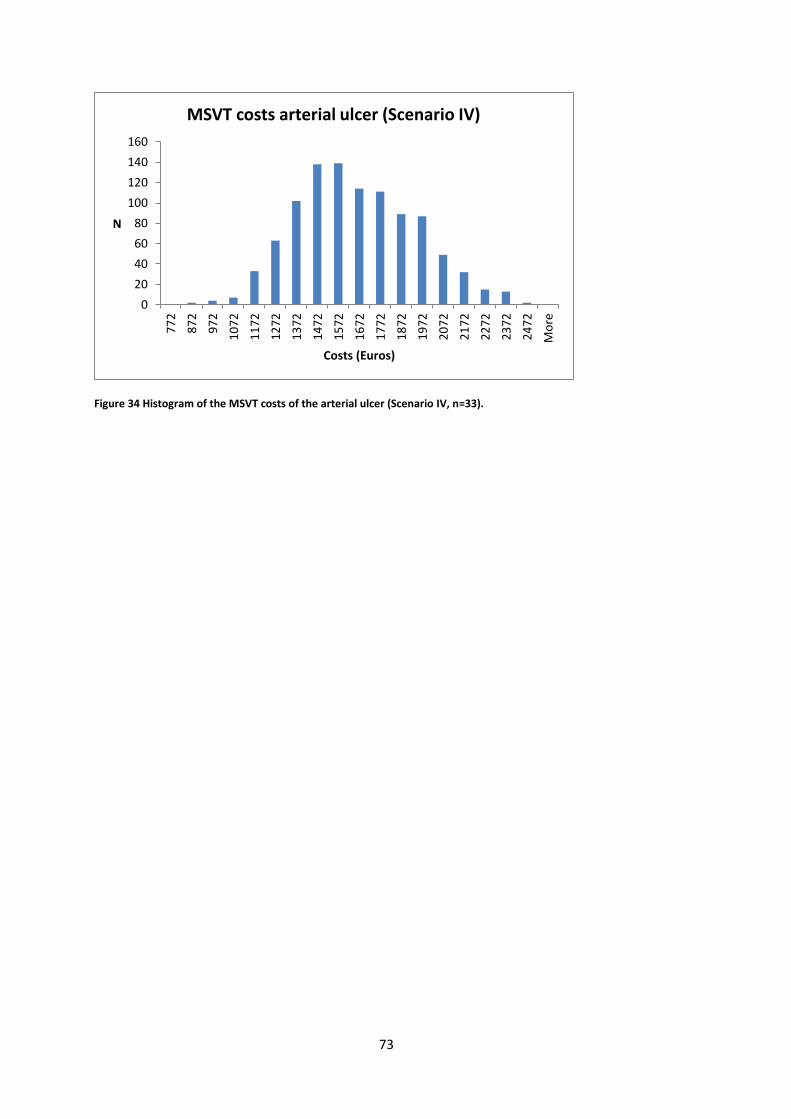
73
Figure 34 Histogram of the MSVT costs of the arterial ulcer (Scenario IV, n=33).
0
20
40
60
80
100
120
140
160
77
2
87
2
97
2
10
72
11
72
12
72
13
72
14
72
15
72
16
72
17
72
18
72
19
72
20
72
21
72
22
72
23
72
24
72
Mo
re
N
Costs (Euros)
MSVT costs arterial ulcer (Scenario IV)
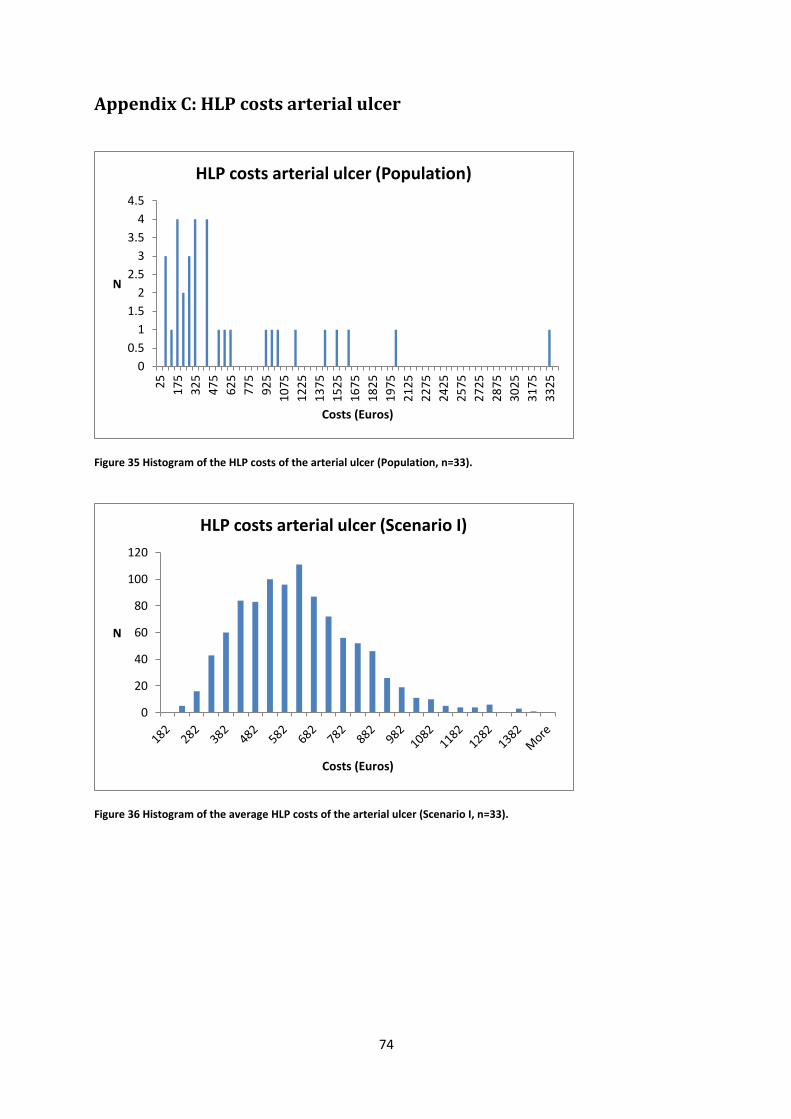
74
Appendix C: HLP costs arterial ulcer
Figure 35 Histogram of the HLP costs of the arterial ulcer (Population, n=33).
Figure 36 Histogram of the average HLP costs of the arterial ulcer (Scenario I, n=33).
0
0.5
1
1.5
2
2.5
3
3.5
4
4.5
25
17
5
32
5
47
5
62
5
77
5
92
5
10
75
12
25
13
75
15
25
16
75
18
25
19
75
21
25
22
75
24
25
25
75
27
25
28
75
30
25
31
75
33
25
N
Costs (Euros)
HLP costs arterial ulcer (Population)
0
20
40
60
80
100
120
N
Costs (Euros)
HLP costs arterial ulcer (Scenario I)

75
Figure 37 Histogram of the average HLP costs of the arterial ulcer (Scenario II, n=33).
Figure 38 Histogram of the average HLP costs of the arterial ulcer (Scenario III, n=33).
0102030405060708090
100
N
Costs (Euros)
HLP costs arterial ulcer (Scenario II)
0
20
40
60
80
100
120
140
160
180
N
Costs (Euros)
HLP costs arterial ulcer (Scenario III)

76
Figure 39 Histogram of the average HLP costs of the arterial ulcer (Scenario IV, n=33).
020406080
100120140160180200
36
9
41
9
46
9
51
9
56
9
61
9
66
9
71
9
76
9
81
9
86
9
91
9
96
9
10
19
10
69
11
19
11
69
12
19
12
69
13
19
13
69
Mo
re
N
Costs (Euros)
HLP costs arterial ulcer (Scenario IV)
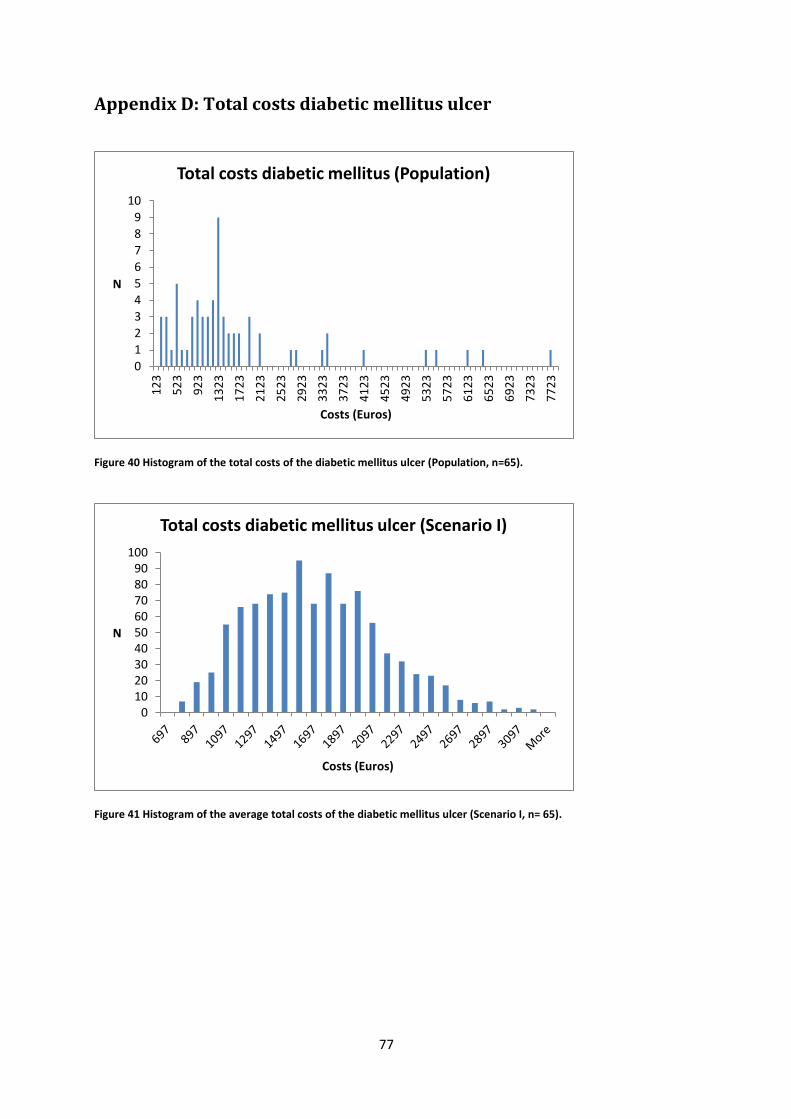
77
Appendix D: Total costs diabetic mellitus ulcer
Figure 40 Histogram of the total costs of the diabetic mellitus ulcer (Population, n=65).
Figure 41 Histogram of the average total costs of the diabetic mellitus ulcer (Scenario I, n= 65).
0
12
3
456
7
89
10
12
3
52
3
92
3
13
23
17
23
21
23
25
23
29
23
33
23
37
23
41
23
45
23
49
23
53
23
57
23
61
23
65
23
69
23
73
23
77
23
N
Costs (Euros)
Total costs diabetic mellitus (Population)
0102030405060708090
100
N
Costs (Euros)
Total costs diabetic mellitus ulcer (Scenario I)

78
Figure 42 Histogram of the average total costs of the diabetic mellitus ulcer (Scenario II, n=65).
Figure 43 Histogram of the average total costs of the diabetic mellitus ulcer (Scenario III, n=65).
0
20
40
60
80
100
120
78
7
88
7
98
7
10
87
11
87
12
87
13
87
14
87
15
87
16
87
17
87
18
87
19
87
20
87
21
87
22
87
23
87
24
87
25
87
26
87
27
87
28
87
29
87
Mo
re
N
Costs (Euros)
Total costs diabetic mellitus ulcer (Scenario II)
0
50
100
150
200
250
N
Costs (Euros)
Total costs diabetic mellitus ulcer (Scenario III)
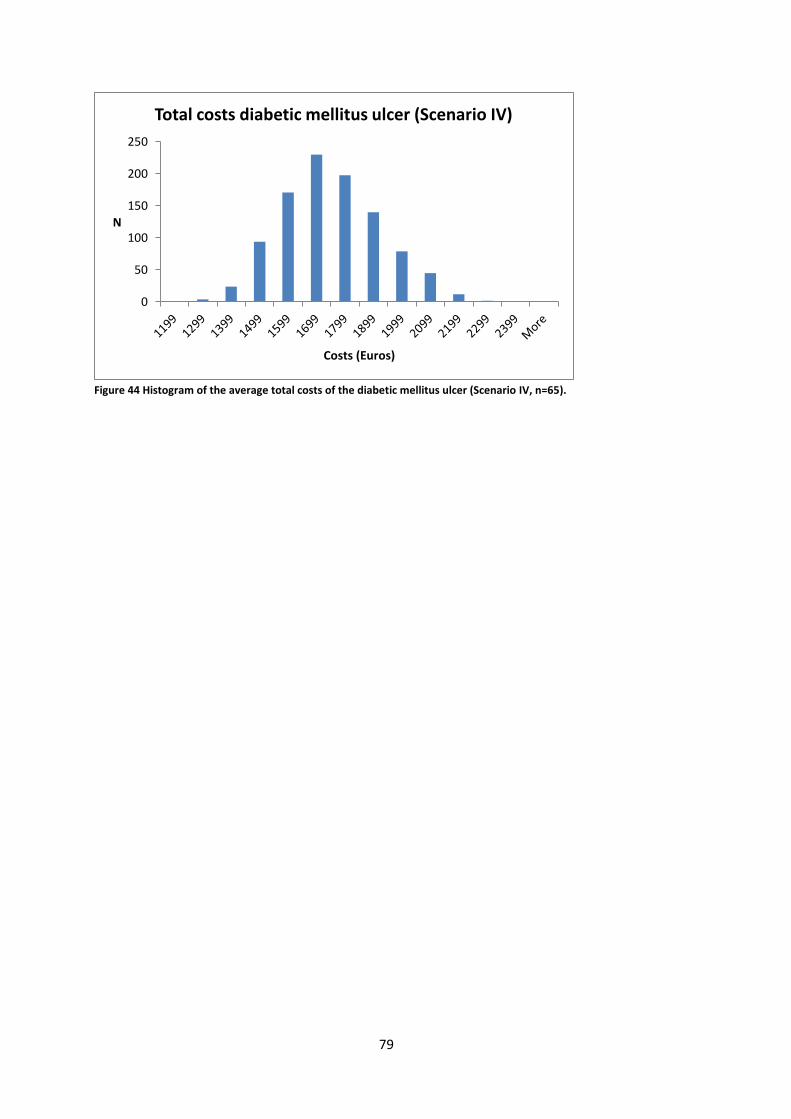
79
Figure 44 Histogram of the average total costs of the diabetic mellitus ulcer (Scenario IV, n=65).
0
50
100
150
200
250
N
Costs (Euros)
Total costs diabetic mellitus ulcer (Scenario IV)
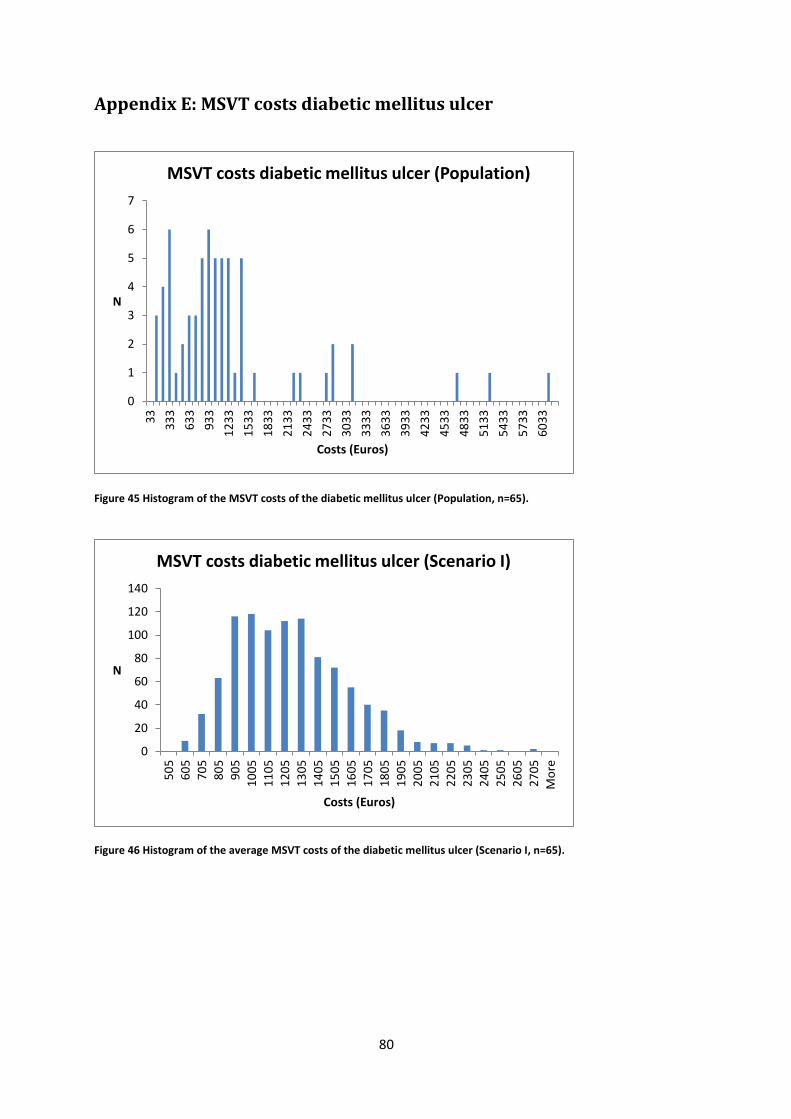
80
Appendix E: MSVT costs diabetic mellitus ulcer
Figure 45 Histogram of the MSVT costs of the diabetic mellitus ulcer (Population, n=65).
Figure 46 Histogram of the average MSVT costs of the diabetic mellitus ulcer (Scenario I, n=65).
0
1
2
3
4
5
6
7
33
33
3
63
3
93
3
12
33
15
33
18
33
21
33
24
33
27
33
30
33
33
33
36
33
39
33
42
33
45
33
48
33
51
33
54
33
57
33
60
33
N
Costs (Euros)
MSVT costs diabetic mellitus ulcer (Population)
0
20
40
60
80
100
120
140
50
5
60
5
70
5
80
5
90
5
10
05
11
05
12
05
13
05
14
05
15
05
16
05
17
05
18
05
19
05
20
05
21
05
22
05
23
05
24
05
25
05
26
05
27
05
Mo
re
N
Costs (Euros)
MSVT costs diabetic mellitus ulcer (Scenario I)
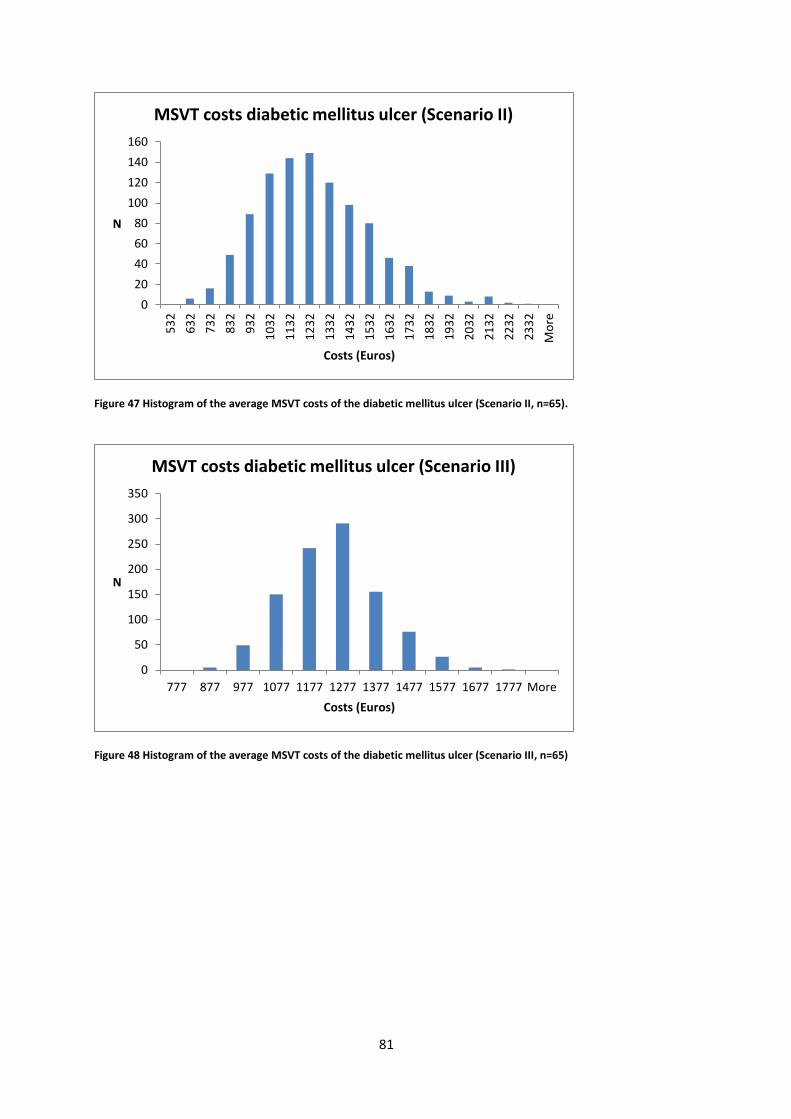
81
Figure 47 Histogram of the average MSVT costs of the diabetic mellitus ulcer (Scenario II, n=65).
Figure 48 Histogram of the average MSVT costs of the diabetic mellitus ulcer (Scenario III, n=65)
0
20
40
60
80
100
120
140
160
53
2
63
2
73
2
83
2
93
2
10
32
11
32
12
32
13
32
14
32
15
32
16
32
17
32
18
32
19
32
20
32
21
32
22
32
23
32
Mo
re
N
Costs (Euros)
MSVT costs diabetic mellitus ulcer (Scenario II)
0
50
100
150
200
250
300
350
777 877 977 1077 1177 1277 1377 1477 1577 1677 1777 More
N
Costs (Euros)
MSVT costs diabetic mellitus ulcer (Scenario III)
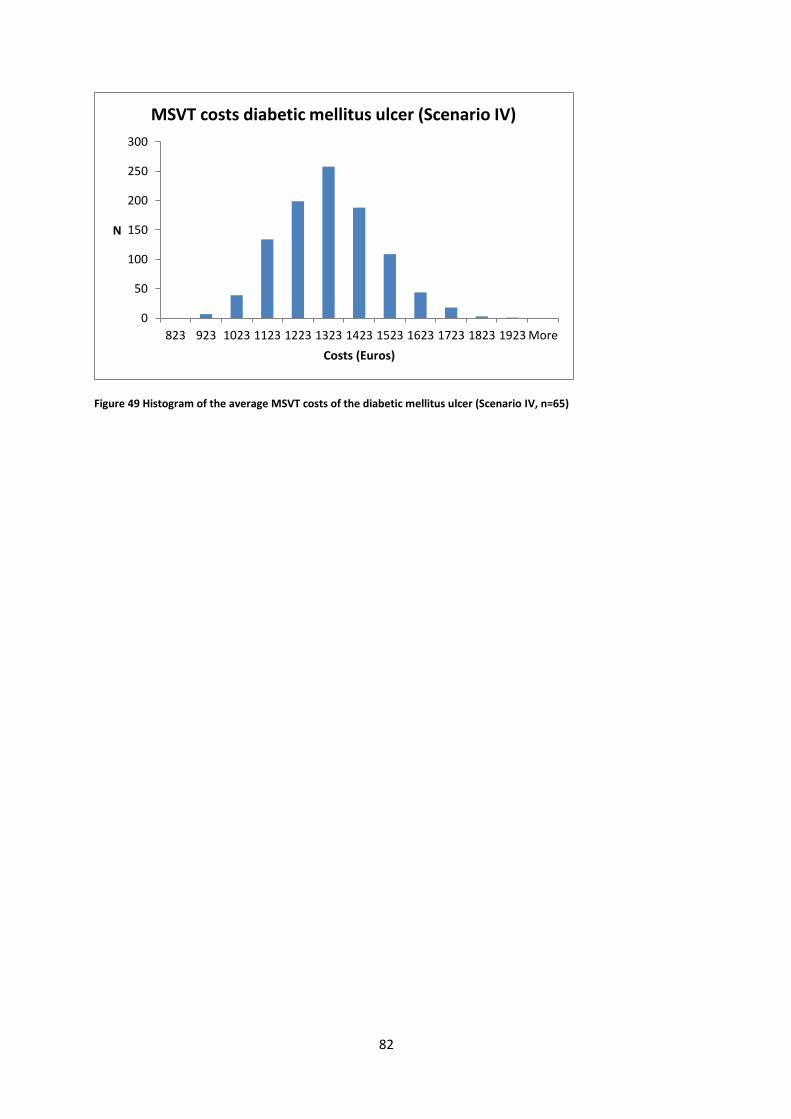
82
Figure 49 Histogram of the average MSVT costs of the diabetic mellitus ulcer (Scenario IV, n=65)
0
50
100
150
200
250
300
823 923 1023 1123 1223 1323 1423 1523 1623 1723 1823 1923 More
N
Costs (Euros)
MSVT costs diabetic mellitus ulcer (Scenario IV)
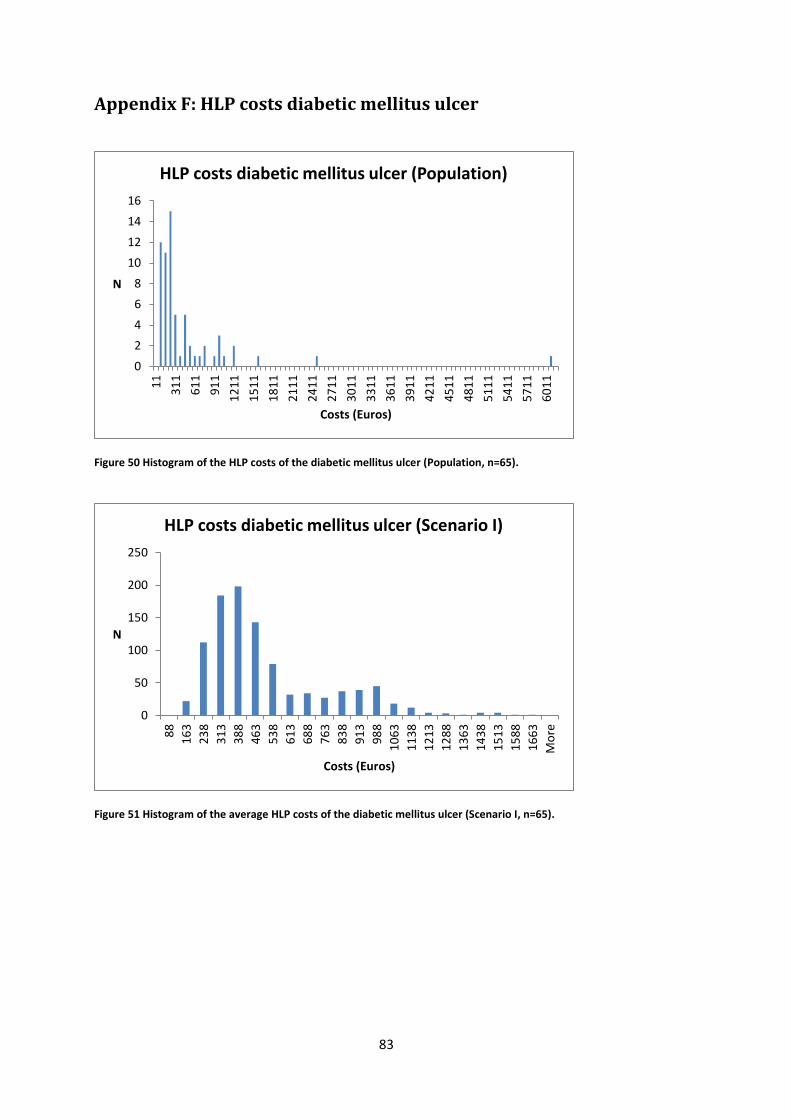
83
Appendix F: HLP costs diabetic mellitus ulcer
Figure 50 Histogram of the HLP costs of the diabetic mellitus ulcer (Population, n=65).
Figure 51 Histogram of the average HLP costs of the diabetic mellitus ulcer (Scenario I, n=65).
0
2
4
6
8
10
12
14
16
11
31
1
61
1
91
1
12
11
15
11
18
11
21
11
24
11
27
11
30
11
33
11
36
11
39
11
42
11
45
11
48
11
51
11
54
11
57
11
60
11
N
Costs (Euros)
HLP costs diabetic mellitus ulcer (Population)
0
50
100
150
200
250
88
16
3
23
8
31
3
38
8
46
3
53
8
61
3
68
8
76
3
83
8
91
3
98
8
10
63
11
38
12
13
12
88
13
63
14
38
15
13
15
88
16
63
Mo
re
N
Costs (Euros)
HLP costs diabetic mellitus ulcer (Scenario I)

84
Figure 52 Histogram of the average HLP costs of the diabetic mellitus ulcer (Scenario II, n=65).
Figure 53 Histogram of the average HLP costs of the diabetic mellitus ulcer (Scenario III, n=65).
0
50
100
150
200
250
10
6
18
1
25
6
33
1
40
6
48
1
55
6
63
1
70
6
78
1
85
6
93
1
10
06
10
81
11
56
12
31
13
06
13
81
14
56
15
31
Mo
re
N
Costs (Euros)
HLP costs diabetic mellitus ulcer (Scenario II)
0
50
100
150
200
250
300
350
244 319 394 469 544 619 694 769 844 919 More
N
Costs (Euros)
HLP costs diabetic mellitus ulcer (Scenario III)

85
Figure 54 Histogram of the average HLP costs of the diabetic mellitus ulcer (Scenario IV, n=65).
0
50
100
150
200
250
300
350
400
211 286 361 436 511 586 661 736 More
N
Costs (Euros)
HLP costs diabetic mellitus ulcer (Scenario IV)
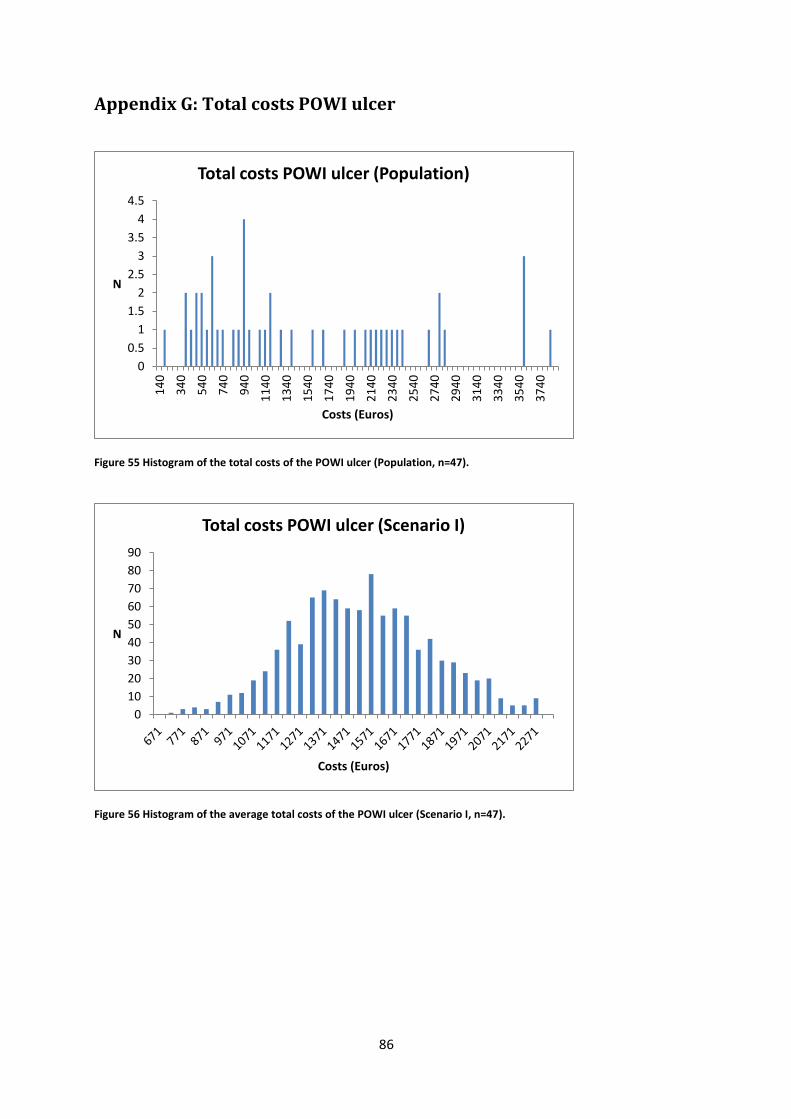
86
Appendix G: Total costs POWI ulcer
Figure 55 Histogram of the total costs of the POWI ulcer (Population, n=47).
Figure 56 Histogram of the average total costs of the POWI ulcer (Scenario I, n=47).
0
0.5
1
1.5
2
2.5
3
3.5
4
4.5
14
0
34
0
54
0
74
0
94
0
11
40
13
40
15
40
17
40
19
40
21
40
23
40
25
40
27
40
29
40
31
40
33
40
35
40
37
40
N
Costs (Euros)
Total costs POWI ulcer (Population)
0
10
20
30
40
50
60
70
80
90
N
Costs (Euros)
Total costs POWI ulcer (Scenario I)
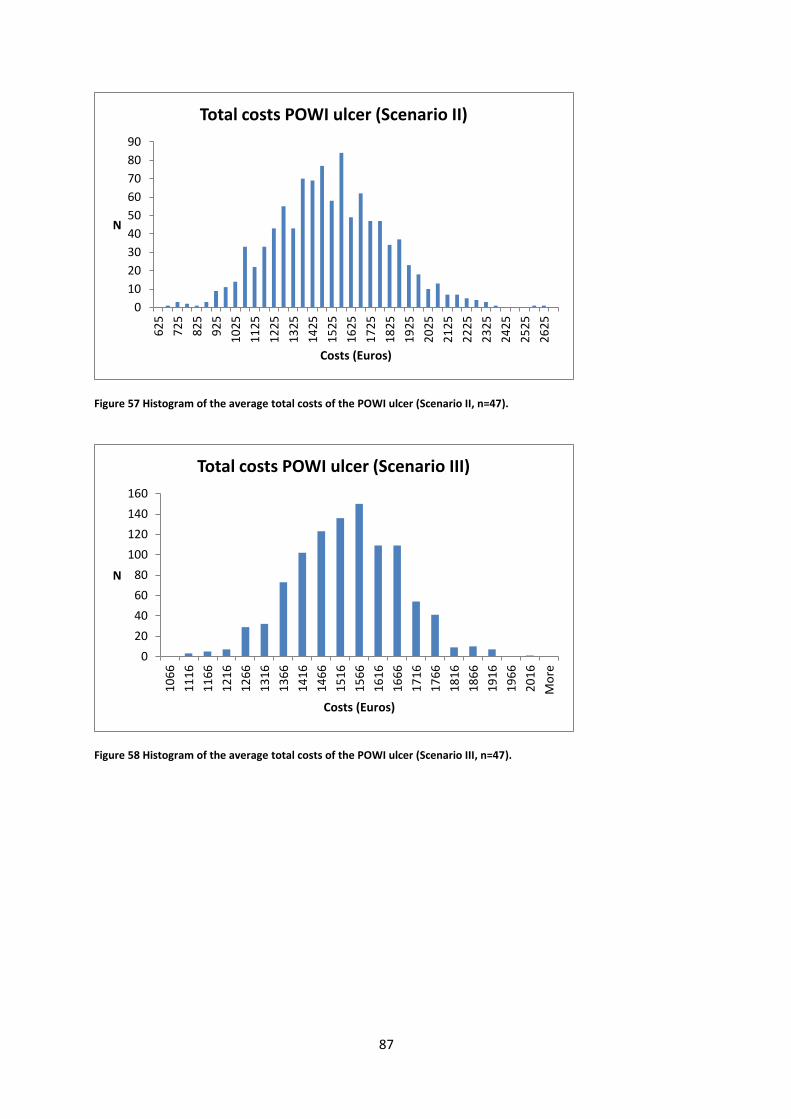
87
Figure 57 Histogram of the average total costs of the POWI ulcer (Scenario II, n=47).
Figure 58 Histogram of the average total costs of the POWI ulcer (Scenario III, n=47).
0
10
20
30
40
50
60
70
80
906
25
72
5
82
5
92
5
10
25
11
25
12
25
13
25
14
25
15
25
16
25
17
25
18
25
19
25
20
25
21
25
22
25
23
25
24
25
25
25
26
25
N
Costs (Euros)
Total costs POWI ulcer (Scenario II)
0
20
40
60
80
100
120
140
160
10
66
11
16
11
66
12
16
12
66
13
16
13
66
14
16
14
66
15
16
15
66
16
16
16
66
17
16
17
66
18
16
18
66
19
16
19
66
20
16
Mo
re
N
Costs (Euros)
Total costs POWI ulcer (Scenario III)

88
Figure 59 Histogram of the average total costs of the POWI ulcer (Scenario IV, n=47).
0
20
40
60
80
100
120
140
160
12
27
12
77
13
27
13
77
14
27
14
77
15
27
15
77
16
27
16
77
17
27
17
77
18
27
18
77
19
27
19
77
20
27
20
77
21
27
21
77
Mo
re
N
Costs (Euros)
Total costs POWI ulcer (Scenario IV)
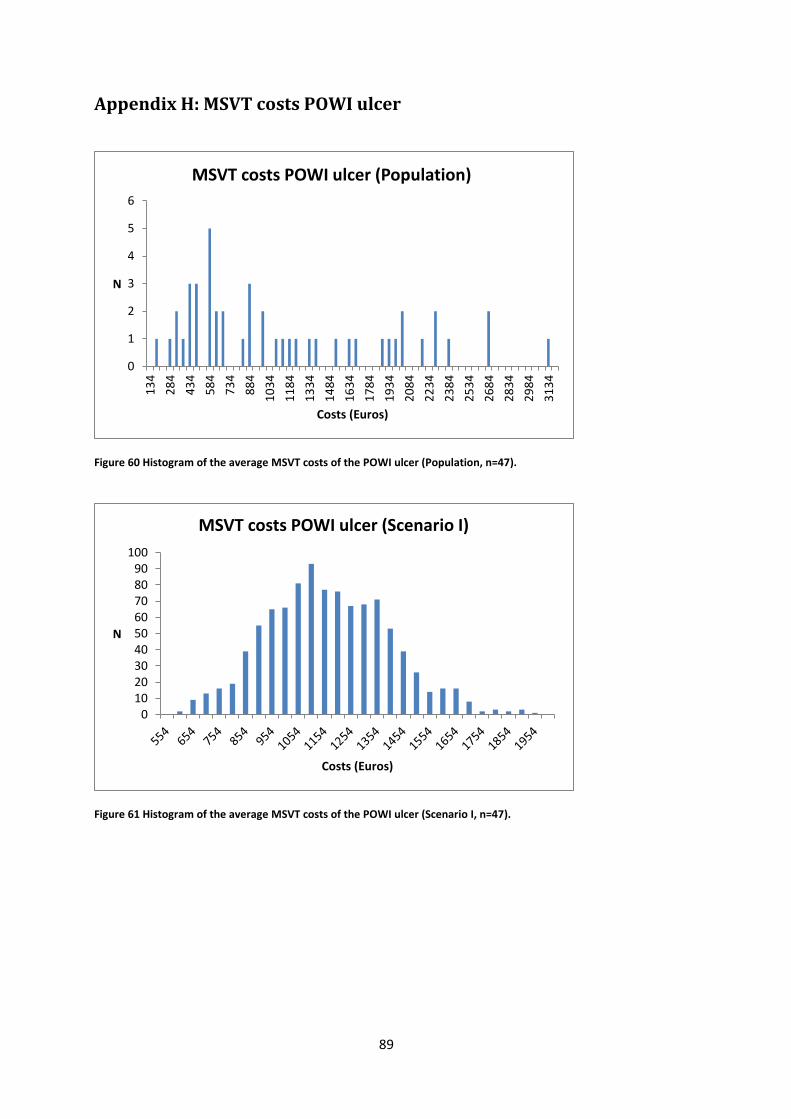
89
Appendix H: MSVT costs POWI ulcer
Figure 60 Histogram of the average MSVT costs of the POWI ulcer (Population, n=47).
Figure 61 Histogram of the average MSVT costs of the POWI ulcer (Scenario I, n=47).
0
1
2
3
4
5
6
13
4
28
4
43
4
58
4
73
4
88
4
10
34
11
84
13
34
14
84
16
34
17
84
19
34
20
84
22
34
23
84
25
34
26
84
28
34
29
84
31
34
N
Costs (Euros)
MSVT costs POWI ulcer (Population)
0102030405060708090
100
N
Costs (Euros)
MSVT costs POWI ulcer (Scenario I)
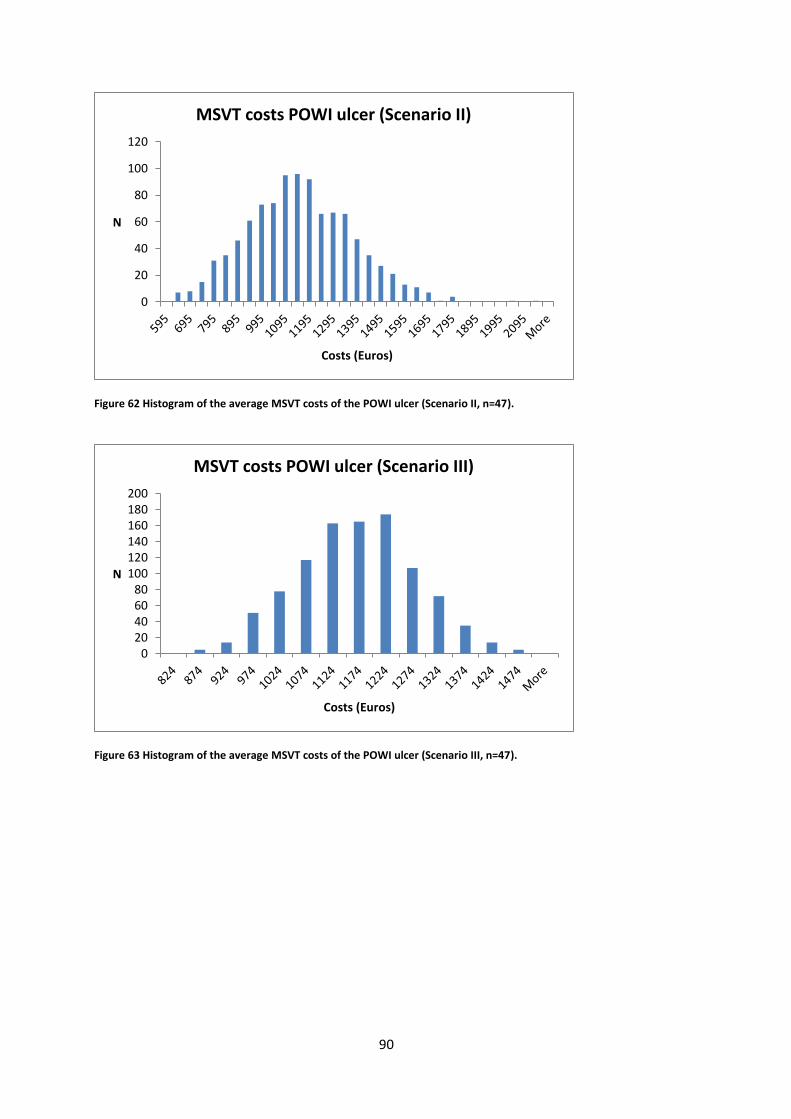
90
Figure 62 Histogram of the average MSVT costs of the POWI ulcer (Scenario II, n=47).
Figure 63 Histogram of the average MSVT costs of the POWI ulcer (Scenario III, n=47).
0
20
40
60
80
100
120
N
Costs (Euros)
MSVT costs POWI ulcer (Scenario II)
020406080
100120140160180200
N
Costs (Euros)
MSVT costs POWI ulcer (Scenario III)
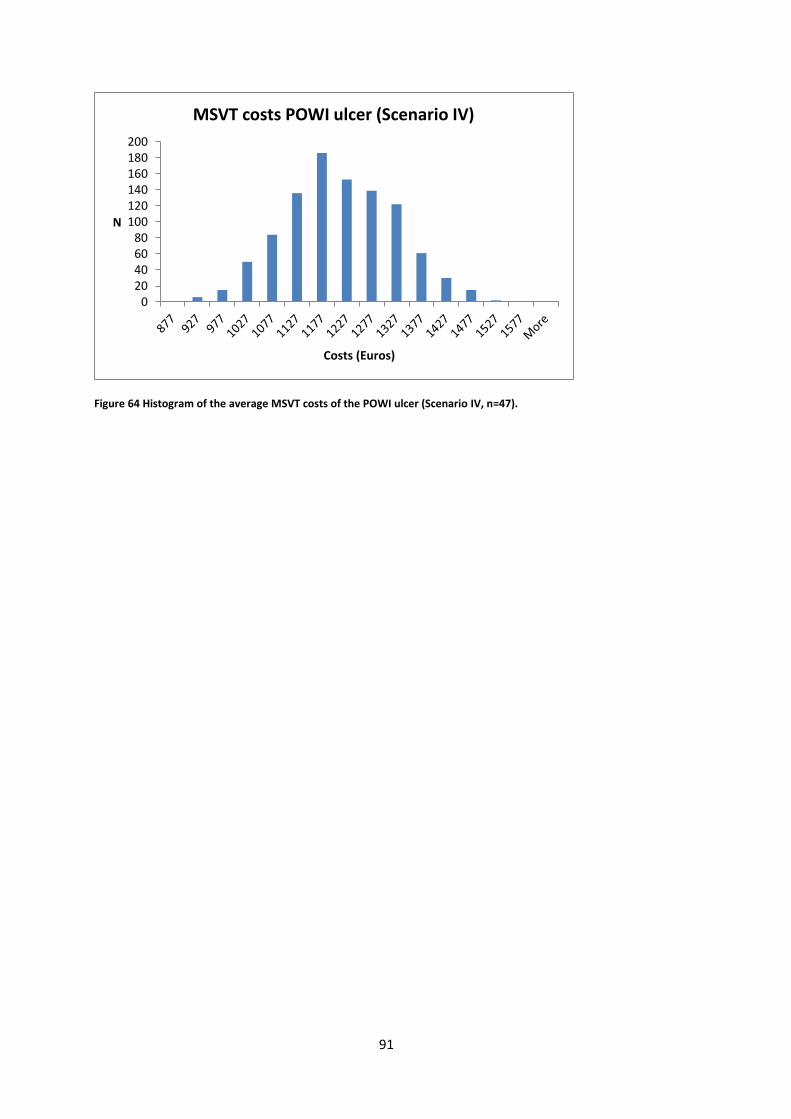
91
Figure 64 Histogram of the average MSVT costs of the POWI ulcer (Scenario IV, n=47).
020406080
100120140160180200
N
Costs (Euros)
MSVT costs POWI ulcer (Scenario IV)

92
Appendix I: HLP costs POWI ulcer
Figure 65 Histogram of the HLP costs of the POWI ulcer (Population, n=47).
Figure 66 Histogram of the average HLP costs of the POWI ulcer (Scenario I, n=47).
0
1
2
3
4
5
6
7
6
96
18
6
27
6
36
6
45
6
54
6
63
6
72
6
81
6
90
6
99
6
10
86
11
76
12
66
13
56
14
46
15
36
16
26
17
16
N
Costs (Euros)
HLP costs POWI ulcer (Population)
0
20
40
60
80
100
120
N
Costs (Euros)
HLP costs POWI ulcer (Scenario I)
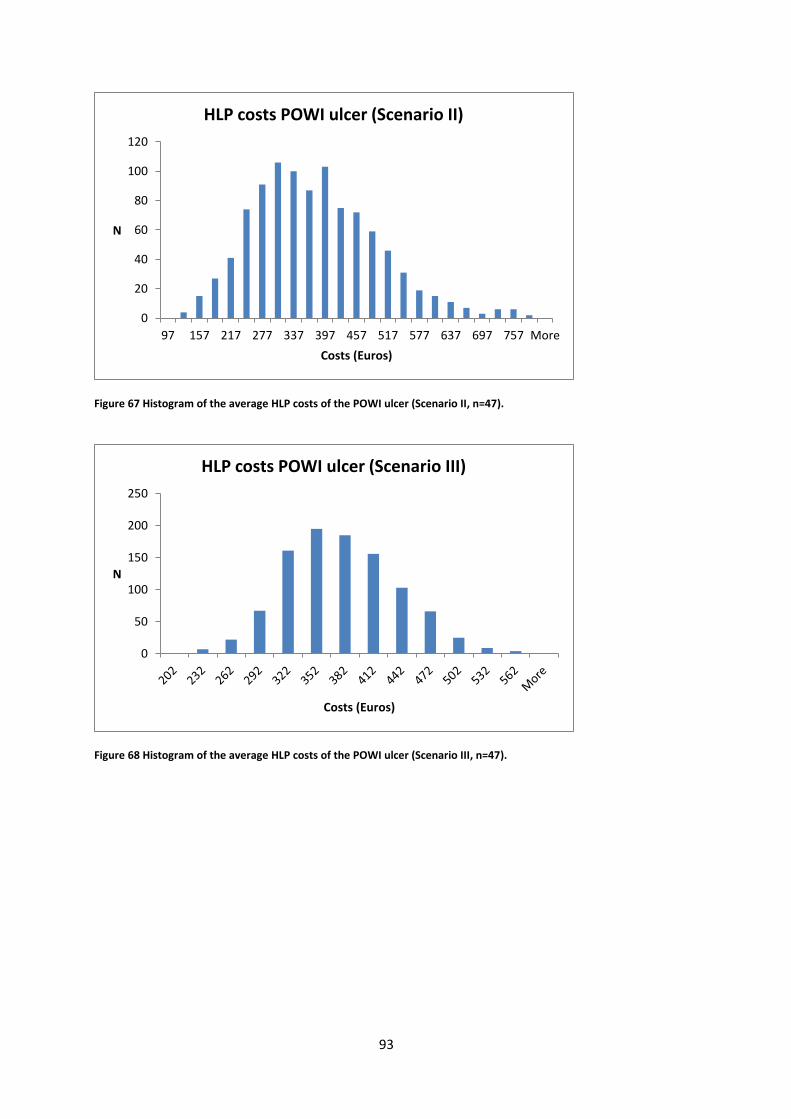
93
Figure 67 Histogram of the average HLP costs of the POWI ulcer (Scenario II, n=47).
Figure 68 Histogram of the average HLP costs of the POWI ulcer (Scenario III, n=47).
0
20
40
60
80
100
120
97 157 217 277 337 397 457 517 577 637 697 757 More
N
Costs (Euros)
HLP costs POWI ulcer (Scenario II)
0
50
100
150
200
250
N
Costs (Euros)
HLP costs POWI ulcer (Scenario III)

94
Figure 69 Histogram of the average HLP costs of the POWI ulcer (Scenario IV, n=47).
0
50
100
150
200
250
N
Costs (Euros)
HLP costs POWI ulcer (Scenario IV)

95
Appendix J: Total costs pressure ulcer
Figure 70 Histogram of the total costs of the pressure ulcer (Population, n=29).
Figure 71 Histogram of the average total costs of the pressure ulcer (Scenario I, n=29).
0
0.5
1
1.5
2
2.5
3
3.5
18
5
48
5
78
5
10
85
13
85
16
85
19
85
22
85
25
85
28
85
31
85
34
85
37
85
40
85
43
85
46
85
49
85
52
85
55
85
58
85
61
85
64
85
67
85
N
Costs (Euros)
Total costs pressure ulcer (Population)
0
10
20
30
40
50
60
70
80
90
N
Costs (Euros)
Total costs pressure ulcer (Scenario I)

96
Figure 72 Histogram of the average total costs of the pressure ulcer (Scenario II, n=29).
Figure 73 Histogram of the average total costs of the pressure ulcer (Scenario III, n=29).
0
10
20
30
40
50
60
705
59
75
9
95
9
11
59
13
59
15
59
17
59
19
59
21
59
23
59
25
59
27
59
29
59
31
59
33
59
35
59
37
59
39
59
41
59
43
59
N
Costs (Euros)
Total costs pressure ulcer (Scenario II)
0
20
40
60
80
100
120
140
11
02
12
02
13
02
14
02
15
02
16
02
17
02
18
02
19
02
20
02
21
02
22
02
23
02
24
02
25
02
26
02
27
02
28
02
29
02
30
02
31
02
32
02
Mo
re
N
Costs (Euros)
Total costs pressure ulcer (Scenario III)
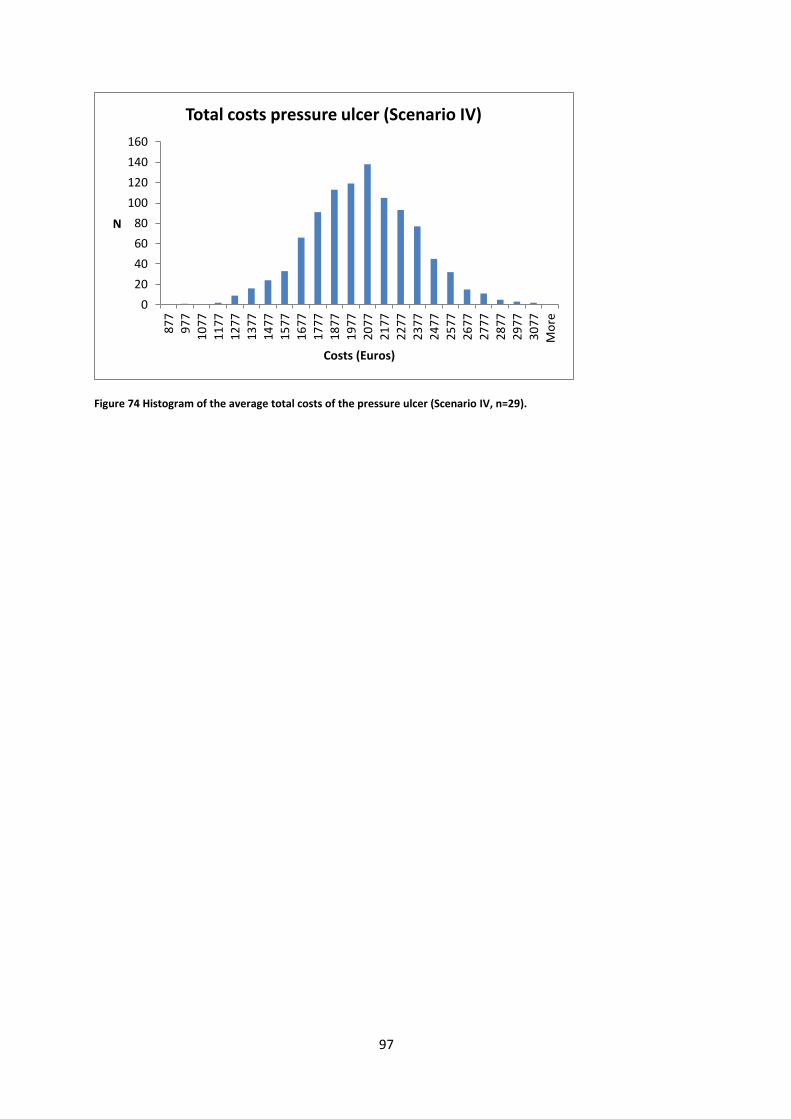
97
Figure 74 Histogram of the average total costs of the pressure ulcer (Scenario IV, n=29).
0
20
40
60
80
100
120
140
160
87
7
97
7
10
77
11
77
12
77
13
77
14
77
15
77
16
77
17
77
18
77
19
77
20
77
21
77
22
77
23
77
24
77
25
77
26
77
27
77
28
77
29
77
30
77
Mo
re
N
Costs (Euros)
Total costs pressure ulcer (Scenario IV)

98
Appendix K: MSVT costs pressure ulcer
Figure 75 Histogram of the MSVT costs of the pressure ulcer (Population, n=29).
Figure 76 Histogram of the average MSVT costs of the pressure ulcer (Scenario I, n=29).
0
0.5
1
1.5
2
2.5
3
3.5
N
Costs (Euros)
MSVT costs pressure ulcer (Population)
0
20
40
60
80
100
120
N
Costs (Euros)
MSVT costs pressure ulcer (Scenario I)

99
Figure 77 Histogram of the average MSVT costs of the pressure ulcer (Scenario I, n=29).
Figure 78 Histogram of the average MSVT costs of the pressure ulcer (Scenario III, n=29).
0
10
20
30
40
50
60
70
80
90
N
Costs (Euros)
MSVT costs pressure ulcer (Scenario II)
0
20
40
60
80
100
120
140
160
180
N
Costs (Euros)
MSVT costs pressure ulcer (Scenario III)

100
Figure 79 Histogram of the average MSVT costs of the pressure ulcer (Scenario IV, n=29).
0
50
100
150
200
250
N
Costs (Euros)
MSVT costs pressure ulcer (Scenario IV)

101
Appendix L: HLP costs pressure ulcer
Figure 80 Histogram of the HLP costs of the pressure ulcer (Population, n=29).
Figure 81 Histogram of the average HLP costs of the pressure ulcer (Scenario I, n=29).
0
1
2
3
4
5
6
7
12
11
2
21
2
31
2
41
2
51
2
61
2
71
2
81
2
91
2
10
12
11
12
12
12
13
12
14
12
15
12
16
12
17
12
18
12
19
12
Mo
re
N
Costs (Euros)
HLP costs pressure ulcer (Population)
0
20
40
60
80
100
120
140
160
74
12
4
17
4
22
4
27
4
32
4
37
4
42
4
47
4
52
4
57
4
62
4
67
4
72
4
77
4
82
4
87
4
92
4
Mo
re
N
Costs (Euros)
HLP costs pressure ulcer (Scenario I)
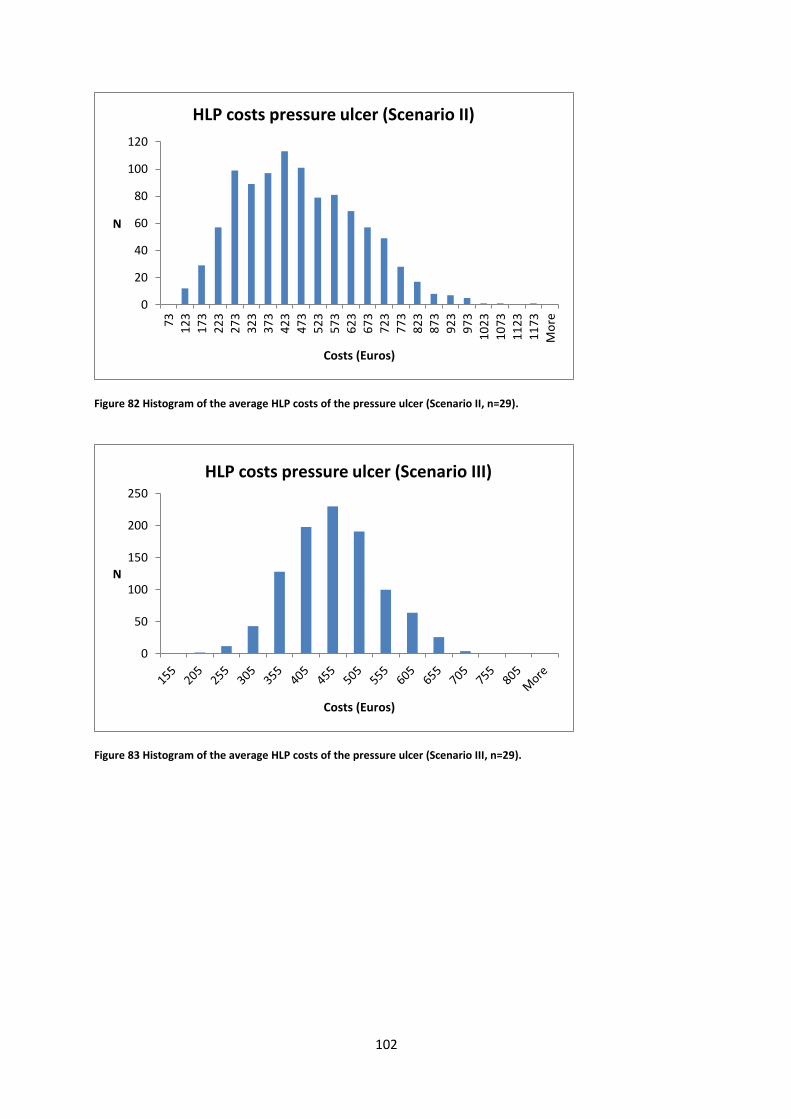
102
Figure 82 Histogram of the average HLP costs of the pressure ulcer (Scenario II, n=29).
Figure 83 Histogram of the average HLP costs of the pressure ulcer (Scenario III, n=29).
0
20
40
60
80
100
120
73
12
3
17
3
22
3
27
3
32
3
37
3
42
3
47
3
52
3
57
3
62
3
67
37
23
77
3
82
3
87
3
92
3
97
3
10
23
10
73
11
23
11
73
Mo
re
N
Costs (Euros)
HLP costs pressure ulcer (Scenario II)
0
50
100
150
200
250
N
Costs (Euros)
HLP costs pressure ulcer (Scenario III)

103
Figure 84 Histogram of the average HLP costs of the pressure ulcer (Scenario IV, n=29).
020406080
100120140160180200
N
Costs (Euros)
HLP costs pressure ulcer (Scenario IV)

104
Appendix M: Total costs surgical wound
Figure 85 Histogram of the total costs of the surgical wound (Population, n=55).
Figure 86 Histogram of the average total costs of the surgical wound (Scenario I, n=55).
0
1
2
3
4
5
6
86
48
6
88
6
12
86
16
86
20
86
24
86
28
86
32
86
36
86
40
86
44
86
48
86
52
86
56
86
60
86
64
86
68
86
72
86
76
86
N
Costs (Euros)
Total costs surgical wound (Population)
0
20
40
60
80
100
120
N
Costs (Euros)
Totcal costs surgical wound (Scenario I)

105
Figure 87 Histogram of the average total costs of the surgical wound (Scenario II, n=55).
Figure 88 Histogram of the average total costs of the surgical wound (Scenario III, n=55).
0
20
40
60
80
100
120
661 861 1061 1261 1461 1661 1861 2061 2261 2461 2661 2861 3061
N
Costs (Euros)
Total costs surgical wound (Scenario II)
0
50
100
150
200
250
N
Costs (Euros)
Total costs surgical wound (Scenario III)
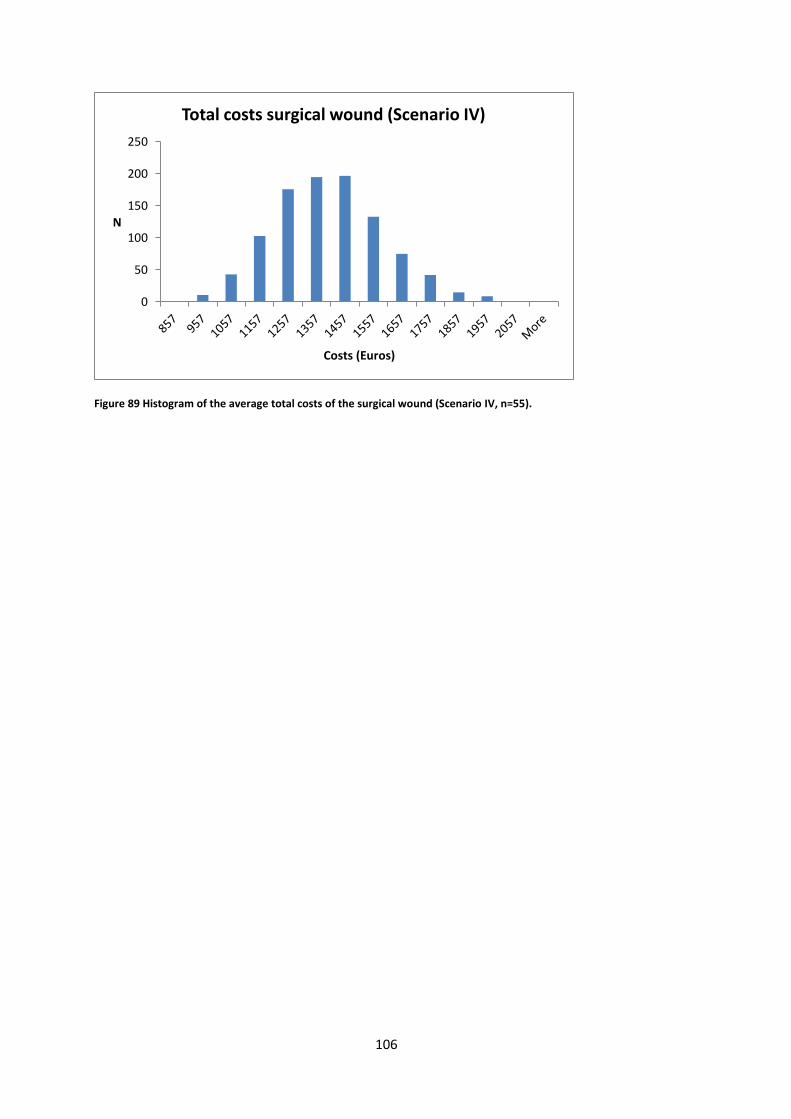
106
Figure 89 Histogram of the average total costs of the surgical wound (Scenario IV, n=55).
0
50
100
150
200
250
N
Costs (Euros)
Total costs surgical wound (Scenario IV)

107
Appendix N: MSVT costs surgical wound
Figure 90 Histogram of the MSVT costs of the surgical wound (Population, n=55).
Figure 91 Histogram of the average MSVT costs of the surgical wound (Scenario I, n=55).
0
1
2
3
4
5
6
7
33
33
3
63
3
93
3
12
33
15
33
18
33
21
33
24
33
27
33
30
33
33
33
36
33
39
33
42
33
45
33
48
33
51
33
54
33
57
33
60
33
Mo
re
N
Costs (Euros)
MSVT costs surgical wound (Population)
0
20
40
60
80
100
120
140
370 570 770 970 1170 1370 1570 1770 1970 2170 2370 2570 2770
N
Costs (Euros)
MSVT costs surgical wound (Scenario I)

108
Figure 92 Histogram of the average MSVT costs of the surgical wound (Scenario II, n=55).
Figure 93 Histogram of the average MSVT costs of the surgical wound (Scenario III, n=55).
0
20
40
60
80
100
120
140
54
5
64
5
74
5
84
5
94
5
10
45
11
45
12
45
13
45
14
45
15
45
16
45
17
45
18
45
19
45
20
45
21
45
22
45
23
45
24
45
25
45
Mo
re
N
Costs (Euros)
MSVT costs surgical wound (Scenario II)
0
50
100
150
200
250
300
725 825 925 1025 1125 1225 1325 1425 1525 1625 1725 More
N
Costs (Euros)
MSVT costs surgical wound (Scenario III)
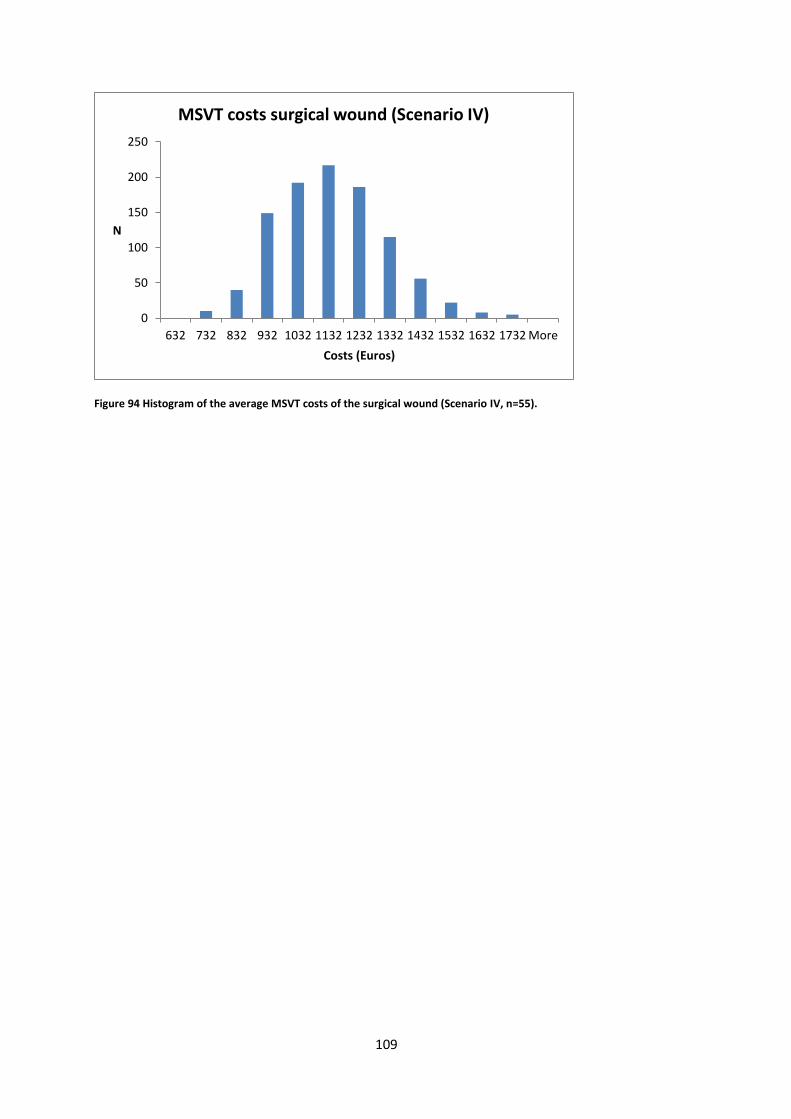
109
Figure 94 Histogram of the average MSVT costs of the surgical wound (Scenario IV, n=55).
0
50
100
150
200
250
632 732 832 932 1032 1132 1232 1332 1432 1532 1632 1732 More
N
Costs (Euros)
MSVT costs surgical wound (Scenario IV)

110
Appendix O: HLP costs surgical wound
Figure 95 Histogram of the HLP costs of the surgical wound (Population, n=55).
Figure 96 Histogram of the average HLP costs of the surgical wound (Scenario I, n=55).
0
2
4
6
8
10
12
6
10
6
20
6
30
6
40
6
50
6
60
6
70
6
80
6
90
6
10
06
11
06
12
06
13
06
14
06
15
06
16
06
17
06
18
06
Mo
re
N
Costs (Euros)
HLP costs surgical wound (Population)
020406080
100120140160180200
N
Costs (Euros)
HLP costs Surgical wound (Scenario I)
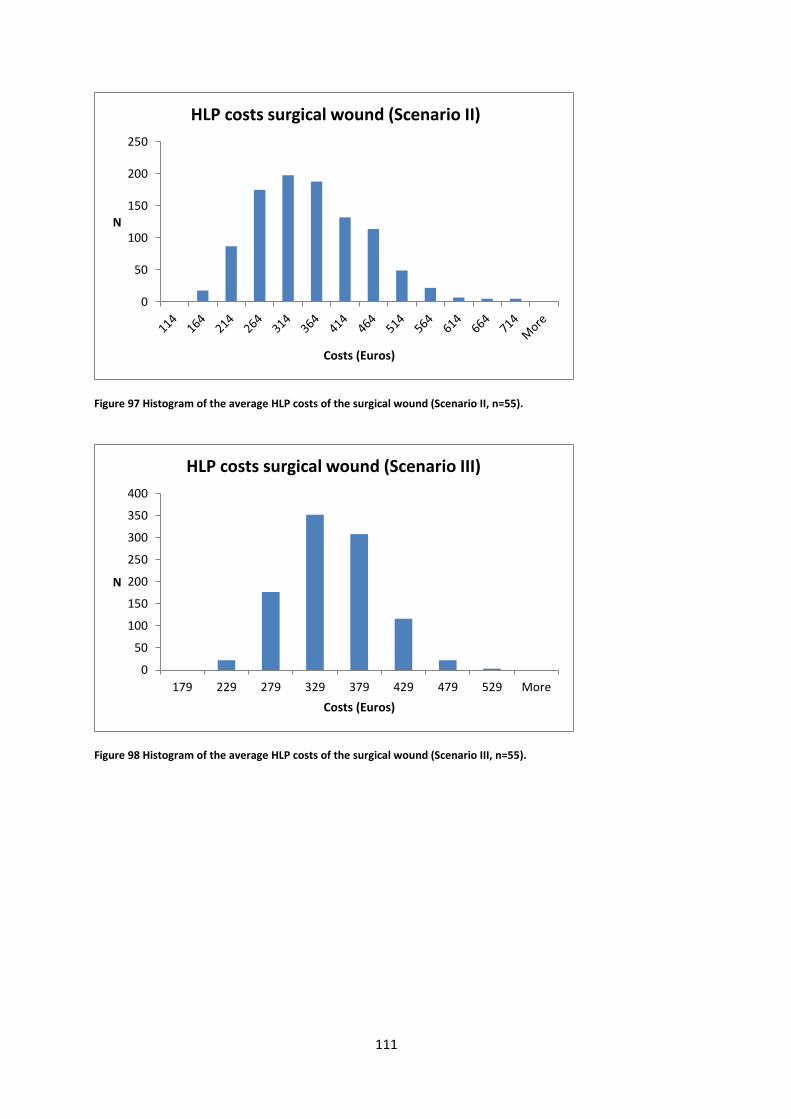
111
Figure 97 Histogram of the average HLP costs of the surgical wound (Scenario II, n=55).
Figure 98 Histogram of the average HLP costs of the surgical wound (Scenario III, n=55).
0
50
100
150
200
250
N
Costs (Euros)
HLP costs surgical wound (Scenario II)
0
50
100
150
200
250
300
350
400
179 229 279 329 379 429 479 529 More
N
Costs (Euros)
HLP costs surgical wound (Scenario III)

112
Figure 99 Histogram of the average HLP costs of the surgical wound (Scenario IV, n=55).
0
50
100
150
200
250
300
350
400
450
178 228 278 328 378 428 478 528 More
N
Costs (Euros)
HLP costs surgical wound (Scenario IV)
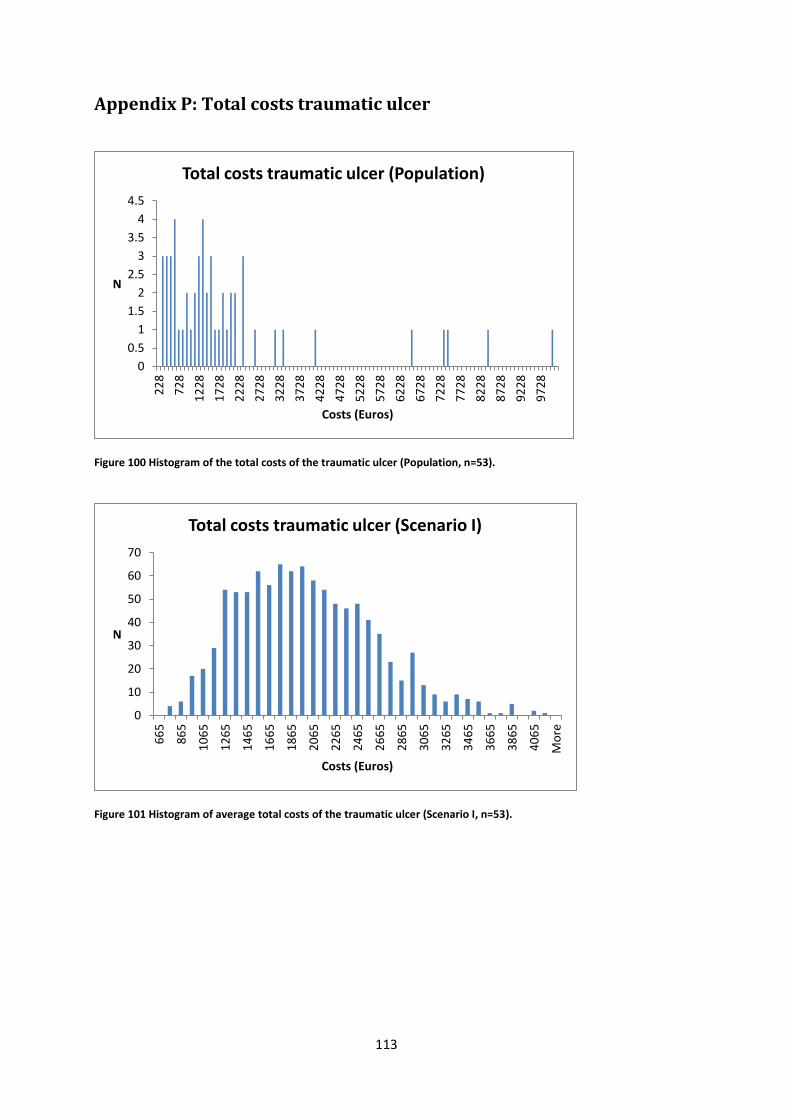
113
Appendix P: Total costs traumatic ulcer
Figure 100 Histogram of the total costs of the traumatic ulcer (Population, n=53).
Figure 101 Histogram of average total costs of the traumatic ulcer (Scenario I, n=53).
0
0.5
1
1.5
2
2.5
3
3.5
4
4.5
22
8
72
8
12
28
17
28
22
28
27
28
32
28
37
28
42
28
47
28
52
28
57
28
62
28
67
28
72
28
77
28
82
28
87
28
92
28
97
28
N
Costs (Euros)
Total costs traumatic ulcer (Population)
0
10
20
30
40
50
60
70
66
5
86
5
10
65
12
65
14
65
16
65
18
65
20
65
22
65
24
65
26
65
28
65
30
65
32
65
34
65
36
65
38
65
40
65
Mo
re
N
Costs (Euros)
Total costs traumatic ulcer (Scenario I)

114
Figure 102 Histogram of the average total costs of the traumatic ulcer (Scenario II, n=53).
Figure 103 Histogram of the average total costs of the traumatic ulcer (Scenario III, n=53).
0
10
20
30
40
50
60
70
80
907
59
95
9
11
59
13
59
15
59
17
59
19
59
21
59
23
59
25
59
27
59
29
59
31
59
33
59
35
59
37
59
39
59
41
59
N
Costs (Euros)
Total costs traumatic ulcer (Scenario II)
0
20
40
60
80
100
120
140
160
12
76
13
76
14
76
15
76
16
76
17
76
18
76
19
76
20
76
21
76
22
76
23
76
24
76
25
76
26
76
27
76
28
76
29
76
Mo
re
N
Costs (Euros)
Total costs traumatic ulcer (Scenario III)

115
Figure 104 Histogram of the average total costs of the traumatic ulcer (Scenario IV, n=53).
0
20
40
60
80
100
120
140
160
180
11
26
12
26
13
26
14
26
15
26
16
26
17
26
18
26
19
26
20
26
21
26
22
26
23
26
24
26
25
26
26
26
27
26
Mo
re
N
Costs (Euros)
Total costs traumatic ulcer (Scenario IV)
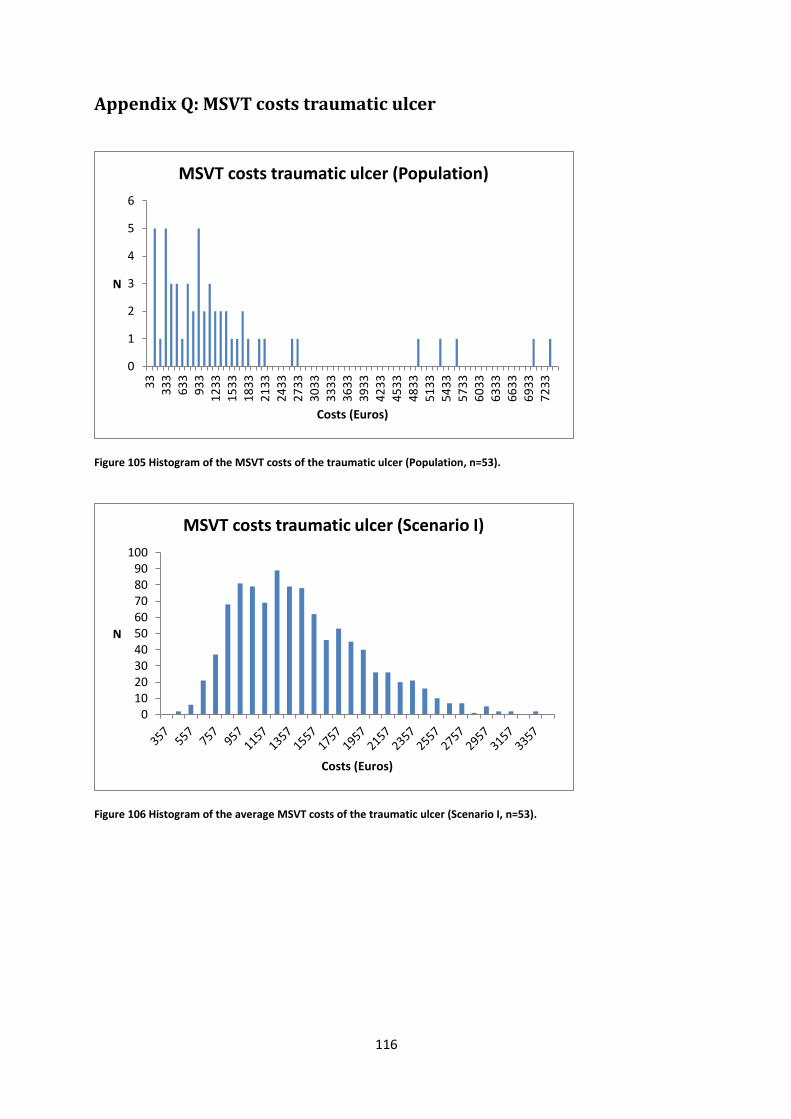
116
Appendix Q: MSVT costs traumatic ulcer
Figure 105 Histogram of the MSVT costs of the traumatic ulcer (Population, n=53).
Figure 106 Histogram of the average MSVT costs of the traumatic ulcer (Scenario I, n=53).
0
1
2
3
4
5
6
33
33
36
33
93
31
23
31
53
31
83
32
13
32
43
32
73
33
03
33
33
33
63
33
93
34
23
34
53
34
83
35
13
35
43
35
73
36
03
36
33
36
63
36
93
37
23
3
N
Costs (Euros)
MSVT costs traumatic ulcer (Population)
0102030405060708090
100
N
Costs (Euros)
MSVT costs traumatic ulcer (Scenario I)
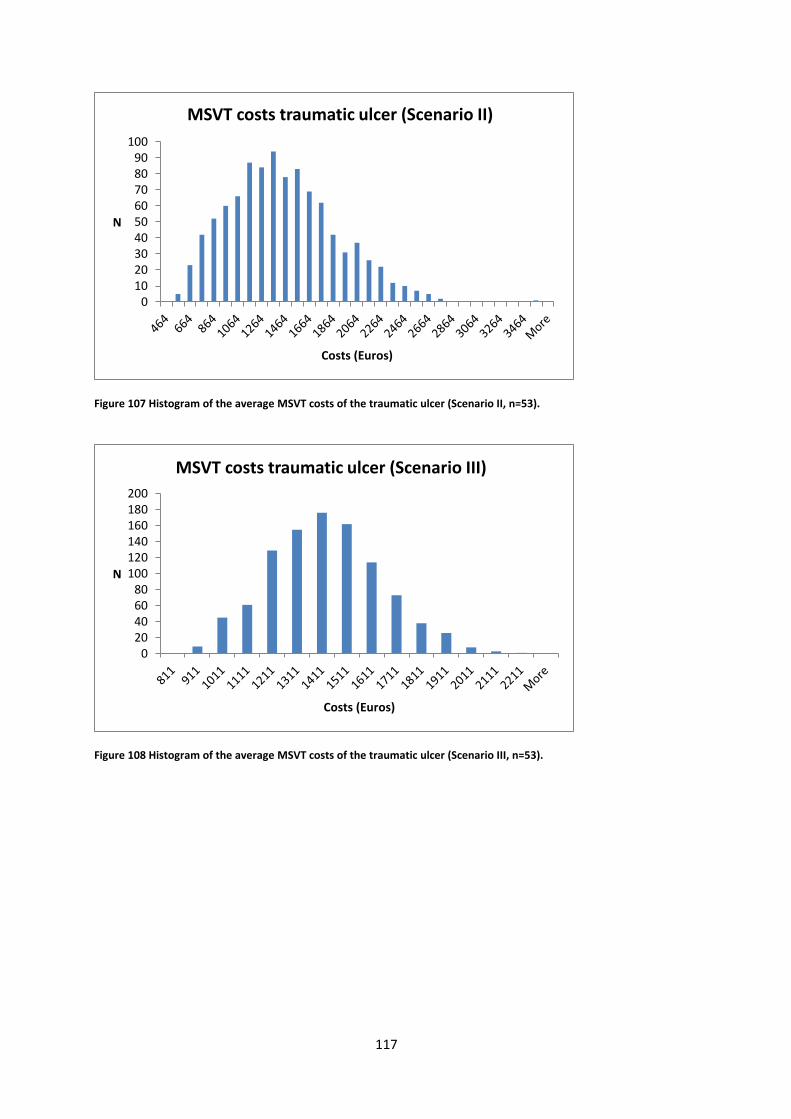
117
Figure 107 Histogram of the average MSVT costs of the traumatic ulcer (Scenario II, n=53).
Figure 108 Histogram of the average MSVT costs of the traumatic ulcer (Scenario III, n=53).
0102030405060708090
100
N
Costs (Euros)
MSVT costs traumatic ulcer (Scenario II)
020406080
100120140160180200
N
Costs (Euros)
MSVT costs traumatic ulcer (Scenario III)
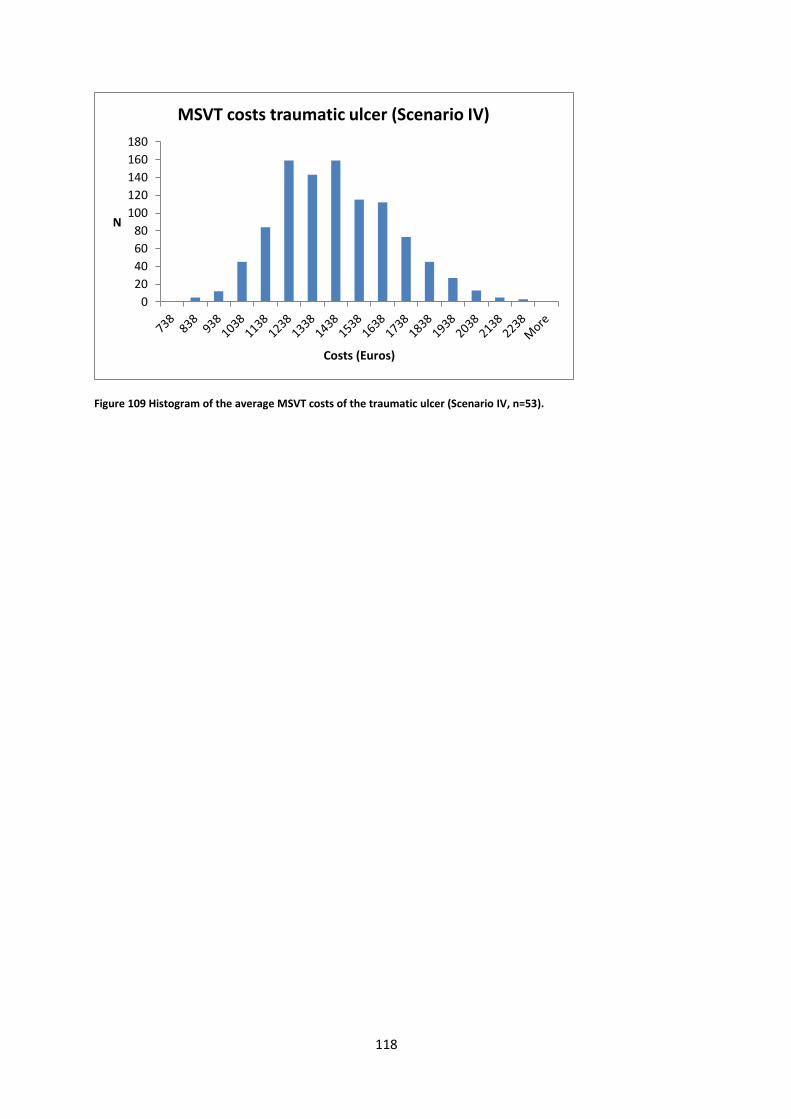
118
Figure 109 Histogram of the average MSVT costs of the traumatic ulcer (Scenario IV, n=53).
0
20
40
60
80
100
120
140
160
180
N
Costs (Euros)
MSVT costs traumatic ulcer (Scenario IV)

119
Appendix R: HLP costs traumatic ulcer
Figure 110 Histogram of the HLP costs of the traumatic ulcer (Population, n=53).
Figure 111 Histogram of the average HLP costs of the traumatic ulcer (Scenario I, n=53).
0123456789
10
60
28
5
51
0
73
5
96
0
11
85
14
10
16
35
18
60
20
85
23
10
25
35
27
60
29
85
32
10
34
35
36
60
38
85
Mo
re
N
Costs (Euros)
HLP costs traumatic ulcer (Population)
0
20
40
60
80
100
120
140
160
22
5
30
0
37
5
45
0
52
5
60
0
67
5
75
0
82
5
90
0
97
5
10
50
11
25
12
00
12
75
13
50
14
25
15
00
15
75
16
50
17
25
18
00
Mo
re
N
Costs (Euros)
HLP costs traumatic ulcer (Scenario I)

120
Figure 112 Histogram of the average HLP costs of the traumatic ulcer (Scenario II, n=53).
Figure 113 Histogram of the average HLP costs of the traumatic ulcer (Scenario III, n=53).
020406080
100120140160180200
19
5
27
0
34
5
42
0
49
5
57
0
64
5
72
0
79
5
87
0
94
5
10
20
10
95
11
70
12
45
13
20
13
95
14
70
15
45
16
20
16
95
17
70
Mo
re
N
Costs (Euros)
HLP costs traumatic ulcer (Scenario II)
0
50
100
150
200
250
300
350
301 376 451 526 601 676 751 826 901 976 More
N
Costs (Euros)
HLP costs traumatic ulcer (Scenario III)
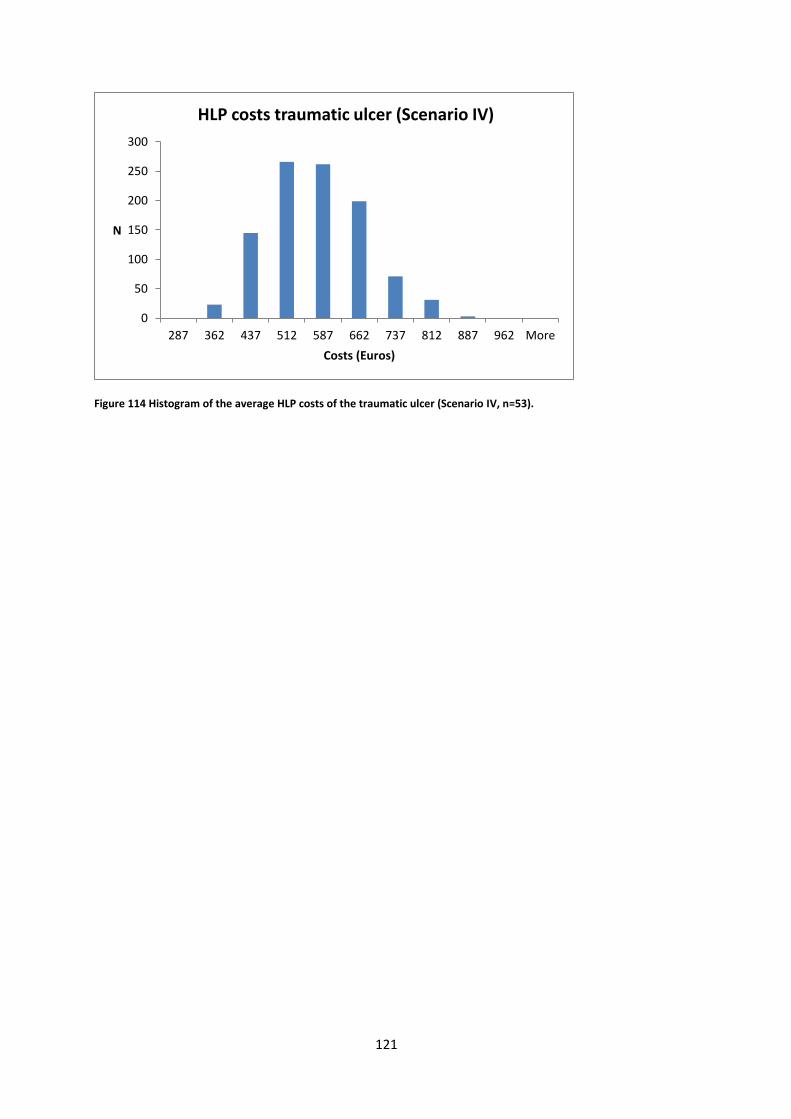
121
Figure 114 Histogram of the average HLP costs of the traumatic ulcer (Scenario IV, n=53).
0
50
100
150
200
250
300
287 362 437 512 587 662 737 812 887 962 More
N
Costs (Euros)
HLP costs traumatic ulcer (Scenario IV)

122
Appendix S: Total costs venous ulcer
Figure 115 Histogram of the total costs of the venous ulcer (Population, n=22).
Figure 116 Histogram of the average total costs of the venous ulcer (Scenario I, n=22).
0
0.5
1
1.5
2
2.5
3
3.5
43
5
10
35
16
35
22
35
28
35
34
35
40
35
46
35
52
35
58
35
64
35
70
35
76
35
82
35
88
35
94
35
10
03
5
10
63
5
11
23
5
11
83
5
12
43
5
13
03
5
13
63
5
Mo
re
N
Costs (Euros)
Total costs venous ulcer (Population)
0
20
40
60
80
100
120
N
Costs (Euros)
Total costs venous ulcer (Scenario I)
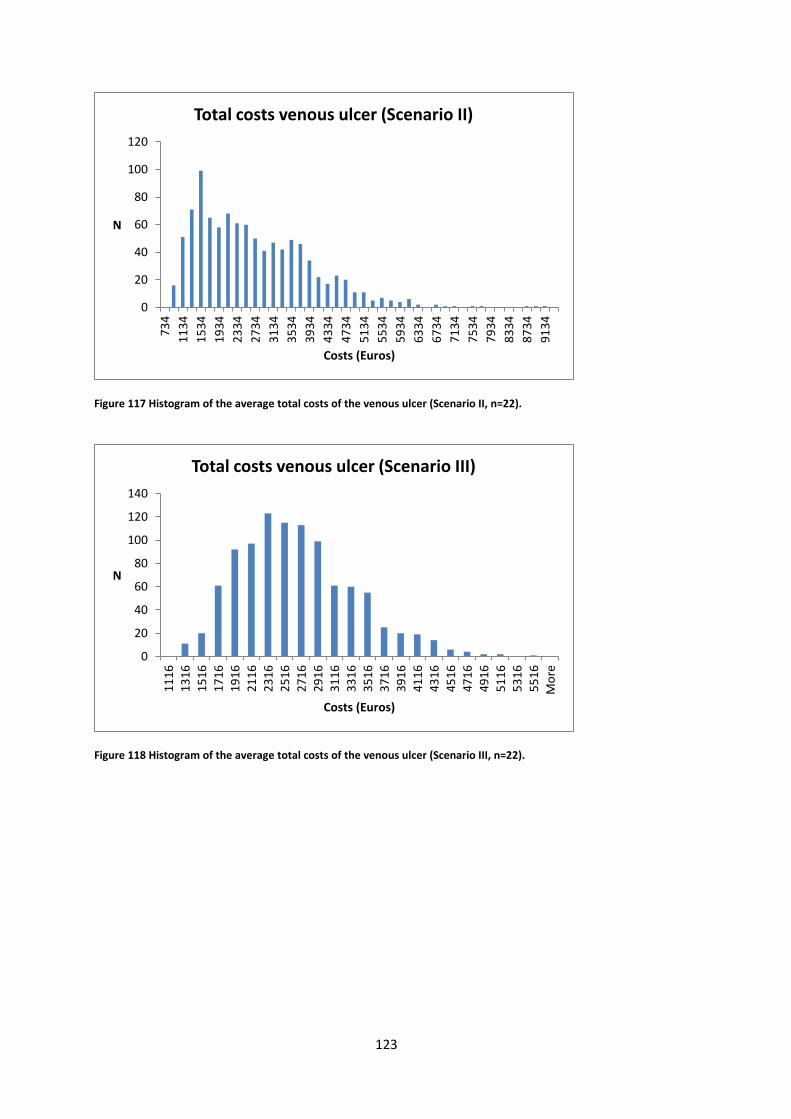
123
Figure 117 Histogram of the average total costs of the venous ulcer (Scenario II, n=22).
Figure 118 Histogram of the average total costs of the venous ulcer (Scenario III, n=22).
0
20
40
60
80
100
120
73
4
11
34
15
34
19
34
23
34
27
34
31
34
35
34
39
34
43
34
47
34
51
34
55
34
59
34
63
34
67
34
71
34
75
34
79
34
83
34
87
34
91
34
N
Costs (Euros)
Total costs venous ulcer (Scenario II)
0
20
40
60
80
100
120
140
11
16
13
16
15
16
17
16
19
16
21
16
23
16
25
16
27
16
29
16
31
16
33
16
35
16
37
16
39
16
41
16
43
16
45
16
47
16
49
16
51
16
53
16
55
16
Mo
re
N
Costs (Euros)
Total costs venous ulcer (Scenario III)

124
Figure 119 Histogram of the average total costs of the venous ulcer (Scenario IV, n=22).
020406080
100120140160180200
N
Costs (Euros)
Total costs veneus ulcer (Scenario IV)

125
Appendix T: MSVT costs venous ulcer
Figure 120 Histogram of the MSVT costs of the venous ulcer (Population, n=22).
Figure 121 Histogram of the average MSVT costs of the venous ulcer (Scenario I, n=22).
0
1
2
3
4
5
6
7
8
N
Costs (Euros)
MSVT costs venous ulcer (Population)
0
20
40
60
80
100
120
140
160
46
1
66
1
86
1
10
61
12
61
14
61
16
61
18
61
20
61
22
61
24
61
26
61
28
61
30
61
32
61
34
61
36
61
Mo
re
N
Costs (Euros)
MSVT costs venous ulcer (Scenario I)
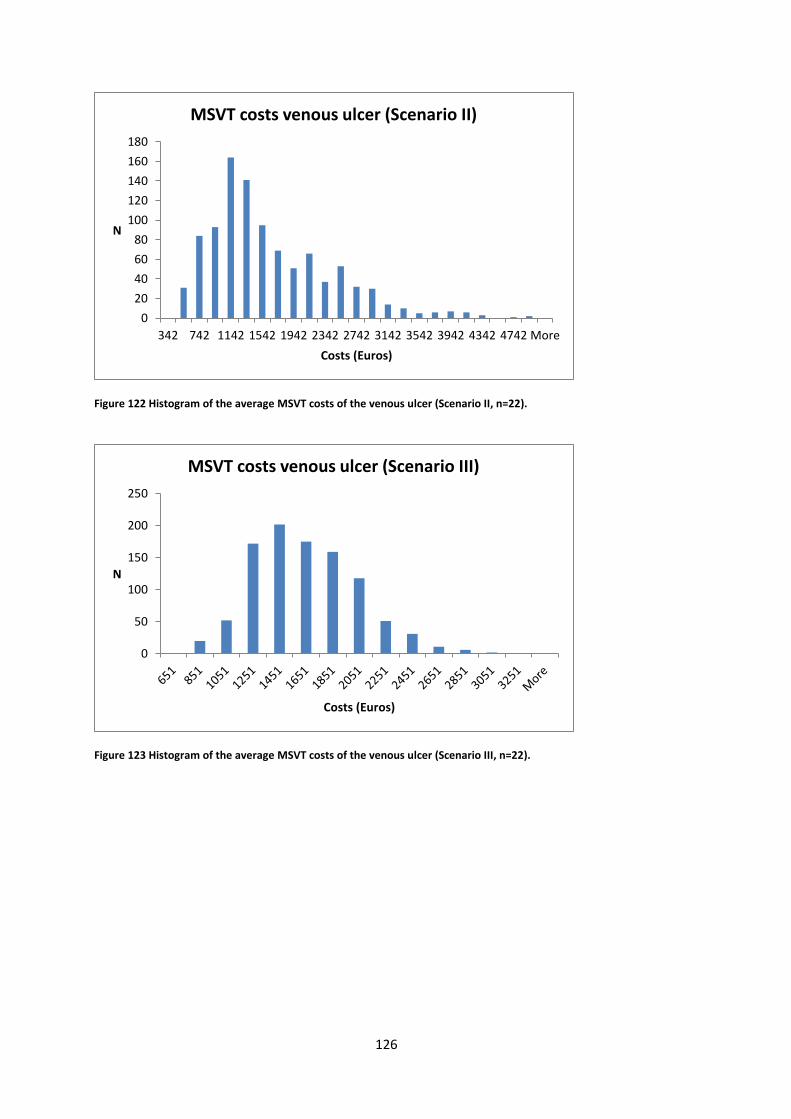
126
Figure 122 Histogram of the average MSVT costs of the venous ulcer (Scenario II, n=22).
Figure 123 Histogram of the average MSVT costs of the venous ulcer (Scenario III, n=22).
0
20
40
60
80
100
120
140
160
180
342 742 1142 1542 1942 2342 2742 3142 3542 3942 4342 4742 More
N
Costs (Euros)
MSVT costs venous ulcer (Scenario II)
0
50
100
150
200
250
N
Costs (Euros)
MSVT costs venous ulcer (Scenario III)
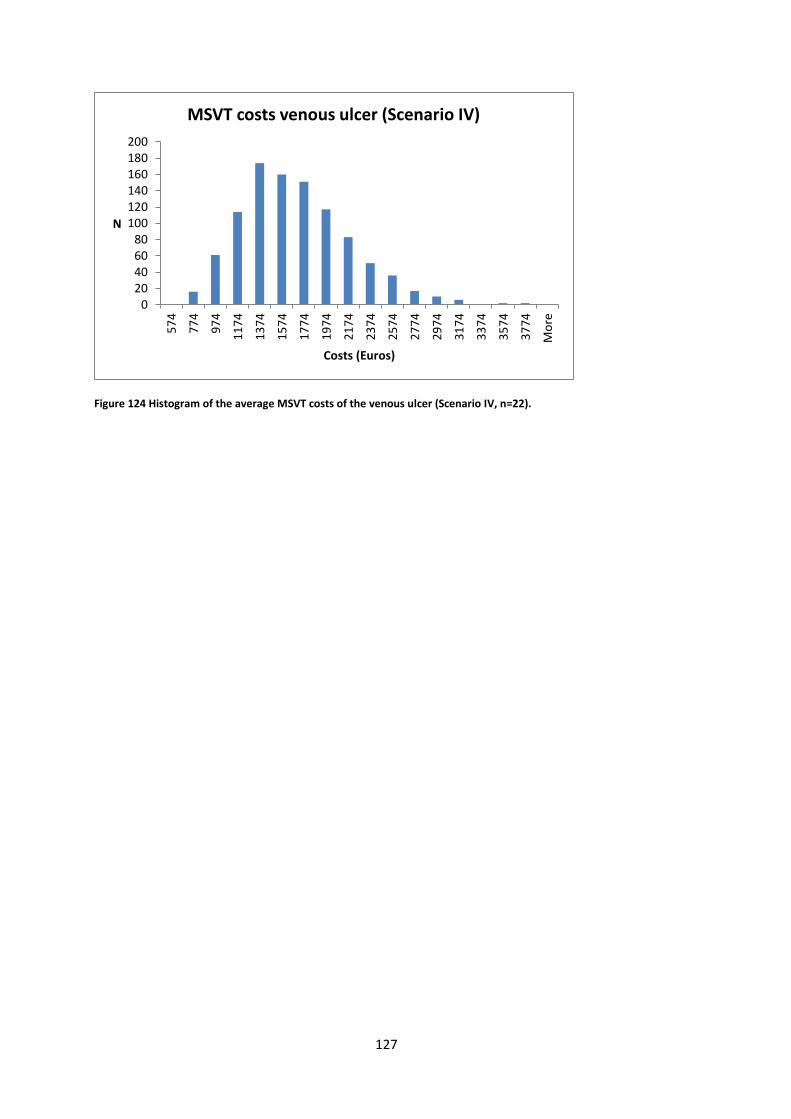
127
Figure 124 Histogram of the average MSVT costs of the venous ulcer (Scenario IV, n=22).
020406080
100120140160180200
57
4
77
4
97
4
11
74
13
74
15
74
17
74
19
74
21
74
23
74
25
74
27
74
29
74
31
74
33
74
35
74
37
74
Mo
re
N
Costs (Euros)
MSVT costs venous ulcer (Scenario IV)
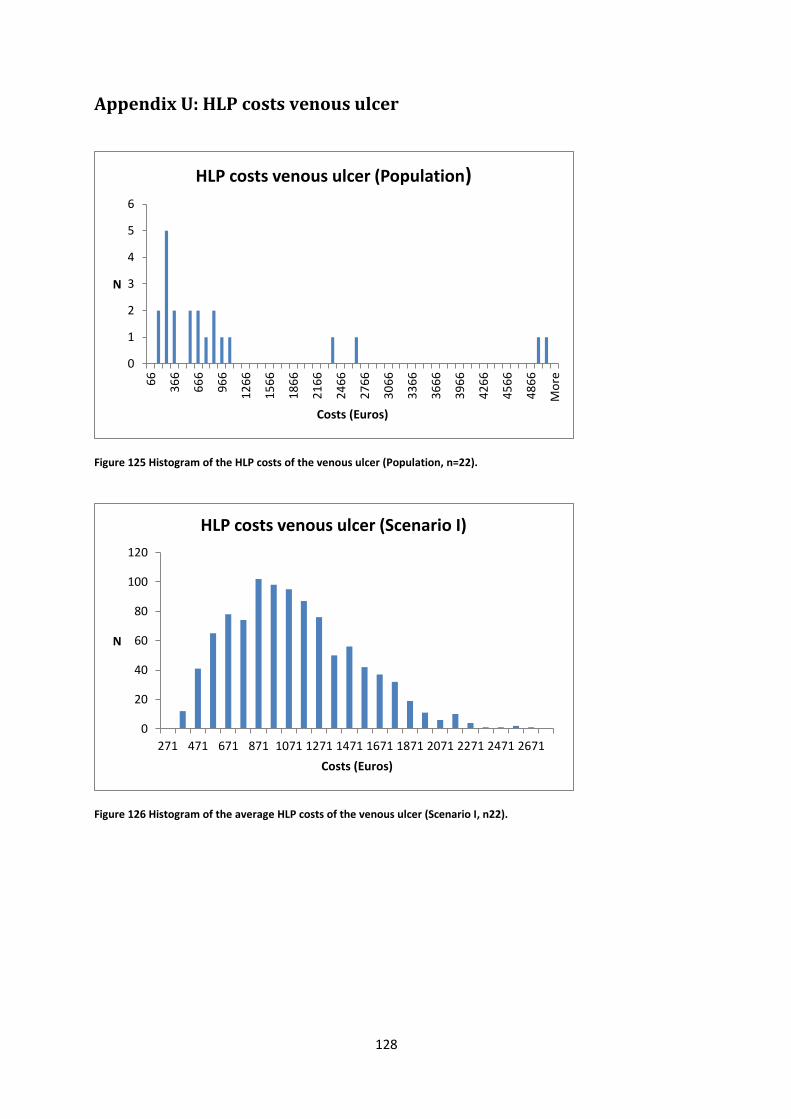
128
Appendix U: HLP costs venous ulcer
Figure 125 Histogram of the HLP costs of the venous ulcer (Population, n=22).
Figure 126 Histogram of the average HLP costs of the venous ulcer (Scenario I, n22).
0
1
2
3
4
5
6
66
36
6
66
6
96
6
12
66
15
66
18
66
21
66
24
66
27
66
30
66
33
66
36
66
39
66
42
66
45
66
48
66
Mo
re
N
Costs (Euros)
HLP costs venous ulcer (Population)
0
20
40
60
80
100
120
271 471 671 871 1071 1271 1471 1671 1871 2071 2271 2471 2671
N
Costs (Euros)
HLP costs venous ulcer (Scenario I)
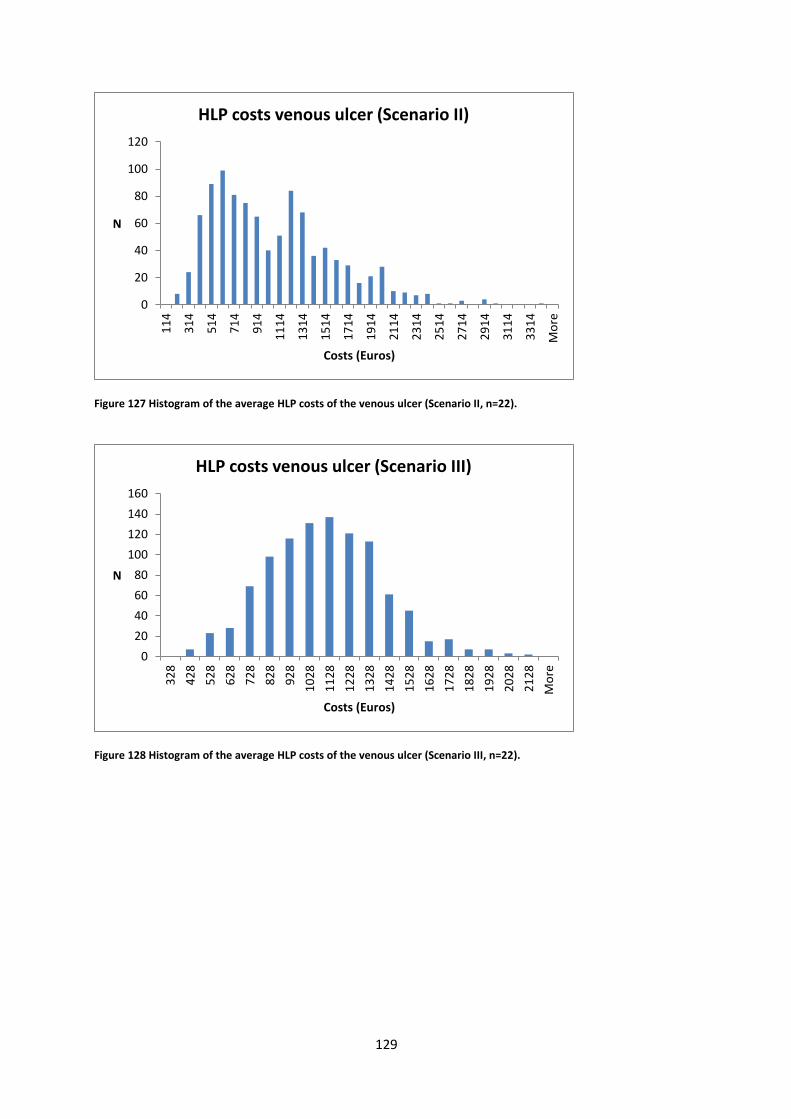
129
Figure 127 Histogram of the average HLP costs of the venous ulcer (Scenario II, n=22).
Figure 128 Histogram of the average HLP costs of the venous ulcer (Scenario III, n=22).
0
20
40
60
80
100
120
11
4
31
4
51
4
71
4
91
4
11
14
13
14
15
14
17
14
19
14
21
14
23
14
25
14
27
14
29
14
31
14
33
14
Mo
re
N
Costs (Euros)
HLP costs venous ulcer (Scenario II)
0
20
40
60
80
100
120
140
160
32
8
42
8
52
8
62
8
72
8
82
8
92
8
10
28
11
28
12
28
13
28
14
28
15
28
16
28
17
28
18
28
19
28
20
28
21
28
Mo
re
N
Costs (Euros)
HLP costs venous ulcer (Scenario III)
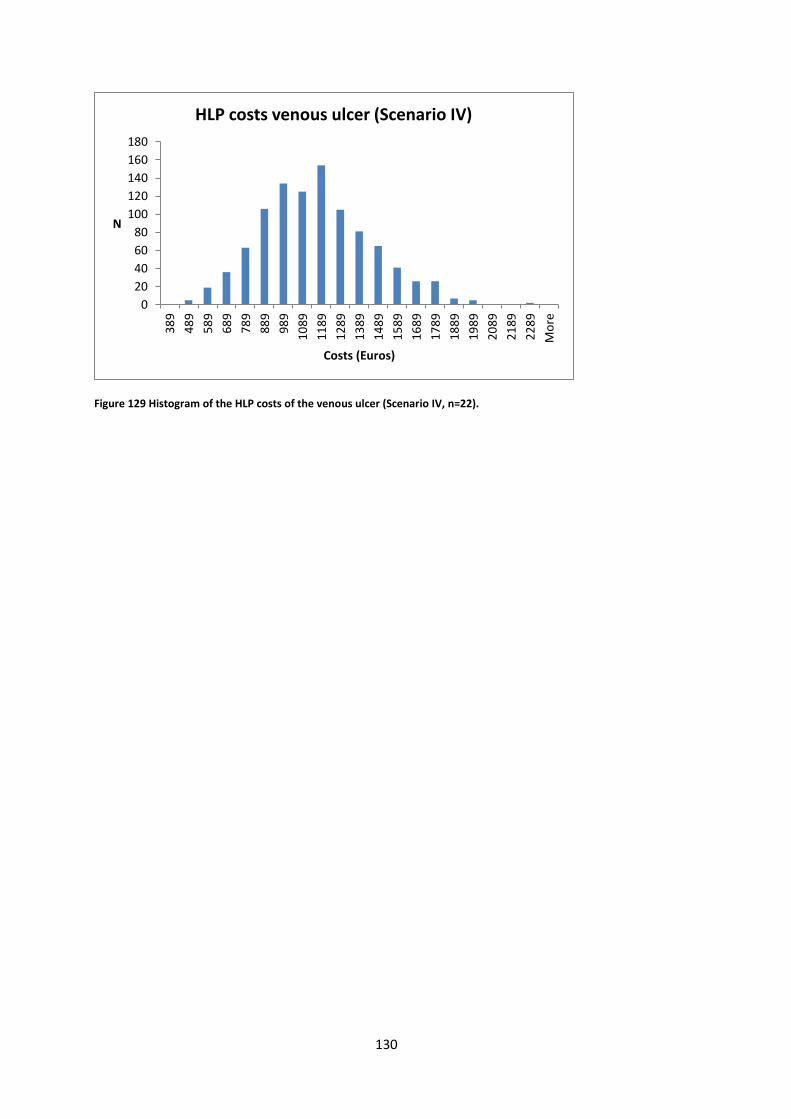
130
Figure 129 Histogram of the HLP costs of the venous ulcer (Scenario IV, n=22).
0
20
40
60
80
100
120
140
160
180
38
9
48
9
58
9
68
9
78
9
88
9
98
9
10
89
11
89
12
89
13
89
14
89
15
89
16
89
17
89
18
89
19
89
20
89
21
89
22
89
Mo
re
N
Costs (Euros)
HLP costs venous ulcer (Scenario IV)