Embed Size (px)
Citation preview

Can in-store displays improve category sales and brand market share in online stores? A study on the overall effectiveness and differences between display types in an online FMCG context
Els Breugelmans en Katia Campo
DEPARTMENT OF MARKETING AND ORGANISATION STUDIES (MO)
Faculty of Business and Economics
OR 0803

1
Can in-store displays improve category sales and brand market
share in online stores? A study on the overall effectiveness and
differences between display types in an online FMCG context
Els Breugelmans1
Maastricht University
Katia Campo
Catholic University Leuven
Keywords: in-store displays, online grocery shopping, market response analyses
AcknowledgmentsThe authors thank Bram Foubert, Els Gijsbrechts and Michael Trusov for their helpful suggestions on previousversions of this article.
1 Corresponding Author: Els Breugelmans is Assistant Professor at the Faculty of Applied EconomicSciences, Department of Marketing, Maastricht University. Address: P.O. Box 616, 6200 MDMaastricht (The Netherlands). Tel. +31433883855; Fax. +31433884918. E-mail:[email protected]
Katia Campo is Associate Professor of Marketing at the Faculty of Business and Economics of theCatholic University of Leuven. Address: Naamsestraat 69, 3000 Leuven (Belgium). Tel.+3216326819; Fax. +3216326732. E-mail: [email protected]
2
Can in-store displays improve category sales and brand market
share in online stores? A study on the overall effectiveness and
differences between display types in an online FMCG context
Abstract
Our study investigates the overall effects of in-store displays (ISD) on category sales and
brand market share in an online shopping context, and compares the differences in
effectiveness between ISD types. Using data from an online grocer, we examine three online
ISD types that match with traditional ones: first screen (entrance), banner (end-of-aisle) and
shelf tag (in-aisle) displays. Empirical results for 10 categories confirm that online ISD may
substantially increase brand market share and to a lesser extent, category sales. Our results
also demonstrate that not all types are equally effective. First screen displays clearly have the
strongest effect on market share: they benefit from their placement on the ‘entrance’ location,
central on-screen position and direct purchase link. While they only feature 1 SKU, banner
displays typically feature all SKUs of a brand, yet, are placed on border-screen positions on
traveling-zone pages without a direct purchase link. Based on our results, the advantage of
banner displays does not weigh up against the advantages of first screen displays in most
cases. Shelf tags, finally, may be very useful in attracting attention to interesting promotions,
but appear to have no or at most a limited effect on their own.
3
Can in-store displays improve category sales and brand market
share in online stores? A study on the overall effectiveness and
differences between display types in an online FMCG context
INTRODUCTION
In-store displays (ISD) are frequently used in brick-and-mortar (B&M) stores to bring
products to the attention of potential customers. Drawing attention to specific products at the
point of purchase is especially important in low involvement purchase situations (e.g. when
buying FMCG products), where purchase decisions tend to be made in the store based on
simple decision rules (Chandon et al. 2007; Drèze, Hoch, and Purk 1994; Hoyer 1984).
Previous research within the B&M setting has confirmed that ISD can positively affect
category purchase as well as brand choice decisions (Bemmaor and Mouchoux 1991; East,
Eftichiadou, and Williamson 2003; McKinnon, Kelly, and Roison 1981). The question
remains whether this also holds in an online shopping context. On the one hand, there are
indications that some of the traditional product presentation effects (e.g. shelf position) might
be less important in online stores due to differences in shopping environment (e.g. all
products placed at eye-level). Yet, on the other hand, a couple of studies have demonstrated
that in-store merchandising instruments may still play an important role in catching the online
shopper’s attention and influencing his/her purchase decisions (e.g. Breugelmans, Campo, and
Gijsbrechts 2007; Vrechopoulos et al. 2004).
A second important question resides in the fact that most academic researchers have ignored
the differences in effectiveness across different ISD types. While most previous studies point
to a substantial and positive sales effect of ISD, there are some studies which found no or a

4
much weaker brand sales effect (Kumar and Leone 1988; Vilcassim and Jain 1991). In
practice, it is a generally accepted fact that certain types of ISD work better than others (see
commercial applications at www.instoremarketer.org; www.popai.com; Liljenwall 2004;
Spaeth 2004). In academic research, however, differences in effectiveness between different
ISD types did not receive the same attention and a systematic analysis and explanation of
these differences is still lacking.
This research offers a first step in closing this gap and contributes to a better understanding of
ISD effectiveness in several ways. First, we examine the overall effects of ISD on category
sales (primary demand) and brand market share (switching) in an online shopping context.
Comparable to B&M stores, online (grocery) stores try to grab customers’ attention via ISD
to stimulate purchases of specific products (see e.g. www.netgrocer.com, www.peapod.com,
www.tesco.com). In line with previous research, we expect that online shoppers will also rely
on in-store cues to facilitate their purchase decisions and to cope with the information-
overload characterizing the online shopping environment. Gaining a better insight in the
overall impact of online ISD will help manufacturers to make more informed decisions on
whether to use them.
Second, a major objective of this paper is to provide a better insight into the differences in
effectiveness across different ISD types. By investigating three different online ISD types
which are most frequently used in practice and differ on important characteristics, this study
is among the first academic attempts to systematically investigate the differences in impact of
different ISD types on brand market share and category sales. Insight into these differences
and their determinants may provide useful guidelines to further assist manufacturers in their
decision on which ISD type to select.

5
Third, while our empirical analysis is limited to online ISD for FMCG, we do examine ISD
effects for 10 different product categories within this group. Previous research has shown that
the magnitude of the sales increases caused by ISD might depend on the product category that
is featured (e.g. Curhan 1974). By investigating ISD effects for several product categories, we
construct a more robust test and allow for a more accurate assessment of the overall online
ISD effectiveness as well as the differences in effectiveness between ISD types.
In the next section, we first discuss the overall effectiveness of online ISD and its underlying
reasons. Afterwards, we continue with building our expectations on the differences in
effectiveness of different ISD types. To do so, we start with a brief description of the major
online ISD types (first screen, banner and shelf tag displays), and give an overview of the
display characteristics that may affect their ability to attract attention. In section three, we
describe our empirical setting and introduce the models we used to test the effectiveness of
different online ISD types. After giving an overview of our results, we end with a discussion
and some indications for future research.
EFFECTIVENESS OF ONLINE ISD
Overall effectiveness of online ISD
In general, the main mechanism underlying category sales and brand switching effects of ISD
can be found in an increase in visual attention at the point-of-purchase for the featured
product (Chandon et al. 2007). In addition, many customers seem to interpret ISD as signals
or cues that indicate a good deal (Inman, McAlister, and Hoyer 1990). As a result, ISD tend to
affect purchase behavior, especially in low involvement, repeat buying situations, e.g. when
purchasing FMCG. Previous research has shown that, in such situations, customers do not go
6
through a complete search and evaluation procedure but tend to settle for satisfying rather
than optimal purchase decisions, thereby relying on cues such as ISD that simplify their
decision (Hoyer 1984; Inman, McAlister, and Hoyer 1990).
We expect a similar effect of ISD on consumers’ purchase behavior in an online context for
several reasons. First, internet buyers are typically convenience-oriented shoppers who want
to save time and effort, or simply dislike shopping (Breugelmans, Campo, and Gijsbrechts
2006/2007). The use of cues, such as ISD, may help to simplify and shorten their shopping
task. Second, online grocery stores are characterized by a similar information overload as
B&M stores: in almost every category, customers must choose among a large number of
items while they also have the possibility to retrieve additional product information. For these
reasons, we expect that also online shoppers are susceptible to in-store incentives which
attract their attention and facilitate the search and decision process. We therefore expect that –
in general – online ISD will have a positive effect on brand market share as well as category
sales.
Differences in effectiveness between online ISD types
While differences in effectiveness across different ISD are widely recognized in commercial
applications (www.instoremarketer.org; www.popai.com; Liljenwall 2004; Spaeth 2004), few
academic articles exist that systematically investigate the effect of different ISD types. To
derive expectations on the differences in effectiveness between ISD types, we therefore also
rely on related literature where similar visual attention effects are examined. More in
particular, we use insights obtained from the shelf and store layout literature and from the
print advertisement literature (e.g. within-medium or on-page positions). In the next section,
we first give a brief description of the three online ISD types we investigate in this research.
7
After a discussion of the ISD characteristics that may affect ISD effectiveness, we derive
conclusions on the expected differences in effectiveness between ISD types.
Online ISD types: first screen, banner and shelf tag displays
Traditional B&M stores typically use the store location as the categorization dimension to
distinguish between ISD types (Tellis 1998). In this research, we rely on a similar location-
based classification. Online (grocery) stores are typically organized in a hierarchical way:
store department pages (such as beverages) are followed by product group pages (such as soft
drinks), and category list pages (such as the coke page with a list of available SKUs in that
category). In what follows, we refer to this hierarchy as higher and lower level pages in the
online store. The types of ISD that are typically placed at these different online store pages are
very similar to the ISD types used in different locations of B&M stores: traditional (i)
entrance, (ii) end-of-aisle, and (iii) in-aisle displays translate to online (i) first screen, (ii)
banner, and (iii) shelf tag displays. A graphical representation of these ISD types can be found
in Appendix A2.
First screen displays are placed at higher level store department pages, typically at mid-screen
positions and with a small number of ISD for brands of different product categories. Banner
displays are placed on mid-level product group pages that customers need to pass when
moving from department to category list pages, at border-screen positions (e.g. the top or the
side of the page). In contrast to first screen displays, they do not provide a direct purchase
opportunity (buy button) but a link to a separate brand-based webpage where all SKUs of the
advertised brand are displayed. Shelf tag displays, finally, are placed at the center of lower
level category list pages and typically occur for several brands simultaneously. They are used
2 The appendix shows how the three ISD types were operationalized by the online retailer of our study. Althoughsmall differences exist in how other online grocery retailers use the different ISD types, there is quite somesimilarity between our online grocery retailer and other online grocery stores.
8
in the same way as traditional store shelf tags: they are special messages in the category list
used to announce sales promotions and placed right beside the promoted SKU within the
virtual shelf.
ISD characteristics and their impact on the effectiveness of different ISD types
To obtain a better insight into the reasons why different ISD types may have a different
impact on category sales and brand market share, we first identify the characteristics that are
most likely to influence a display’s ability to attract customer attention (see Figure 1). Online
ISD types that are more successful in catching customer attention can be expected to have a
stronger impact on the consumer’s purchase behavior (Chandon et al. 2007). Based on
previous advertising and in-store merchandising studies, the effect of ISD on customer
attention may depend on: (1) the sequence in which a display is encountered, (2) the
functionality of the store zone where it is placed, (3) the visibility (as determined by its size
and on-screen position), and (4) the exclusivity or absence of ‘clutter’ (i.e. competition of ISD
of alternative brands which are placed in the same store location). As indicated in Figure 1,
these four characteristics may determine to what extent ISD succeed in attracting customer
attention. In addition, whether an increase in customer attention will result in a change in
purchase behavior may depend on a fifth characteristic: the ISD’s actionability or the
possibility to buy the featured product immediately by means of a direct purchase link. We
will discuss each of these factors and their effect in more detail below.
<insert Figure 1>
We first examine expected effects on brand market share and category sales for each of the
five ISD characteristics separately. Because the expected direction of the effect on brand
market share and category sales is usually the same, we only discuss market share and
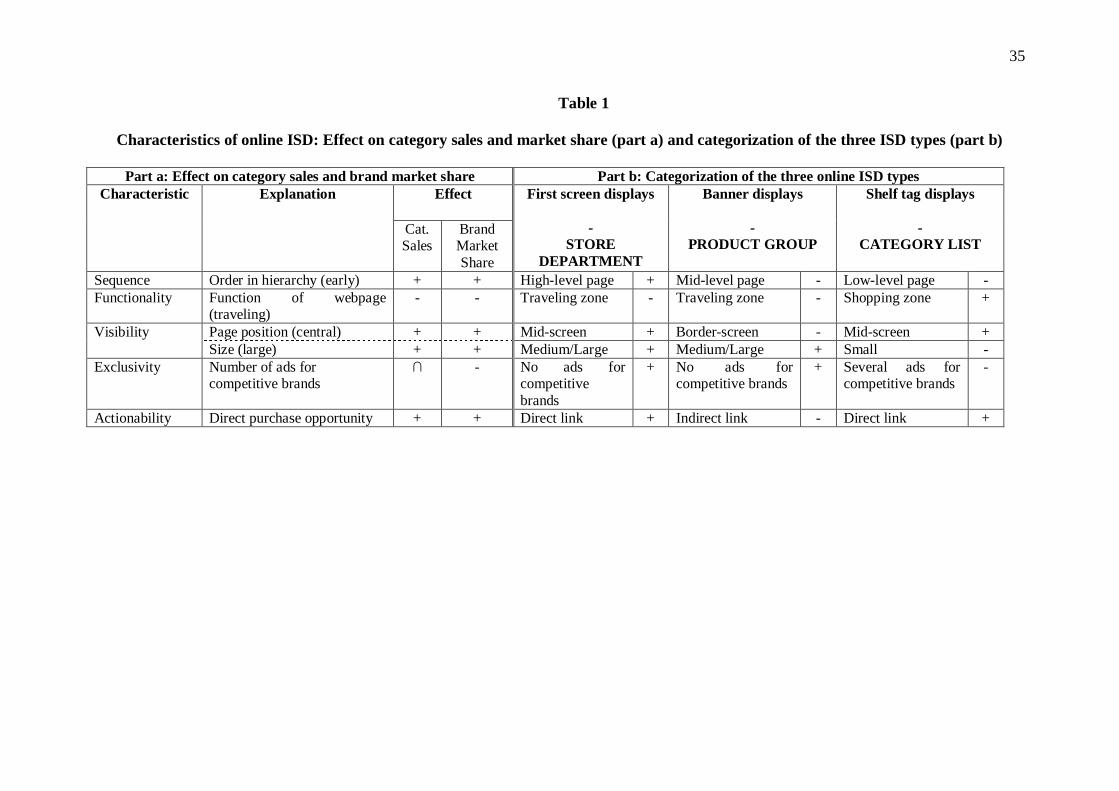
category sales effects separately when differences in direction are expected. In Table 1, we
9
give a summary of these expected effects (part a) as well as a classification of our three ISD
types on each of the characteristics (part b). Next, we will derive expectations on the
differences in ISD effectiveness by combining the insights on each of the characteristics that
make up an ISD type.
<insert Table 1>
(1) Sequence. The sequence in which an ad/display is encountered, may have an important
impact on the extent to which it attracts customer attention. In this respect, most previous
studies provide evidence of a primacy effect: first encountered ads/displays (e.g. cover page
position for printed ads; store entrance and end-of-aisle for ISD) typically reach a larger
number of potential customers than later displayed ones (East, Eftichiadou, and Williamson
2003; Rossiter and Percy 1998)3. In online stores, the sequence in which displays are
encountered depends on the level in the webpage hierarchy where they are placed. Online ISD
presented on higher level pages (such as first screen displays on store department pages) are
encountered earlier and may for this reason generate a stronger effect on category sales and
the brand’s market share. In addition to stimulating unplanned category purchases, they may
also encourage brand switching by highlighting a specific brand in an early stage of the
purchase process. Preliminary evidence of such primacy effects in an online grocery shopping
context has been provided by Breugelmans, Campo, and Gijsbrechts (2007), who demonstrate
that earlier encountered products have a higher probability of being chosen.
(2) Functionality. Recent in-store merchandising studies have pointed to potential differences
in functionality between different store locations which may lead to differences in purchase
behavior (East, Eftichiadou, and Williamson 2003; Larson, Bradlow, and Fader 2005). While
3 Note that we concentrate on purchase behavior reactions, and not on cognitive/attitudinal effects such as adrecall for which some studies also found evidence of a recency effect (Pieters and Bijmolt 1997). Especially inthe low involvement context where consumers seek a satisfying, effortless solution, and tend to conclude theirsearch process as soon as they find a suitable product, primacy effects seem to outweigh recency effects(Breugelmans, Campo, and Gijsbrechts, 2007).
10
some store zones are more used for traveling (higher level department and product group
pages, which mainly direct customers to the searched for product category), other zones are
merely used for shopping (lower level category pages, which provide a list of products and
product specific information such as prices). As a consequence, the attention customers pay to
displays may differ between store locations. Whereas displays placed in traveling zones may
be passed by without being noticed or receiving much attention, customers may spend more
time and effort in examining products – and hence ISD – in shopping zones containing
products they planned to purchase (Larson, Bradlow, and Fader 2005). This may lead to more
focused attention and a stronger impact on category sales and brand market share for ISD
(such as shelf tags) at lower level pages.
(3) Visibility. Previous research has demonstrated that ads/displays that are more visible –
either through a more prominent position (e.g. eye/hand level shelf position) or a larger size
(e.g. ad size, or number of facings in the shelf) – are more likely to catch attention and
influence purchase decisions (Chandon, Chtourou, and Fortin 2003; Desmet and Renaudin
1998; Drèze, Hoch, and Purk 1994; East, Eftichiadou, and Williamson 2003; Lohse 1997).
While there are some indications that online shelf positions might be less important in virtual
stores – all products being placed at ‘eye-level’ (Breugelmans, Campo, and Gijsbrechts 2007)
– there are also reasons to expect that on-screen positions of displays may still have a
significant effect on their ability to attract customer attention. Customers seem to have prior
expectations on where the most relevant information can be found: for print and online media,
this is usually the central position. Based on the Elaboration Likelihood Model and related
literature (Howard and Kerin 2006; Petty and Cacioppo 1986), we expect that online grocery
shoppers, which are typically goal-directed, will focus on these central positions rather than
on design elements that are not part of the main page (Cho and Cheon 2004). We therefore

11
expect a more positive effect on brand market share and category sales for displays placed at
the center of the page (such as first screen and shelf tag displays) compared to displays placed
at border-screen positions (such as the banner display).
In addition, visibility may depend on display size: larger displays attract more attention than
smaller ones and, for this reason, have a stronger effect on brand market share and category
sales. For most online (grocery) stores, the size of online ISD differs between display types:
ISD placed on higher level pages in the hierarchy (such as first screen and banner displays)
typically receive much more space than ISD placed on lower level pages (such as the shelf tag
display).
The ultimate effect of visibility is therefore to some extent inconclusive and depends on the
exact size and position of the ISD. Overall, we expect that ISD that outperform other ISD on
both dimensions (i.e. larger and better position) will be most visible. Compared to shelf tag
displays, first screen displays have a larger size and are placed on a more prominent position.
While there is no substantial difference in display size between first screen and banner
displays, first screen displays have the advantage of being placed at more prominent mid-
screen positions, thereby increasing their visibility compared to banner displays. The
difference in visibility between shelf tag and banner displays is not clear since we cannot
determine in advance if smaller ISD on more prominent on-screen positions (the shelf tag
display) will be more visible than larger ISD on border-screen positions (the banner display).
(4) Exclusivity. Ads/displays have been shown to have a stronger impact when there is less
‘clutter’, i.e. when ads/displays are more exclusive and fully capture customers’ attention
which is a function of the number of simultaneously placed ads/displays (Anderson and
Simester 2001; Cho and Cheon 2004). Anderson and Simester (2001) have shown that
displays are less effective in increasing market share when more products have them. The
12
number of displays for directly competing brands (i.e. brands from the same category) is
usually much smaller at higher level pages which often contain a number of displays for
different product categories but highlight only one brand for a given category. Lower level
pages, in contrast, very often contain (shelf tag) displays of many different, directly
competing brands. Hence, we expect that more exclusive brand displays at higher level pages
(first screen and banner displays) may generate stronger brand market share effects than (shelf
tag) displays placed at lower level pages. Demand on the category sales level, however,
appears to be maximized when some but not all products carry a display. While more displays
entail a stronger impact on category sales, this positive display effect is eventually
outweighed by the loss of credibility when too many products have such a display, leading to
an inverted U-shaped relationship between the number of displays and the level of category
sales (Anderson and Simester 2001).
(5) Actionability. Because of the unique interactive characteristics of online ISD, we add a
fifth determinant which we refer to as actionability. While some ISD provide direct purchase
opportunities (first screen and shelf tag displays: buying by clicking on the purchase button),
other ISD types (the banner display) provide a link to another webpage where customers can
find more information and/or select a product from a specific (in most cases brand-based)
product list. In low involvement situations where consumers do not go through a complete
and thorough evaluation procedure but rather try to minimize their search effort, we expect
that direct purchase links will generate a stronger effect on market share and category sales
than indirect links. When a display succeeds in drawing the attention, the possibility to react
immediately can be expected to reinforce the positive effect of increased attention on category
sales and brand market share.

13
By combining the insights on each of the characteristics that make up an ISD type, we can
derive expectations on the differences in ISD effectiveness. We expect the strongest effect for
first screen displays, at the category sales as well as the brand market share level: first screen
displays are encountered earlier, are more visible (mid-screen position, medium to large size),
and provide a direct link to purchase the product. What is more, at the market share level, they
have the additional advantage of being exclusive by featuring only one brand of a specific
category. When comparing shelf tag and banner displays, there are both positive and negative
signs: while banners are larger in size, are encountered earlier and usually do not face any
competition of other brand banners, shelf tags are typically placed at more prominent mid-
screen positions in the shopping zone and provide a direct purchase opportunity. Because of
these contradictory underlying effects, we cannot determine in advance which of these two
ISD types is more effective. Yet, by testing ISD effects for 10 different product categories, the
results may provide further indications on which display characteristics play the most
important role and which ISD type (banner versus shelf tag display) can be expected to be
most effective.
DATA AND MODELS
Data
We obtained market share and category sales data of a major online grocery store, for a 26-
month period (120 weeks) and 10 product categories. For the same store, categories and time
period, we also have detailed information on online ISD campaigns and promotional actions.
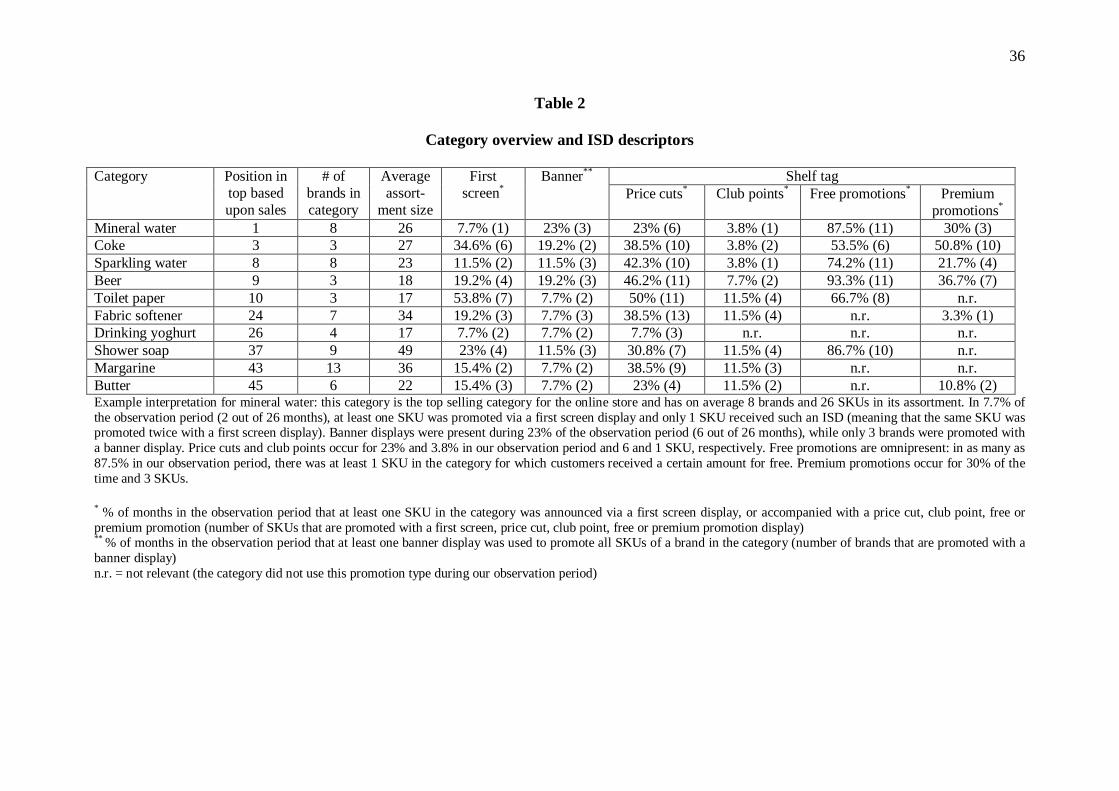
First screen, banner and shelf tag displays are renewed on the first of each month. Table 2
gives an overview of the different ISD occurrences for the 10 categories, revealing substantial
variation in ISD types and category penetration/purchase frequency (captured by the
category’s position in the top based upon sales).

14
<insert Table 2>
Models
Given the potentially differential effects of online ISD on category sales and brand market
share and based on the market response modeling literature (e.g. Hanssens, Parsons, and
Schultz 2001), we model brand sales as the product of its market share and category sales. As
explained in more detail below, we also take effects at the SKU level into account by using a
hierarchical market share model.
The category sales model
The impact of ISD variables on overall weekly category sales is assessed by a multiplicative
regression model with overall category sales as dependent variable ( tCatSales ; t = 1,… ,T).
The model takes the following form:
(1) ∏∏=
−=
=H
h
Dt
M
m
Xt
hthlagCStmmc eCatSaleseeCatSales1
11
, χδδα
where htD are seasonal dummies, h (1,… ,H) is the index for holiday and special event
periods, 1−tCatSales is the lagged effect of sales, tmX , captures the effects of marketing mix
variables (the relevant ISD types) at the category level, and hlagCSmc χδδα ,,, are parameters
to be estimated. An overview of the symbols is given in Table 3. We convert this model into
an equivalent linear model via the logarithm transformation.
<insert Table 3>
We include the following marketing mix variables: a first screen display variable tFS , a
banner display variable tBAN and shelf tag display variables. In our empirical setting, shelf
tags are exclusively used as promotion signals. This has two important implications. First, it is
not feasible to estimate a ‘pure’ shelf tag effect, yet, shelf tags are seldom or never used on
their own in practice. Second, shelf tag effectiveness may depend on the type of promotion

15
that is announced. For these reasons, we include promotion-specific shelf tag variables in our
model4. Based on our data set, we identified four different promotional activities: price cuts
tPC , club points tCP , free promotions tFP and premium promotions tPP 5. The parameters
linked to these variables allow to test whether and which ISD types have a significant impact
on category sales. Note that not all of the promotional shelf tag variables are incorporated in
each model specification because some categories only use a sub-set of these promotional
variables during our observation period. Further note that we also did not include any price
variable in the model (neither in the market share model described in the next section)
because product prices remained largely the same over the considered period, and inclusion of
this variable led to severe collinearity problems with the model’s constant.
We further account for seasonality by using dummy variables for special periods (holidays
and official events) htD . Based on observations of the data and managerial input, we included
four dummy variables: Summer, Easter, Christmas/New Year and Mid Term vacation. Within
an online grocery store, these periods are characterized as lower selling ones because
customers either go on vacation (and therefore do not need the online grocery service), or stay
at home but do not need to work (and therefore have time to go to the B&M store
themselves). As a consequence, we expect a negative parameter for these dummy variables. In
order to ensure that our exogenously identified seasonal dummies match the data, we
performed outlier analyses. In the few occasions where an additional outlier could be
4 Instead of using promotion-specific shelf-tag variables, we re-ran the models with an overall shelf tag variablewhich captured the mere announcement of a promotion making abstraction of the specific type. For none of thecategory sales and market share models, the inclusion of this overall shelf tag variable improved model fit orface validity.5 We decided to use the amount of price reductions and loyalty program points for price cut and club pointpromotions and a dummy variable for the other two promotion types (see Table 3) because previous research haspointed out that consumers are sensitive to the (monetary) value of a promotion (DelVecchio, Krishnan, andSmith 2007). This is especially relevant for the former two promotion types. Robustness checks indeed pointedout that the usage of dummy variables for price cut and club point promotion variables, or the usage of amonetary value expression for the free promotion variable reduced model fit.

16
identified, including this as a separate dummy variable resulted in no difference with the
original model. We therefore decided to stick to our exogenously defined variables. Finally,
we incorporated a lagged sales variable 1−tCatSales to capture carry-over effects.
The hierarchical market share model
In our empirical setting and like in most other (online) grocery stores, some ISD types are
defined at the brand level (banner) while others are defined at the SKU level (first screen and
shelf tags). For this reason, we use a two-stage hierarchical market share model which allows
to include different predictor variables defined at the brand and SKU level and to capture non-
IIA competition patterns between SKUs belonging to different brands. Since the traditional
attraction model is nested in the hierarchical one, it also allows for a formal test of these non-
IIA competition patterns (Foekens, Leeflang, and Wittink 1997). In line with the layout of the
website and the followed marketing mix strategy, we applied a brand-SKU hierarchy, which
allows to estimate the effects of different ISD types at the appropriate level: the brand level
for banner displays, and the SKU level for the other ISD types. We define the market share of
SKU s (1, … ,S) of brand b (1,… ,B) at time t ( tsbms , ) as:
(2) tbstbtsb msmsms ,,, ×=
with tbm , = market share of brand b at time t;
tbsm , = market share of SKU s within brand b at time t.
Market share of the lowest level in our nested model can be formalized as:
(3)∑
=
= S
itbi
tbstbs
A
Am
1,
,,
where
17
(4) ]exp[1
,, ∑=
+=l
l
ll
M
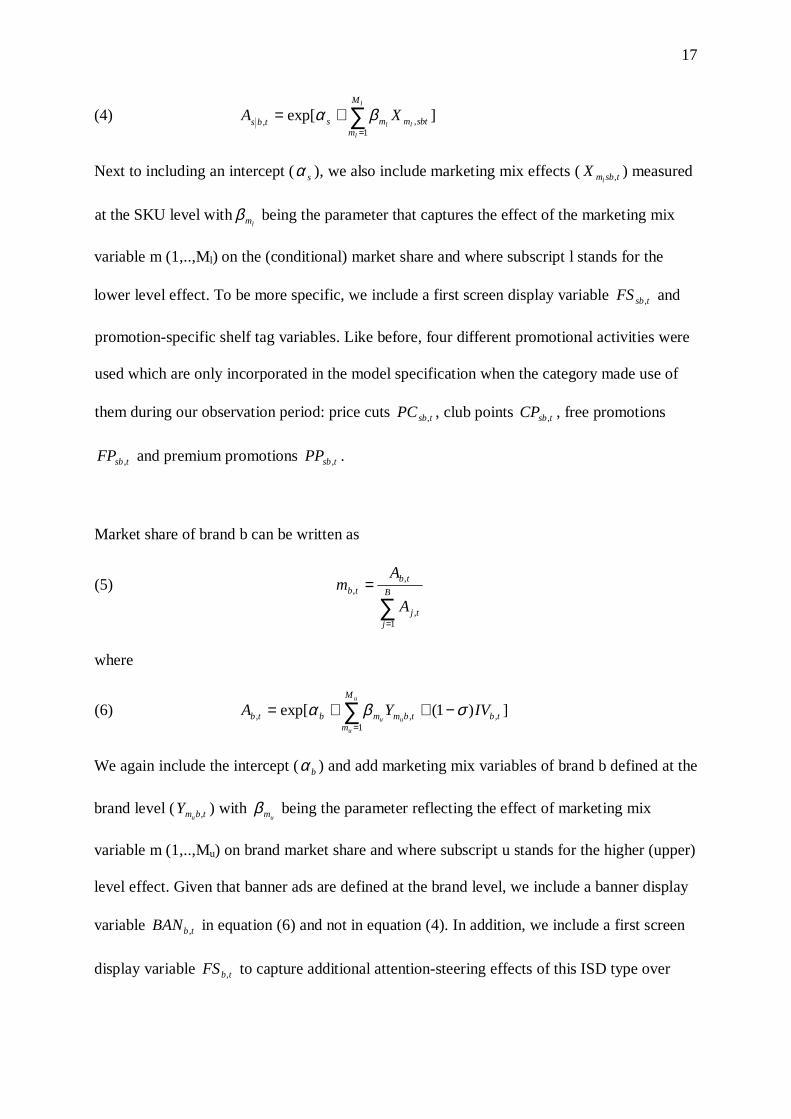
msbtmmstbs XA βα
Next to including an intercept ( sα ), we also include marketing mix effects ( tsbmlX , ) measured
at the SKU level withlmβ being the parameter that captures the effect of the marketing mix
variable m (1,..,Ml) on the (conditional) market share and where subscript l stands for the
lower level effect. To be more specific, we include a first screen display variable tsbFS , and
promotion-specific shelf tag variables. Like before, four different promotional activities were
used which are only incorporated in the model specification when the category made use of
them during our observation period: price cuts tsbPC , , club points tsbCP , , free promotions
tsbFP , and premium promotions tsbPP , .
Market share of brand b can be written as
(5)∑
=
= B
jtj
tbtb
A
Am
1,
,,
where
(6) ])1(exp[ ,1
,, tb
M
mtbmmbtb IVYA
u
u
uuσβα −++= ∑
=
We again include the intercept ( bα ) and add marketing mix variables of brand b defined at the
brand level ( tbmuY , ) with
umβ being the parameter reflecting the effect of marketing mix
variable m (1,..,Mu) on brand market share and where subscript u stands for the higher (upper)
level effect. Given that banner ads are defined at the brand level, we include a banner display
variable tbBAN , in equation (6) and not in equation (4). In addition, we include a first screen
display variable tbFS , to capture additional attention-steering effects of this ISD type over

18
and above the effects that emerge as a result of an increase in brand attractiveness6. The
change in brand attractiveness is measured by an inclusive value for brand b defined as:
(7)
+= ∑ ∑
= =
S
s
M
mtsbmmstb
l
l
llXIV
1 1,, ]exp[log βα
The inclusive value variable is the log of the sum of the attractions of all SKUs belonging to
brand b (s = 1,… ,S). The term )1( σ− gives an indication of the impact of the total
attractiveness of the set of SKUs of brand b on the brand’s market share, and varies between 0
and 1 (Foekens, Leeflang, and Wittink 1997).
RESULTS
The category sales model
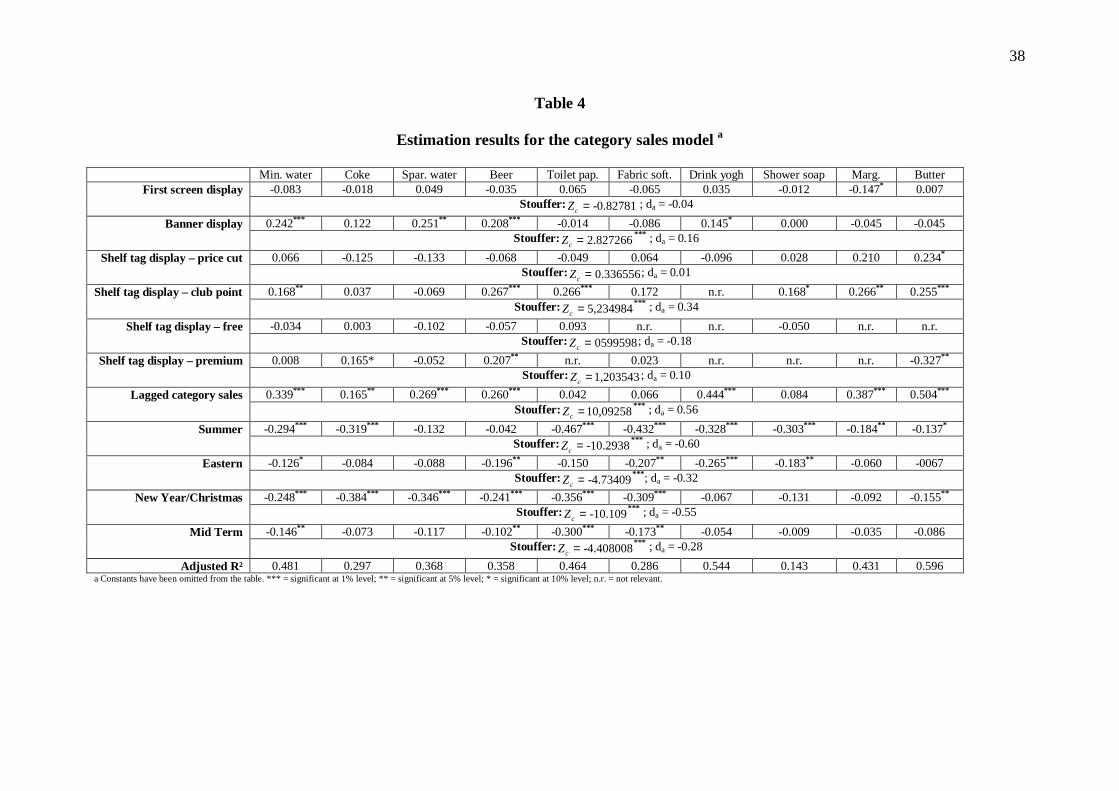
For the category sales model, we report the parameter estimates with their significance level
in Table 4.
<insert Table 4>
Table 4 also includes the outcomes of the Stouffer combined test7 which is an overall test of
the parameters (Rosenthal 1991; Wolf 1986). By using a combined test, statistical
generalizations can be made with respect to the combined evidence resulting from all the
estimations/categories (Wolf 1986). In addition, we accompany the combined tests with an
index of effect size for each variable. This index provides us with an insight into the strength
6 Since first screen displays are encountered early in the shopping hierarchy and have an exclusive nature, theycan induce respondents to purchase products they did not plan to buy. Shelf tags, in contrast, only becomevisible in the product category’s list and are not exclusive. It therefore seems reasonable to include them solely atthe lowest level of the hierarchy. Yet, as a robustness check, we tested the inclusion of the shelf tag variables atboth stages. There was no change in the substantive results, neither did model fit significantly increase.7 The Stouffer test, also referred to as the method of adding Z’s (standard normal values), starts with finding thecorresponding Z’s for the one-tailed p-levels obtained for each of the estimations/categories. When effects are inthe same (i.e. expected) direction, the corresponding Z’s have the same sign while the signs are different ifresults are in the opposite direction. Subsequently, the Z’s are summed and divided by the square root of thenumber of tests combined (in our case: the number of estimations/categories). This new Z follows a standardnormal distribution and corresponds to the p-value that the results of the estimations/categories combined couldhave occurred under the corresponding null hypothesis (cf. Gijsbrechts, Campo, and Goossens 2003). Next to theStouffer test, we also computed the Winer combined test which produced exactly the same results.
19
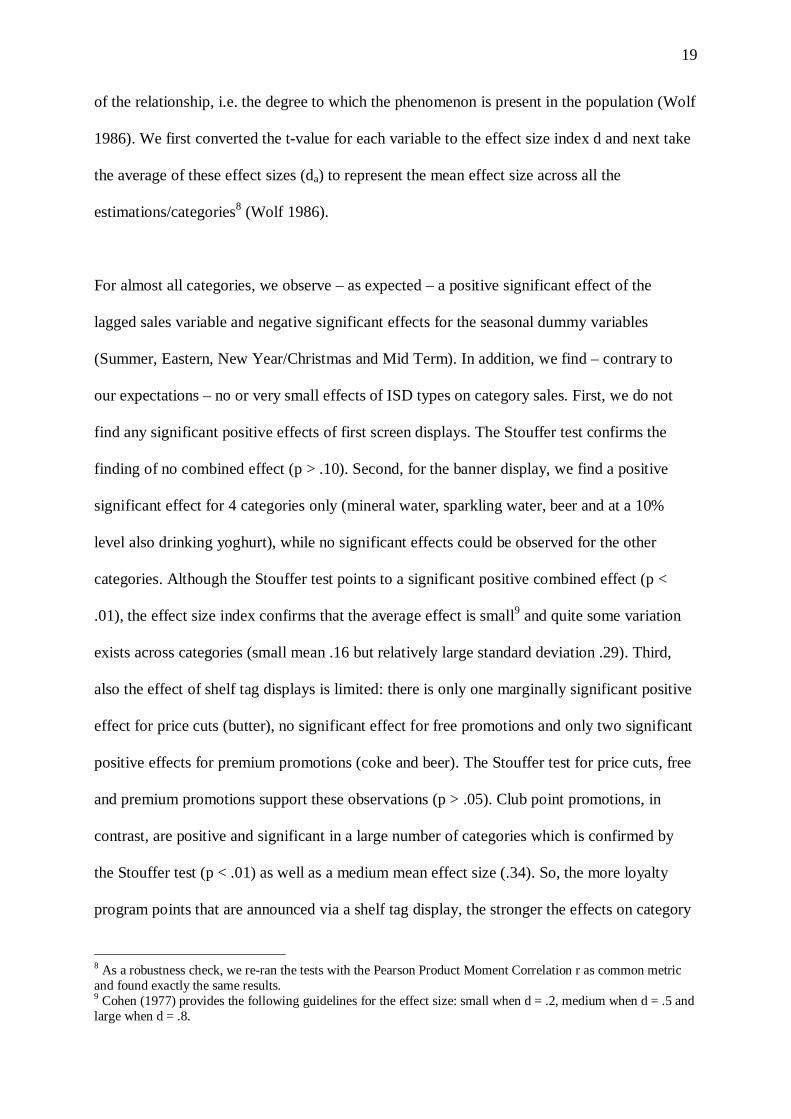
of the relationship, i.e. the degree to which the phenomenon is present in the population (Wolf
1986). We first converted the t-value for each variable to the effect size index d and next take
the average of these effect sizes (da) to represent the mean effect size across all the
estimations/categories8 (Wolf 1986).
For almost all categories, we observe – as expected – a positive significant effect of the
lagged sales variable and negative significant effects for the seasonal dummy variables
(Summer, Eastern, New Year/Christmas and Mid Term). In addition, we find – contrary to
our expectations – no or very small effects of ISD types on category sales. First, we do not
find any significant positive effects of first screen displays. The Stouffer test confirms the
finding of no combined effect (p > .10). Second, for the banner display, we find a positive
significant effect for 4 categories only (mineral water, sparkling water, beer and at a 10%
level also drinking yoghurt), while no significant effects could be observed for the other
categories. Although the Stouffer test points to a significant positive combined effect (p <
.01), the effect size index confirms that the average effect is small9 and quite some variation
exists across categories (small mean .16 but relatively large standard deviation .29). Third,
also the effect of shelf tag displays is limited: there is only one marginally significant positive
effect for price cuts (butter), no significant effect for free promotions and only two significant
positive effects for premium promotions (coke and beer). The Stouffer test for price cuts, free
and premium promotions support these observations (p > .05). Club point promotions, in
contrast, are positive and significant in a large number of categories which is confirmed by
the Stouffer test (p < .01) as well as a medium mean effect size (.34). So, the more loyalty
program points that are announced via a shelf tag display, the stronger the effects on category
8 As a robustness check, we re-ran the tests with the Pearson Product Moment Correlation r as common metricand found exactly the same results.9 Cohen (1977) provides the following guidelines for the effect size: small when d = .2, medium when d = .5 andlarge when d = .8.

20
sales. Overall, however, the results indicate that it is not the shelf tag but rather the promotion
which is announced by it that may cause an upward shift in category sales.
The hierarchical market share model
Having identified the effects of ISD on category sales, the next step consists of estimating the
effects on market share. To estimate the hierarchical market share model, we used a
sequential estimation procedure: after estimating the parameters from equation (4), we
calculated the inclusive value tbIV , from equation (7) and estimated the parameters from
equation (6) given the values of tbIV , (Foekens, Leeflang, and Wittink 1997). Table 5 shows
the estimation results. For the SKU level model, we report the number of positive, no or
negative significant coefficients ( = .05). For the brand level model, we report the parameter
estimates with their significance level. We also include for both levels of the hierarchical
market share model, the Stouffer test and mean effect size index.
<insert Table 5>
At the lower level of the hierarchical market share model (the share of an SKU within a
specific brand), we find a very strong, positive effect of the first screen display: in 12 out of
18 lower level estimations where a first screen display was present, the effect was positive
and significant, and in none of the cases a significant negative effect could be found. What is
more, for all categories, at least one of the lower level models produced a significant and
positive effect for the first screen display variable. The Stouffer combined test confirms that
the null hypothesis of no significant first screen display effect common to each of the
estimations should be rejected (p < .01), and the mean effect size (.58) points towards a
medium effect. So, interestingly and as expected, we find that market share of an SKU within
a specific brand increases when it is announced via a first screen display.

21
As expected, the effect of shelf tags differs substantially depending on the type of promotion
that is announced. Based on the Stouffer test, there is clearly no effect for price cuts and free
promotions (p > .10). One possible reason might be the proliferation of these promotional
campaigns in the online grocery store (see Table 2). On the other hand, club points and
premium promotions do have a significant effect on market share of an SKU within a specific
brand (Stouffer test: p < .01). At the same time, the number of significant coefficients across
estimations remains small. For 2 out of 9 (club points) and 2 out of 6 (premium) categories,
significant positive results emerge on market share when an SKU is promoted with club
points or a gift, respectively. The latter observations are also supported by the small mean
effect sizes with relatively large standard deviations, .14 (s.e. = .25) and .10 (s.e. = .27), for
club point and premium promotions respectively.
Comparing the magnitude of shelf tag display effects with those for first screen display effects
learns that, for none of the estimated models, a significant first screen display effect is
outperformed by a shelf tag effect. So, even when disregarding potential additional higher
order first screen effects (discussed next), we already find indications that first screen displays
are more effective in stimulating market share than shelf tag displays.
Turning to the higher level of the hierarchical model (brand market share), we first observe
that the inclusive value10 is significant for all categories (for mineral water at 10%, for all
other categories at 1%) and has a value between 0 and 1. For categories with a value closer to
1 (like coke, shower soap and butter), changes in the attractiveness caused for instance by first
screen displays result in a stronger impact on brand market share than for categories with a
value closer to 0 (like mineral water and toilet paper). Yet, even for these categories, the
10 Note that we report 1- .
22
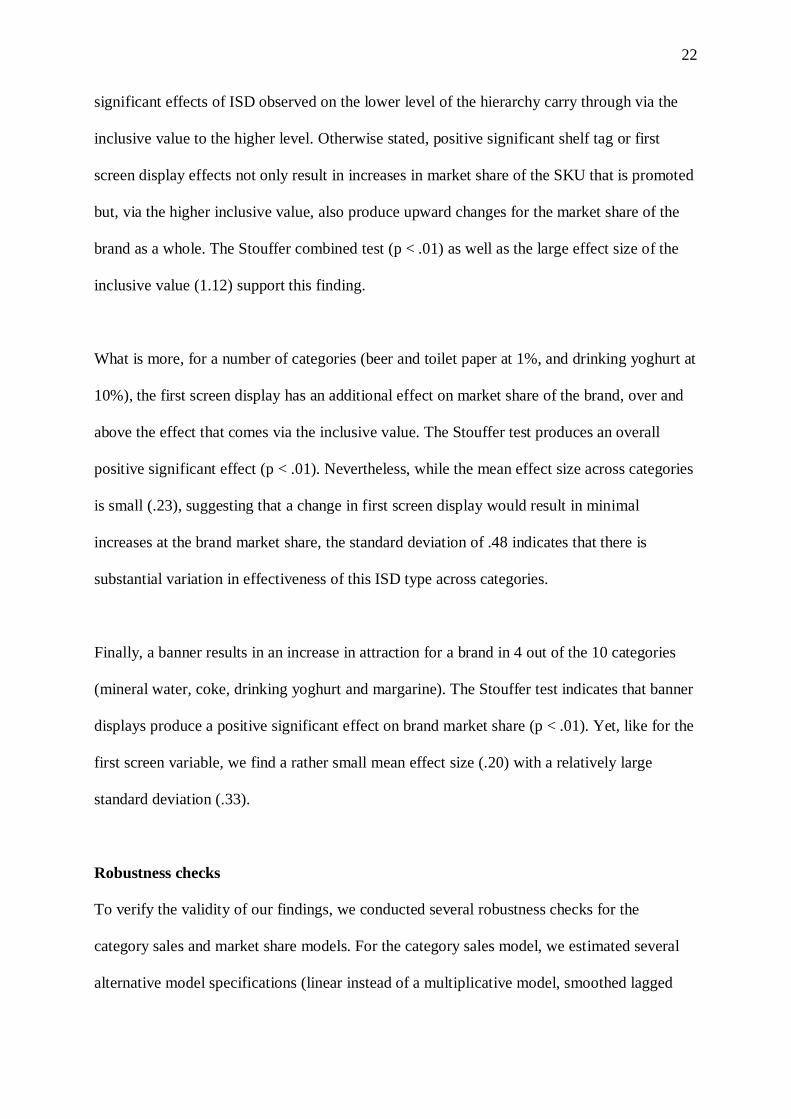
significant effects of ISD observed on the lower level of the hierarchy carry through via the
inclusive value to the higher level. Otherwise stated, positive significant shelf tag or first
screen display effects not only result in increases in market share of the SKU that is promoted
but, via the higher inclusive value, also produce upward changes for the market share of the
brand as a whole. The Stouffer combined test (p < .01) as well as the large effect size of the
inclusive value (1.12) support this finding.
What is more, for a number of categories (beer and toilet paper at 1%, and drinking yoghurt at
10%), the first screen display has an additional effect on market share of the brand, over and
above the effect that comes via the inclusive value. The Stouffer test produces an overall
positive significant effect (p < .01). Nevertheless, while the mean effect size across categories
is small (.23), suggesting that a change in first screen display would result in minimal
increases at the brand market share, the standard deviation of .48 indicates that there is
substantial variation in effectiveness of this ISD type across categories.
Finally, a banner results in an increase in attraction for a brand in 4 out of the 10 categories
(mineral water, coke, drinking yoghurt and margarine). The Stouffer test indicates that banner
displays produce a positive significant effect on brand market share (p < .01). Yet, like for the
first screen variable, we find a rather small mean effect size (.20) with a relatively large
standard deviation (.33).
Robustness checks
To verify the validity of our findings, we conducted several robustness checks for the
category sales and market share models. For the category sales model, we estimated several
alternative model specifications (linear instead of a multiplicative model, smoothed lagged
23
sales instead of the simple lagged sales variable, week-based trend instead of the lagged sales
variable), which did not result in significantly better estimation results. We also tested for
first-order autocorrelation using the Durbin-Watson test, which did not reveal any problems.
For the market share model, we estimated alternative specifications of the hierarchical
attraction model, replacing the brand-SKU hierarchy by a size-SKU or flavor-SKU one,
which again, in both cases, did not improve the face validity or goodness-of-fit of our results.
In addition, instead of estimating a general inclusive value effect (see equation (6)), we
estimated models with nest-specific inclusive value effects. Also for this check, neither face
validity, nor model fit improved. Finally, we added lagged versions of the promotion-specific
shelf tag variables in our model to capture possible dynamic effects. Doing so did not result in
model fit or face validity improvement. Previous researchers have already indicated that
dynamic promotion effects are relatively hard to capture (Chan, Narasimhan, and Zhang
2008), something that might be fortified by the aggregate nature of our data and the less stable
shopping frequency pattern of online buyers.
Implications for manufacturers
Based on the equations and the estimation results presented above, we can derive insights in
how manufacturers should choose among the ISD types when the objective is to maximize
profit. In line with Zhang and Wedel (2008), we focus on the manufacturer’s instead of the
retailer’s perspective for the following reasons. First, as shown in our results section, the
effects of ISD on category sales – which are the primary interest of a retailer – are not
significant in most cases. Second, as suggested by Zhang and Wedel (2008) and confirmed by
the management of the online grocery store in our case, manufacturers are providing financial
support for administering most of the in-store merchandising tools.

24
A manufacturer is primarily interested in the impact ISD have on total brand sales which
depends on the brand’s market share as well as total category sales, i.e.
tbttb mCatSalesSales ,, *= . As indicated above, shelf tags have a very limited effect on market
share and category sales, which is why we leave them out in the following discussion. An
especially interesting issue, however, is the trade-off between first screen and banner displays:
they not only differ in focus (highlighting one of the brand’s SKUs vs. featuring the brand as
a whole by providing a link to a special product page) but also with respect to placement costs
(amount charged by the retailer to feature an ISD). For the online grocery store in our case,
the placement costs of a first screen display are two third lower than the costs involved with a
banner display. Starting from the assumption that the ultimate goal for a manufacturer is to
improve brand sales (and not only SKU performance), we determine how and when banner or
first screen displays provide the largest increase in brand sales. Below, we explore the factors
that may determine the size of the brand sales effect based on the model equations. Next, we
illustrate the impact of these factors using simulations and explore differences between
categories, distinguishing between top and lower selling ones (respectively the first five and
last five categories in Table 2). We end this section with profitability analyses where we take
ISD costs into consideration.
Based on equation (1-7), we derive the percentage change in brand sales11 caused by a first
screen display as:
(8) 1*,,
,,
,
,
,,
,,,,, −
=
−=∆
tbtb
tbtb
tbt
tbt
tbtb
tbtbtbtbtb noFSm
FSm
noFSCatSales
FSCatSales
noFSSales
noFSSalesFSSalesFSSales
[ ][ ][ ][ ][ ] 1
)exp(*)1(log*)1()(exp*)1()exp(*)1(log*)1(exp
*)exp(*)exp(,,,,,,
,,,, −
+−−++−
+−−=
lFstsbtsbuFstbtb
lFstsbtsbuFsFs mmmm
mmβσβ
βσβδ
11 We use percentage change in brand sales as a measure instead of marginal effects because both first screen andbanner displays are dummy variables.

25
and the percentage change in brand sales for banner displays as:
1*,,
,,
,
,
,,
,,,,, −
=
−=∆
tbtb
tbtb
tbt
tbt
tbtb
tbtbtbtbtb noBANm
BANm
noBANCatSales
BANCatSales
noBANSales
noBANSalesBANSalesBANSales
(9) 1*)exp()1(
1*)exp(*)exp(,,,
, −
+−=
tbuBantbuBanBan mm β
βδ
Comparing equation (8) and (9), we see that for both equations the first component depends
on the effect of the ISD on category sales (exp( Fsδ ) and exp( Banδ )). Based on the discussion
above, we know that there are only significant effects on category sales in 4 product
categories for the banner display and in none of the categories for the first screen display.
The second component for both equations includes a higher level effect (brand level of the
hierarchical market share model) for the first screen and banner display (exp( uFs ,β ) and
exp( uBan,β )), and a lower level effect (SKU level) for the first screen display only
( [ ][ ])exp(*)1(log*)1(exp ,,, lFstsbtsb mm βσ +−− ). For categories where the banner coefficient
parameter is significant, we observe in our estimation results a much smaller higher level
effect for first screen displays (Table 5, uBan,β > uFs ,β ). Although this might lead to the
conclusion that banner displays are more interesting for manufacturers, the global effect for
first screen displays depends on the lower level effect as well. The latter is a function of the
following three components: (i) the attractiveness of the SKU that is featured ( tsbm , ), (ii) the
lower level effect of first screen displays ( lFs ,β ), and (iii) the responsiveness of the brand
market share to changes in brand attractiveness ( σ−1 ). Even when the higher level banner
effect is larger than the higher level first screen effect, the global effect of first screen displays
can still be equal to or even be larger than the global effect of banner displays. Based on the
previous derivations, we know that this is the case when an attractive SKU of a brand with
high marketing effort effectiveness ( lFs ,*)1( βσ− ) is featured via a first screen display. Note
26
that when first screen displays do not change within-brand market share of the featured SKU
( 0, =lFsβ ) and/or changes in within-brand SKU attractiveness do not work through to the
higher brand level ( 0)1( =−σ ), equation (8) reduces to the same form as equation (9) with
only a category sales and a higher level first screen effect on brand market share.
Finally, both equations include a correction factor (the denominator) that penalizes the effect
of ISD for brands that already have a relatively high market share (captured by tbm , ). Brands
with a lower market share, on the other hand, have more to gain from highly effective ISD
(i.e., a first screen display with a large higher and lower level effect, captured by
[ ][ ])exp(*)1(log*)1()(exp ,,,, lFstsbtsbuFs mm βσβ +−−+ and a banner display with a large
higher level effect, captured by )exp( ,uBanβ ).
To illustrate the impact of the above-mentioned factors, we ran simulations based on the
actual marketing environment (see Table 6).
<insert Table 6>
First, simulation results show that category sales are in most cases not affected when an SKU
is promoted with a first screen display (cf. Table 4, no significant effects of the first screen
display) or banner display (no significant effect for 6 out of the 10 product categories). When
significant (4 out of the 10 product categories), banner displays provide an increase in
category sales between 13.40% and 17.87%.
Second, results show that the average percentage increase in brand market share caused by a
first screen (banner) display amounts to 16.65% (9.09%), with 0.68% (0.44%) being the
minimum increase and 106.29% (33.67%) being the maximum increase observed when the
ISD was significant. For 4 categories we observed a significant lower level first screen as well
as a significant higher level banner display effect (see Table 5: mineral water, coke, drinking
yoghurt and margarine), allowing for a direct comparison of first screen and banner effects

27
within the same category. For 2 of these categories (coke and drinking yoghurt), a first screen
display results in a higher increase in brand market share than a banner display. In line with
our discussion above, these 2 categories have a high marketing effort effectiveness (relatively
large IV-coefficients ( σ−1 ) and lower level first screen coefficients lFs ,β ) while the other 2
categories (mineral water and margarine) have a lower marketing effort effectiveness
(relatively small IV-coefficients ( σ−1 ) and lower level first screen coefficients lFs ,β ). The
simulation results also show that among categories with a similar marketing effort
effectiveness, the largest increase in brand market share coming from a first screen display is
generated by SKUs with a high market share tsbm , (e.g. for Brand 1 in the toilet paper
category, the impact of the first screen display on brand market share is 27.38% higher when
the more attractive SKU1 is featured than when the less attractive SKU9 is featured).
Finally, simulation results confirm that % increases in brand market share are lower for
brands with high compared to low market share tbm , (e.g. the increase in brand market share
within the drinking yoghurt category is 14.03% higher for Brand 1, the less popular brand,
than for Brand 2, the more popular brand).
Taking both market share and category sales effects into consideration, results at the brand
sales level indicate that both ISD types have the potential to be effective. First screen displays
as well as banner displays may significantly increase brand sales: on average and across all
cases, they generate additional sales worth 215.35€ and 380.47€ respectively. The wide range
of observed brand sales effects, however, indicates that there exists quite some variation in the
magnitude of the effect across categories. Comparing top and lower selling categories (first
five vs. last five categories of Table 2) learns that the former are far more successful in
generating sales increases than the latter: 307.23€ vs. 31.53€ for first screen displays, and
597.26€ vs. 39.80€ for banner displays.
28
To evaluate ISD effects, manufacturers should not only look at increases in brand sales, but
also need to take the costs of the respective ISD into consideration. On average, the estimated
brand sales increase of banner displays is 1.77 times larger than the brand sales increase
caused by first screen displays12. As indicated before, this does not necessarily mean that
banner displays are more profitable than first screen displays: next to the brand’s profit
margin ( bπ ), the overall profit increase generated by an ISD for brand b ( bΠ ) also depends
on the costs involved for placing and administering banner and first screen displays13
( BANCosts or )FSCosts :
(10) ( )( ) FSbbbb CostsnoFSSalesFSSalesFS −−=Π π*
(11) ( )( ) BANbbbb CostsnoBANSalesBANSalesBAN −−=Π π*
We illustrate the trade-off between banner and first screen displays with the following simple
example. For the known cost difference ( FSBAN CostsCosts *3= ) and estimated difference in
brand sales effects (additional sales generated by banner = 1.77 * additional sales generated
by first screen), we computed expected profits of ISD types for 4 different levels of profit
margin (20%, 30%, 40% and 50%; cf. Zhang and Wedel, 2008) and 3 different absolute
placement costs (low, medium and high).
<insert Figure 2>
Figure 2 demonstrates that for medium and high placement costs (graphs b and c), first screen
displays almost always outperform banner displays. Yet, in both cases, ISD only become
profitable for relatively high margins (30% and 50% in graph b for first screen and banner
displays respectively) or do not become profitable at all (graph c). When placement costs are
12 The fact that the average brand sales increase for banner displays is higher than the average brand salesincrease for first screen displays is mainly driven by the significant effect of banner displays on category salesfor 4 categories.13 Note that we make abstraction of costs other than placement costs (e.g., costs for designing the banner).

29
relatively low (graph a), first screen displays – in spite of the lower brand sales increase –
may still be more profitable than banner displays when profit margins remain below a cut-off
value (intersection point of both profit curves). At higher profit margins and absolute low
placement costs, the higher sales increase of banners will more easily compensate the
relatively (as compared to first screen displays) high placement costs. While based on average
values of brand sales increase (average over all cases) and rude indicators of profit margins
and placement costs, the example illustrates the major principles of the trade-off. In addition
to the difference in sales increase (caused by the factors that were discussed above),
differences in placement costs and profit margin levels have to be taken into account to
determine whether first screen displays are more profitable than banner dipslays or vice versa.
DISCUSSION
Our results confirm that – like in B&M stores –online ISD may substantially improve brand
and category performance. Comparing market share and category sales effects, it is clear that
(for most categories) the brand switching effect dominates the category sales effect. Online
ISD have a significant positive effect in a much larger number of product categories at the
brand market share level than at the category sales level. At the category sales level, no
significant first screen effects could be found, while banner effects were only significant for 4
out of the 10 product categories. Therefore, our results seem to suggest that ISD
predominantly stimulate brand switching within a category and are less effective in boosting
primary demand. While contrary to our initial expectations, there are previous (B&M based)
studies which also show that in-store merchandising efforts especially affect brand choice
decisions, and to a lesser extent primary demand (cf. Bell, Chiang, and Padmanabhan 1999;
Foubert and Gijsbrechts 2007; Vilcassim and Jain 1991). In an online shopping context, an
(additional) possible explanation for the near absence of category sales effects could be the

30
convenience-oriented shopping attitude of online buyers who are less inclined to purchase
categories they did not plan to buy beforehand.
At the same time, for part of the categories (mineral water, sparkling water, beer and at a 10%
level also drinking yoghurt), banner displays did have a significant effect on category sales. A
closer look at the online grocery store’s organization reveals that there is a substantial
difference in the composition of the product group pages, which contain more close
substitutes for these 4 categories compared with the product group pages of the other 6
categories. For instance, while our focal category lager beer is positioned on the beer group
page together with possible substitutes such as premium and other special beers, toilet paper
is placed at the hygiene group page together with for example pocket handkerchiefs and nail
polish remover. In the first case, banners (that are placed on top of the product group page)
may stimulate between-category switching and in this way lead to a sales increase for the
focal (featured) product category (e.g. switching from premium beer to lager beer when the
latter is featured with a banner). Our results, therefore, might indicate that banner displays
especially produce an increase in category sales for product categories that have more
between-category substitution opportunities. To test these cross-category effects and to
determine whether between-category switching is really a major reason for the increase in
category sales we observed, more information would be needed on the substitution
possibilities and on the sales evolution of other proximal categories.
While it is interesting to note that ISD may play an important role in online stores – especially
at the brand choice level – our results also demonstrate that not all ISD types are equally
effective in improving brand performance. Looking at differences between ISD types allows
us to improve our understanding on the major determinants driving ISD effectiveness.

31
Overall, first screen displays (comparable to store entrance displays) clearly appear to have
the strongest effect on the featured brand’s market share. They profit from a primacy effect
and a strong(er) attention catching effect as a result of a more prominent on-screen position
and no/limited competition from ISD for products of the same category. The overall brand
market share effect, however, strongly depends on the attractiveness of the featured SKU and
the marketing effectiveness of the brand as a whole.
Banner displays (comparable to end-of-aisle displays), in contrast, only have a significant
effect on brand market share in a small number of product categories and – when significant –
have on average a smaller increase in brand market share than first screen displays. While
over-reliance (in time and across brands) does not seem to be at play for this ISD type (see
Table 2), possible explanations for a less dominant effect on brand market share are the mid-
level location (in-between entrance and shopping zone of the online store), border-screen
position and the absence of a direct purchase link. The amount of banners, the market share of
the brand that received a banner as well as the number of SKUs of brands that were featured
with a banner are roughly the same across categories and cannot be an explanatory factor of
why the banner works on brand market share for only a subset of our categories. A factor that
might have had a significant impact but for which we did not have extra information is the
banner layout. Future research should investigate the impact of banner message and design.
The effect of shelf tags (comparable to in-aisle displays), finally, tends to be smaller than the
effect of first screen and banner displays and depends predominantly on the type of promotion
and not so much on the presence of a tag announcing that there is a promotion. The
differences between shelf tags with different promotions can to some extent be explained by a
wear-out effect. Price cuts and free promotions are, for instance, used very often in the online
store from which the data were obtained. Second, the effect of premium promotions strongly
varies across categories (and brands), which may be explained by the type of product category

32
but also by the attractiveness of the gift. Club points, finally, may have the advantage that
they can be accumulated across categories, and for this reason may have a more substantial
effect on product purchases. Yet, even when taking these considerations into account, the
important conclusion remains that shelf tags may play an important role in attracting attention
to promotional offers, but on their own, are not very successful in highlighting a specific
brand/SKU and increasing its sales level.
Looking across categories and based upon our simulation results, it is interesting to observe
that first screen and banner displays are especially effective for the top-selling categories (e.g.
mineral water, soft drinks), which are purchased by a larger percentage of the online shoppers
and/or on a more frequent basis. Overall, our results indicate that the effectiveness of online
ISD may not only depend on the display type that is used, but also on product category
characteristics, such as purchase frequency, penetration and differentiation. More information
would be needed though (more categories and more information on category characteristics)
in order to be able to perform a systematic analysis of these product-related differences on
ISD effectiveness. The same holds for the differences in category sales effects across product
categories, which could be a result of differences in between-category substitutability. As
argued above, also here we would need more information to formally test this.
In conclusion, we can say that manufacturers – just like with traditional ISD – can use online
ISD to highlight their products and stimulate purchase decisions, especially at the brand
market share level for top-selling categories. In all categories, we found significant positive
effects for at least one ISD type, with an average increase in brand market share of 16.65%
and 9.09% for first screen and banner displays respectively. As expected, differences in
effectiveness appear to be closely related to display type: first screen displays appear to have a

33
clear advantage compared to banner displays, while shelf tag displays have virtually no effect
on itself. In addition to display type, product characteristics also appear to affect the
effectiveness of online ISD. A simple profitability analysis further reveals that the choice
between banner and first screen displays not only depends on the increase in brand sales, but
also on the brand’s profit margin and the absolute and relative placement costs of the ISD.
While high profit margins play in the advantage of display types with a strong(er) effect on
brand sales, relatively low placement costs of less effective displays may compensate for the
lower benefits they generate.
LIMITATIONS AND FUTURE RESEARCH
Clearly, this research exhibits limitations, and leaves ample opportunities for future research.
For one, although we investigated several product categories, our findings should be verified
in other (preferably non-grocery) product categories. One very interesting area for future
research would be a context where customers are more likely to portray hedonic shopping
behavior (e.g. when buying clothes, travel packages,… ) and/or a context where they
repeatedly visit a website over multiple days/weeks before purchasing (e.g. when buying non-
durable goods such as cars, electronic appliances,… ). In addition, we could only observe but
not fully explain differences in ISD effectiveness across product categories. In many cases,
ISD effects were significant for several product categories but the magnitude of the effect
appeared to vary substantially across categories. Examining these differences in more detail
requires a larger number of categories for which display effects can be tested, and could be an
interesting topic for future research. In a similar vein, it would be very interesting to examine
whether differences in category sales effects across categories can indeed be explained by
cross-category effects. Unfortunately, due to a lack of information, we are not able to explore
this in depth.

34
Second, our analyses are limited to aggregate level models and immediate ISD effects. Using
individual level models and/or investigating dynamic effects (e.g. frequency and timing)
might constitute another interesting area for future research. In addition, focusing on other,
more attitudinal outcome variables like brand recognition and recall might help in better
understanding why not all ISD types are equally effective.
Third, in this research, we did not have access to information related to the message (e.g.
copy) and design (e.g. color, graphic versus text, static versus dynamic) that would have
allowed us to refine our (banner) results, neither were we able to estimate ‘pure’ shelf tag
effects. It would therefore be interesting to do an (experimental) research to investigate these
aspects in more detail.
Fourth, although costs attached to each ISD are undoubtedly an important factor for
manufacturers to take into consideration when deciding which ISD to buy, we lacked
information on other costs than placement costs (such as costs to design a banner) to do a
complete and detailed profitability analysis. We recognize, however, that this would be a very
interesting area to explore in future research.
Finally, despite our focus on real purchase decisions, we do not have an insight into the exact
search and browsing path of the online customers. Investigating this with eye-tracking and/or
click-stream data would also constitute an interesting avenue for future research.
35
Table 1
Characteristics of online ISD: Effect on category sales and market share (part a) and categorization of the three ISD types (part b)
Part a: Effect on category sales and brand market share Part b: Categorization of the three online ISD typesEffectCharacteristic Explanation
Cat.Sales
BrandMarketShare
First screen displays
-STORE
DEPARTMENT
Banner displays
-PRODUCT GROUP
Shelf tag displays
-CATEGORY LIST
Sequence Order in hierarchy (early) + + High-level page + Mid-level page - Low-level page -Functionality Function of webpage
(traveling)- - Traveling zone - Traveling zone - Shopping zone +
Page position (central) + + Mid-screen + Border-screen - Mid-screen +VisibilitySize (large) + + Medium/Large + Medium/Large + Small -
Exclusivity Number of ads forcompetitive brands
- No ads forcompetitivebrands
+ No ads forcompetitive brands
+ Several ads forcompetitive brands
-
Actionability Direct purchase opportunity + + Direct link + Indirect link - Direct link +
36
Table 2
Category overview and ISD descriptors
Shelf tagCategory Position intop basedupon sales
# ofbrands incategory
Averageassort-
ment size
Firstscreen*
Banner**
Price cuts* Club points* Free promotions* Premiumpromotions*
Mineral water 1 8 26 7.7% (1) 23% (3) 23% (6) 3.8% (1) 87.5% (11) 30% (3)Coke 3 3 27 34.6% (6) 19.2% (2) 38.5% (10) 3.8% (2) 53.5% (6) 50.8% (10)Sparkling water 8 8 23 11.5% (2) 11.5% (3) 42.3% (10) 3.8% (1) 74.2% (11) 21.7% (4)Beer 9 3 18 19.2% (4) 19.2% (3) 46.2% (11) 7.7% (2) 93.3% (11) 36.7% (7)Toilet paper 10 3 17 53.8% (7) 7.7% (2) 50% (11) 11.5% (4) 66.7% (8) n.r.Fabric softener 24 7 34 19.2% (3) 7.7% (3) 38.5% (13) 11.5% (4) n.r. 3.3% (1)Drinking yoghurt 26 4 17 7.7% (2) 7.7% (2) 7.7% (3) n.r. n.r. n.r.Shower soap 37 9 49 23% (4) 11.5% (3) 30.8% (7) 11.5% (4) 86.7% (10) n.r.Margarine 43 13 36 15.4% (2) 7.7% (2) 38.5% (9) 11.5% (3) n.r. n.r.Butter 45 6 22 15.4% (3) 7.7% (2) 23% (4) 11.5% (2) n.r. 10.8% (2)Example interpretation for mineral water: this category is the top selling category for the online store and has on average 8 brands and 26 SKUs in its assortment. In 7.7% ofthe observation period (2 out of 26 months), at least one SKU was promoted via a first screen display and only 1 SKU received such an ISD (meaning that the same SKU waspromoted twice with a first screen display). Banner displays were present during 23% of the observation period (6 out of 26 months), while only 3 brands were promoted witha banner display. Price cuts and club points occur for 23% and 3.8% in our observation period and 6 and 1 SKU, respectively. Free promotions are omnipresent: in as many as87.5% in our observation period, there was at least 1 SKU in the category for which customers received a certain amount for free. Premium promotions occur for 30% of thetime and 3 SKUs.
* % of months in the observation period that at least one SKU in the category was announced via a first screen display, or accompanied with a price cut, club point, free orpremium promotion (number of SKUs that are promoted with a first screen, price cut, club point, free or premium promotion display)** % of months in the observation period that at least one banner display was used to promote all SKUs of a brand in the category (number of brands that are promoted with abanner display)n.r. = not relevant (the category did not use this promotion type during our observation period)

37
Table 3
Variables in the category sales and market share models
Variable Description ModeltCatSales = Weekly category sales (expressed in €), t = 1,… ,T
1−tCatSales Lagged category sales Category sales
htD Seasonal dummies, with h = index for holiday andspecial event periods (1,… ,H)
Category sales
tFS Dummy variable equal to 1 if at least one SKU in thecategory was announced on the first screen at time t
Category sales
tBAN Dummy variable equal to 1 if at least one brand in thecategory was supported via a banner at time t
Category sales
tPC Total amount of price reduction in the category at timet
Category sales
tCP Total number of loyalty program points that could beearned in the category at time t
Category sales
tFP Dummy variable equal to 1 if at least one SKUreceived a promotion in the form of ‘buy x, get y forfree’ in the category at time t
Category sales
tPP Dummy variable equal to 1 if at least one SKUreceived a gift in the category at time t
Category sales
tsbms , = market share of SKU s (1, … ,S) of brand b (1,… ,B) at time t ( tbstb msms ,, ×= )with
tbm , = market share of brand b at time t
tbsm , = market share of SKU s within brand b at time t
tsbFS , Dummy variable equal to 1 if SKU s of brand b wasannounced on the first screen at time t
Market share,lower level
tsbPC , The amount of price reduction for SKU s of brand b attime t
Market share,lower level
tsbCP , The number of loyalty program points that could beearned when purchasing SKU s of brand b at time t
Market share,lower level
tsbFP , Dummy variable equal to 1 if SKU s of brand breceived a promotion in the form of ‘buy x, get y forfree’
Market share,lower level
tsbPP , Dummy variable equal to 1 if SKU s of brand breceived a gift
Market share,lower level
tbBAN , Dummy variable equal to 1 if brand b was supportedvia a banner
Market share,higher level
tbFS , Dummy variable equal to 1 if an SKU of brand b wasannounced on the first screen at time t
Market share,higher level
tbIV , Inclusive value for brand at time t (based on theparameters of the lower level market share model)
+= ∑ ∑
= =
S
s
M
mtsbmmstb
l
l
llXIV
1 1,, ]exp[log βα
Market share,higher level
38
Table 4
Estimation results for the category sales model a
Min. water Coke Spar. water Beer Toilet pap. Fabric soft. Drink yogh Shower soap Marg. Butter-0.083 -0.018 0.049 -0.035 0.065 -0.065 0.035 -0.012 -0.147* 0.007First screen display
Stouffer: -0.82781=cZ ; da = -0.040.242*** 0.122 0.251** 0.208*** -0.014 -0.086 0.145* 0.000 -0.045 -0.045Banner display
Stouffer: 2.827266=cZ *** ; da = 0.160.066 -0.125 -0.133 -0.068 -0.049 0.064 -0.096 0.028 0.210 0.234*Shelf tag display – price cut
Stouffer: 0.336556=cZ ; da = 0.010.168** 0.037 -0.069 0.267*** 0.266*** 0.172 n.r. 0.168* 0.266** 0.255***Shelf tag display – club point
Stouffer: 5,234984=cZ *** ; da = 0.34-0.034 0.003 -0.102 -0.057 0.093 n.r. n.r. -0.050 n.r. n.r.Shelf tag display – free
Stouffer: 0599598=cZ ; da = -0.180.008 0.165* -0.052 0.207** n.r. 0.023 n.r. n.r. n.r. -0.327**Shelf tag display – premium
Stouffer: 1,203543=cZ ; da = 0.100.339*** 0.165** 0.269*** 0.260*** 0.042 0.066 0.444*** 0.084 0.387*** 0.504***Lagged category sales
Stouffer: 10,09258=cZ *** ; da = 0.56-0.294*** -0.319*** -0.132 -0.042 -0.467*** -0.432*** -0.328*** -0.303*** -0.184** -0.137*Summer
Stouffer: -10.2938=cZ *** ; da = -0.60-0.126* -0.084 -0.088 -0.196** -0.150 -0.207** -0.265*** -0.183** -0.060 -0067Eastern
Stouffer: -4.73409=cZ ***; da = -0.32-0.248*** -0.384*** -0.346*** -0.241*** -0.356*** -0.309*** -0.067 -0.131 -0.092 -0.155**New Year/Christmas
Stouffer: -10.109=cZ *** ; da = -0.55-0.146** -0.073 -0.117 -0.102** -0.300*** -0.173** -0.054 -0.009 -0.035 -0.086Mid Term
Stouffer: -4.408008=cZ *** ; da = -0.28Adjusted R² 0.481 0.297 0.368 0.358 0.464 0.286 0.544 0.143 0.431 0.596
a Constants have been omitted from the table. *** = significant at 1% level; ** = significant at 5% level; * = significant at 10% level; n.r. = not relevant.
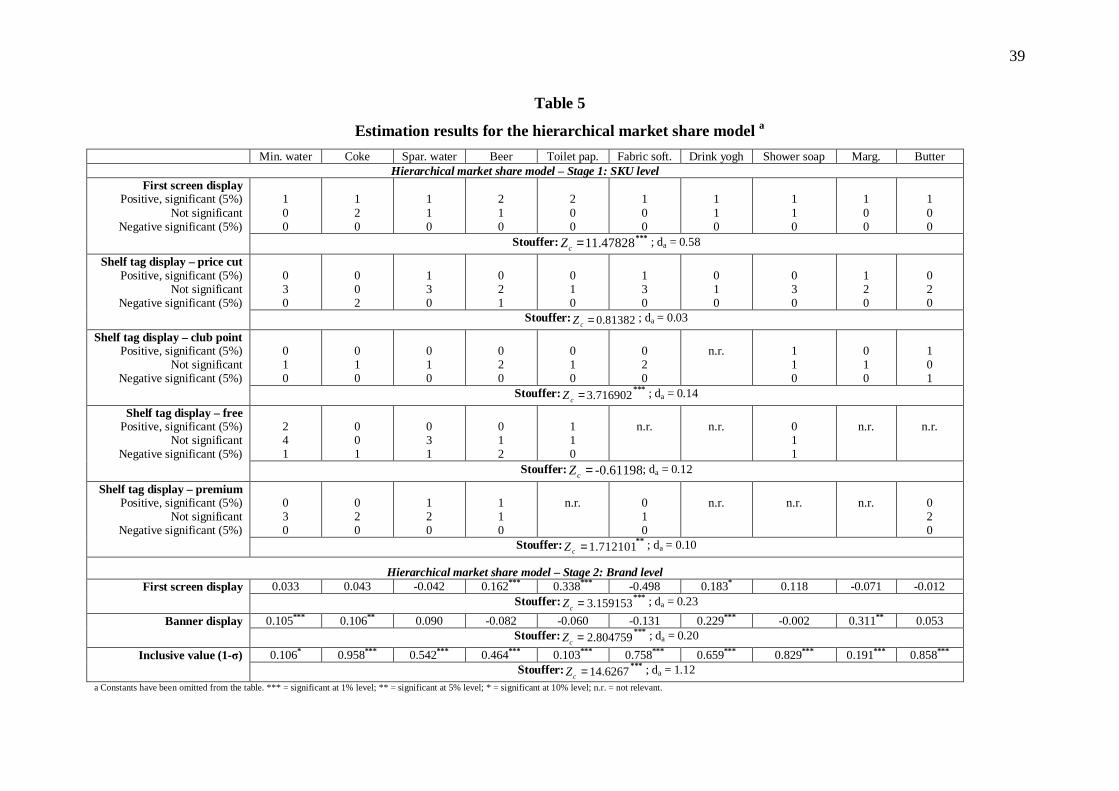
39
Table 5
Estimation results for the hierarchical market share model a
Min. water Coke Spar. water Beer Toilet pap. Fabric soft. Drink yogh Shower soap Marg. ButterHierarchical market share model – Stage 1: SKU level
100
120
110
210
200
100
110
110
100
100
First screen displayPositive, significant (5%)
Not significantNegative significant (5%)
Stouffer: 1.478281=cZ *** ; da = 0.58
030
002
130
021
010
130
010
030
120
020
Shelf tag display – price cutPositive, significant (5%)
Not significantNegative significant (5%)
Stouffer: 0.81382=cZ ; da = 0.03
010
010
010
020
010
020
n.r. 110
010
101
Shelf tag display – club pointPositive, significant (5%)
Not significantNegative significant (5%)
Stouffer: 3.716902=cZ *** ; da = 0.14
241
001
031
012
110
n.r. n.r. 011
n.r. n.r.Shelf tag display – free
Positive, significant (5%)Not significant
Negative significant (5%)Stouffer: -0.61198=cZ ; da = 0.12
030
020
120
110
n.r. 010
n.r. n.r. n.r. 020
Shelf tag display – premiumPositive, significant (5%)
Not significantNegative significant (5%)
Stouffer: 1.712101=cZ ** ; da = 0.10
Hierarchical market share model – Stage 2: Brand level0.033 0.043 -0.042 0.162*** 0.338*** -0.498 0.183* 0.118 -0.071 -0.012First screen display
Stouffer: 3.159153=cZ *** ; da = 0.230.105*** 0.106** 0.090 -0.082 -0.060 -0.131 0.229*** -0.002 0.311** 0.053Banner display
Stouffer: 2.804759=cZ *** ; da = 0.200.106* 0.958*** 0.542*** 0.464*** 0.103*** 0.758*** 0.659*** 0.829*** 0.191*** 0.858***Inclusive value (1- )
Stouffer: 14.6267=cZ *** ; da = 1.12a Constants have been omitted from the table. *** = significant at 1% level; ** = significant at 5% level; * = significant at 10% level; n.r. = not relevant.
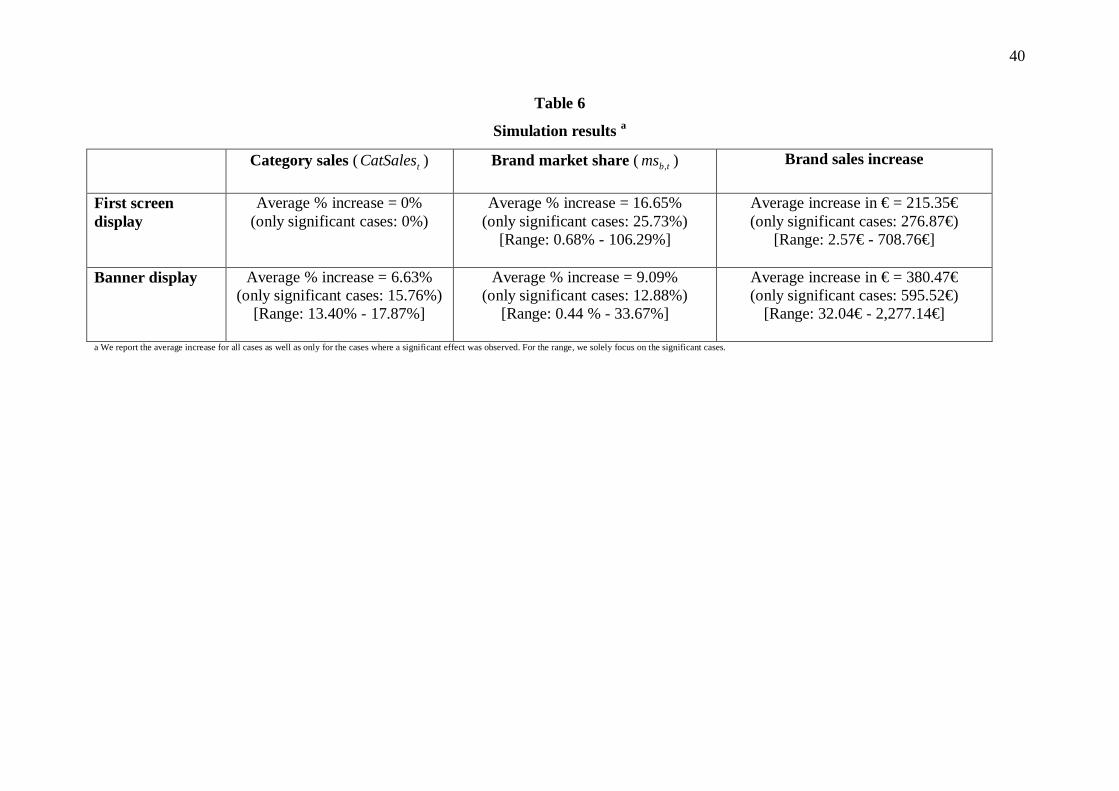
40
Table 6
Simulation results a
Category sales ( tCatSales ) Brand market share ( tbms , ) Brand sales increase
First screendisplay
Average % increase = 0%(only significant cases: 0%)
Average % increase = 16.65%(only significant cases: 25.73%)
[Range: 0.68% - 106.29%]
Average increase in € = 215.35€(only significant cases: 276.87€)
[Range: 2.57€ - 708.76€]
Banner display Average % increase = 6.63%(only significant cases: 15.76%)
[Range: 13.40% - 17.87%]
Average % increase = 9.09%(only significant cases: 12.88%)
[Range: 0.44 % - 33.67%]
Average increase in € = 380.47€(only significant cases: 595.52€)
[Range: 32.04€ - 2,277.14€]
a We report the average increase for all cases as well as only for the cases where a significant effect was observed. For the range, we solely focus on the significant cases.
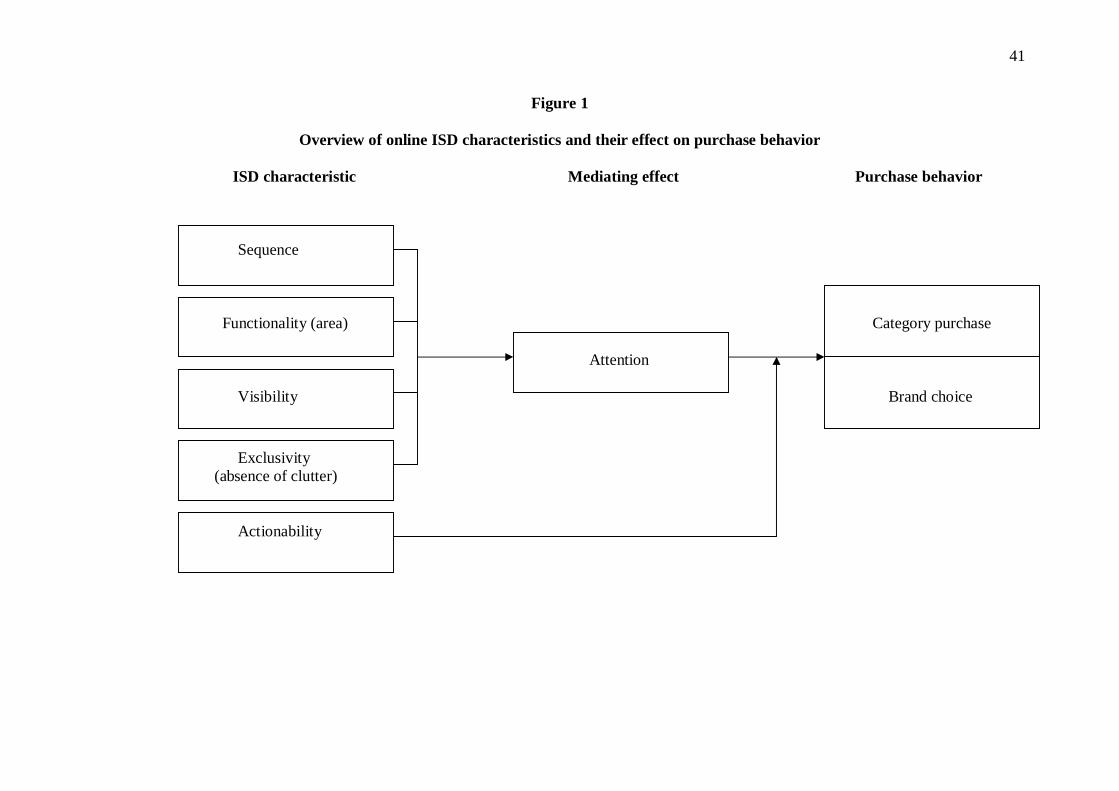
41
Figure 1
Overview of online ISD characteristics and their effect on purchase behavior
ISD characteristic Mediating effect Purchase behavior
Sequence
Functionality (area) Category purchase
Attention
Visibility Brand choice
Exclusivity (absence of clutter)
Actionability
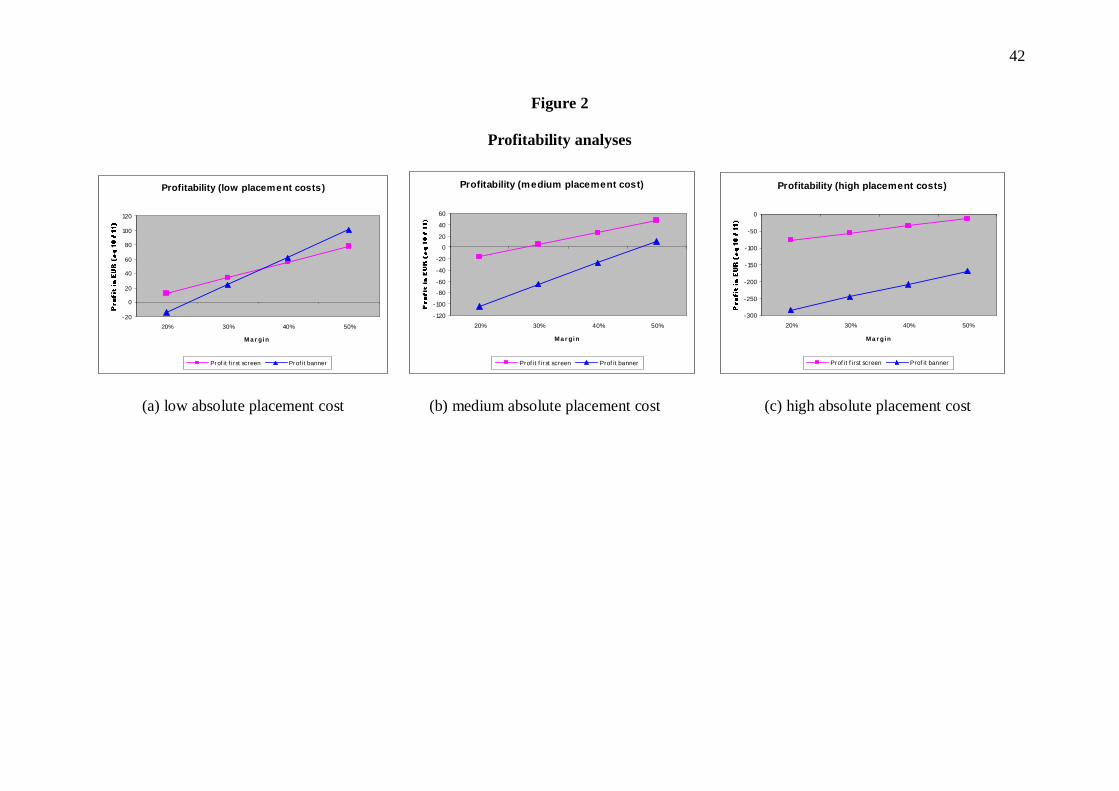
42
Figure 2
Profitability analyses
Profitability (low placement costs)
-20
0
20
40
60
80
100
120
20% 30% 40% 50%
M a r gi n
Pr of it f i rst screen Prof it banner
Profitability (medium placement cost)
-120
-100
-80
-60
-40
-20
0
20
40
60
20% 30% 40% 50%
Ma r gin
Prof it f ir st screen Prof it banner
Profitability (high placement costs)
-300
-250
-200
-150
-100
-50
0
20% 30% 40% 50%
Ma r gin
Prof it f irst screen Prof it banner
(a) low absolute placement cost (b) medium absolute placement cost (c) high absolute placement cost
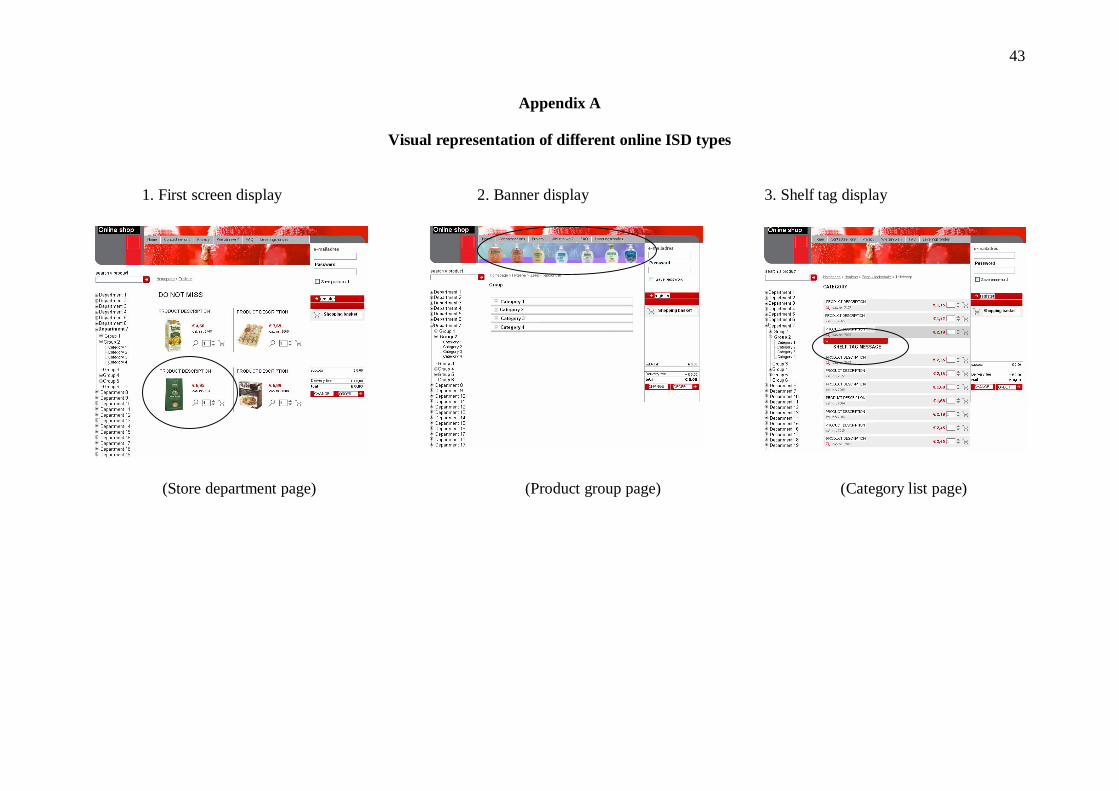
43
Appendix A
Visual representation of different online ISD types
1. First screen display 2. Banner display 3. Shelf tag display
(Store department page) (Product group page) (Category list page)
44
REFERENCES
Anderson, Eric and Duncan T. Simester (2001), “Are Sales Signs Less Effective When
More Products Have Them?,”Marketing Science, 20 (2), 121-143.
Bell, David R., Jeongwen Chian, and V. Padmanabhan (1999), “The Decomposition of
Promotional Response: An Empirical Generalization,”Marketing Science, 18 (4), 504-
526.
Bemmaor, Albert C. and Dominique Mouchoux (1991), “Measuring the Short-Term
Effect of In-Store Promotion and Retail Advertising on Brand Sales: A Factorial
Experiment,”Journal of Marketing Research, 28 (2), 202-214.
Breugelmans, Els, Katia Campo, and Els Gijsbrechts (2006), “Opportunities for Active
Stock-Out Management in Online Stores: The Impact of Stock-Out Policy on Online
Stock-Out Reactions,” Journal of Retailing, 82 (3), 215-228.
----, ----, and ---- (2007), “Shelf Sequence and Proximity Effects on Online Grocery
Choices,”Marketing Letters, 18 (1/2), 117-133.
Chan, Tat, Chakravarthi Narasimhan, and Qin Zhang (2008), “Decomposing Promotional
Effects with a Dynamic Structural Model of Flexible Consumption Preview,”Journal of
Marketing Research, 45 (4), 487-498.
45
Chandon, Jean L., Mohamed S. Chtourou, and David R. Fortin (2003), “Effects of
Configuration and Exposure Levels on Responses to Web Advertisements,”Journal of
Advertising Research, 43 (2), 217-229.
Chandon, Pierre, Wesley J. Hutchinson, Eric Bradlow, and Scott H. Young (2007),
“Measuring the Value of Point-of-Purchase Marketing with Commercial Eye-Tracking
Data,” INSEAD Business School Research Paper No. 2007/22/MKT/ACGRD.
Cho, Chang-Hoan and Hongsik, J. Cheon (2004), “Why do People Avoid Advertising on
the Internet,”Journal of Advertising, 33 (4), 89-97.
Cohen, Jacob (1977). Statistical power analysis for the behavioral sciences (revised
edition). New York: Academic Press.
Curhan, Ronald C. (1974), “The Effects of Merchandising and Temporary Promotional
Activities on the Sales of Fresh Fruits and Vegetables in Supermarkets,”Journal of
Marketing Research, 11 (3), 286-294.
DelVecchio, Devon, Shanker H. Krishnan, and Daniel C. Smith (2007), “Cents or
Percent? The Effects of Promotion Framing on Price Expectations and Choice,”Journal
of Marketing, 71 (3), 158-170.
46
Desmet, Pierre and Valerie Renaudin (1998), “Estimation of Product Category Sales
Responsiveness to Allocated Shelf Space,”International Journal or Research in
Marketing, 15 (5), 443-457.
Drèze, Xavier, Stephen Hoch, and Mary E. Purk (1994), “Shelf Management and Space
Elasticity,”Journal of Retailing, 70 (4), 301-326.
East, Robert, Vicki Eftichiadou, and Michael Williamson (2003), “Research note: Point-
of-Purchase Display and Brand Sales,”International Review of Retail, Distribution and
Consumer Research, 13(1), 127-135.
Foekens, Eijte W., Peter S.H. Leeflang, and Dick R. Wittink (1997), “Hierarchical versus
Other Market Share Models for Markets with Many Items,”International Journal of
Research in Marketing, 14 (4), 359-378.
Foubert, Bram and Els Gijsbrechts (2007), “Shopper Response to Bundle Promotions for
Packaged Goods,”Journal of Marketing Research, 44 (4), 647-662.
Gijsbrechts, Els, Katia Campo, and Tom Goossens (2003), “The Impact of Store Flyers
on Store Traffic and Store Sales: A Geo-Marketing Approach,”Journal of Retailing, 79
(1), 1-16.
47
Hanssens, Dominique M., Leonard J. Parson, and Randall L. Schultz (2001), Market
Response Models: Econometric and Time Series Analysis, Kluwer Academic Publishers.
Howard, Daniel J. and Roger A. Kerin (2006), “Broadening the Scope of Reference Price
Advertising Research: A Field Study of Consumer Shopping Involvement,”Journal of
Marketing, 70 (3), 185-204.
Hoyer, Wayne D. (1984), “An Examination of Consumer Decision Making for a
Common, Repeat-Purchase Product,”Journal of Consumer Research, 11 (3), 822-829.
Inman, Jeffrey J., Leigh McAlister, and Wayne D. Hoyer (1990), “Promotion Signal:
Proxy for a Price Cut?,”Journal of Consumer Research, 17 (1), 74-81.
Kumar, V. and Robert P. Leone (1988), “Measuring the Effect of Retail Store Promotions
on Brand and Store Substitution,”Journal of Marketing Research, 25 (2), 178-185.
Larson, Jeffrey S., Eric Bradlow, and Peter S. Fader (2005), “An Exploratory Look at
Supermarket Shopping Paths,”International Journal of Research in Marketing, 22 (4),
395-414.
Liljenwall, Robert (2004), The Power of Point-of-Purchase Advertising: Marketing at
Retail. Washington DC: Point-of-Purchase Advertising International.
48
Lohse, Gerald L. (1997), “Consumer Eye Movement Patterns on Yellow Pages
Advertising,”Journal of Advertising, 26 (1), 61-73.
McKinnon, Gary F., Patrick J. Kelly, and Robison E. Doyle (1981), “Sales Effects of
Point-of-Purchase In-Store Signing,”Journal of Retailing, 57 (2), 49-63.
Petty, Richard E. and John T. Cacioppo (1986), From Communication and Persuasion:
Central and Peripheral Routes to Attitude Change. New York: Springer-Verlag.
Pieters, Rick G.M. and Tammo H.A. Bijmolt (1997), “Consumer Memory for Television
Advertising: A Field Study of Duration, Serial Position, and Competition Effects,”
Journal of Consumer Research, 23 (4), 362-372.
Rosenthal, Robert (1991), Meta analytic procedures for social research. Applied Social
Research Methods Series. Beverly Hills: Sage Publications.
Rossiter, John R. and Larry Percy (1998), Advertising communications and promotion
management. Boston: McGraw-Hill.
Spaeth, Jim (2004), “Post-Promotion Evaluation,” Point of Purchase Advertising
International. [available at http://www.allbusiness.com/retail-trade/4250967-1.html]

49
Tellis, Gerard J. (1998), Advertising and Sales Promotion Strategy. Reading, MA:
Addison-Wesley.
Vilcassim, Naufel J. and Dipak C. Jain (1991), “Modeling Purchase-Timing and Brand-
Switching Behavior Incorporating Explanatory Variables and Unobserved
Heterogeneity,”Journal of Marketing Research, 28 (1), 29-41.
Vrechopoulos, Adam P., Robert M. O’Keefee, Georgios I. Doukidis, and George J.
Siomkos (2004), “Virtual Store Layout: An Experimental Comparison in the Context of
Grocery Retail,” Journal of Retailing, 80 (1), 13-23.
Wolf, Fredric (1986), Meta analysis: Quantitative methods for research synthesis.
Beverly Hills, CA: Sage Publications.
Zhang, Jie and Michel Wedel (2008), “The Effectiveness of Customized Promotions in
Online and Offline Stores,”Journal of Marketing Research, forthcoming.