Embed Size (px)
Citation preview

Faculty of Engineering and the Built Environment UNIVERSITY OF THE WITWATERSRAND
MSc. Electrical Power Engineering Research Report
Title: Use of Thyristor Controlled Series Capacitors (TCSCs) to enhance
power system transient stability and their possible application on the
South African Grid
Tonderayi Gumunyu (Student No. 753765)
This research report is submitted as a partial fulfilment of the requirements for a
Master of Science degree in Electrical Engineering (Power).

MSc. Electrical Power Engineering Research: University of Witwatersrand, SA
Use of TCSCs to enhance power system transient stability
and their possible application on the South African Grid i
DECLARATION
I declare that this research is my own unaided work except where specifically
acknowledged. To my knowledge this specific study to investigate the possible
application of TCSCs in the northern part of the South African transmission network
has not been conducted before.
Tonderayi Gumunyu Date

MSc. Electrical Power Engineering Research: University of Witwatersrand, SA
Use of TCSCs to enhance power system transient stability
and their possible application on the South African Grid ii
ABSTRACT
Thyristor Controlled Series Capacitors (TCSCs) are FACTS devices which
incorporate power-electronic-based and other static controllers to enhance
controllability and increase power transfer capability. This research investigated the
possibility of applying TCSCs on the South African transmission network, in
particular application on long transmission lines connecting bulk thermal generators
in the northern part of South Africa to load centres located hundreds of kilometres
elsewhere in the country. The investigation, conducted using PSS/E (a power
system analysis software) demonstrated that application of TCSCs on this part of
South African transmission network results in improved transient stability margins.
The resulting improvement in transient stability is comparable to other transient
stability enhancement options like addition of transmission lines, thus the use of
TCSCs can be considered as an alternative. Further studies would be vital to
understand the interaction between Power System Stabilizers (PSSs) and TCSCs in
order to ensure proper tuning and interaction amongst the devices.
Key Words – Thyristor Controlled Series Capacitors (TCSCs), Critical Fault Clearing
Time (CFCT)

MSc. Electrical Power Engineering Research: University of Witwatersrand, SA
Use of TCSCs to enhance power system transient stability
and their possible application on the South African Grid iii
ACKNOWLEDGEMENTS
First and foremost, my University Supervisor, Dr John Van Coller. Thank you very
much for your valued input and support.
Transmission Planners from the South African Power Utility, Eskom involved in
Medupi Power Station transmission integration, in particular Thamsanqa Ngcobo, for
the valued critique.
MSc. Power Engineering Research, University of Witwatersrand, SA
Use of TCSCs to enhance power system transient stability and their possible application on the South African Grid 1
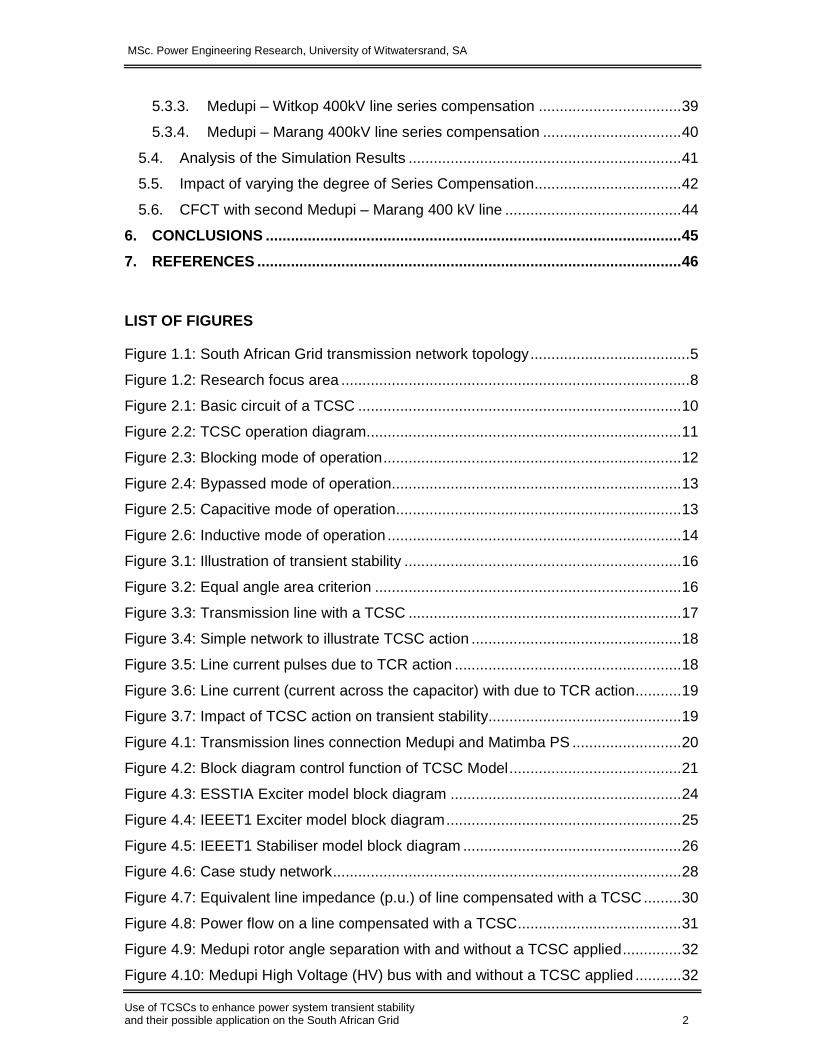
CONTENTS
ABSTRACT............................................................................................................. ii
ACKNOWLEDGEMENTS ...................................................................................... iii
1. INTRODUCTION .................................................................................................... 4
1.1. Line Series Reactance Compensating Devices ............................................... 4
1.2. Research Questions ......................................................................................... 5
1.3. Research Methodology .................................................................................... 6
1.4. Research Structure .......................................................................................... 6
1.3.1. Review of the TCSC Characteristics ......................................................... 7
1.3.2. Impact of TCSC on Transient Stability ....................................................... 7
1.3.3. Simulation on the South African Transmission Grid .................................. 7
1.3.4. Results, Analysis and Conclusions ............................................................ 9
2. REVIEW OF THE TCSC CHARACTERISTICS................. ..................................... 9
2.1. Operation of a TCSC ...................................................................................... 10
2.2. TCSC Modes of Operation ............................................................................. 12
3. IMPACT OF THE TCSC ON THE TRANSIENT STABILITY ..... ........................... 14
3.1. Transient Stability Overview ........................................................................... 15
3.2. Illustration of TCSC action.............................................................................. 17
4. INITIAL SIMULATIONS ON THE SOUTH AFRICAN TRANSMISSI ON GRID .... 20
4.1. Network under study ...................................................................................... 20
4.2. Modelling of the TCSC in PSS®E .................................................................. 21
4.3. Medupi and Matimba Generator Models ........................................................ 22
4.4. Matimba and Medupi Exciter Models ............................................................. 24
4.5. Matimba and Medupi Stabiliser Models ......................................................... 26
4.6. Case study to demonstrate TCSC action ....................................................... 27
4.6.1. Calculation of effective series capacitance .............................................. 29
4.6.2. Simulations results of the case study ...................................................... 30
5. SIMULATIONS ON THE SOUTH AFRICAN TRANSMISSION GRID – CFCT
STUDIES ..................................................................................................................... 33
5.1. Determining the CFCT without the TCSC ...................................................... 33
5.2. Summary of the results without the TCSC ..................................................... 36
5.3. TCSC applied on lines - Impact on transient stability margins ....................... 37
5.3.1. Medupi – Ngwedi 400 kV line series compensation ................................ 37
5.3.2. Medupi – Spitskop 400kV line series compensation ................................ 38
MSc. Power Engineering Research, University of Witwatersrand, SA
Use of TCSCs to enhance power system transient stability and their possible application on the South African Grid 2
5.3.3. Medupi – Witkop 400kV line series compensation .................................. 39
5.3.4. Medupi – Marang 400kV line series compensation ................................. 40
5.4. Analysis of the Simulation Results ................................................................. 41
5.5. Impact of varying the degree of Series Compensation ................................... 42
5.6. CFCT with second Medupi – Marang 400 kV line .......................................... 44
6. CONCLUSIONS ................................................................................................... 45
7. REFERENCES ..................................................................................................... 46
LIST OF FIGURES
Figure 1.1: South African Grid transmission network topology ...................................... 5
Figure 1.2: Research focus area ................................................................................... 8
Figure 2.1: Basic circuit of a TCSC ............................................................................. 10
Figure 2.2: TCSC operation diagram........................................................................... 11
Figure 2.3: Blocking mode of operation ....................................................................... 12
Figure 2.4: Bypassed mode of operation ..................................................................... 13
Figure 2.5: Capacitive mode of operation .................................................................... 13
Figure 2.6: Inductive mode of operation ...................................................................... 14
Figure 3.1: Illustration of transient stability .................................................................. 16
Figure 3.2: Equal angle area criterion ......................................................................... 16
Figure 3.3: Transmission line with a TCSC ................................................................. 17
Figure 3.4: Simple network to illustrate TCSC action .................................................. 18
Figure 3.5: Line current pulses due to TCR action ...................................................... 18
Figure 3.6: Line current (current across the capacitor) with due to TCR action ........... 19
Figure 3.7: Impact of TCSC action on transient stability.............................................. 19
Figure 4.1: Transmission lines connection Medupi and Matimba PS .......................... 20
Figure 4.2: Block diagram control function of TCSC Model ......................................... 21
Figure 4.3: ESSTIA Exciter model block diagram ....................................................... 24
Figure 4.4: IEEET1 Exciter model block diagram ........................................................ 25
Figure 4.5: IEEET1 Stabiliser model block diagram .................................................... 26
Figure 4.6: Case study network ................................................................................... 28
Figure 4.7: Equivalent line impedance (p.u.) of line compensated with a TCSC ......... 30
Figure 4.8: Power flow on a line compensated with a TCSC ....................................... 31
Figure 4.9: Medupi rotor angle separation with and without a TCSC applied .............. 32
Figure 4.10: Medupi High Voltage (HV) bus with and without a TCSC applied ........... 32

MSc. Power Engineering Research, University of Witwatersrand, SA
Use of TCSCs to enhance power system transient stability and their possible application on the South African Grid 3
Figure 5.1: CFCT without TCSC with fault applied on Medupi – Witkop 400 kV line ... 34
Figure 5.2: CFCT without TCSC with fault applied on Medupi – Spitskop 400 kV line 34
Figure 5.3: CFCT without TCSC with fault applied on Medupi – Burotho 400 kV line . 35
Figure 5.4: CFCT without TCSC with fault applied on Medupi – Ngwedi 400 kV line .. 35
Figure 5.5: CFCT without TCSC with fault applied on Medupi – Marang 400 kV line . 36
Figure 5.6: TCSC on the Medupi – Ngwedi line .......................................................... 37
Figure 5.7: CFCT with TCSC on Medupi – Ngwedi line .............................................. 38
Figure 5.8: TCSC on the Medupi – Spitskop line ........................................................ 38
Figure 5.9: CFCT with TCSC on Medupi – Spitskop line ............................................. 39
Figure 5.10: TCSC on the Medupi – Witkop line ......................................................... 39
Figure 5.11: CFCT with TCSC on Medupi – Witkop line ............................................. 40
Figure 5.12: TCSC on the Medupi – Marang line ........................................................ 40
Figure 5.13: CFCT with TCSC on Medupi – Marang line ............................................ 41
Figure 5.14: Degree of compensation varied on Medupi – Marang line ...................... 42
Figure 5.15: Compensation level vs CFCT .................................................................. 43
Figure 5.16: Fault simulated with 2 x Medupi – Marang 400 kV lines ......................... 44
LIST OF TABLES
Table 4.1 : Matimba Generator Model Parameters ..................................................... 23
Table 4.2: Medupi Generator Model Parameters ........................................................ 23
Table 4.3: Medupi Exciter model parameter values .................................................... 25
Table 4.4: Matimba Exciter model parameter values .................................................. 26
Table 4.5: Matimba Stabiliser model parameter values............................................... 27
Table 4.6: TCSC controller parameter values ............................................................. 30
Table 5.1: Calculated CFCTs without a TCSC applied................................................ 36
Table 5.2: Calculated CFCTs with TCSC applied in lines ........................................... 41
MSc. Power Engineering Research, University of Witwatersrand, SA
Use of TCSCs to enhance power system transient stability and their possible application on the South African Grid 4
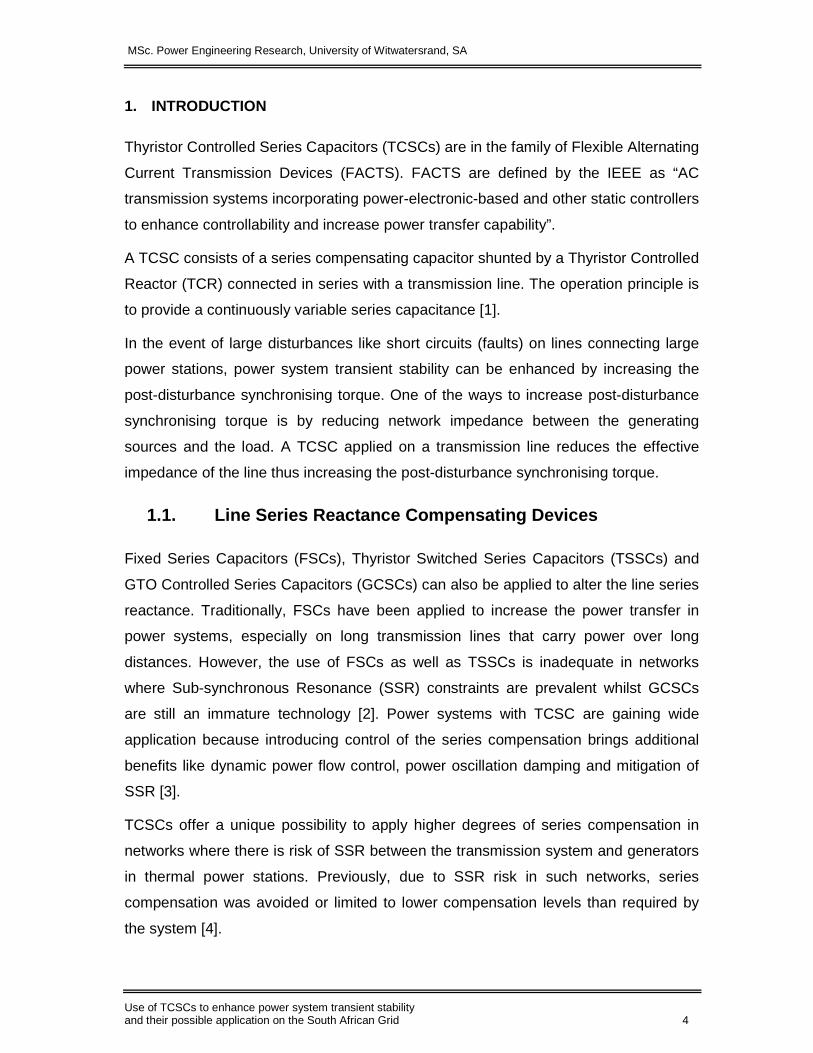
1. INTRODUCTION
Thyristor Controlled Series Capacitors (TCSCs) are in the family of Flexible Alternating
Current Transmission Devices (FACTS). FACTS are defined by the IEEE as “AC
transmission systems incorporating power-electronic-based and other static controllers
to enhance controllability and increase power transfer capability”.
A TCSC consists of a series compensating capacitor shunted by a Thyristor Controlled
Reactor (TCR) connected in series with a transmission line. The operation principle is
to provide a continuously variable series capacitance [1].
In the event of large disturbances like short circuits (faults) on lines connecting large
power stations, power system transient stability can be enhanced by increasing the
post-disturbance synchronising torque. One of the ways to increase post-disturbance
synchronising torque is by reducing network impedance between the generating
sources and the load. A TCSC applied on a transmission line reduces the effective
impedance of the line thus increasing the post-disturbance synchronising torque.
1.1. Line Series Reactance Compensating Devices
Fixed Series Capacitors (FSCs), Thyristor Switched Series Capacitors (TSSCs) and
GTO Controlled Series Capacitors (GCSCs) can also be applied to alter the line series
reactance. Traditionally, FSCs have been applied to increase the power transfer in
power systems, especially on long transmission lines that carry power over long
distances. However, the use of FSCs as well as TSSCs is inadequate in networks
where Sub-synchronous Resonance (SSR) constraints are prevalent whilst GCSCs
are still an immature technology [2]. Power systems with TCSC are gaining wide
application because introducing control of the series compensation brings additional
benefits like dynamic power flow control, power oscillation damping and mitigation of
SSR [3].
TCSCs offer a unique possibility to apply higher degrees of series compensation in
networks where there is risk of SSR between the transmission system and generators
in thermal power stations. Previously, due to SSR risk in such networks, series
compensation was avoided or limited to lower compensation levels than required by
the system [4].
MSc. Power Engineering Research, University of Witwatersrand, SA
Use of TCSCs to enhance power system transient stability and their possible application on the South African Grid 5
1.2. Research Questions
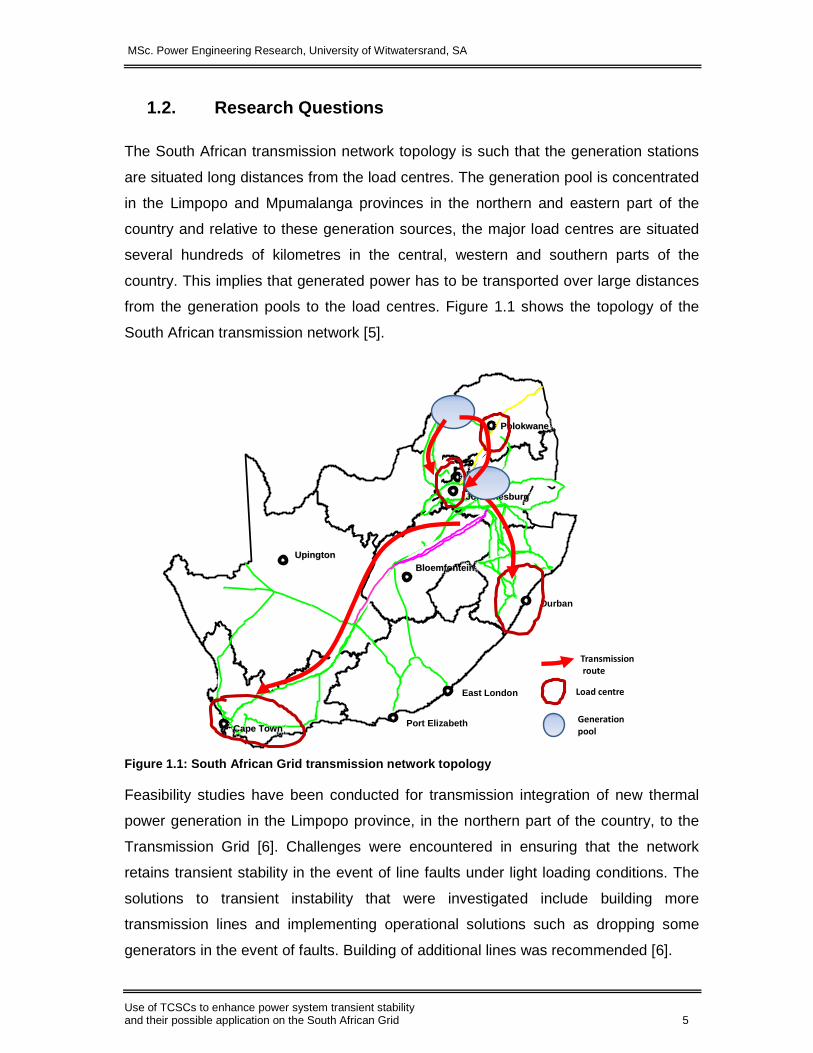
The South African transmission network topology is such that the generation stations
are situated long distances from the load centres. The generation pool is concentrated
in the Limpopo and Mpumalanga provinces in the northern and eastern part of the
country and relative to these generation sources, the major load centres are situated
several hundreds of kilometres in the central, western and southern parts of the
country. This implies that generated power has to be transported over large distances
from the generation pools to the load centres. Figure 1.1 shows the topology of the
South African transmission network [5].
Figure 1.1: South African Grid transmission network topology
Feasibility studies have been conducted for transmission integration of new thermal
power generation in the Limpopo province, in the northern part of the country, to the
Transmission Grid [6]. Challenges were encountered in ensuring that the network
retains transient stability in the event of line faults under light loading conditions. The
solutions to transient instability that were investigated include building more
transmission lines and implementing operational solutions such as dropping some
generators in the event of faults. Building of additional lines was recommended [6].
East LondonEast London
Port ElizabethPort Elizabeth
DurbanDurban
BloemfonteinBloemfonteinUpingtonUpington
JohannesburgJohannesburg
PretoriaPretoria
PolokwanePolokwane
Cape TownCape Town
Load centre
Generation
pool
Transmission
route

MSc. Power Engineering Research, University of Witwatersrand, SA
Use of TCSCs to enhance power system transient stability and their possible application on the South African Grid 6
Obtaining new servitudes to build lines is becoming very difficult in built up load
centres and new legislation being enacted to protect the environment renders new
servitudes improbable in some areas. In addition to this, building new transmission
lines may be too costly especially over long distances. Operational solutions are not
preferred because they result in a very tight operating regime which may not allow
sufficient network operation flexibility.
This research will focus on the possibility of applying TCSCs on the South African grid
to enhance transient stability. The investigation will only focus on TCSCs and no other
series compensation devices because SSR risk is of concern in this part of the South
African network where thermal generators interact with the transmission system. The
research seeks to provide answers to the following questions:
• What is the impact on transient stability of applying Thyristor Controlled Series
Capacitors (TCSCs) on long transmission lines connecting thermal generators
in the northern part of South Africa to the load centres?
• How significant is the improvement in transient stability margins if any?
• How sensitive are the stability margins to the degree of series compensation?
• In this part of the network, would the application of TCSCs be considered an
alternative to conventional solutions like the building of additional lines?
1.3. Research Methodology
The research will entail a review of the theory behind the operation of a TCSC. The
review will also encompass transient stability literature and the impact of TCSC action
on transient stability. The possible application of a TCSC on the South African Grid will
be investigated by conducting simulations on the future South African transmission
network (year 2020) post commissioning of the 6 x 846 MW Medupi Power station in
the northern part of South Africa [6].
1.4. Research Structure
The following sections summarise the content of each chapter and provide an
overview of the structure and flow of the research report.
MSc. Power Engineering Research, University of Witwatersrand, SA
Use of TCSCs to enhance power system transient stability and their possible application on the South African Grid 7
1.3.1. Review of the TCSC Characteristics
TCSCs are in the family of FACTS devices which are devices employed in power
systems to enhance power control. Chapter 2 discusses the components of a TCSC,
how they achieve a variable reactance across the TCSC module and the TCSC
operational characteristics relating to dynamic active power control.
1.3.2. Impact of TCSC on Transient Stability
In the event of large disturbances (e.g. line faults) on a power system, connected
generators accelerate and absorb kinetic energy. The ability of a power system to
retain synchronism amongst all connected generators after a disturbance is called
transient stability. Transient stability is dependent on the ability of generators to
decelerate by transferring absorbed kinetic energy into the electrical network. A
generator strongly connected (implying lower impedance) to the rest of the network
will be able to transfer a large amount of electrical power after the disturbance, thus
dissipating significant kinetic energy. The post-disturbance power transfer to the
network is a function of bus voltage magnitude, load angle and network impedance.
The operation principle of a TCSC is to reduce the network impedance thus increasing
the power transfer. In the event of large network disturbances, transient stability can
be enhanced by increasing the post-disturbance power transfer. Chapter 3 discusses
the impact on transient stability when TCSCs are connected in series with a
transmission line in a power system.
1.3.3. Simulation on the South African Transmission Grid
The South African Transmission Grid will be employed to demonstrate possible
application of TCSCs. The focus will be on the lines supplied from the generation pool
north of South Africa, which traverse long distances to load centres in the central and
south eastern parts of South Africa. Simulations will be based on the future South
African transmission network that takes into account large thermal generation in the
northern power pool. Large network disturbances in the mould of three-phase line
faults will be simulated on selected lines to determine the impact on transient stability
of applying TCSCs.
Figure 1.2 depicts the South African transmission network with focus on the research
study area enclosed by the dotted red rectangle. The focus area encompasses long
lines connecting the northern generation pool to the transmission network.

MSc. Power Engineering Research, University of Witwatersrand, SA
Use of TCSCs to enhance power system transient stability and their possible application on the South African Grid 8
Figure 1.2: Research focus area
Analysis will be conducted using PSS®E, a time domain based software that can be
employed to conduct transient stability studies for large power systems. The TCSC will
be employed on various lines connected to the northern power pool and three-phase
line faults will be simulated to determine the impact of TCSC action.
The simulations will seek to achieve the following three objectives:
� Determine if the introduction of a TCSC results in improved transient stability
margins;
� Determine the optimal placing of the TCSC; and
� Determine the impact of varying the degree of compensation.
The impact of introducing a TCSC will be determined by calculating the Critical Fault
Clearing Times (CFCTs) with and without the TCSC. CFCT is defined as the
maximum duration within which a fault on a power system should be cleared and
beyond this duration the power system becomes transiently unstable. The impact of
the TCSC will be simulated on various transmission lines emanating from the
Lephalale power pool in order to determine the series compensated line that results in
the largest improvement in CFCT. Chapter 4 discusses the various models that will be
employed in the studies as well as presents results of the analysis of the test case
study that demonstrates TCSC action.
East LondonEast London
Port ElizabethPort Elizabeth
DurbanDurban
BloemfonteinBloemfonteinUpingtonUpington
JohannesburgJohannesburg
PretoriaPretoria
PolokwanePolokwane
Cape TownCape Town
Load centre
Generation
pool
Transmission
route

MSc. Power Engineering Research, University of Witwatersrand, SA
Use of TCSCs to enhance power system transient stability and their possible application on the South African Grid 9
1.3.4. Results, Analysis and Conclusions
The impact of the TCSC action will be determined based on results obtained from
three-phase line faults simulated. Results will be based on time domain graphs that
depict network behaviour before, during and after the three-phase line faults. Chapter
5 discusses the results obtained from the various scenarios studied. Results obtained
should give a guide in selection of the compensated line that will result in the greatest
benefit from the use of a TCSC. Transient stability trends emerging depending on the
compensation level will be determined. The machine signal oscillations will also be
plotted to give an indication of network behaviour resulting from the disturbances as
well as the impact of the TCSC on CFCTs.
CFCTs will be used as the measure of transient stability margins. Beyond the CFCT,
the energy absorbed by the affected generators during the fault would not be
transferrable to the connected network without some generators losing synchronism. A
higher CFCT indicates a strongly connected transmission network for evacuation of
power. The expectation is that the CFCTs (transient stability margins) will increase
when TCSCs are applied on transmission lines.
Chapter 6 presents conclusions deduced from the investigations conducted.
2. REVIEW OF THE TCSC CHARACTERISTICS
SSR risk is associated with higher degrees of compensation of transmission lines fed
from thermal generators. In such cases, analyses have shown that the complementary
series resonance frequency of the compensated line coincides with some poorly
damped torsional vibration frequency of the turbo-generator shaft and this could
induce increased mechanical stress in the shafts [7].
Two main approaches can be employed to mitigate SSR effects, the first being
employing an active filter that monitors the SSR frequencies and controls the series
capacitor voltage to introduce an electrical damping torque. The second approach
entails making the series capacitor act inductively in the subsynchronous frequency
band, thereby preventing subsynchronous torsional interaction between the series
capacitor and the shaft of a turbine generator [7]. Due to thermal generation being
dominant (SSR concerns become key) in the northern part of South Africa, the
application of TCSCs in this part of the network is preferred.
MSc. Power Engineering Research, University of Witwatersrand, SA
Use of TCSCs to enhance power system transient stability and their possible application on the South African Grid 10
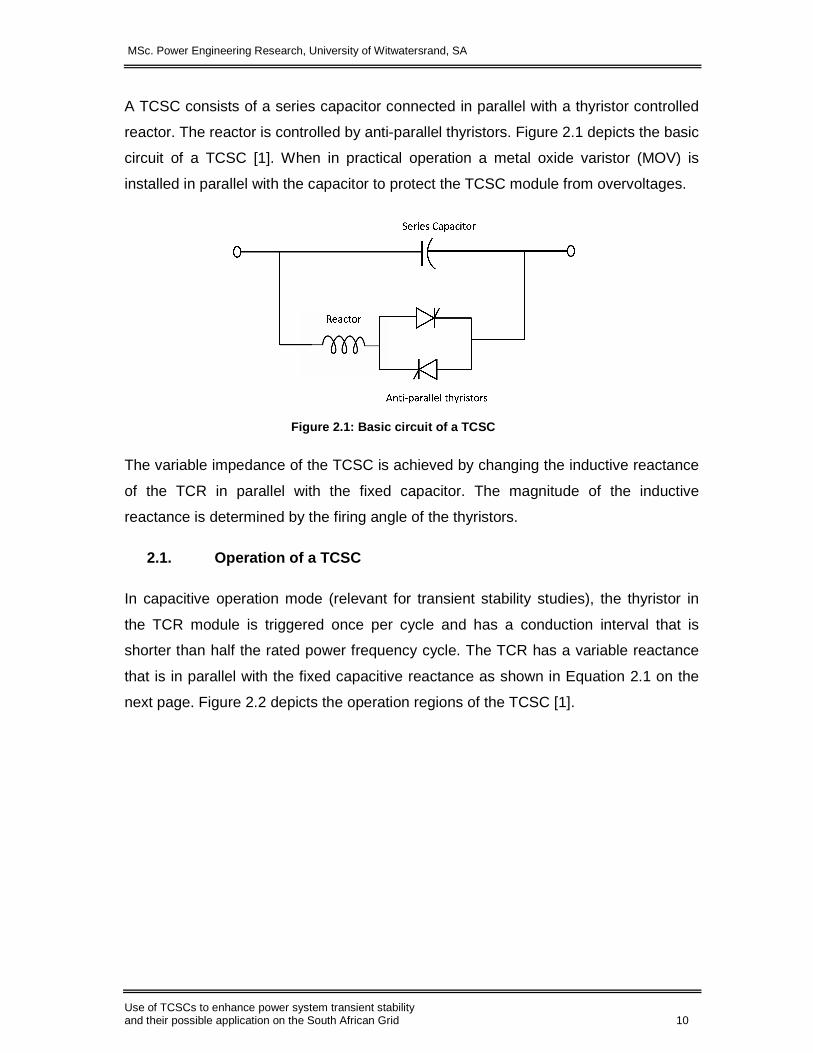
A TCSC consists of a series capacitor connected in parallel with a thyristor controlled
reactor. The reactor is controlled by anti-parallel thyristors. Figure 2.1 depicts the basic
circuit of a TCSC [1]. When in practical operation a metal oxide varistor (MOV) is
installed in parallel with the capacitor to protect the TCSC module from overvoltages.
Figure 2.1: Basic circuit of a TCSC
The variable impedance of the TCSC is achieved by changing the inductive reactance
of the TCR in parallel with the fixed capacitor. The magnitude of the inductive
reactance is determined by the firing angle of the thyristors.
2.1. Operation of a TCSC
In capacitive operation mode (relevant for transient stability studies), the thyristor in
the TCR module is triggered once per cycle and has a conduction interval that is
shorter than half the rated power frequency cycle. The TCR has a variable reactance
that is in parallel with the fixed capacitive reactance as shown in Equation 2.1 on the
next page. Figure 2.2 depicts the operation regions of the TCSC [1].

MSc. Power Engineering Research, University of Witwatersrand, SA
Use of TCSCs to enhance power system transient stability and their possible application on the South African Grid 11
Figure 2.2: TCSC operation diagram
The magnitude of the resultant reactance of the TCSC, XTCSC is given by the
expression [1]:
(2.1)
If the firing angle, � of the thyristors is 0 < � < (�/2�, the magnitude of the TCR
reactance is given by the expression [1] below:
(2.2)
Where, � � 2� is the conduction angle
Resonance occurs when XTCR��� = XC and at resonance, XTCR is infinite. The TCSC
must not be operated close to resonance. The shaded operating region in Figure 2.2
is the prohibited resonance region. As shown in Figure 2.2, the TCSC is inductive if
the firing angle is smaller than resonance angle and is capacitive for firing angle
greater than resonance angle [9].
CTCR
TCRCTCSC XX
XXX
−=
)(
)()(
ααα
)2sin2
()(ααπ
πα−−
= LTCR XX
MSc. Power Engineering Research, University of Witwatersrand, SA
Use of TCSCs to enhance power system transient stability and their possible application on the South African Grid 12
2.2. TCSC Modes of Operation
The TCSC has four modes of operation namely blocking mode, bypass mode,
capacitive mode and inductive mode. The firing angle of the TCR part of the TCSC
determines the mode of operation. In order to determine whether the TCSC is
capacitive or inductive, a negative sign is introduced to Equation 2.1, to form Equation
2.3 [9].
(2.3)
If XTCSC is positive (XTCR< XC), then the TCSC exhibits an inductive effect and if XTCSC
is negative (XTCR> XC), it exhibits a capacitive effect. When, XTCR = ∞, the thyristors
are blocked.
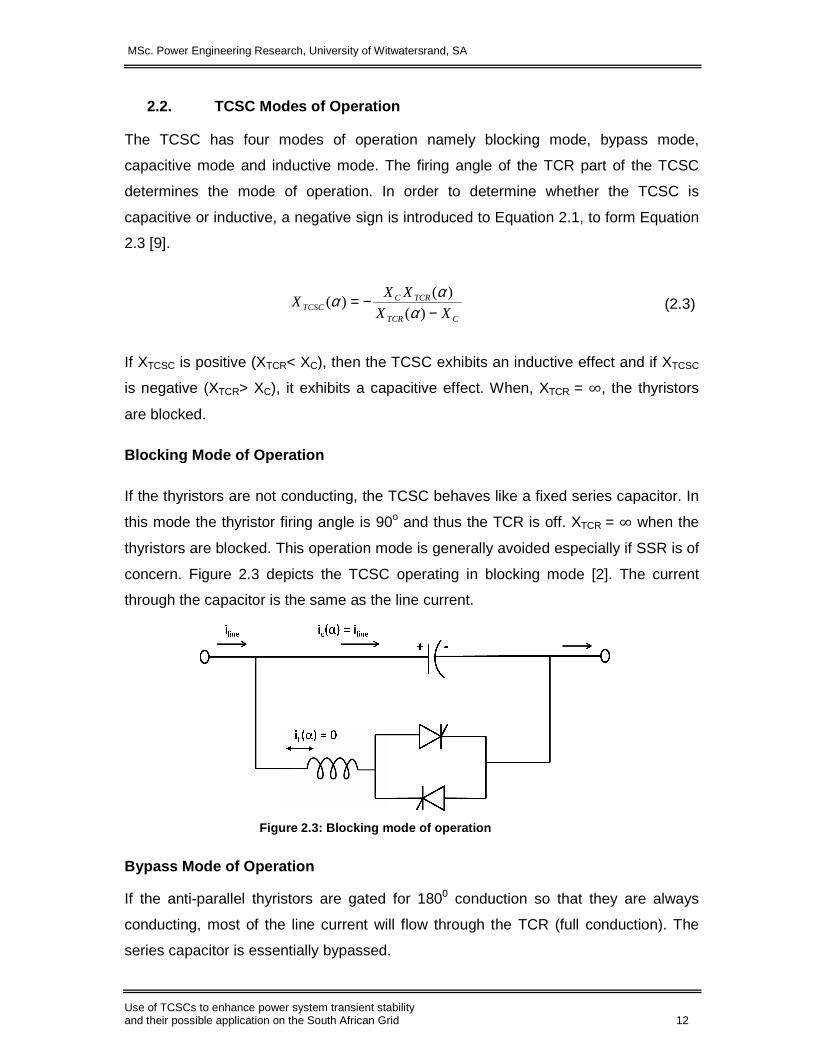
Blocking Mode of Operation
If the thyristors are not conducting, the TCSC behaves like a fixed series capacitor. In
this mode the thyristor firing angle is 90o and thus the TCR is off. XTCR = ∞ when the
thyristors are blocked. This operation mode is generally avoided especially if SSR is of
concern. Figure 2.3 depicts the TCSC operating in blocking mode [2]. The current
through the capacitor is the same as the line current.
Figure 2.3: Blocking mode of operation
Bypass Mode of Operation
If the anti-parallel thyristors are gated for 1800 conduction so that they are always
conducting, most of the line current will flow through the TCR (full conduction). The
series capacitor is essentially bypassed.
CTCR
TCRCTCSC XX
XXX
−−=
)(
)()(
ααα

MSc. Power Engineering Research, University of Witwatersrand, SA
Use of TCSCs to enhance power system transient stability and their possible application on the South African Grid 13
Since XC is much greater than XTCR, the TCSC reactance, XTCSC given by the Equation
(2.3) is positive implying that the TCSC will exhibit an inductive effect [9]. Figure 2.4
depicts the TCSC operating in bypassed mode [2].
Figure 2.4: Bypassed mode of operation
Capacitive Mode of Operation
In this mode the thyristors are gated in the region where �� � � � �/2 such that
conduction is for part of the cycle (partial conduction).
For this firing angle, XTCR > XC, thus XTCSC as given by the Equation (2.3) is negative
and the TCSC exhibits a capacitive effect. Figure 2.5 depicts the TCSC operating in
capacitive mode [2].
Figure 2.5: Capacitive mode of operation
MSc. Power Engineering Research, University of Witwatersrand, SA
Use of TCSCs to enhance power system transient stability and their possible application on the South African Grid 14
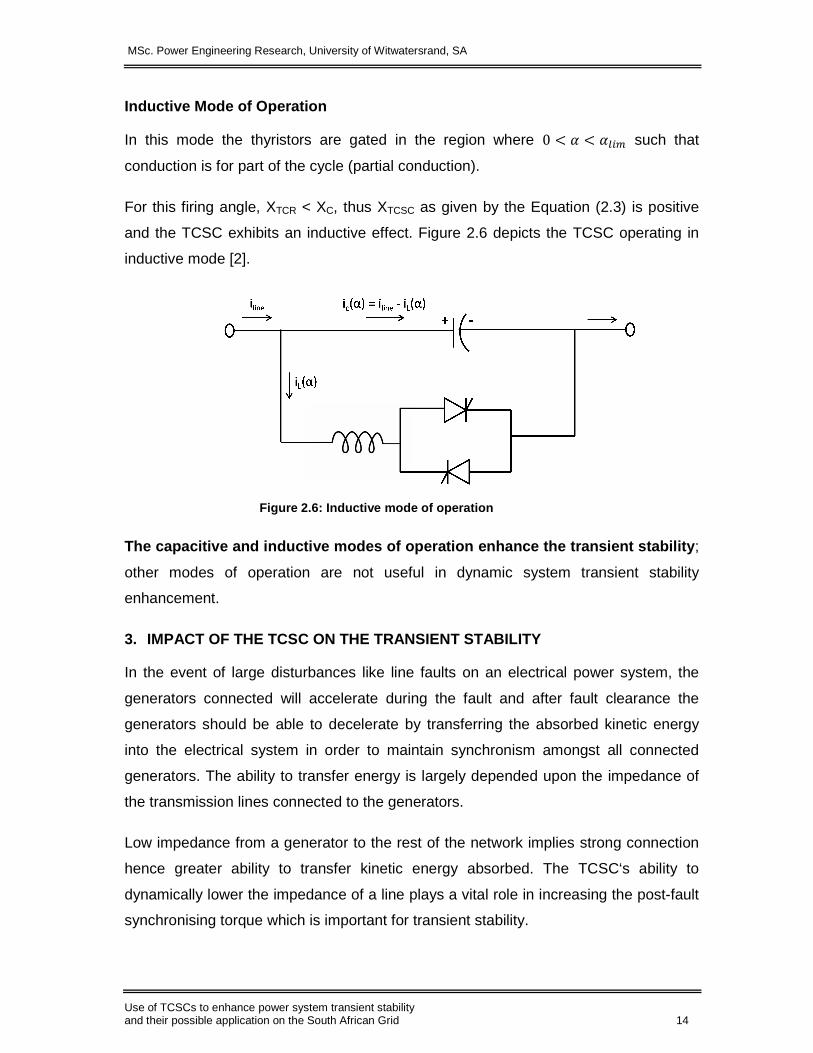
Inductive Mode of Operation
In this mode the thyristors are gated in the region where 0 � � � �� such that
conduction is for part of the cycle (partial conduction).
For this firing angle, XTCR < XC, thus XTCSC as given by the Equation (2.3) is positive
and the TCSC exhibits an inductive effect. Figure 2.6 depicts the TCSC operating in
inductive mode [2].
Figure 2.6: Inductive mode of operation
The capacitive and inductive modes of operation enhance the transient stability;
other modes of operation are not useful in dynamic system transient stability
enhancement.
3. IMPACT OF THE TCSC ON THE TRANSIENT STABILITY
In the event of large disturbances like line faults on an electrical power system, the
generators connected will accelerate during the fault and after fault clearance the
generators should be able to decelerate by transferring the absorbed kinetic energy
into the electrical system in order to maintain synchronism amongst all connected
generators. The ability to transfer energy is largely depended upon the impedance of
the transmission lines connected to the generators.
Low impedance from a generator to the rest of the network implies strong connection
hence greater ability to transfer kinetic energy absorbed. The TCSC‘s ability to
dynamically lower the impedance of a line plays a vital role in increasing the post-fault
synchronising torque which is important for transient stability.

MSc. Power Engineering Research, University of Witwatersrand, SA
Use of TCSCs to enhance power system transient stability and their possible application on the South African Grid 15
3.1. Transient Stability Overview
From the swing equation [10]:
(3.1)
where:
Pm = mechanical power input (pu)
Pmax = maximum electrical power output (pu)
H = inertia constant (MW-sec/MVA)
� = rotor angle (elec. radians)
t = time (sec.)
From Equation 3.1, Acceleration Power during the fault, Pa = Pm – Pmax Sin δ. From
the onset of the fault, the generator accelerates because the mechanical power, Pm is
much larger that Pe, the electrical power. The magnitude of the electrical power, Pe (Pe
= Pmax Sin δ), depends on the fault type and location. For faults very close to the
generator Pe is approximately zero [10].
During a fault, as the machines accelerate they absorb and build up kinetic energy.
The kinetic energy stored depends on the generator inertia, fault type and fault
duration. After fault clearance the generators start decelerating and the kinetic energy
absorbed has to be transferred into the system via a sufficiently strong network to
ensure that all the kinetic energy absorbed is expended.
When the kinetic energy transferred during the generators deceleration is equal to the
kinetic energy absorbed during acceleration, the generators would maintain
synchronism.
The transient stability phenomenon can be illustrated using the classic generator
model (represented by a transient voltage, E’ behind a transient reactance, X’d)
connected via a step-up transformer to a network of two transmission lines supplying
an infinite bus.
δδω
sin2
max2
2
0
PPdt
dHm −=
MSc. Power Engineering Research, University of Witwatersrand, SA
Use of TCSCs to enhance power system transient stability and their possible application on the South African Grid 16
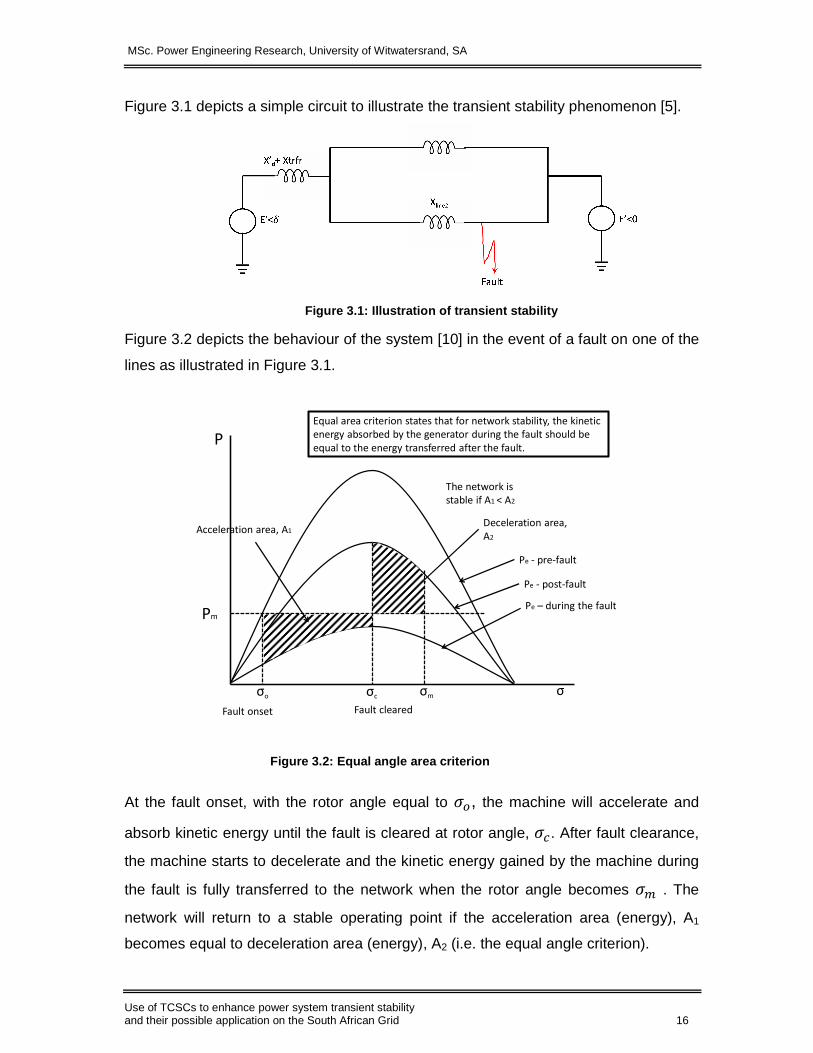
Figure 3.1 depicts a simple circuit to illustrate the transient stability phenomenon [5].
Figure 3.1: Illustration of transient stability
Figure 3.2 depicts the behaviour of the system [10] in the event of a fault on one of the
lines as illustrated in Figure 3.1.
Figure 3. 2: Equal angle area criterion
At the fault onset, with the rotor angle equal to ��, the machine will accelerate and
absorb kinetic energy until the fault is cleared at rotor angle, ��. After fault clearance,
the machine starts to decelerate and the kinetic energy gained by the machine during
the fault is fully transferred to the network when the rotor angle becomes � . The
network will return to a stable operating point if the acceleration area (energy), A1
becomes equal to deceleration area (energy), A2 (i.e. the equal angle criterion).
σ
P
Pm
σo σc
Deceleration area,
A2Acceleration area, A1
Equal area criterion states that for network stability, the kinetic
energy absorbed by the generator during the fault should be
equal to the energy transferred after the fault.
The network is
stable if A1 < A2
Fault onset
Pe - pre-fault
Fault cleared
Pe - post-fault
Pe – during the fault
σm

MSc. Power Engineering Research, University of Witwatersrand, SA
Use of TCSCs to enhance power system transient stability and their possible application on the South African Grid 17
3.2. Illustration of TCSC action
The impact of a TCSC on transient stability is illustrated in this section. Figure 3.3
shows a transmission line equipped with a TCSC.
Figure 3.3: Tra nsmission line with a TCSC
In the absence of a TCSC, the active power transferred from node, V1 to node, V2 is a
function of the sending end voltage, V1, receiving end voltage, V2, load angle
difference,�� - �� and the effective line impedance, Xline.
Active power transferred is given by the expression [1]:
P12 =��.�������
. Sin��� - ��) (3.2)
If a TCSC is installed on the transmission as shown in Figure 3.3, the power
transmitted between node, V1 and node, V2 becomes:
P”12 = P12 + ∆ =
��.���!∆"�
�����#∆�. Sin��� -�� # ∆�) (3.3)
Where,
∆ is the change in power transfer,
∆$ is the voltage change in node, V2 as result of change in line impedance,
∆% is the change in line impedance as a result of the resultant reactance, XTCSC via the
action of the TCSC,
∆� is the change in the load angle caused by the changed reactance of the
transmission line.
MSc. Power Engineering Research, University of Witwatersrand, SA
Use of TCSCs to enhance power system transient stability and their possible application on the South African Grid 18
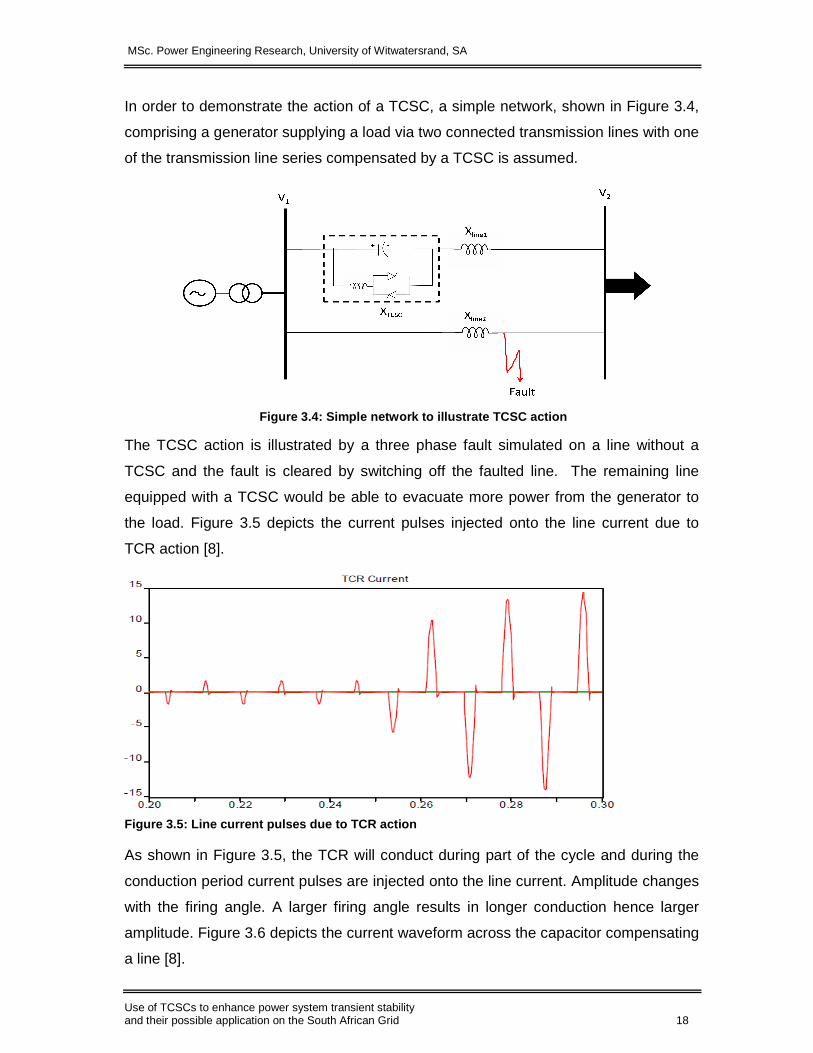
In order to demonstrate the action of a TCSC, a simple network, shown in Figure 3.4,
comprising a generator supplying a load via two connected transmission lines with one
of the transmission line series compensated by a TCSC is assumed.
Figure 3.4: Simple network to illustrate TCSC actio n
The TCSC action is illustrated by a three phase fault simulated on a line without a
TCSC and the fault is cleared by switching off the faulted line. The remaining line
equipped with a TCSC would be able to evacuate more power from the generator to
the load. Figure 3.5 depicts the current pulses injected onto the line current due to
TCR action [8].
Figure 3.5: Line current pulses due to TCR action
As shown in Figure 3.5, the TCR will conduct during part of the cycle and during the
conduction period current pulses are injected onto the line current. Amplitude changes
with the firing angle. A larger firing angle results in longer conduction hence larger
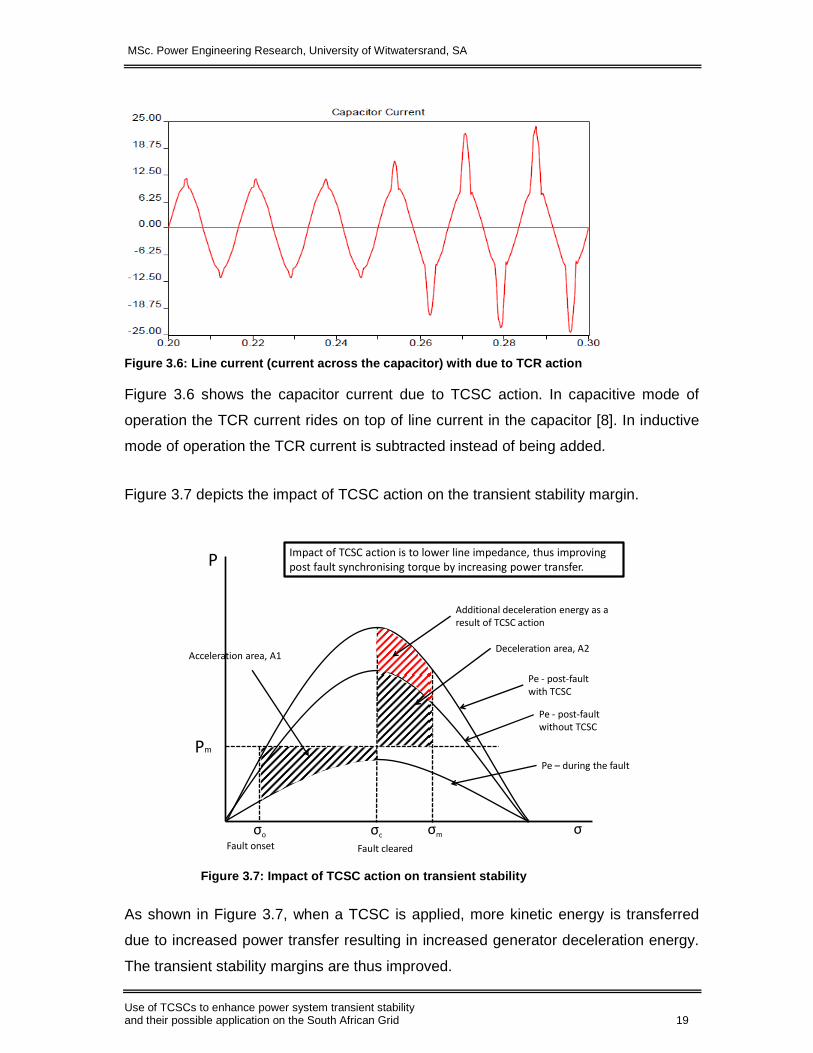
amplitude. Figure 3.6 depicts the current waveform across the capacitor compensating
a line [8].
MSc. Power Engineering Research, University of Witwatersrand, SA
Use of TCSCs to enhance power system transient stability and their possible application on the South African Grid 19
Figure 3.6: Line current (current across the capaci tor) with due to TCR action
Figure 3.6 shows the capacitor current due to TCSC action. In capacitive mode of
operation the TCR current rides on top of line current in the capacitor [8]. In inductive
mode of operation the TCR current is subtracted instead of being added.
Figure 3.7 depicts the impact of TCSC action on the transient stability margin.
Figure 3.7: Impact of TCSC ac tion on transient stability
As shown in Figure 3.7, when a TCSC is applied, more kinetic energy is transferred
due to increased power transfer resulting in increased generator deceleration energy.
The transient stability margins are thus improved.
σ
P
Pm
σo σc
Deceleration area, A2Acceleration area, A1
Impact of TCSC action is to lower line impedance, thus improving
post fault synchronising torque by increasing power transfer.
Additional deceleration energy as a
result of TCSC action
Fault onset
Pe - post-fault
with TCSC
Fault cleared
Pe - post-fault
without TCSC
Pe – during the fault
σm
MSc. Power Engineering Research, University of Witwatersrand, SA
Use of TCSCs to enhance power system transient stability and their possible application on the South African Grid 20
4. INITIAL SIMULATIONS ON THE SOUTH AFRICAN TRANSMI SSION GRID
4.1. Network under study
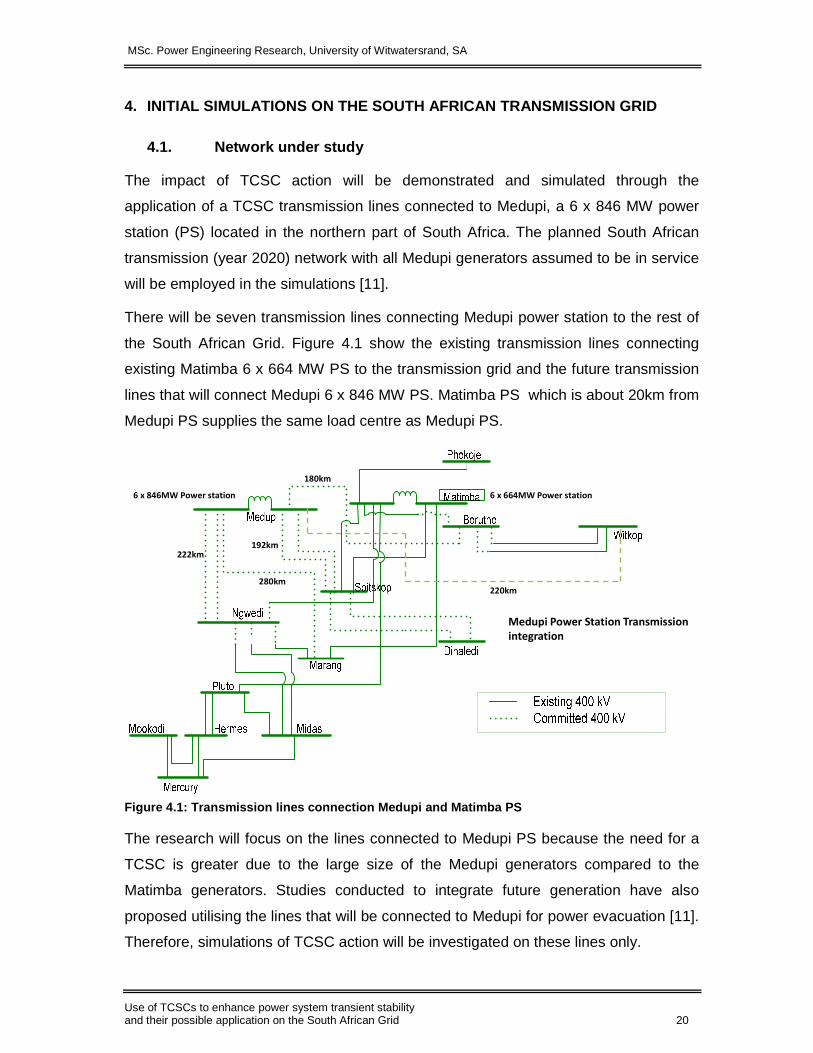
The impact of TCSC action will be demonstrated and simulated through the
application of a TCSC transmission lines connected to Medupi, a 6 x 846 MW power
station (PS) located in the northern part of South Africa. The planned South African
transmission (year 2020) network with all Medupi generators assumed to be in service
will be employed in the simulations [11].
There will be seven transmission lines connecting Medupi power station to the rest of
the South African Grid. Figure 4.1 show the existing transmission lines connecting
existing Matimba 6 x 664 MW PS to the transmission grid and the future transmission
lines that will connect Medupi 6 x 846 MW PS. Matimba PS which is about 20km from
Medupi PS supplies the same load centre as Medupi PS.
Figure 4.1: Transmission lines connection Medupi an d Matimba PS
The research will focus on the lines connected to Medupi PS because the need for a
TCSC is greater due to the large size of the Medupi generators compared to the
Matimba generators. Studies conducted to integrate future generation have also
proposed utilising the lines that will be connected to Medupi for power evacuation [11].
Therefore, simulations of TCSC action will be investigated on these lines only.
220km
192km
180km
222km
280km
Medupi Power Station Transmission
integration
6 x 846MW Power station 6 x 664MW Power station
MSc. Power Engineering Research, University of Witwatersrand, SA
Use of TCSCs to enhance power system transient stability and their possible application on the South African Grid 21
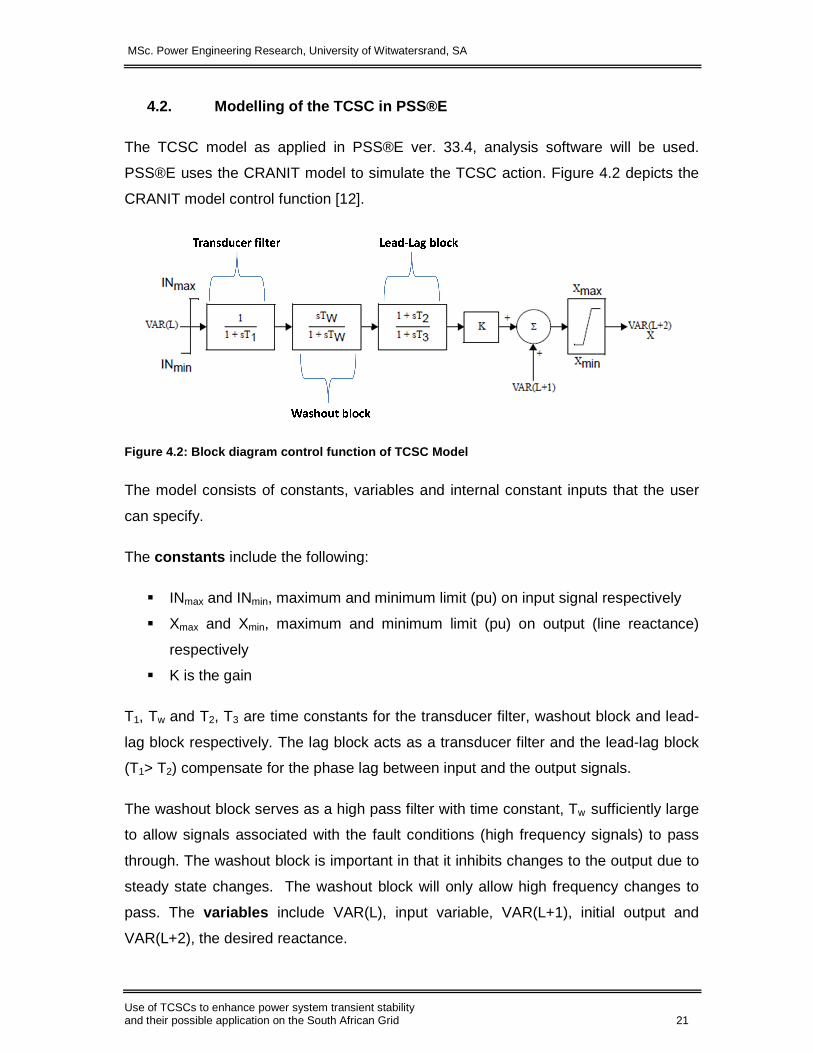
4.2. Modelling of the TCSC in PSS®E
The TCSC model as applied in PSS®E ver. 33.4, analysis software will be used.
PSS®E uses the CRANIT model to simulate the TCSC action. Figure 4.2 depicts the
CRANIT model control function [12].
Figure 4.2: Block diagram control function of TCSC Model
The model consists of constants, variables and internal constant inputs that the user
can specify.
The constants include the following:
� INmax and INmin, maximum and minimum limit (pu) on input signal respectively
� Xmax and Xmin, maximum and minimum limit (pu) on output (line reactance)
respectively
� K is the gain
T1, Tw and T2, T3 are time constants for the transducer filter, washout block and lead-
lag block respectively. The lag block acts as a transducer filter and the lead-lag block
(T1> T2) compensate for the phase lag between input and the output signals.
The washout block serves as a high pass filter with time constant, Tw sufficiently large
to allow signals associated with the fault conditions (high frequency signals) to pass
through. The washout block is important in that it inhibits changes to the output due to
steady state changes. The washout block will only allow high frequency changes to
pass. The variables include VAR(L), input variable, VAR(L+1), initial output and
VAR(L+2), the desired reactance.

MSc. Power Engineering Research, University of Witwatersrand, SA
Use of TCSCs to enhance power system transient stability and their possible application on the South African Grid 22
The model internal inputs that the user can specify include the following:
CRANIT Input Code:
� pu current on branch (branch between two busbars)
� pu power on branch (branch between two busbars)
� pu frequency difference between two busbars
� pu busbar voltage
� pu frequency deviation on busbar
� machine speed deviation (machine at busbar)
In PSS®E, the branch impedance is adjusted by thyristor control of a reactor in
parallel with a series capacitor. The CRANIT model assumes the impedance
adjustment to be both continuous and linear.
Compensation limits Xmax and Xmin can take any positive (reactor) or negative
(capacitor) value, as long as their range includes the initial branch reactance [13].
Upon initialization, model output VAR (L+1) and VAR (L+2) are set equal to the power
flow branch reactance. Because of the washout (Tw), controller output is zero in the
steady-state. As the simulation progresses, the effective branch reactances are
modified in response to changes in controller input VAR (L).
The controls for power system stability in response to large disturbances are generally
treated as two separate issues [14]. Transient or first-swing stability deals with the
system recovery during the first swing. Damping of subsequent oscillations commonly
known as dynamic stability is the second aspect. To improve first-swing stability, it is
necessary to increase the system synchronizing power. The TCSC power equipment
(i.e., the actual reactance element and firing controls) can be represented relatively
simply in the stability program. In this case, the firing control system can be
represented by a first-order filter with a time constant (order of 50 ms). Switching could
be made on the basis of measured power, line current, or bus voltage.
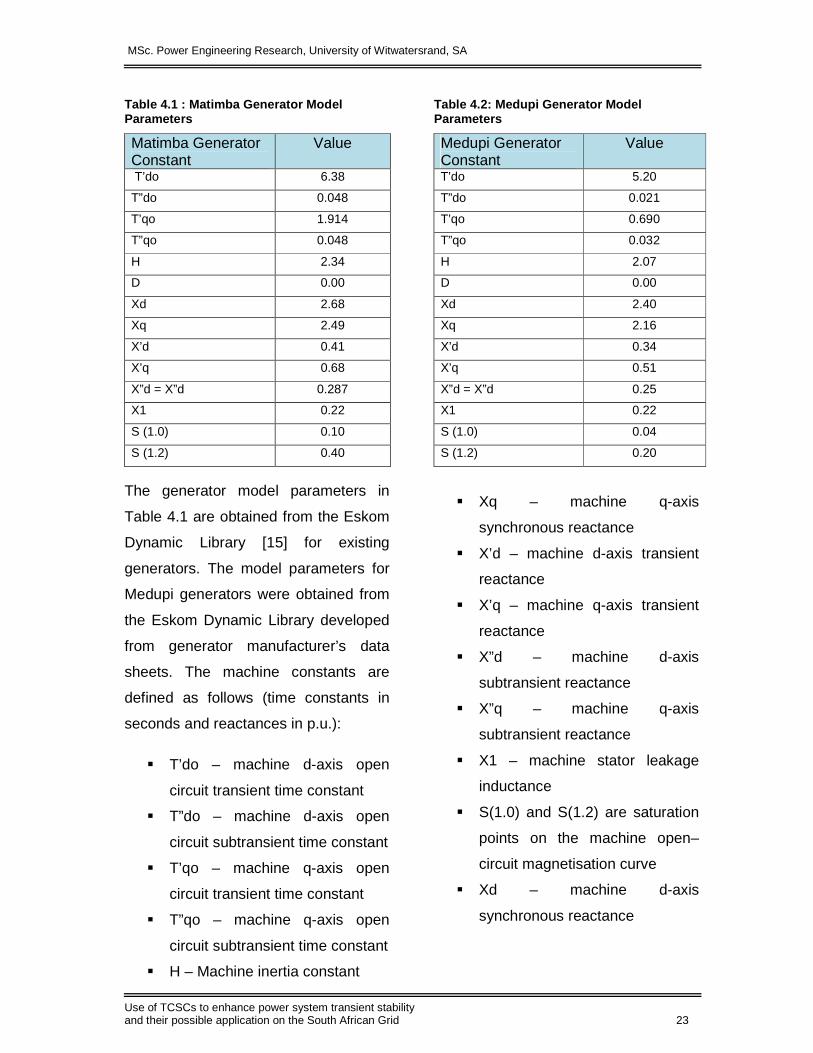
4.3. Medupi and Matimba Generator Models
Since the Medupi and Matimba power stations are thermal, the round rotor generator
models are employed. Table 4.1 and Table 4.2 list values of the Matimba and Medupi
generator constants.
MSc. Power Engineering Research, University of Witwatersrand, SA
Use of TCSCs to enhance power system transient stability and their possible application on the South African Grid 23
Table 4.1 : Matimba Generator Model Parameters
Matimba Generator Constant
Value
T’do 6.38
T”do 0.048
T’qo 1.914
T”qo 0.048
H 2.34
D 0.00
Xd 2.68
Xq 2.49
X’d 0.41
X’q 0.68
X”d = X”d 0.287
X1 0.22
S (1.0) 0.10
S (1.2) 0.40
The generator model parameters in
Table 4.1 are obtained from the Eskom
Dynamic Library [15] for existing
generators. The model parameters for
Medupi generators were obtained from
the Eskom Dynamic Library developed
from generator manufacturer’s data
sheets. The machine constants are
defined as follows (time constants in
seconds and reactances in p.u.):
� T’do – machine d-axis open
circuit transient time constant
� T”do – machine d-axis open
circuit subtransient time constant
� T’qo – machine q-axis open
circuit transient time constant
� T”qo – machine q-axis open
circuit subtransient time constant
� H – Machine inertia constant
Table 4.2: Medupi Generator Model Parameters
Medupi Generator Constant
Value
T’do 5.20
T”do 0.021
T’qo 0.690
T”qo 0.032
H 2.07
D 0.00
Xd 2.40
Xq 2.16
X’d 0.34
X’q 0.51
X”d = X”d 0.25
X1 0.22
S (1.0) 0.04
S (1.2) 0.20
� Xq – machine q-axis
synchronous reactance
� X’d – machine d-axis transient
reactance
� X’q – machine q-axis transient
reactance
� X”d – machine d-axis
subtransient reactance
� X”q – machine q-axis
subtransient reactance
� X1 – machine stator leakage
inductance
� S(1.0) and S(1.2) are saturation
points on the machine open–
circuit magnetisation curve
� Xd – machine d-axis
synchronous reactance

MSc. Power Engineering Research, University of Witwatersrand, SA
Use of TCSCs to enhance power system transient stability and their possible application on the South African Grid 24
4.4. Matimba and Medupi Exciter Models
The function of an excitation system is to supply and automatically adjust the field
current of a synchronous generator to maintain the terminal voltage as the generator
power output varies within the continuous capability of the generator.
Exciters will be required for the Medupi and Matimba for automatic voltage regulation.
The machines are large and exciters with a fast response are necessary to enhance
transient stability in the event of large disturbances.
As shown in Figure 4.3, Medupi generators will utilise the ESST1A exciter model as
represented in the PSS®E standard model library.
Figure 4.3: ESSTIA Exciter model block diagram
Table 4.3 shows the Medupi generators exciter model parameter values.
MSc. Power Engineering Research, University of Witwatersrand, SA
Use of TCSCs to enhance power system transient stability and their possible application on the South African Grid 25
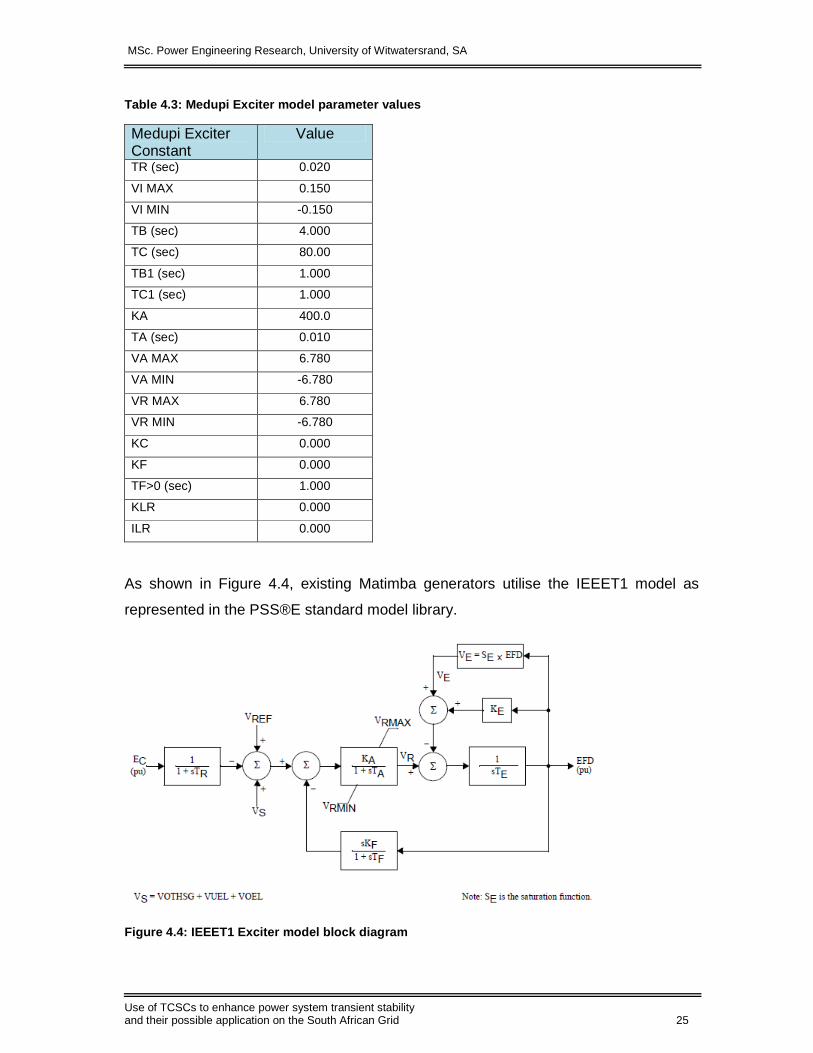
Table 4.3: Medupi Exciter model parameter values
Medupi Exciter Constant
Value
TR (sec) 0.020
VI MAX 0.150
VI MIN -0.150
TB (sec) 4.000
TC (sec) 80.00
TB1 (sec) 1.000
TC1 (sec) 1.000
KA 400.0
TA (sec) 0.010
VA MAX 6.780
VA MIN -6.780
VR MAX 6.780
VR MIN -6.780
KC 0.000
KF 0.000
TF>0 (sec) 1.000
KLR 0.000
ILR 0.000
As shown in Figure 4.4, existing Matimba generators utilise the IEEET1 model as
represented in the PSS®E standard model library.
Figure 4.4: IEEET1 Exciter model block diagram
MSc. Power Engineering Research, University of Witwatersrand, SA
Use of TCSCs to enhance power system transient stability and their possible application on the South African Grid 26
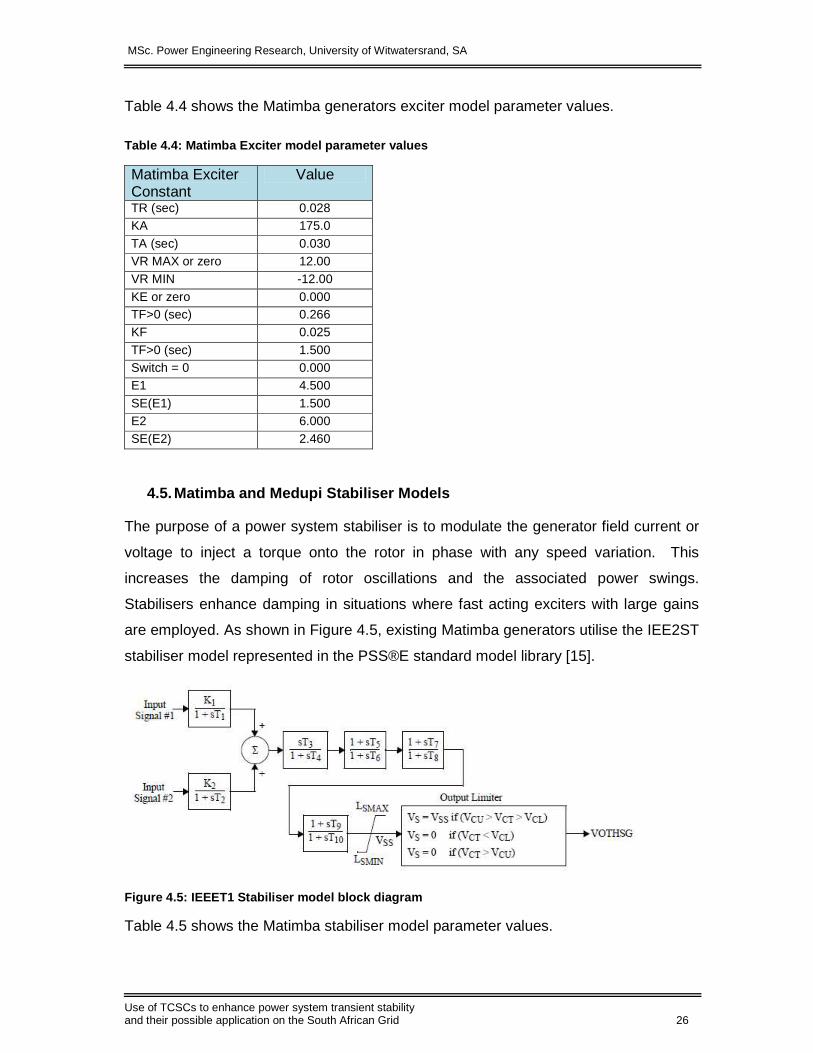
Table 4.4 shows the Matimba generators exciter model parameter values.
Table 4.4: Matimba Exciter model parameter values
Matimba Exciter Constant
Value
TR (sec) 0.028 KA 175.0 TA (sec) 0.030 VR MAX or zero 12.00 VR MIN -12.00 KE or zero 0.000 TF>0 (sec) 0.266 KF 0.025 TF>0 (sec) 1.500 Switch = 0 0.000 E1 4.500 SE(E1) 1.500 E2 6.000 SE(E2) 2.460
4.5. Matimba and Medupi Stabiliser Models
The purpose of a power system stabiliser is to modulate the generator field current or
voltage to inject a torque onto the rotor in phase with any speed variation. This
increases the damping of rotor oscillations and the associated power swings.
Stabilisers enhance damping in situations where fast acting exciters with large gains
are employed. As shown in Figure 4.5, existing Matimba generators utilise the IEE2ST
stabiliser model represented in the PSS®E standard model library [15].
Figure 4.5: IEEET1 Stabiliser model block diagram
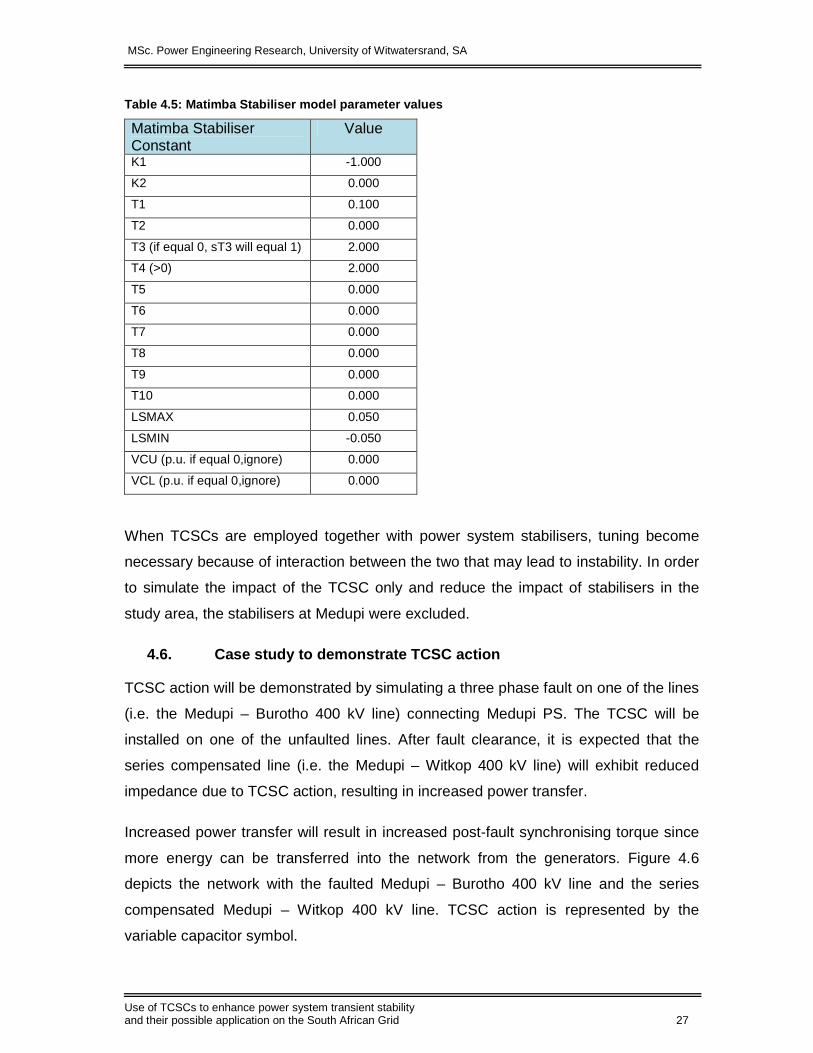
Table 4.5 shows the Matimba stabiliser model parameter values.
MSc. Power Engineering Research, University of Witwatersrand, SA
Use of TCSCs to enhance power system transient stability and their possible application on the South African Grid 27
Table 4.5: Matimba Stabiliser model parameter value s
Matimba Stabiliser Constant
Value
K1 -1.000
K2 0.000
T1 0.100
T2 0.000
T3 (if equal 0, sT3 will equal 1) 2.000
T4 (>0) 2.000
T5 0.000
T6 0.000
T7 0.000
T8 0.000
T9 0.000
T10 0.000
LSMAX 0.050
LSMIN -0.050
VCU (p.u. if equal 0,ignore) 0.000
VCL (p.u. if equal 0,ignore) 0.000
When TCSCs are employed together with power system stabilisers, tuning become
necessary because of interaction between the two that may lead to instability. In order
to simulate the impact of the TCSC only and reduce the impact of stabilisers in the
study area, the stabilisers at Medupi were excluded.
4.6. Case study to demonstrate TCSC action
TCSC action will be demonstrated by simulating a three phase fault on one of the lines
(i.e. the Medupi – Burotho 400 kV line) connecting Medupi PS. The TCSC will be
installed on one of the unfaulted lines. After fault clearance, it is expected that the
series compensated line (i.e. the Medupi – Witkop 400 kV line) will exhibit reduced
impedance due to TCSC action, resulting in increased power transfer.
Increased power transfer will result in increased post-fault synchronising torque since
more energy can be transferred into the network from the generators. Figure 4.6
depicts the network with the faulted Medupi – Burotho 400 kV line and the series
compensated Medupi – Witkop 400 kV line. TCSC action is represented by the
variable capacitor symbol.
MSc. Power Engineering Research, University of Witwatersrand, SA
Use of TCSCs to enhance power system transient stability and their possible application on the South African Grid 28
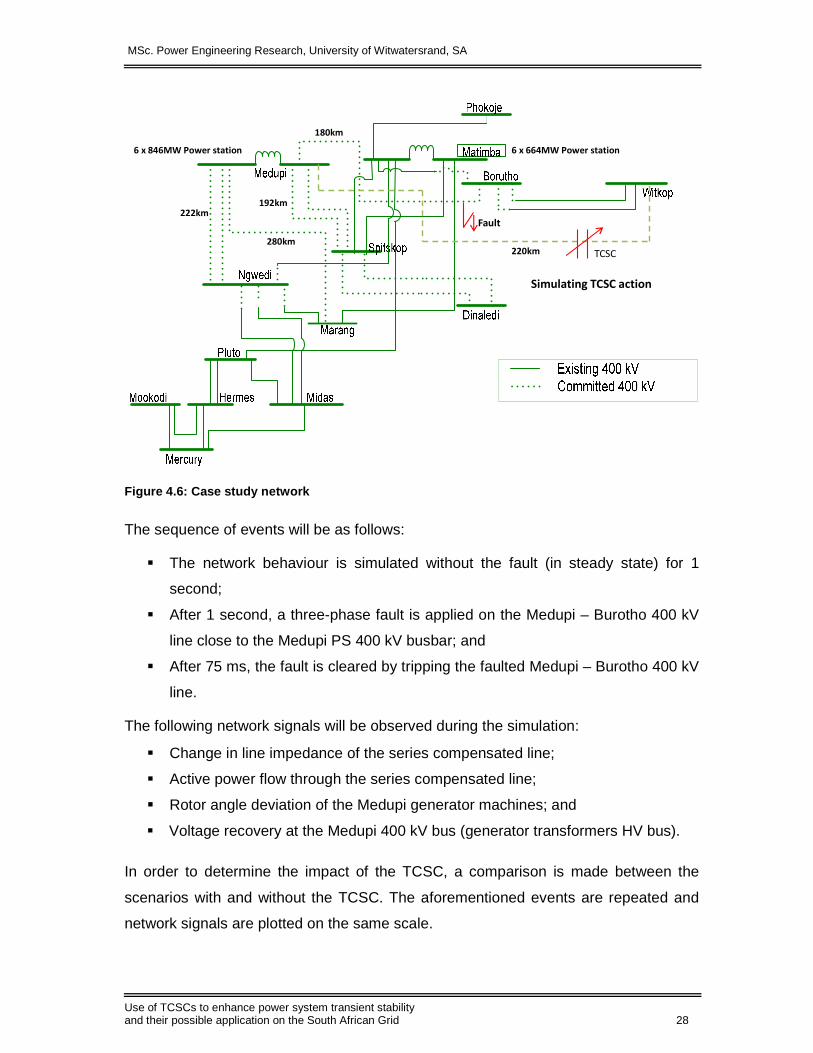
Figure 4.6: Case study network
The sequence of events will be as follows:
� The network behaviour is simulated without the fault (in steady state) for 1
second;
� After 1 second, a three-phase fault is applied on the Medupi – Burotho 400 kV
line close to the Medupi PS 400 kV busbar; and
� After 75 ms, the fault is cleared by tripping the faulted Medupi – Burotho 400 kV
line.
The following network signals will be observed during the simulation:
� Change in line impedance of the series compensated line;
� Active power flow through the series compensated line;
� Rotor angle deviation of the Medupi generator machines; and
� Voltage recovery at the Medupi 400 kV bus (generator transformers HV bus).
In order to determine the impact of the TCSC, a comparison is made between the
scenarios with and without the TCSC. The aforementioned events are repeated and
network signals are plotted on the same scale.
220km
192km
180km
222km
280km
Simulating TCSC action
6 x 846MW Power station 6 x 664MW Power station
Fault
TCSC

MSc. Power Engineering Research, University of Witwatersrand, SA
Use of TCSCs to enhance power system transient stability and their possible application on the South African Grid 29
TCSC action on a transmission line compensates the inductive reactance of the line.
The inductive reactance of the Medupi – Witkop 400 kV line is 0.03256pu. The Medupi
– Witkop line will be series compensated in a range between 40-70 percent, implying
that the line inductive reactance can be dynamically controlled between 0.0196pu and
0.0098pu.
4.6.1. Calculation of effective series capacitance
The effective series capacitive reactance that results in a series compensation of 40%
is calculated as follows.
Effective series reactance = j (XL - XC) where, XL is the line inductive reactance and XC
is the series capacitor reactance.
Therefore, compensated series reactance =j 0.0196 pu = j (0.03256 - XC) pu
Effective series capacitive reactance, XC = 0.013 pu.
Converting to ohms, XC = 0.013 * Z base. On a power base of 100 MVA and voltage
base of 400 kV, Z base = 1600
XC = 0.013 * 1600 = 20.84Ω
Therefore, effective series capacitive reactance = 20.84 Ω
Since, X( =1 2πfC. , Equivalent capacitor size, / = 1 2π50 ∗ 20.84. = 1534F
In the same way the effective capacitance resulting in series compensation of 70 %
can be calculated.
The change in bus bar voltage on the high voltage (400 kV) side of the Medupi
generator transformer was used as input to the TCSC during the simulation. Table 4.6
shows the TCSC controller parameter values used.

MSc. Power Engineering Research, University of Witwatersrand, SA
Use of TCSCs to enhance power system transient stability and their possible application on the South African Grid 30
Table 4.6: TCSC controller parameter values
TCSC Model Constant Value T1 (sec) 0.050
T2 (sec) 0.100
T3 (>0, sec) 0.020
Tw (>0, sec) 1.900
K 5.000
Xmax (pu) – max. limit on output 0.0196
Xmin (pu) – min. limit on output 0.0098
INmax (pu) – max. limit on input 1.050
INmin (pu) – min. limit on input 0.900
4.6.2. Simulations results of the case study
Figure 4.7 depicts the behaviour of the line impedance of the series compensated line
during the simulation. At the onset of a fault, a signal is send to the TCSR module to
reduce the line impedance to the minimum value.
Figure 4.7: Equivalent line impedance (p.u.) of lin e compensated with a TCSC
As shown in Figure 4.7, the line impedance varies between 0.0196pu to 0.0098pu due
to TCSC action. The line impedance gradually settles towards the lowest level of
compensation as the system recovers from the fault and returns to a stable operating
point.
33 - COMPENSATED_X : Medupi_Burotho_withTCSCgfedcb
Time (seconds)2522.52017.51512.5107.552.50
0.021
0.02
0.019
0.018
0.017
0.016
0.015
0.014
0.013
0.012
0.011
0.01
0.009
Res
ulta
nt li
ne im
peda
nce
(p.u
.)
MSc. Power Engineering Research, University of Witwatersrand, SA
Use of TCSCs to enhance power system transient stability and their possible application on the South African Grid 31
Practically, the line impedance will settle to a steady value quicker by fine tuning the
TCSC control logic. Note: emphasis is not on tuning the TCSC to increase damping
but on the TCSC action that results in increased power transfer the first few cycles
after the fault (hence increasing post-fault synchronising torque).
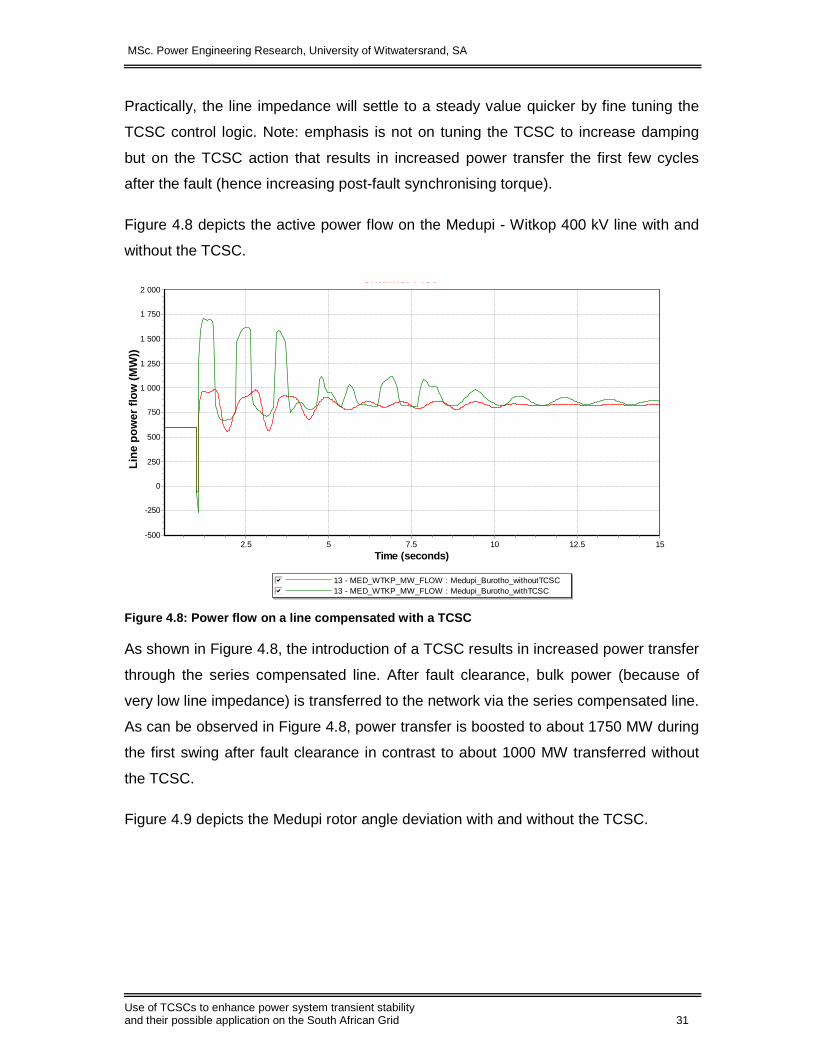
Figure 4.8 depicts the active power flow on the Medupi - Witkop 400 kV line with and
without the TCSC.
Figure 4.8: Power flow on a line compensated with a TCSC
As shown in Figure 4.8, the introduction of a TCSC results in increased power transfer
through the series compensated line. After fault clearance, bulk power (because of
very low line impedance) is transferred to the network via the series compensated line.
As can be observed in Figure 4.8, power transfer is boosted to about 1750 MW during
the first swing after fault clearance in contrast to about 1000 MW transferred without
the TCSC.
Figure 4.9 depicts the Medupi rotor angle deviation with and without the TCSC.
Channel Plot
13 - MED_WTKP_MW_FLOW : Medupi_Burotho_withoutTCSCgfedcb13 - MED_WTKP_MW_FLOW : Medupi_Burotho_withTCSCgfedcb
Time (seconds)1512.5107.552.5
2 000
1 750
1 500
1 250
1 000
750
500
250
0
-250
-500
Line
pow
er fl
ow (
MW
))
MSc. Power Engineering Research, University of Witwatersrand, SA
Use of TCSCs to enhance power system transient stability and their possible application on the South African Grid 32
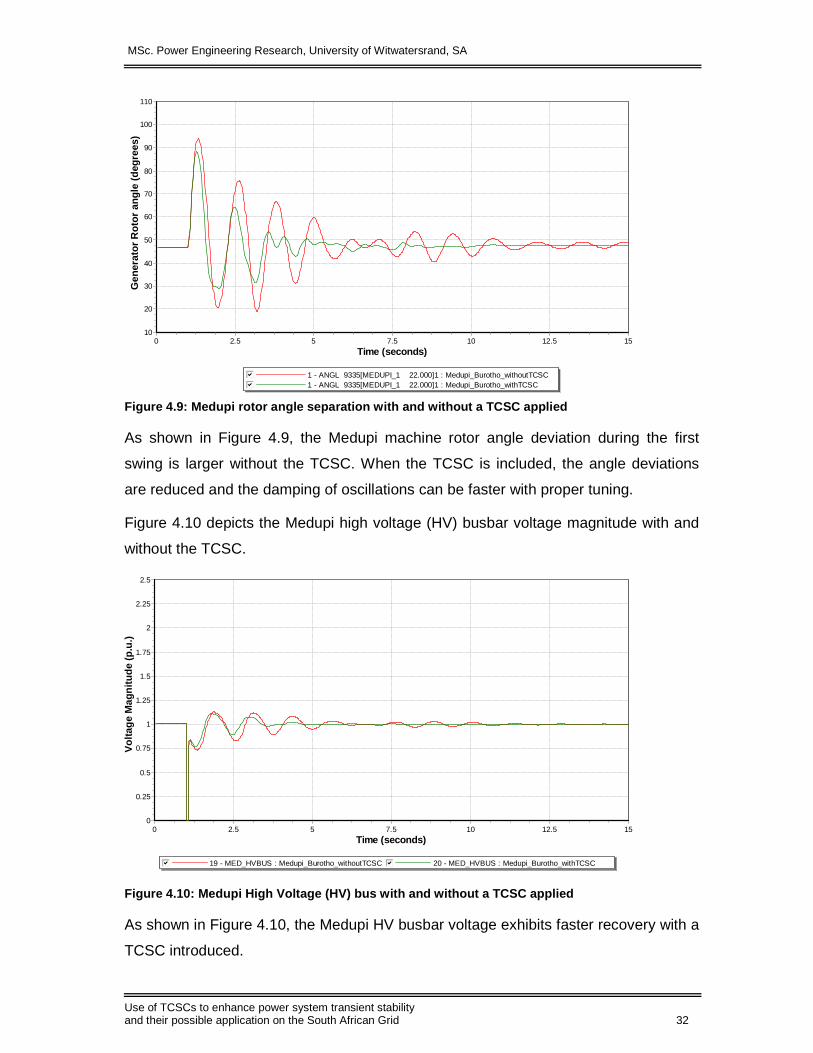
Figure 4.9: Medupi rotor angle separation with and without a TCSC applied
As shown in Figure 4.9, the Medupi machine rotor angle deviation during the first
swing is larger without the TCSC. When the TCSC is included, the angle deviations
are reduced and the damping of oscillations can be faster with proper tuning.
Figure 4.10 depicts the Medupi high voltage (HV) busbar voltage magnitude with and
without the TCSC.
Figure 4.10: Medupi High Voltage (HV) bus with and without a TCSC applied
As shown in Figure 4.10, the Medupi HV busbar voltage exhibits faster recovery with a
TCSC introduced.
Channel Plot
1 - ANGL 9335[MEDUPI_1 22.000]1 : Medupi_Burotho_withoutTCSCgfedcb1 - ANGL 9335[MEDUPI_1 22.000]1 : Medupi_Burotho_withTCSCgfedcb
Time (seconds)1512.5107.552.50
110
100
90
80
70
60
50
40
30
20
10
Channel Plot
19 - MED_HVBUS : Medupi_Burotho_withoutTCSCgfedcb 20 - MED_HVBUS : Medupi_Burotho_withTCSCgfedcb
Time (seconds)1512.5107.552.50
2.5
2.25
2
1.75
1.5
1.25
1
0.75
0.5
0.25
0
Gen
erat
or R
otor
ang
le (
degr
ees)
V
olta
ge M
agni
tude
(p.
u.)

MSc. Power Engineering Research, University of Witwatersrand, SA
Use of TCSCs to enhance power system transient stability and their possible application on the South African Grid 33
5. SIMULATIONS ON THE SOUTH AFRICAN TRANSMISSION GR ID – CFCT
STUDIES
Studies were first conducted to determine the line on which the occurrence of a three-
phase line fault would result in the lowest critical fault clearing time. This lowest critical
fault clearing time is considered the critical fault clearing time (CFCT) for Medupi PS
without the TCSC. Subsequent to identifying the line fault that results in the lowest
CFCT, studies were conducted to determine the series compensated line that results
in the largest improvement in the CFCT in the event of this line fault. The improvement
in CFCT dictates the choice of line where to optimally place the TCSC.
Further simulations were performed on the line selected to install the TCSC employing
various degrees (percentages) of series compensation and observing how the CFCT
changes in response to changing compensation levels.
5.1. Determining the CFCT without the TCSC
Simulations were conducted to determine the CFCT in the event of a three-phase line
fault on any of the transmission lines connected to Medupi PS.
The sequence of events to simulate a three-phase line fault was as follows:
� The network behaviour is simulated in steady state for 1 second;
� After 1 second, a three-phase fault is applied on one of the lines connected to
Medupi PS. The fault is applied close to the Medupi PS 400 kV busbar in order
to simulate the worst condition; and
� The fault is cleared after a series of fault duration times until the CFCT is
determined. Fault duration time is gradually increased until the point of network
instability.
A three phase fault was simulated on the Medupi – Witkop 400 kV 220 km line and as
shown in Figure 5.1, the CFCT is 78 ms; beyond 78 ms the network becomes
unstable.

MSc. Power Engineering Research, University of Witwatersrand, SA
Use of TCSCs to enhance power system transient stability and their possible application on the South African Grid 34
Figure 5.1: CFCT without TCSC with fault applied on Medupi – Witkop 400 kV line
A three-phase fault was simulated on the 192 km Medupi – Spitskop 400 kV line and
as shown in Figure 5.2, the CFCT is 81 ms.
Figure 5.2: CFCT without TCSC with fault applied on Medupi – Spitskop 400 kV line
1 - ANGL 9335[MEDUPI_1 22.000]1 : Medupi_Wtkp_withoutTCSC_77gfedcb1 - ANGL 9335[MEDUPI_1 22.000]1 : Medupi_Wtkp_withoutTCSC_78gfedcb1 - ANGL 9335[MEDUPI_1 22.000]1 : Medupi_Wtkp_withoutTCSC_79gfedcb
Time (seconds)65.554.543.532.521.510.50
400
350
300
250
200
150
100
50
0
-50
-100
Channel Plot
1 - ANGL 9335[MEDUPI_1 22.000]1 : Medupi_Sptskp_withoutTCSC_80gfedcb1 - ANGL 9335[MEDUPI_1 22.000]1 : Medupi_Sptskp_withoutTCSC_81gfedcb1 - ANGL 9335[MEDUPI_1 22.000]1 : Medupi_Sptskp_withoutTCSC_82gfedcb
Time (seconds)65.554.543.532.521.510.50
250
225
200
175
150
125
100
75
50
25
0
-25
-50
Gen
erat
or R
otor
ang
le (
degr
ees)
G
ener
ator
Rot
or a
ngle
(de
gree
s)

MSc. Power Engineering Research, University of Witwatersrand, SA
Use of TCSCs to enhance power system transient stability and their possible application on the South African Grid 35
A three-phase fault was simulated on the 180 km Medupi – Burotho 400 kV line and
as shown in Figure 5.3, the CFCT is 78 ms.
Figure 5.3: CFCT without TCSC with fault applied on Medupi – Burotho 400 kV line
A three-phase fault was simulated on the 222 km Medupi – Ngwedi 400 kV line and as
shown in Figure 5.4, the CFCT is 79 ms.
Figure 5.4: CFCT without TCSC with fault applied on Medupi – Ngwedi 400 kV line
1 - ANGL 9335[MEDUPI_1 22.000]1 : Medupi_Burth_withoutTCSC_77gfedcb1 - ANGL 9335[MEDUPI_1 22.000]1 : Medupi_Burth_withoutTCSC_78gfedcb1 - ANGL 9335[MEDUPI_1 22.000]1 : Medupi_Burth_withoutTCSC_79gfedcb
Time (seconds)65.554.543.532.521.510.50
450
400
350
300
250
200
150
100
50
0
-50
1 - ANGL 9335[MEDUPI_1 22.000]1 : Medupi_Ngwedi_withoutTCSC_79gfedcb1 - ANGL 9335[MEDUPI_1 22.000]1 : Medupi_Ngwedi_withoutTCSC_80gfedcb
Time (seconds)65.554.543.532.521.510.50
250
225
200
175
150
125
100
75
50
25
0
Gen
erat
or R
otor
ang
le (
degr
ees)
G
ener
ator
Rot
or a
ngle
(de
gree
s)
MSc. Power Engineering Research, University of Witwatersrand, SA
Use of TCSCs to enhance power system transient stability and their possible application on the South African Grid 36
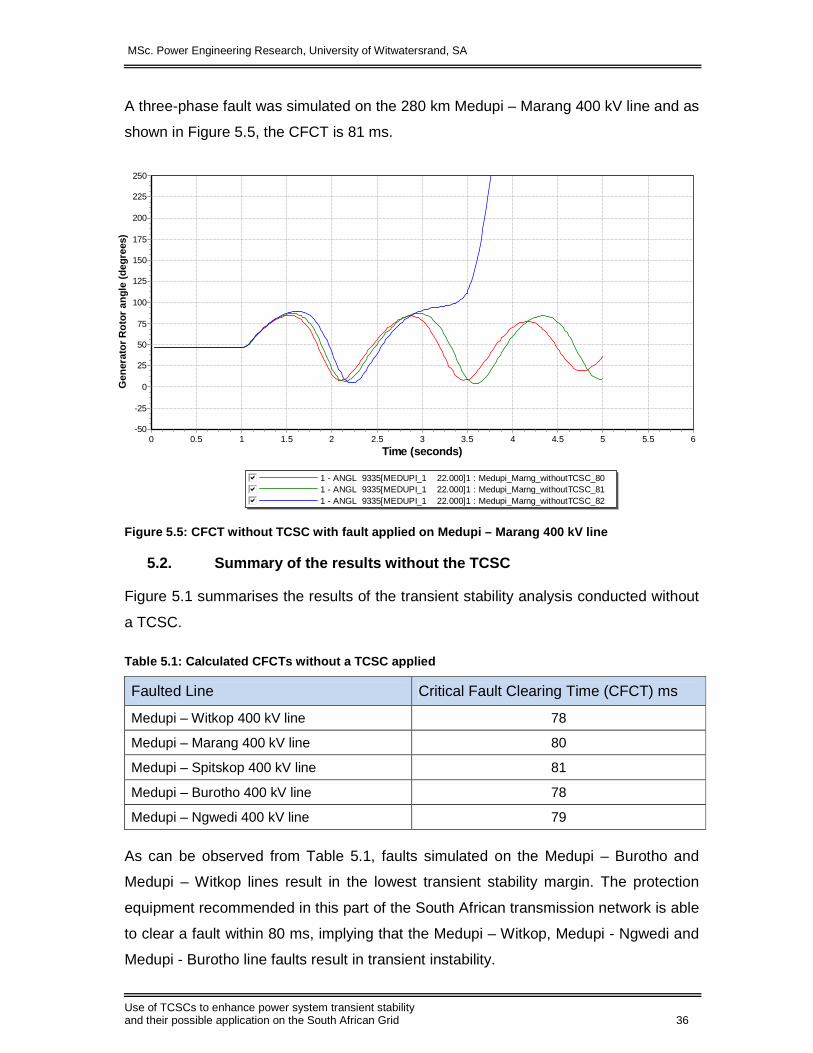
A three-phase fault was simulated on the 280 km Medupi – Marang 400 kV line and as
shown in Figure 5.5, the CFCT is 81 ms.
Figure 5.5: CFCT without TCSC with fault applied on Medupi – Marang 400 kV line
5.2. Summary of the results without the TCSC
Figure 5.1 summarises the results of the transient stability analysis conducted without
a TCSC.
Table 5.1: Calculated CFCTs without a TCSC applied
Faulted Line Critical Fault Clearing Time (CFCT) ms
Medupi – Witkop 400 kV line 78
Medupi – Marang 400 kV line 80
Medupi – Spitskop 400 kV line 81
Medupi – Burotho 400 kV line 78
Medupi – Ngwedi 400 kV line 79
As can be observed from Table 5.1, faults simulated on the Medupi – Burotho and
Medupi – Witkop lines result in the lowest transient stability margin. The protection
equipment recommended in this part of the South African transmission network is able
to clear a fault within 80 ms, implying that the Medupi – Witkop, Medupi - Ngwedi and
Medupi - Burotho line faults result in transient instability.
1 - ANGL 9335[MEDUPI_1 22.000]1 : Medupi_Marng_withoutTCSC_80gfedcb1 - ANGL 9335[MEDUPI_1 22.000]1 : Medupi_Marng_withoutTCSC_81gfedcb1 - ANGL 9335[MEDUPI_1 22.000]1 : Medupi_Marng_withoutTCSC_82gfedcb
Time (seconds)65.554.543.532.521.510.50
250
225
200
175
150
125
100
75
50
25
0
-25
-50
Gen
erat
or R
otor
ang
le (
degr
ees)

MSc. Power Engineering Research, University of Witwatersrand, SA
Use of TCSCs to enhance power system transient stability and their possible application on the South African Grid 37
5.3. TCSC applied on lines - Impact on transient s tability margins
Faults were simulated on one of the lines with the lowest transient stability margin (i.e.
the Medupi – Burotho 400 kV line) to determine the improvement in transient stability
margin with the other lines connected to Medupi being individually series
compensated. The compensation level of between 40-70% is assumed.
With the TCSC applied on the remaining lines (one at a time) connected to Medupi
400 kV busbar, the following sequence of events was simulated:
� The network behaviour is simulated in steady state for 1 second;
� After 1 second, a three-phase fault is applied on the Medupi – Burotho 400 kV
line, close to the Medupi PS 400kV busbar; and
� The fault is cleared by tripping the faulted Medupi – Burotho 400 kV line after
some fault duration. The CFCT is calculated by gradually increasing the fault
duration until the point of transient instability.
5.3.1. Medupi – Ngwedi 400 kV line series compens ation
Figure 5.6 depicts the network with the faulted Medupi – Burotho line and the series
compensated Medupi – Ngwedi 222 km line. TCSC action is represented by the
variable capacitor symbol.
Figure 5.6: TCSC on the Medupi – Ngwedi line
220km
192km
180km
222km
280km
Simulating TCSC action
6 x 846MW Power station 6 x 664MW Power station
Fault
TCSCTCSC
MSc. Power Engineering Research, University of Witwatersrand, SA
Use of TCSCs to enhance power system transient stability and their possible application on the South African Grid 38
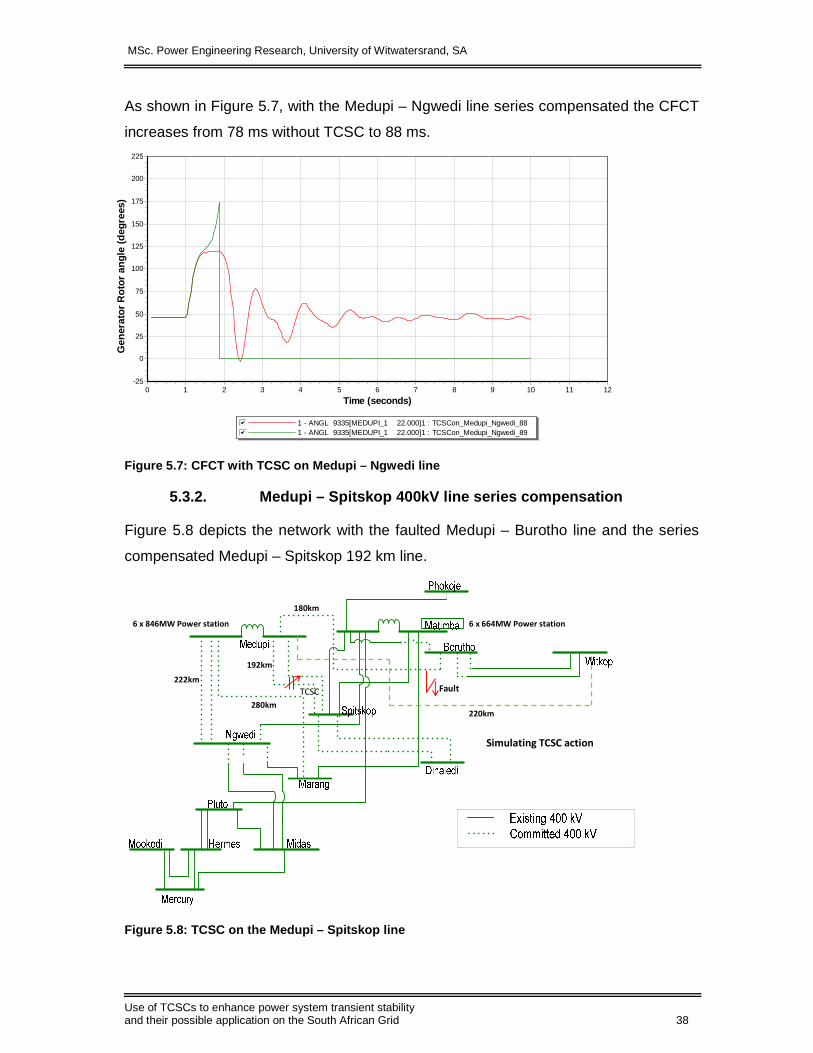
As shown in Figure 5.7, with the Medupi – Ngwedi line series compensated the CFCT
increases from 78 ms without TCSC to 88 ms.
Figure 5.7: CFCT with TCSC on Medupi – Ngwedi line
5.3.2. Medupi – Spitskop 400kV line series compens ation
Figure 5.8 depicts the network with the faulted Medupi – Burotho line and the series
compensated Medupi – Spitskop 192 km line.
Figure 5.8: TCSC on the Medupi – Spitskop line
1 - ANGL 9335[MEDUPI_1 22.000]1 : TCSCon_Medupi_Ngwedi_88gfedcb1 - ANGL 9335[MEDUPI_1 22.000]1 : TCSCon_Medupi_Ngwedi_89gfedcb
Time (seconds)1211109876543210
225
200
175
150
125
100
75
50
25
0
-25
220km
192km
180km
222km
280km
Simulating TCSC action
6 x 846MW Power station 6 x 664MW Power station
FaultTCSC
Gen
erat
or R
otor
ang
le (
degr
ees)
MSc. Power Engineering Research, University of Witwatersrand, SA
Use of TCSCs to enhance power system transient stability and their possible application on the South African Grid 39
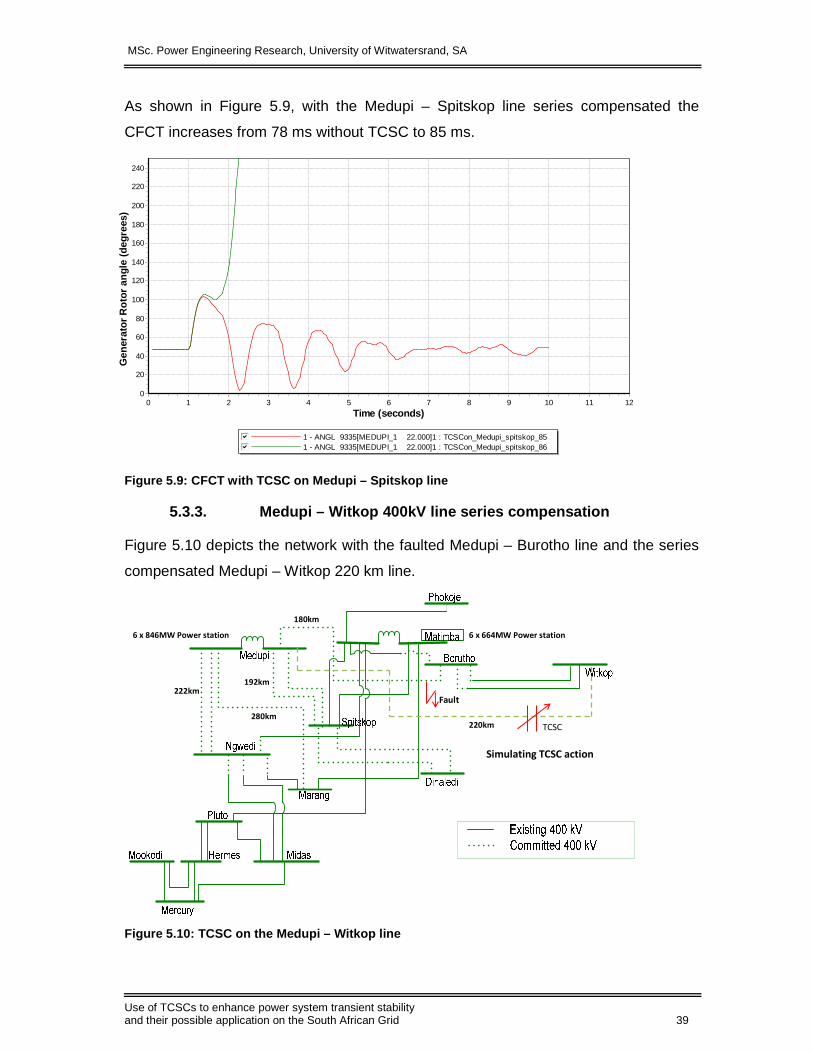
As shown in Figure 5.9, with the Medupi – Spitskop line series compensated the
CFCT increases from 78 ms without TCSC to 85 ms.
Figure 5.9: CFCT with TCSC on Medupi – Spitskop lin e
5.3.3. Medupi – Witkop 400kV line series compensat ion
Figure 5.10 depicts the network with the faulted Medupi – Burotho line and the series
compensated Medupi – Witkop 220 km line.
Figure 5.10: TCSC on the Medupi – Witkop line
Channel Plot
1 - ANGL 9335[MEDUPI_1 22.000]1 : TCSCon_Medupi_spitskop_85gfedcb1 - ANGL 9335[MEDUPI_1 22.000]1 : TCSCon_Medupi_spitskop_86gfedcb
Time (seconds)1211109876543210
240
220
200
180
160
140
120
100
80
60
40
20
0
220km
192km
180km
222km
280km
Simulating TCSC action
6 x 846MW Power station 6 x 664MW Power station
Fault
TCSC
Gen
erat
or R
otor
ang
le (
degr
ees)
MSc. Power Engineering Research, University of Witwatersrand, SA
Use of TCSCs to enhance power system transient stability and their possible application on the South African Grid 40
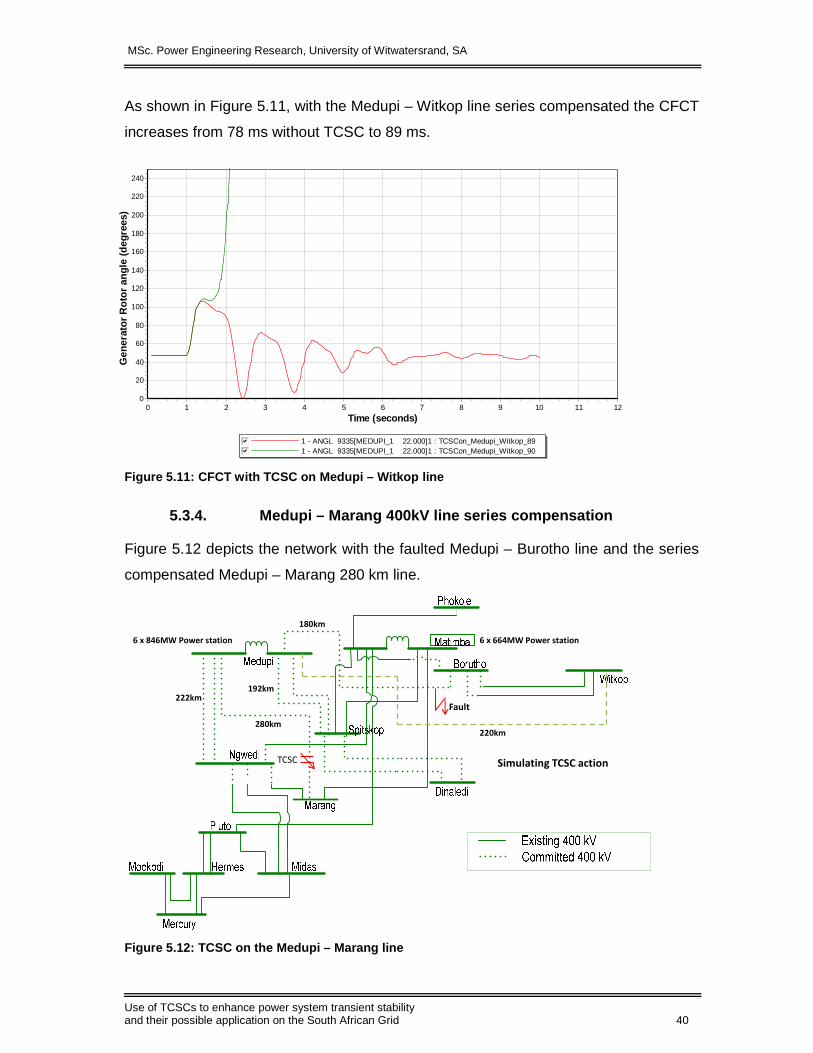
As shown in Figure 5.11, with the Medupi – Witkop line series compensated the CFCT
increases from 78 ms without TCSC to 89 ms.
Figure 5.11: CFCT with TCSC on Medupi – Witkop line
5.3.4. Medupi – Marang 400kV line series compensat ion
Figure 5.12 depicts the network with the faulted Medupi – Burotho line and the series
compensated Medupi – Marang 280 km line.
Figure 5.12: TCSC on the Medupi – Marang line
Channel Plot
1 - ANGL 9335[MEDUPI_1 22.000]1 : TCSCon_Medupi_Witkop_89gfedcb1 - ANGL 9335[MEDUPI_1 22.000]1 : TCSCon_Medupi_Witkop_90gfedcb
Time (seconds)1211109876543210
240
220
200
180
160
140
120
100
80
60
40
20
0
220km
192km
180km
222km
280km
Simulating TCSC action
6 x 846MW Power station 6 x 664MW Power station
Fault
TCSC
Gen
erat
or R
otor
ang
le (
degr
ees)
MSc. Power Engineering Research, University of Witwatersrand, SA
Use of TCSCs to enhance power system transient stability and their possible application on the South African Grid 41
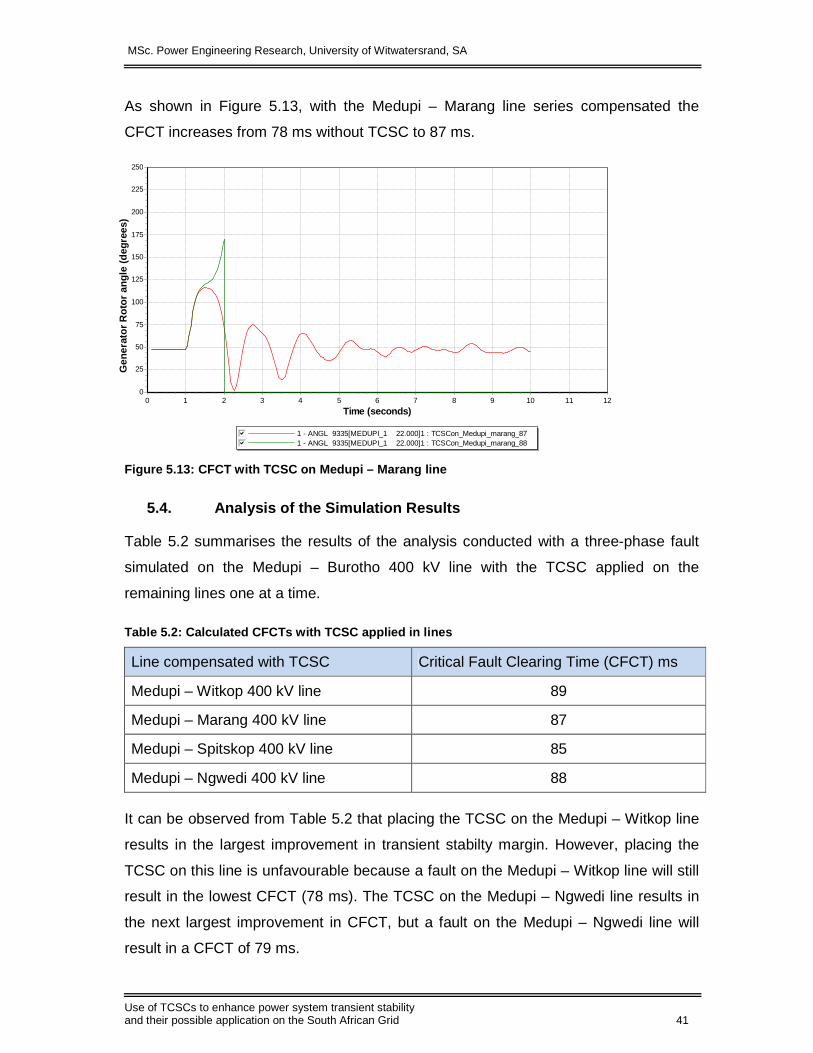
As shown in Figure 5.13, with the Medupi – Marang line series compensated the
CFCT increases from 78 ms without TCSC to 87 ms.
Figure 5.13: CFCT with TCSC on Medupi – Marang line
5.4. Analysis of the Simulation Results
Table 5.2 summarises the results of the analysis conducted with a three-phase fault
simulated on the Medupi – Burotho 400 kV line with the TCSC applied on the
remaining lines one at a time.
Table 5.2: Calculated CFCTs with TCSC applied in li nes
Line compensated with TCSC Critical Fault Clearing Time (CFCT) ms
Medupi – Witkop 400 kV line 89
Medupi – Marang 400 kV line 87
Medupi – Spitskop 400 kV line 85
Medupi – Ngwedi 400 kV line 88
It can be observed from Table 5.2 that placing the TCSC on the Medupi – Witkop line
results in the largest improvement in transient stabilty margin. However, placing the
TCSC on this line is unfavourable because a fault on the Medupi – Witkop line will still
result in the lowest CFCT (78 ms). The TCSC on the Medupi – Ngwedi line results in
the next largest improvement in CFCT, but a fault on the Medupi – Ngwedi line will
result in a CFCT of 79 ms.
1 - ANGL 9335[MEDUPI_1 22.000]1 : TCSCon_Medupi_marang_87gfedcb1 - ANGL 9335[MEDUPI_1 22.000]1 : TCSCon_Medupi_marang_88gfedcb
Time (seconds)1211109876543210
250
225
200
175
150
125
100
75
50
25
0
Gen
erat
or R
otor
ang
le (
degr
ees)
MSc. Power Engineering Research, University of Witwatersrand, SA
Use of TCSCs to enhance power system transient stability and their possible application on the South African Grid 42
Additionally, compensating the Medupi - Ngwedi line is unfavourable because there
are two lines connecting Medupi to Ngwedi implying that both lines may need to be
compensated resulting in increased cost.
Placing the TCSC on the Medupi – Marang line results in an similar increase in CFCT
as on the Medupi – Ngwedi line. The advantage with the Medupi – Marang line is that
a fault on this line results in a better CFCT (80 ms) compared to a fault on a series
compansated Medupi – Ngwedi line. There is a single 280 km line between Medupi
and Marang, thus placing a TCSC on this line will result in the most benefit to network
stability with least financial cost.
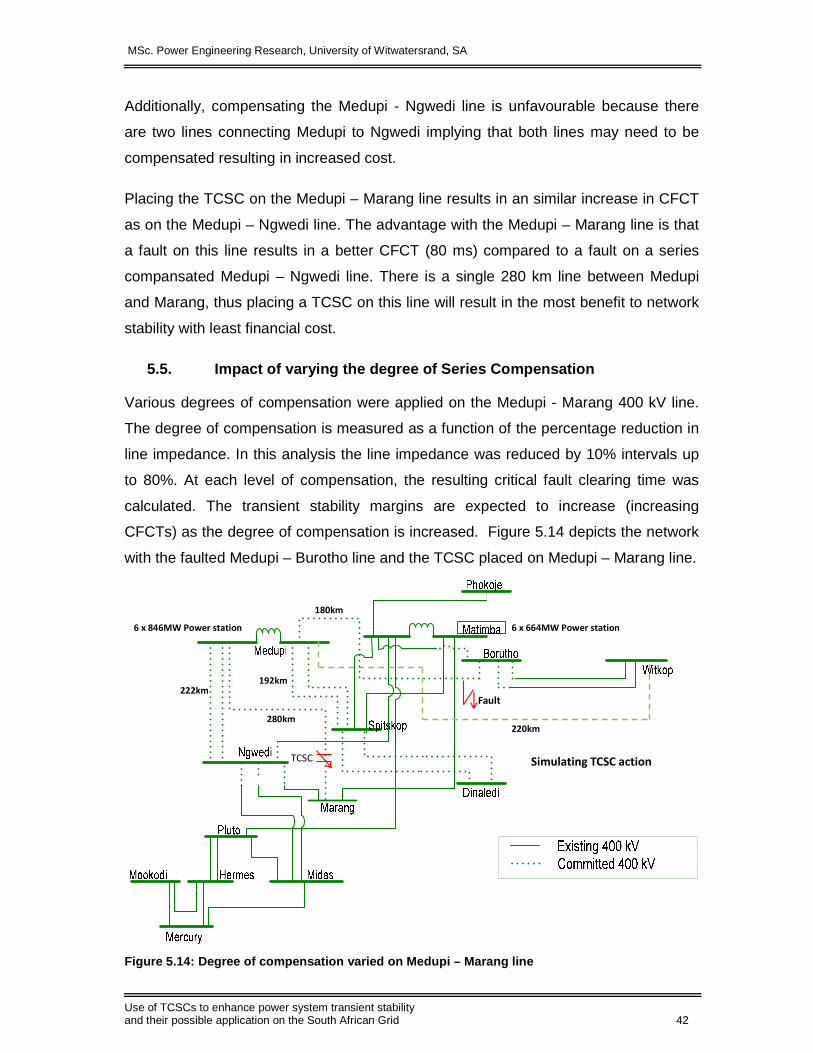
5.5. Impact of varying the degree of Series Compen sation
Various degrees of compensation were applied on the Medupi - Marang 400 kV line.
The degree of compensation is measured as a function of the percentage reduction in
line impedance. In this analysis the line impedance was reduced by 10% intervals up
to 80%. At each level of compensation, the resulting critical fault clearing time was
calculated. The transient stability margins are expected to increase (increasing
CFCTs) as the degree of compensation is increased. Figure 5.14 depicts the network
with the faulted Medupi – Burotho line and the TCSC placed on Medupi – Marang line.
Figure 5.14: Degree of compensation varied on Medup i – Marang line
220km
192km
180km
222km
280km
Simulating TCSC action
6 x 846MW Power station 6 x 664MW Power station
Fault
TCSC

MSc. Power Engineering Research, University of Witwatersrand, SA
Use of TCSCs to enhance power system transient stability and their possible application on the South African Grid 43
With the TCSC applied on the Medupi – Marang line the following sequence of events
was simulated at each level of compensation:
� The network behaviour is simulated in steady state for 1 second;
� After 1 second, a three-phase fault is applied on the Medupi – Burotho 400 kV
line, close to Medupi PS 400kV busbar; and
� The fault is cleared by tripping the faulted Medupi – Burotho 400 kV line after
some fault duration. The CFCT is calculated by gradually increasing the fault
duration until the point of transient instability.
Figure 5.15 shows the increase in CFCT as the level of compensation is increased.
The increase is fairly linear.
Figure 5.15: Compensation level vs CFCT
The level of compensation to be selected is dependent on the achieved CFCT
measure against the fault clearing times of the installed protection equipment. In the
South African transmission network, fast protection that has been recommended in
this part of the network is able to clear the fault within 80 ms, implying that a
compensation level of 20 % is sufficient, however a buffer may be necessary to
accommodate future network expansion.
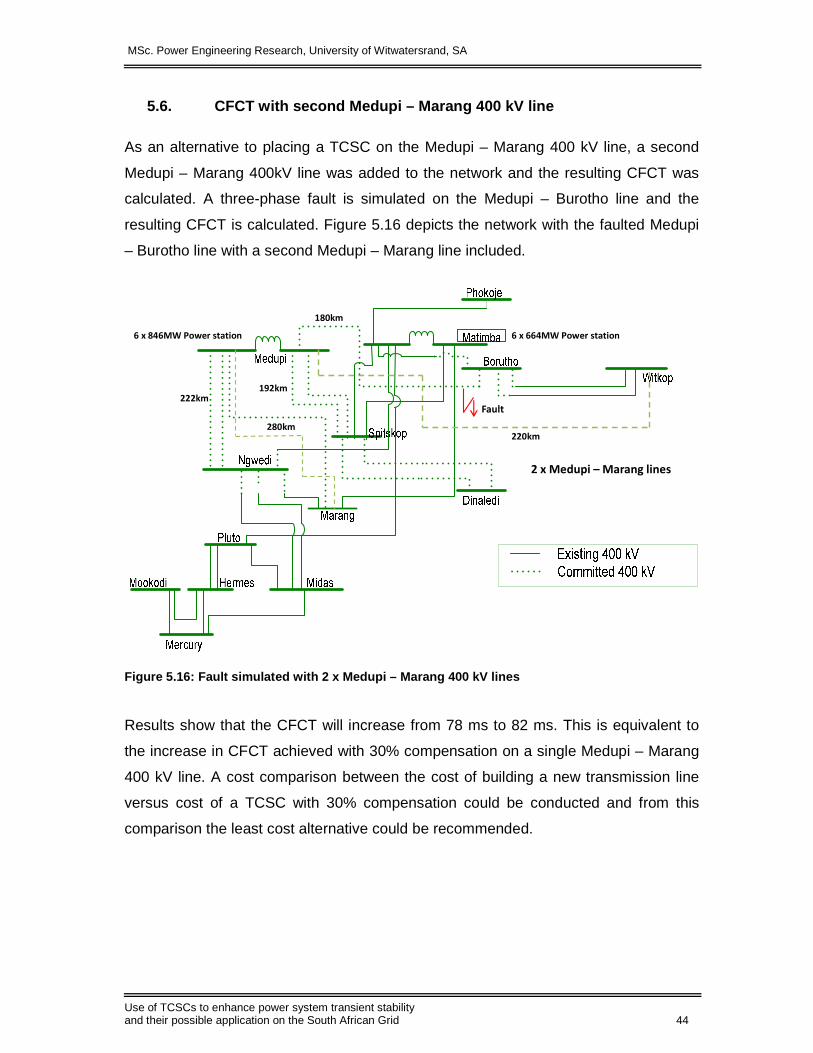
MSc. Power Engineering Research, University of Witwatersrand, SA
Use of TCSCs to enhance power system transient stability and their possible application on the South African Grid 44
5.6. CFCT with second Medupi – Marang 400 kV line
As an alternative to placing a TCSC on the Medupi – Marang 400 kV line, a second
Medupi – Marang 400kV line was added to the network and the resulting CFCT was
calculated. A three-phase fault is simulated on the Medupi – Burotho line and the
resulting CFCT is calculated. Figure 5.16 depicts the network with the faulted Medupi
– Burotho line with a second Medupi – Marang line included.
Figure 5.16: Fault simulated with 2 x Medupi – Mara ng 400 kV lines
Results show that the CFCT will increase from 78 ms to 82 ms. This is equivalent to
the increase in CFCT achieved with 30% compensation on a single Medupi – Marang
400 kV line. A cost comparison between the cost of building a new transmission line
versus cost of a TCSC with 30% compensation could be conducted and from this
comparison the least cost alternative could be recommended.
220km
192km
180km
222km
280km
2 x Medupi – Marang lines
6 x 846MW Power station 6 x 664MW Power station
Fault
MSc. Power Engineering Research, University of Witwatersrand, SA
Use of TCSCs to enhance power system transient stability and their possible application on the South African Grid 45
6. CONCLUSIONS
The research has demonstrated that application of TCSCs on the northern part of the
South African Transmission Grid results in improved transient stability margins. The
use of TCSCs is preferred ahead of other series compensation devices like FSCs,
TSSCs and GCSCs because TCSCs are a proven technology and are effective in
mitigating against the SSR effect. Using TCSCs is especially preferred in this part of
the South African network where thermal generation is dominant, implying that SSR
contraints are expected if a higher degree of compensation is required.
The resulting improvement in transient stability is comparable to some of the
conventional solutions like adding more transmission lines. Thus the use of TCSCs
can be considered as an alternative. Another advantage of a TCSC is that depending
on country, a TCSC could be installed in 12 to 18 months whereas construction of a
new line could take 7 to 12 years since obtaining rights-of-way and permits is a time
consuming process [11]. Further studies would be vital to understand the interaction
between power system stabilizers and TCSCs. This will ensure proper tuning of the
respective devices.
MSc. Power Engineering Research, University of Witwatersrand, SA
Use of TCSCs to enhance power system transient stability and their possible application on the South African Grid 46
7. REFERENCES
[1] R. Cimbala, L. Bena and M. German-Sobek, "“Using of the Thyristor Controlled Series Capacitor in Electrical Power System.,," ELEKTROENERGETIKA, Vol.4, No.4,, 2011.
[2] K.R. Padiyar, FACTS Controllers in Power Transmission and Distribution, New Age International (P) Ltd, Publishers, 2007.
[3] Performance Evaluation and Applications Review of Existing Thyristor Control Series Capacitor Devices –TCSC, CIGRE Working Group B4.49, October 2013.
[4] Lennart Ängquist*, Gunnar Ingeström, Hans-Åke Jönsson, ABB Power Systems AB Sweden “Dynamic Performance of TCSC Schemes,” CIGRE 14-302, 1996. [5] South Africa Generation and Transmission Network Topology: Eskom Transmission Planning. [6] Integration of Medupi 6 x 840 MW Power Station: Study by Eskom Transmission Planning, 2013 [7] G. Stromberg, "Thyristor Controlled Series Capacitor," ABB, The Institution of Electrical Engineers,1998.
[8] R. Billinton, M. Fotuhi-Firuzabad and S. O. Faried, ""Power System Reliability Enhancement Using a Thyristor Controlled Series Capacitor",," IEEE Transactions on Power Systems, Vol. 14, No. 1,, February 1999.
[9] M. Nayeripour and M. M. Mansouri, "”Analyse of Real Switching Angle Limits in TCSC on Capacitor and Inductor Values and their Selection Factors”,," International Journal of Advanced Science and Technology, Vol. 57, pp. 26-29,, August 2013.
[10] P. Kundur, Power System Stability and Control, McGraw- Hill, Inc, 1994.
[11] South African Planned Transmission (Year 2020) Network PSS®E Model, Eskom Transmission Planning Database.
[12] PSS®E Version 33.4 Manual, Model Library, Siemens Power System Technologies International, March 2013.
[13] PSS®E Version 33.4 Manual, Program Application Guide Volume 2, Siemens Power System Technologies International, March 2013.
[14] IEEE Recommended Practice for Specifying Thyristor-Controlled Series Capacitors, IEEE Standard 1534™, September 2009.
[15] South African Planned Transmission Network (Year 2020) Dynamic Data PSS®E Model, Eskom Transmission Planning Database.