Embed Size (px)
Citation preview

بسم االله الرحمن الرحيم
University of Khartoum
Faculty of Engineering
Mechanical Engineering Department
The Effect of Thermal and Chemical
Treatments on the Restart of the GNPOC
Crude-oil Pipeline (Waxy Crude)
A thesis submitted in partial fulfillment of the requirements for
the degree of M.Sc. in Energy Engineering
August 2008
Presented by:
Mohammed Elhadi Ahmed Younis
Supervised by:
Dr. Mohammed Hashim Siddig

Dedication
This work is dedicated to:
My family,
Friends,
And
Teachers
With all my love

Acknowledgements
First of all I would like to express my profound gratitude to my supervisor Dr.
Mohammed Hashim Siddig for the initial motivation to start this project, as
well as for his continuous help and guidance.
I thank my Brother Abd-alhakam and his colleagues from the fluid mechanics
lab, Abdallah, Mahjoob, and Adam. I also thank my friends Mustafa Zaroog
and Arshad Abd Alrahman for their supports and helping, as well as for many
fruitful discussions.
I gratefully acknowledge the help of Ostaza Dina Belal at the first stage of this
thesis, and her kind advices.
Grateful acknowledgment is made to Dr. Musadug Elaawd the coordinator of
Energy Engineering program. Also I would like to thanks Dr. Omer Alfaroug
and Dr. Salah Ahmed for their advices.

Contents
List of symbols……………………………………………………………….................. I
List of Abbreviations……………………………………………………................... II
Abstract ………………………………………………………………........................... III
Abstract-Arabic……………………………………………………………................... IV
Chapter 1. Introduction ………………………………………………………………. 1
1.1 Problem statement ……………………………………………………. 1
1.2 Objective ………………………………………………………………….. 2
1.3 Methodology 2
Chapter 2. Transportation of waxy crude oil ……………………………… 4
2.1 Introduction ……………………………………………………………… 4
2.2 Classification of fluids in rheology ……………………………….. 5
2.3 Pipeline transportation ……………………………………………….. 6
2.3.1 Shear stress ……………………………………………………… 8
2.3.2 Shear rate ……………………………………………………….. 9
2.3.3 Viscosity ………………………………………………………….. 9
2.4 paraffin wax …………………………………………………………….. 10
2.5 Waxy and Non-waxy crude oil ……………………………………. 10
2.5.1 Waxy crude ……………………………………………………… 10
2.5.2 Non-waxy crude ……………………………………………….. 11
2.6 Characterize of Sudanese crude oil ……………………………… 11
2.7 Flow properties of waxy crude oil ……………………………….. 11
2.8 Pumpability characteristics of waxy crude oil ………………… 12
2.9 Temperature …………………………………………………………….. 13
2.10 Prediction of gelation ……………………………………………….. 15
2.11 Prediction of cooling rate ………..………………………………… 15
2.12 Methods for pipeline transportation of waxy crude oils … 16
2.13 Treatment of oil samples ………………………………………….. 16
2.13.1 Heat treatment …………………………………………….. 17

2.13.2 Chemical treatment ……………………………………….. 18
2.13.2.1 Chemical inhibitors……………………………………. 19
2.13.2.2 Chemical dispersant ……………………………….. 19
2.13.2.3 Point of additive injection…………………………. 20
2.14 Yield stress ……………………………………………………………… 20
2.14.1 Bingham ’s yield stress and plasticity ………………… 21
2.14.2 Yield stress-Model pipeline test ………………………… 21
2.15 Flow at restart …………………………………………………………. 22
2.16 Clearing the full scale pipeline …………………………………… 22
Chapter 3. Literature review ……………………………………………………….. 24
3.1 Historical background …………………………………………………. 24
3.2 Thermal treatment studies ………………………………………….. 25
3.3 Chemical treatment studies …………………………………………. 26
Chapter 4. Experimental work …………………………………………………….. 29
4.1 Introduction ………………………………………………………………. 29
4.2 Sample ……………………………………………………………………… 30
4.3 pour point test ………………………………………………………….. 30
4.3.1 Apparatus …………………………………………………………. 30
4.3.2 Procedure …………………………………………………………. 32
4.4 Measurement of yield stress ……………………………………….. 33
4.4.1 Instruments ………………………………………………………. 33
4.4.2 Procedure …………………………………………………………. 34
Chapter 5. Results Analysis and Discussions ……………………………… 37
5.1 Group A ……………………………………………………………………. 37
5.2 Group B ……………………………………………………………………. 40
5.3 Group C ……………………………………………………………………. 42
5.4 Group D ……………………………………………………………………. 45
5.5 Group E ……………………………………………………………………. 47
Chapter 6. Conclusion and Recommendation ……………………………. 50
Appendix one…………………………………………………………………….…………. 52
Appendix Two…………………………………………………………………….…………. 60

Appendix Three………………………………………………………………….…………. 63
References …………………………………………………………………….…………….. 68

List of symbols
D Pipe diameter, m
U Flow velocity of fluid, m/s
F Shear force, N
A Area under shear force, m2
L Pipe length, m
µ Dynamic viscosity, Pa.s
P Pressure, Pa
∆P Pressure drop, Pa
τ Shear stress, N/m2
wτ Shear stress next to pipe wall, N/m2
τ e Static or Yield stress, N/m2
I

List of Abbreviations
GNPOC Greater Nile Petroleum Operating Company
WAT Wax Appearance Temperature
PP Pour Point
PPD Pour Point Depressant
PPM Part Per Million
ASTM American Society for Testing Material
IP Institute of Petroleum
API American Petroleum Institute
II

Abstract
The importance of this study arises from the nature of the Sudanese crude
which contains wax. The crude gels when the line is shutdown for any
reason. To restart a pipeline filled with the waxy crude oil, a sufficient
pressure must be applied to break the gel and restart the flow.
This research was conducted on GNPOC crude oil which represents the
main crude in Sudanese oil export. It has essentially aimed at studying the
effects of thermal and chemical treatments on the process of pipeline
restarting with emphasis on two major factors: the yield stress and the
pour point. The experimental work was completed in five stages; two for
the thermal treatment and three for the chemical treatment followed by
analysis of the results obtained.
The study succeeded in determining a temperature range for the thermal
treatment and a temperature range at which PPD should be added for
chemical treatment.
III

ملخص الدراسة
ترول السودانى ل لخام البق معرفة أن توقف خط الأنابيب الناتأتى أهمية الدراسه من
الموجود فى الخام من الخام نتيجه للمكون الشمعىة هلاميةينتج عنه تكون ماد
.عند إعادة تشغيل خط الأنابيبا هالتغلب علي لابد من ةمما يمثل مشكل
شرآة النيل الكبرى الذى يمثل الخام الرئيس قد تمت هذه الدراسه على خام
لصادر البترول السودانى وهدفت الدراسه أساسا لمعرفة تأثير المعالجات الحراريه و
ونقطة yield stressالكيميائيه على عملية إعادة التشغيل من حيث إجهاد الخضوع
مرحلتين , وقد تمت الدراسه التجريبيه على خمس مراحل pour pointالإنسكاب
تجارب تم تحليل معالجه الكيميائيه وبنهاية الللللمعالجه الحراريه وثلاث مراحل
.معطيات آل تجربه
لتسخين الخام يكون عندها ةه إلى تحديد مدى من درجات الحرارخُلصت الدراس
يتم عنده ةديد مدى من درجات الحرارح و تة الحراريةء بالنسبه للمعالجأفضل أدا
.ة الكيميائية فيما يخص المعالجPPD من ال ةحدد مةإضافة آمي
IV

Chapter one
Introduction
Chapter One Introduction
Chapter 1: Introduction
1.1 Problem statement:
Crude oil is a primary and essential energy source worldwide. The declining resources
of conventional oil and the increasing demand for petroleum has resulted in the
sourcing of more heavy, waxy crude oils. One of the main composites of waxy crude oil
is paraffin. As the oil temperature decreases the paraffin may cause gel formation that
consist of wax crystals in a viscous matrix. This circumstance may occur when the
pipeline carrying the crude oil is being shut down for operational or emergency reasons
in locations with low ambient or soil temperatures .[1]
The large wax content crude oils exhibit high wax appearance temperature (WAT),
below which wax appears, and high pour point (or gel temperature). Below the pour
point, the rheological behavior is characterized by thixotropic, temperature-dependent
and shear dependent yield stress and viscosity. These oils are usually conveyed in
pipelines under steady flowing conditions far below the WAT. When flow is shut down,
the temperature decreases in the pipeline, the gel-like structure builds up and the waxy
crude oil undergoes a thermal shrinkage related to the appearance of gas voids that
confers a kind of compressibility to the material. The gel formation, governed by the
paraffin crystallization is controlled by thermal and flow mechanisms. Thus, the location
and the volume of gas voids embedded in the gelled crude oil depend on the cooling
and flow rates in the pipe. Gas voids, occupying from 4 to 8% of the total pipe volume
according to the shutdown conditions, provide a global compressibility to the fluid. An
important practical problem with waxy crude oil transportation is the restartability issue
in which compressibility plays a prevailing role. [2]
In the case of high pour point crude oil, wax may precipitate out of solution and stick
to pipe walls or form sludge at the bottom of a storage tank, even in warm climates.
This wax deposition can block flow lines, reduce throughput, clog pumps, and inhibit
the performance of metering devices that measure transferred crude oil. The pressure
required to start the flow of a pipeline or the temperature at which the oil crystallizes
depends greatly on its temperature history.[3]
The effect of thermal and chemical treatments on the restart of the Gnpoc crude-oil pipeline (waxy crude) 1
Chapter One Introduction
During a temporary shutdown in oil production, the waxy crude oil is cooled in the
pipelines under quiescent (no flow) conditions. In order to restart flow, the gel has to
be broken down. This breakage can be achieved by applying pressure on the gel
(usually via a liquid at the pipe entrance) until breakdown occurs. In order to predict
the breakdown pressure required to restart flow in a safe manner, it is again necessary
to estimate the gel strength. The gel strength is measured in terms of the yield stress
of the gel. Breakdown of the wax–oil gel occurs if the shear stress exerted on the gel
due to the applied pressure exceeds the yield stress of the gel.[4]
1.2. Objective:
The main objective of this work is to formulate the effect of the thermal and chemical
treatments on crude pipe line restartability. These effects can be summarized as follow:
1- Thermal treatment, by addressing the:
• Effect of heating for several preheating temperatures on pour point and
yield stress.
• Effect of cooling rate during the heating cycle from 95 to 70º C on pour
point and yield stress.
2- Chemical treatment, by addressing the :
• Effect of adding different PPD (pour point depressant) doses on pour point
and yield stress.
• Determination of the suitable temperature for the injection of PPD that will
provide the best result.
• The effect of the dynamic cooling followed by reheating of waxy crude oil
on the PPD performance.
1.3. Methodology:
1.3.1. Experimental laboratory work for studying the effect of thermal
treatment on yield stress and pour point. Two groups of
experiments are required:
1. Group (A) experiments which is required to predict the effect of temperature
increment on yield stress and pour point.
The effect of thermal and chemical treatments on the restart of the Gnpoc crude-oil pipeline (waxy crude) 2

Chapter One Introduction
2. Group (B) experiments which are required to specify the effect of cooling during
heating cycle from 95 to 70º C on yield stress and pour point.
1.3.2. Experimental laboratory work for studying the effect of chemical
treatment on yield stress and pour point. Three groups of
experiments are required:
1. Group (C) experiments to identify the effect of adding different PPD doses to
crude oil.
2. Group (D) experiments to specify the effect of adding PPD at different
temperatures above the wax appearance temperature to determine the suitable
temperature of adding the PPD.
3. Group (E) experiments addressing the effect of passing the crude oil through
dynamic cooling and followed by reheating.
The effect of thermal and chemical treatments on the restart of the Gnpoc crude-oil pipeline (waxy crude) 3

Chapter Two
Transportation of waxy crude oil

Chapter Two Transportation of waxy crude oil
Chapter 2: Transportation of waxy crude oil
2.1 Introduction
Crude oils contain a mixture of light and heavy hydrocarbons. Typically, stabilized oil
may contain paraffinic, naphthenic and aromatic components as heavy as C60. In
addition, polars and asphaltenes may also be present. The lighter components in the
crude oil keep the heavier components in solution. This solubility depends very
strongly on the temperature. If the temperature of the oil is decreased, the solubility
of the heavy hydrocarbons may be sufficiently reduced to cause precipitation of these
components in the form of solid wax crystals. The polars and asphaltenes may also
co-precipitate with wax crystals. The phenomenon of wax separation from petroleum
fluids at low temperatures has been a problem to users of petroleum products for a
long period. It can occur in lubricating oils, residual fuels and crude oils.[5]
The presence of wax crystals changes the flow behaviour of the crude oil from
Newtonian to non-Newtonian. The wax crystals usually lead to higher viscosity with
increased energy consumption for pumping and a decreased capacity. In addition, if
the oil is cooled during transportation, the wax crystals tend to deposit on the colder
pipe wall. Wax deposits can lead to increased pipeline roughness, reduced effective
diameter, more frequent pigging, and potential blockage. If these deposits get too
thick, they can reduce the capacity of the pipeline and cause problems during pigging.
Wax deposition in process equipment may lead to more frequent shutdowns and
operational problems. In extreme cases, wax crystals may also cause oil to gel and
lead to problems of restarting the pipeline.
Great potential savings can be derived from accurate prediction of wax formation. The
knowledge of the magnitude of wax deposition can lead to reduction of insulation
requirements for production and transportation systems. Conversely, problems with
wax can be addressed in an early stage of a project so that sufficient thermal
insulation is planned, instead of expensive chemical injection and loss in capacity or
loss of availability. Process heat loads can be reduced by increasing efficiency of heat
transfer. Capacity reduction in heat exchangers can be overcome. The size of export
The effect of thermal and chemical treatments on the restart of the Gnpoc crude-oil pipeline (waxy crude) 4

Chapter Two Transportation of waxy crude oil
pumps and flow lines can be reduced by an accurate knowledge of the effect of wax
formation on crude viscosity. The minimum pigging frequency can be estimated. In
addition, problems related to start up and shutdown can be solved cost effectively.[5]
2.2 Classification of fluids in rheology
Fluids fall by their rheological properties into the following groups:
A. Purely viscous or time-independent fluids, whose viscosity is
independent of the duration of shear, the group includes Newtonian
fluids, whose viscosity is constant at a given pressure and temperature,
as well as non-Newtonian fluids in the strict sense, whose apparent
viscosity is a function of shear stress.
B. Time-dependent fluids, whose apparent viscosity depends in addition to
the shear stress also on the duration of the shear.
C. Visco-elastic liquids, whose apparent viscosity is a function of both the
shear stress and the extent of deformation.
D. Complex rheological bodies, exhibiting several of the properties of group
(A), (B) and (C).
By non-Newtonian fluids in the broader sense one means all fluids except the
Newtonian ones. The oil industry most often has to deal with fluids of groups (A) and
(B). Flow properties are characterized by flow curves or sets of such. Flow curves
illustrate the variation of shear stress v. deformation rate as shown in Fig. 2.1.
The effect of thermal and chemical tre
Fig. 2.1 Flow curves
atments on the restart of the Gnpoc crude-oil pipeline (waxy crude) 5

Chapter Two Transportation of waxy crude oil
2.2.1 Time dependent fluids
The time dependent fluids whose viscosity under a constant shear stress decreases
with stress duration are called thixotropic; and those of increasing viscosity are called
rheopectic. In oil industry practice, the first type is of considerable importance, as a
number of crudes tends to exhibit thixotropic-pseudoplastic behavior.
The thixotropic-pseudoplastic behavior of crude oil is due to a liogel – or cryogel-type
spatial arrangement of solid hydrocarbon components in the liquid medium.
Crystalline, microcrystalline and amorphous dispersed grains of a variety of
composition, size and shape constitute a floating three-dimensional lattice in the liquid
phase of essentially Newtonian behavior. Shear destroys some of the bonds within the
lattice. However, at the same time, the associative forces set up other bonds in other
places. If shear destroys as many bonds per unit of time as are formed a new then a
steady state of flow sets in. strong shear will destroy more bonds; this entails a
reduction in the resistance to shear of the system, that is a decrease in apparent
viscosity.[6]
2.3 Pipeline transportation
For the transportation of large quantities of crude oils, pipelines are the most
economic means. Under safety aspects, transportation by pipeline guarantees the best
protection for the environment. Further, there is no handling of other traffic and no
disturbance by noise or air pollution. A continuous supply to the refineries is normally
assured and this is not endangered by weather conditions such as fog, icy roads, or
traffic conditions along inland waterways, such as high or low water level, ice, etc.
However, each pipeline system requires very high investment which should be used
most economically: The most economical and efficient operation of a pipeline could be
reached by maintaining a continuous constant flow rate without any interruption. Also,
in respect of a reliable and continuous supply to the refineries, a steady-state
throughput, with some seasonal fluctuations due to market requirements, should be
envisaged. Otherwise, additional storage volume has to be provided for large
quantities of crude oil and this would be very expensive.
The effect of thermal and chemical treatments on the restart of the Gnpoc crude-oil pipeline (waxy crude) 6

Chapter Two Transportation of waxy crude oil
Interruptions by shutdown of a pipeline are by no means desirable. However, a
shutdown may occur due to the following operational reasons:
a) There is an inadequate stock of oil in the terminal. This could be caused by
distribution in tanker schedules, for instance, due to weather conditions.
b) There are no delivery requirements by the refineries fed by pipeline. This could be
caused by disruption in operations of one or more of the processing units of the
refineries, for instance, due to equipment breakdown.
c) A pressure test for leakage control of the pipeline has to be performed.
d) Repair, maintenance work on the pipeline system including pumps is required.
e) The pipeline might be shutdown automatically by exceeding the operational safety
limits.
These shutdowns are not expected to last longer than 3-4 day. Under extreme
conditions one could think of extraordinary long shutdowns. The reasons might be
government action, earthquake, strike, war, etc. However, under normal conditions,
they are not expected.
The problems of handling waxy crude oils in Pipelines are well-known to oilmen.
Submarine lines carrying crude oil production to the shore present these problems
more acutely than Land lines because:-
1. The cooling rate of the crude oil is higher at all seasons of the year,
2. Shutdowns are more frequent and may last longer than the 3-day limit which,
except in remote areas, is normally assumed for landlines, and
3. Access to the line at intermediate points is practically impossible, unless special
access points are provided when laying the line.
Waxiness can cause two problems in crude oil production. One is the formation of
deposits on the pipewall which increase the pressure drop in the pipeline. This occurs
when the pipewall temperature is lower than the wax precipitation point (known as
the cloud point for distillate oils, but not so easily identified for crudes).
The second problem is the possibility of gelation when the production is shutdown, or
when the line is pumping at a low rate. This can occur when the mean oil temperature
The effect of thermal and chemical treatments on the restart of the Gnpoc crude-oil pipeline (waxy crude) 7

Chapter Two Transportation of waxy crude oil
is low enough to throw out of solution approximately two percent or more of the
crude is wax, which can form an interlocking gel structure.[7]
Fig. 2.1 shows the cross-sectional view of a cut-away segment of a pipeline affected
by the paraffin deposition problem. As can be observed, the area available for the
crude oil flow has been drastically reduced. Under such circumstances, the part of the
pipeline that is plugged would have to be cut out and replaced, resulting in significant
operational costs. [4]
Fig.2.2 Cross-sectional view of a plugged pipeline [4]
When transporting waxy crude oils, these operational points of view are of
considerable importance.
2.3.1 Shear stress
Consider the steady flow of a fluid in a horizontal pipe of circular cross-section. The
fluid flows with an average velocity of U in a pipe of inside diameter D. The pressure
difference between two points 1 and 2, separated by a distance of L is (P1 – P2).
The decrease in pressure in the fluid reflects the applied force causing the fluid to
flow and if the flow is steady (i.e. no change in the flow and hence velocity), this force
must be counter-balanced by a shear force of equal magnitude at the wall of the pipe.
If τ w is the shear stress at the pipe wall, then force acting on the fluid at the wall
must be -π DLτ w. The negative sign indicates that this force acts in a direction
opposite to the direction of flow. The force acting upon the fluid due to pressure
The effect of thermal and chemical treatments on the restart of the Gnpoc crude-oil pipeline (waxy crude) 8

Chapter Two Transportation of waxy crude oil
difference is (π D2/4) (PI – P2). In steady state (no acceleration), the sum of these
two forces is zero. Therefore, we can write
0)(4 21
2
=−+− ppDDL wπτπ
Or LppD
w 4)( 21−=τ …………………………………………….............(2.1)
The above, equation merely shows that the shear stress at the pipe wall is just
another means of expression of friction loss. From Eq. 2.1, it follows that available
shear stress for a particular pipeline depends on the length of the line between two
pump stations and the pressure difference. The available shear stress can be
increased by increasing the initial pressure, p1, and/or reducing the section length of
pipe, L.
2.3.2 Shear rate
Consider two parallel planes of area A, separated by the differential distance dr as
shown in Fig. 2.3. The space between the two planes is filled with a fluid. The lower
plane is fixed. A small force F applied to the upper plane will give it a velocity dU in
the direction of the force. If there is no slip between the wall and the fluid, the fluid
adjacent to the upper plane or wall will also have a velocity dU in the direction of the
applied force and the fluid next to the lower plane or wall will have a zero velocity.
Thus, a uniform velocity gradient of magnitude dU/dr is set up in the fluid since the
shear force F is uniform across the distance dr. The velocity gradient, dU/dr, is
commonly referred to as the rate of shear. The shear force per unit area, F/A, is
called' the shear stress.
Fig. 2.3 Velocity curve and shear force
2.3.3 Viscosity
It measures the ability of fluid to flow during steady state condition. It is the property
of a fluid that resists a shear force. It can be thought of as the friction resulting when
The effect of thermal and chemical treatments on the restart of the Gnpoc crude-oil pipeline (waxy crude) 9

Chapter Two Transportation of waxy crude oil
one layer of fluid moves relative to another. Viscosity, µ, can be defined as the ratio
of the shear stress to the rate of shear.
µ = τ w/(dU/dr)
For laminar flow in pipes, friction loss is given by 221 32)(
DU
Lpp µ
=−
This can be rearranged in the form D
UD
UL
Dppw
88]4)[( 21 τ
µ =−
=
Therefore, for laminar flow, rate of shear =8U/D
And for turbulent flow, rate of shear =(8U/D)Cf
Where Cf is correction factor which depends upon Reynolds number.[5]
2.4 Paraffin Wax
The wax present in petroleum crudes primarily consists of paraffin hydrocarbons (C18
- C36) known as paraffin wax and naphtenic hydrocarbons (C30 - C60). Hydrocarbon
components of wax can exist in various states of matter (gas, liquid or solid)
depending on their temperature and pressure. When the wax freezes it forms crystals.
The crystals formed of paraffin wax are known as macrocrystalline wax. Those formed
from naphtenes are known as microcrystalline wax [8]
Fig. 2.4 Macrocrystalline , Microcrystalline, and Crystal Deposit Network of Wax [8]
2.5 Waxy and non-waxy crude
Crude can be classified as waxy and non-waxy.
2.5.1 Waxy crude
Waxy crude oils exhibit non-Newtonian behaviour at temperatures below about l0ºC
above the pour point. The wax can crystallize as the crude is cooled to form gel or a
partial gel. Under static conditions a rigid gel is formed, but if the crude is cooled
The effect of thermal and chemical treatments on the restart of the Gnpoc crude-oil pipeline (waxy crude) 10

Chapter Two Transportation of waxy crude oil
while in motion, the apparent viscosity will increase but the material remains fluid.
Therefore, the rheological properties are functions of temperature, shear rate, shear
stress and past history. Problems in pumping these crudes will occur if the
temperature drops and the fluid becomes non-Newtonian and if gel formation occurs
after a shutdown. The pipeline facility must be designed to recover from these
problems or prevent them. A realistic approach should be developed based upon an
extensive evaluation of the rheological behaviour of the crude oil under representative
temperature and shear conditions. The two rheological parameters of which
knowledge is indispensable for transporting waxy crude oil through pipeline are
viscosity and yield stress.[5]
2.5.2 Non-waxy crude
Non-waxy crude oils are characterized by low pour points and Newtonian
characteristics at moderate temperature. The process of crude oil conditioning renders
the non-pumpable non-Newtonian crude to a pumpable Newtonian oil at relatively low
temperature. This is achieved by changing the crystalline structure of wax contained
in the oil.[9]
2.6 Characterize of Sudanese crude oil
The Sudanese crude oil (GNPOC crude) is waxy in character, has an average API
degree of 32. Nile Blend Crude Oil is a paraffinic crude oil with a high wax content,
high pour point (+30°C to +36°C) and high wax appearance temperature (+39°C and
above). As with all high wax crude oils, Nile Blend requires careful handling during
transportations.[10]
2.7 Flow properties of waxy crude oils
The viscosity of crude oil is perhaps its most important physical property. For most
crudes, at sufficiently high temperature, the viscosity at a given temperature is
constant and the crude, although chemically very complex, is a simple Newtonian
fluid. As the temperature is reduced, however, the flow properties of a crude oil can
readily change from the simple Newtonian to very complex flow behaviour due to the
crystallization of waxes and the colloidal association of asphaltenes. The waxes
The effect of thermal and chemical treatments on the restart of the Gnpoc crude-oil pipeline (waxy crude) 11

Chapter Two Transportation of waxy crude oil
basically consist of n-alkanes (nC17- nC43) which crystallize to form an interlocking
structure of plates, needle or mal-formed crystals. These crystals can entrap the oil
into a gel-like structure that is capable of forming thick deposits in pipes and
increasing pumping pressures to the point where flow ceases. Asphaltenes, on the
other hand, are very large heterogeneous molecules with condensed aromatic nuclei
that can associate to form colloidal sized particles that strongly influence the viscosity
of the oil medium and affect the crystallization of wax.[5]
The flow properties of an oil containing crystallized wax are distinctly non-Newtonian.
A yield stress can be many times higher than the normal pumping pressure. Upon
yielding the flow properties show time dependency (the measured stress is not a
constant at constant shear rate), indicating a degradation of structure with continued
shear and finally giving equilibrium or time-dependent flow properties (under certain
circumstances) which still exhibit a yield stress and pseudoplastic behaviour. For such
a flow curve, the viscosity is a function of the shear rate, so that the use of a single
value for viscosity becomes meaningless.
The flow properties of waxy crude oils are also dependent upon the shear and
temperature history experienced by the oil.[5]
2.8 Pumpability characteristics of waxy crude oil
In any pipeline design for waxy crude oils, we have to ensure
a) Operating safety, i.e. protection of the pipeline against blockage by the setting
of the oil into a strong gel. The design should ensure a restart after static
cooling of the pipeline to the lowest temperature expected to be encountered.
b) Operating economy, i.e. maintaining a reasonable flowing viscosity with
resulting economic levels of power consumption.
As already explained, the waxy crude oils show complex rheological relationships. The
pumping and restarting conditions of the pipeline require physical properties of the oil
which should represent the actual conditions in the pipelines. These properties should
be easy to determine and have good reproducibility. In the past in many pipelines this
was controlled by the pour point of the crude oil [5]. Normally, the specification stated
The effect of thermal and chemical treatments on the restart of the Gnpoc crude-oil pipeline (waxy crude) 12

Chapter Two Transportation of waxy crude oil
that the pour point should not exceed the prevailing ground temperature. It has long
been known that this is not a satisfactory test. The reasons for this are:
• The repeatability and reproducibility of the pour point test are bad. A
reproducibility of l0oC is not uncommon;
• The pour point test only measures the temperature at which oil will flow under
a small but indeterminate shear stress. It gives no indication of the higher
shear stresses which are available in a normal pipeline.
In addition to the properties of the crude oil itself, two other factors exert a major
influence on the pumpability in any particular pipeline. These are:
• Ambient temperature conditions in the locality of the pipeline; and
• Whether the pipeline is buried or above the ground.
Where there is a choice of whether the pipeline should be buried or above ground, it
is sometimes argued that there is an advantage in having it above the ground so that
use may be made of the heat effect of the solar radiation to assist in de-gelling the
pipeline. While this argument is true, it must be borne in mind that for cold weathers,
it will most usually be found that unless the pipeline is lagged, the night ambient
temperature conditions will often be such as to cause a marked reduction in
throughput, or in extreme cases even stop the pipeline completely. This situation
could even also arise during the day if the sky is overcast. Further, if the pipeline is
lagged, the rate of cooling is reduced but so is the effect of heating by solar radiation.
2.9 Temperature
For the judgement of the physical conditions of the pipeline and the behaviour of the
waxy crude oil, the oil temperature in the pipeline has to be known during normal
operation and after a shutdown to determine the part of dynamic cooling and the part
of static cooling. For a pipeline already in operation, the temperature distribution due
to dynamic cooling could be measured at the different locations over a period of time.
For new pipelines, the oil temperatures and their decrease by cooling can be
calculated if the following data are available:
• Ambient temperature.
• Soil temperature and its seasonal variations.
The effect of thermal and chemical treatments on the restart of the Gnpoc crude-oil pipeline (waxy crude) 13

Chapter Two Transportation of waxy crude oil
• Type of soil, its thermal conductivity (which depends upon the moisture
content among other parameters).
• Depth of pipeline
From the actual oil temperature at any point of the pipeline during shutdown, the oil
will cool down statically. The temperature decrease can also be calculated. However,
the calculation is so complicated that computers are normally used.
In absence of calculated temperature profiles, reasonable assumptions can be made.
In this case, however, the worst combination of dynamic/static cooling and lowest
temperature will have to be found experimentally by conducting yield tests at various
assumed dynamic/static cooling rates. A model pipeline test rig is used for the
purpose.[5]
When the waxy crude flows through a cold pipe or conduit (with a wall temperature
below the cloud point of the crude) as shown in Fig. 2.5 crystals of wax may be
formed on the wall. Wax crystals could then grow in size until the whole inner wall is
covered with the possibility of encapsulating oil inside the wax layers. As the wax
thickness increases, pressure drop across the pipe needs to be increased to maintain
a constant flow rate. As a result, the power requirement for the crude transport will
increase. The arterial blockage problems of waxy crude can be efficiently controlled by
insulation and heating to a temperature above its cloud point.
Fig. 2.5 changes in Temperature and velocity profiles of a flowing
crude oil in a cooling pipe due to wax crystal formation [8]
The effect of thermal and chemical treatments on the restart of the Gnpoc crude-oil pipeline (waxy crude) 14

Chapter Two Transportation of waxy crude oil
2.10 Prediction of gelation
A crude oil does not necessarily gel when it contains two percent of solid wax. The
gelling point depends on size and the shape of the wax crystals and so and
pretreatment which affects the size and shape also affects the gelling point.[7]
There are other complications: most crude oils contain resins which have a natural
affinity for wax crystals. The resins act as natural gelling point depressants: when
they collect around the wax crystals they tend to prevent them from interlocking to
form a gel. Thus any pretreatment which prevents resins from collecting around the
wax also raises the gelling point.
The gelling temperature is normally measured by the pour point test (IP 15, ASTM
D97). The oil contained in a one inch diameter pour point tube is cooled in a carefully
specified cooling bath. The tube is examined by cautiously tilting it at 3ºC intervals, to
find the temperature at which the oil ceases to flow. The pour point is recorded as
3ºC above the temperature. IP 15 and ASTM D97 specify a standard pretreatment
which involves preheating the oil to 46 ºC before cooling. This pretreatment was
appropriate when the test was applied simply to fuel oils because it was designed to
give the pour point of the fuel oil after gelling. However, for crude oils this is no
longer appropriate, and heating to 46ºC may give a high or a low value of the pour
point.[7]
2.11 Prediction of cooling rate
For trenching submarine pipelines the wet conductivity of the sea bottom material
must be used, and allowance must be made for any concrete coating on the pipeline.
Where the line is exposed, natural convection in the sea water must be allowed for, in
addition to forced convection due to tidal currents. The internal heat transfer from the
oil to the pipewall can normally be regarded as infinite when the oil is in turbulent
flow, but it should be taken into account if the oil is in laminar flow as it may be in a
slow start up.
In the shutdown condition of a submarine pipeline, the cooling rate of the oil is very
rapid, even with 50 mm of insulation wrapping; a 500 mm line can lose half of its
The effect of thermal and chemical treatments on the restart of the Gnpoc crude-oil pipeline (waxy crude) 15

Chapter Two Transportation of waxy crude oil
excess above sea temperature in 2.5 days. This contrasts with a land pipeline, where
the loss is much lower due to the “warm ball” of soil around the line in equilibrium
operation. Even when the submarine line is trenched, the warm ball is small because
of the high conductivity of water-saturated material.[7]
2.12 Methods for pipeline transportation of waxy crude oils
One of the following methods for pipelining waxy crude oils may be considered:[5]
1. Select pumps to allow a parallel/series arrangement, which could transport at
slower rates and higher pressures when required. The piping could be manifold
so that parallel arrangement would be accommodated by repositioning of
valves to handle higher flow rates.
2. Use of separate low flow, high head pumps for restarting.
3. Side traps at frequent intervals to allow short sections to be started separately.
4. Reverse pumping to create back and forth pumping sequence which prohibits
static cool down.
5. Use of pour point depressants/flow improvers.
6. Adding hydrocarbon diluent such as a less waxy crude or light distillate.
7. Injection of water to form a layer between pipe wall and crude.
8. Mixing water with crude to form an emulsion.
9. Displacement with water or light hydrocarbon liquid in case of shutdown of
pipeline.
10. Separation at higher than normal pressure to allow as much gas and light
hydrocarbons as possible to remain in the crude.
11. Conditioning the crude before pipelining to change the wax crystal structure
and reduce pour point and viscosity.
12. Further sub-division of pipeline into smaller segments or reducing batch length
of waxy crude to increase maximum shear stress available.
13. Combination of the above methods. [5]
2.13 Treatment of oil samples
At a low temperature in the non-Newtonian region the oils flow behaviour is largely
determined by the structure and the quantity of wax which has come out of solution.
The effect of thermal and chemical treatments on the restart of the Gnpoc crude-oil pipeline (waxy crude) 16

Chapter Two Transportation of waxy crude oil
The size and shape of the wax crystals and the forces of attraction between separate
crystals are very dependent on:
1. Solvent power of the liquid phase (including light ends)
2. Previous rate of cooling
3. Temperature
4. Shear history
5. Crystal form modifiers including natural asphaltenes, resins and artificial
flow improve additives.[7]
2.13.1 Heat treatment
As has been discussed in section 2.2.1, which describes flow behavior of thixotropic
pseudoplastic crude and the causes underlying it, the macrostructure of the solidified
paraffin, as a function of the rate of temperature decrease, many vary rather widely.
If the crude is heated to a temperature high enough to dissolve all the paraffin and is
then suddenly chilled, then a multitude of minute independent paraffin crystals will
form, which do not aggregate into a connected three-dimensional lattice even after
longer storage at the terminal temperature. The flow behavior of this dispersed
system may be rather more favorable than that of crude in which paraffin, solidified
on slow cooling, constitutes a connected three dimensional lattice. Heat treatment
exploits these properties of paraffin crystallization in improving flow behavior. Prior to
designing the heat treatment system it is necessary to establish by laboratory testing
the temperature at which all paraffins dissolve, on the one hand and, on the other,
the slowest rate of cooling will still ensure the desired improvement in flow behavior
and, finally, the lowest terminal temperature, below which chilling will practically not
affect flow behavior any more.
A crude from the Algyo field in South Hungary, was treated by first heating to various
temperatures and then cooling back to 20 ºC at a constant rate [6]. In the case
investigated, the liquid with the worst flow properties came to exist after heating to
about 50 ºC. On further increasing the heating temperature, flow properties improve
somewhat, but do not attain those of the original untreated oil, until about 70 ºC.
Optimum warming is attained between 80 and 85 ºC. Rapid cooling from a high
The effect of thermal and chemical treatments on the restart of the Gnpoc crude-oil pipeline (waxy crude) 17

Chapter Two Transportation of waxy crude oil
enough initial temperature will lead to the formation of small separate crystal grains,
because the depositing paraffins do not have enough time to find the nuclei of
crystallization, previously formed or present in the liquid to start with, and thus to
constitute mixed crystal aggregates of ever-growing size. The nuclei will adsorb the
resinous components first of all, which reduce the affinity of association among
paraffin crystals. The minute crystal grains thus developing may stabilize to a
considerable extent. Cooling rate should typically be 0.3 – 1.0 ºC/s. Increasing the
rate will not improve flow properties beyond a certain limit. This limit is to be
established by experiment. Too fast a rate will increase treatment cost without any
resulting advantage. According to Milley [6], optimum cooling is comparatively fast
down to a temperature a few degrees above the cloud point, and may be slower
below it. Changes in flow properties as a result of heat treatment may be widely
different in different quality crudes. A substantial improvement is to be expected if the
crude is high in paraffin and comparatively low in light fractions. Typically, for
instance, heat treatment of the Algyo crude had the same effect as the addition of 10
percent gasoline. On the other hand, after the addition of 10 percent gasoline, heat
treatment does not improve flow properties any further.[6]
2.13.2 Chemical treatment
Flow parameters can be improved by adding certain chemicals to the crude. The
chemicals in question belong to two distinct groups. The first includes compounds that
enter and modify the paraffin lattice during the cooling of the crude. The compounds
of the second group constitute solvates in the oil and, assuming a preferred
orientation to the main direction of flow, prevent the radial displacement of liquid
particles in turbulent flow, thus reducing the energy dissipation due to impulse
exchange. Lattice modifying additives include the so-called P-inhibitors.[6]
Paraffin deposition creates diverse production problems in many of the world’s oil-
producing regions. In most cases, paraffin problems can be resolved efficiently and
economically with chemical products.
However, expertise is required to select, (1) the best class of paraffin chemical, (2)
the best product in the chosen class, (3) the concentration at which the chemical will
The effect of thermal and chemical treatments on the restart of the Gnpoc crude-oil pipeline (waxy crude) 18

Chapter Two Transportation of waxy crude oil
be most effective, and (4) the application method that will provide the greatest
possibility for success.
2.13.2.1 Chemical inhibitors
Inhibitors (crystal modifiers, crystal distorters) are used to prevent paraffin crystals
from forming massive, crystal lattice structures which may plug tubing, downhole
pumps, flowlines, etc.
Inhibitors will not dissolve, disperse, or remove paraffin that has already been
deposited. They are applied in either continuous or squeeze type treatments to
restrict crystal size of precipitated paraffin and help prevent re-agglomeration of
paraffin crystals.
The temperature at which paraffin precipitates from the oil phase of crude is called
the cloud point, and this cloud point cannot be altered by chemical means. The key to
success full paraffin inhibition, therefore, is getting the chemical into the produce fluid
before the cloud point of the crude oil is reached, i.e., squeeze treatment.
A pour point test should be run to determine the best inhibitor for a particular paraffin
problem. It is not uncommon to use several different crystal modifiers (inhibitors) in
the same filed.[11]
The injection of pour point depressant/flow improver additives appears to hold the
greatest promise of achieving the desired overall objectives of operational safety and
operating economy. Flow improvers should have the capacity to
• Reduce the pour point, viscosity a yield stress under dynamic conditions; and
• Restart the pumping after a shutdown with the available shear stress.[5]
2.13.2.2 Chemical dispersant
Dispersants are also used (batch or continuous) to remove paraffin that has already
been deposited; however, dispersants do not dissolve paraffin. These chemicals
disperse large deposits of paraffin into very small particles which are then carried
through the system by the production system.
Many of these particles re-enter the oil phase as a result of the natural affinity of the
paraffin particle for its parent hydrocarbon.
The effect of thermal and chemical treatments on the restart of the Gnpoc crude-oil pipeline (waxy crude) 19

Chapter Two Transportation of waxy crude oil
While a dispersant may diffuse several times its own weight of paraffin, It does not
have the widespread application of solvents, however, in wells where dispersants are
applicable, they more cost-effective than solvents.
Dispersant chemicals should also be tested on paraffin samples from several wells
before a chemical recommendation is made. Treatments may vary from 60 ppm to
2400 ppm, depending on the severity of the problem.[11]
2.13.2.3 Point of Additive Injection
As a general rule, the additives should be injected into the crude above or around its
cloud point and also at a temperature of some 20°C above the pour point of the
additive. The additive pour point could be depressed considerably by cutting (diluting)
the basic component with kerosine, or aromatic solvents. The preferred location of
injection should be at a point where
• No heating of the oil is required (utilize the heat of formation).
• Subsequent external application of heat can be avoided or minimised.
• The maximum benefit can be derived in the system downstream.[5]
2.14 Yield stress
The yield stress of a material is defined as the minimum shear stress that must be
applied to the material to induce flow.
Yield stress materials exhibit solid-like behaviour at low stress and liquid-like
behaviour at high stress. Solid-like behaviour is associated with elasticity, whereby the
material strains to a fixed value when subjected to a given stress, and there is
complete strain recovery upon removal of that stress. Liquid-like behaviour is
associated with viscosity, whereby the material strains continuously when subjected to
a given stress, and there is no strain recovery upon removal of that stress. The yield
stress is generally regarded as the transition stress between elastic solid like behavior
and viscous liquid like behaviour. However, this transition usually occur over arrange
of stress, during which the material exhibits both elastic and viscous properties, i.e.
viscoelastic flow (also called elastoplastic flow or viscoplastic flow).[12]
Materials which typically exhibit yield stress are multiphase systems. The most
common example is a suspension in which solid particles are dispersed in a liquid
The effect of thermal and chemical treatments on the restart of the Gnpoc crude-oil pipeline (waxy crude) 20

Chapter Two Transportation of waxy crude oil
medium. Under the condition of mutual attraction the particles interact with each
other to form flocs, which in turn interact to create a continuous, three-dimensional
network (a flocculated structure) which can preclude flow at low stresses. The
suspension flows only when the stress is large enough to break down the structure.
On this basis the yield stress has been related to the strength of the coherent network
structure as the force per unit area required to break down the structure.[12]
Yield stress measures the ability of fluid to restart its flow after shutdown of the
transportation system. The yield stress of oil at a given temperature is defined as the
shear stress required to initiate flow. It can thus be directly compared with the shear
stress available or allowable in a pipeline. The yield stress of waxy crudes is
influenced by its temperature history, shear history, aging and composition.[5]
2.14.1 Bingham ’s yield stress and plasticity
Professor Eugene C. Bingham endowed us with one of Rheology’s most memorable
and enduring non-Newtonian laws-the Bingham model or equation, with its ‘Bingham’
yield-value and plastic viscosity, which over the last dozen years or so has been used
many more times than any other flow law containing a yield stress. [13]
2.14.2 Yield Stress-Model Pipeline Test
It is sometime argued that the model pipeline test results are very conservative
because the effect of wax deposition on the pipe wall is ignored. In an actual field
during static cooling after the pipeline is shutdown, wax deposition will start at the
pipe wall and this wax layer will act as insulation thus retarding further cooling. It is
possible that the inner core of the pipeline (nearer axis) is still fluid when the restart is
taken. Therefore, the restart and subsequent viscosity breakdown will be faster.
Correlation of the model pipeline test results for actual pipeline design is normally
based on the previous experience. Some of these correlations are developed by the
designers by pilot plant tests simulating the field conditions in a test loop.
A general equation for calculating restart pressure requirement for a cooled line is
A
YLCp = …………………………………………………………..(2.2)
The effect of thermal and chemical treatments on the restart of the Gnpoc crude-oil pipeline (waxy crude) 21

Chapter Two Transportation of waxy crude oil
Where P is the pressure required, Y is the yield stress of gelled crude (this value must
be determined in laboratory tests and is different for static and dynamic cooling), L is
the line length. C is the circumference of inside pipe wall and A is the cross sectional
area of pipe.
2.15 Flow at Restart
At the time of restart of the pipeline because of very high viscosity, the flow rate is
expected to be low. This, however, depends on available shear stress as compared to
the yield stress. In any case, the minimum flow conditions of the pumps have to be
investigated. If a pump is operated at a very low flow rate, additional wear due to
unbalanced flow is expected. Further, due to the poor efficiency, the oil will be heated
and, after a short while, the allowable maximum temperature will be exceeded. This
limits the allowable time for the operation of the pumps with low flow.
If the restart flow rates do not meet the pump requirements, special pumps with
appropriate characteristics (high head, low flow) have to be used for restart of the
pipeline.[5]
At the restart, the gel oil is displaced by a fluid under pressure. The pressure, which
must be applied exceeds the usual operating pressure and must be sufficiently large
to overcome the strength of the gelled oil plug. As flow begins, shearing causes a
progressive breakdown in the gel structure leading to further increases in the flow
rate. However, the formation of a solid-like gel after shutdown presents the serious
risk that restarting the pipeline may not be possible if the static yield stress of the gel
is too great for the available applied pressure.[1]
2.16 Clearing the full scale pipeline
Yielding is not the end of the start up problem; a gelled line must not only be yielded
but then cleared. In the circumstances of full scale start up the outlet valve to the
pipeline would normally be open and the whole length of the gelled slug would begin
to move once the pressure gradient has been set up along the whole length of the
pipeline.
The effect of thermal and chemical treatments on the restart of the Gnpoc crude-oil pipeline (waxy crude) 22

Chapter Two Transportation of waxy crude oil
The faster the flow becomes, the faster the gel break down, and the smaller the
proportion of the total line still occupied by the gelled oil, the higher the pipewall
shear stress which can be applied to the gel. The flow rate therefore gradually
accelerates up to the normal designed throughput when all has been displaced from
this line.[7]
The effect of thermal and chemical treatments on the restart of the Gnpoc crude-oil pipeline (waxy crude) 23

Chapter Three
Literature Review

Chapter Three Literature Review
Chapter 3: Literature review
3.1 Historical background
Pipelines transporting waxy crude oils may be shut down regularly for normal
operational reasons and occasionally for emergency reasons, such as power failure,
line damage, or even earthquake, etc. In these cases, the warm crude oil in the
pipeline may be cooled statically below its pour point, leading to a strong waxy crystal
interlocking network forming in the oil. The strength of this waxy structure is
influenced by many factors found in the cooling process, such as the starting and final
temperatures, the cooling rate, the isothermal holding time before restart, and the
temperature cycling. To restart the pipeline filled with the gelled oil, a sufficient
pressure must be applied to make the oil yield.
Three yield stresses: an elastic-limit, a static, and a dynamic yield stress, are required
to describe the yielding process and the sheared state after yielding. The elastic-limit
yield stress is the stress limit for an oil sample to retain a reversible waxy crystal
structure. The static yield stress is the minimum shear stress required to produce an
unbounded deformation. Both the elastic-limit and static yield stress are dependent on
the strength of the waxy structure before yielding, and thus can be used as an
indication of the strength of the waxy structure. The dynamic yield stress is useful in
describing the oil properties at the final sheared state after the waxy structure has
been destroyed.
It has been known for a very long time that the thermal history or heat treatment to
which the oils have been subjected influences the fluidity of some residual oils.[15]
Many studies have been carried out for the effect of thermal conditions on the
equilibrium viscosity, which is the viscosity after yielding, for waxy crude oils. The
pour point was often taken as the index of the pumpability in the earlier stage. A
systematic investigation of the variables affecting the yield strength of waxy crude oils
was started in the 1970’s after it was gradually realized that the yield value was a
better measure of the pumpability. A phase contrast microscope was used in some
work to determine the effect of thermal conditions on the size and morphology of
The effect of thermal and chemical treatments on the restart of the Gnpoc crude-oil pipeline (waxy crude) 24

Chapter Three Literature Review
waxy crystals, and was then used to explain the viscosity or yield stress variation with
the thermal conditions. The factors that have been investigated involved temperature
history, testing temperature, temperature cycling, and cooling rate, shear history,
aging, and composition; but some conflicting conclusions have been found. The
reproducibility of the yield stress measurements has been found to be poor in many
earlier studies. This poor reproducibility may be caused by many reasons, among
which are the confused definition of the yield stress, limitation of the instruments and
the techniques, and poor control of the thermal conditions of the experiments.
Recently, a controlled stress rheometer with cone-and-plate geometry was introduced
with which the true yield values of waxy crude oils can be directly determined. The
small volume of the sample used in the cone-and-plate geometry and the improved
temperature control function of the rheometer make it possible to effectively control
the temperature and thermal history, which was difficult to do with the instruments
using a large volume of the sample, such as the pipeline.
3.2 Thermal treatment studies:
Chang and Boger [15] performed studies to investigate the influence of thermal
history on the waxy structure of statically cooled waxy crude oil. Their results from
both yield stress measurements and microscopic observations show that the waxy
structure strongly depends on both the temperature and the cooling rate. The
isothermal holding time both before and after yielding was found to have no
observable influence on the structure over the time period studied in these
experiments.
Russell and Chapman [16] studied the pumping of 29.4ºC pour point Assam
(Nahorkatiya) crude oil at 18.3ºC. Their works with waxy fuel oils shown that both
pour point and the viscosity of these fuels are dependent on the previous thermal
treatment they receive. In general, pour point and viscosity below 37.8ºC are reduced
by heating to 100ºC, whilst heating to 46.1ºC as in Institute of petroleum (upper)
pour point test, tends to increase them. This behavior has been attributed to
modification of the wax crystal structure caused by absorption of small amounts of
asphaltenes and resins of the surfaces of the growing crystals.
The effect of thermal and chemical treatments on the restart of the Gnpoc crude-oil pipeline (waxy crude) 25

Chapter Three Literature Review
Venkatesan et. al.[4] performed rheometric studies on a model system to study the
yield strength of paraffin–oil gels formed under various shear and thermal histories. It
was observed that when the gel was formed under quiescent (shut-in) conditions, the
yield stress of the gel decreased with an increasing cooling rate. However, when a
shear stress was exerted on the gel during cooling (as would be experienced in a flow
line), the trend of the yield stress vs. cooling rate curve was strongly influenced by
the magnitude of this shear stress. Additionally, experimentation over a range of
applied shear stresses revealed that the yield stress of the gel reaches a maximum at
a moderate value of the applied shear. These rheometric results are explained with
the help of 3-D polarized light microscopy observations of the paraffin crystal
structure formed under various shear and cooling conditions using static and flow cell
systems.
3.3 Chemical treatment studies:
In the chemical side many studies have been done for the effect of chemical additives
on flow improvement. Mendell [17] studied the effects of paraffin inhibition on crude
oil flow improvement. Their findings revealed that the inhibition mechanism for pour
point depressant was most likely related to crystal modification and/or dispersion.
They also found that no single additive has provide to be effective for all crude types.
Verma et. al.[18] performed studies to investigate the influence of dispersants on the
pour point of crudes. Their findings suggest that surfactants can prevent these
network formations by retarding the growth of the waxy crystals in Xy-crystallography
plane, thereby producing small crystals of higher volume/surface area ratio.
In other words, the ability of crystals to intergrow and interlock can be minimized
through shape changes, which in most cases will result in a lowering of the crudes
pour point. Groffe et. al.[14] performed studies on a wax inhibition solution to
problematic fields. Their finding suggested that the chemical P5 possesses the
capability to interact with precipitating waxes, thus reducing the pour point and
improving the flow characteristic of crude oils. In one case (crude oil G), the chemical
was able to lower the wax apparent temperature by almost 10ºC. Furthermore, the
The effect of thermal and chemical treatments on the restart of the Gnpoc crude-oil pipeline (waxy crude) 26

Chapter Three Literature Review
chemical has been shown to display anti-sticking properties by drastically reducing the
amount of wax deposited onto adhering metal surfaces.
Studies were carried out in the Salaya-Koyali-Mathura crude pipeline by Oil & Natural
Gas Commission, India [5]. The line was originally designed for transportation of low
pour point Middle East crude oils (Light Arabian and North Rumaila). With the
discovery of the Bombay High crude oil, it was decided to process this crude too at
these refineries. Efforts were made to find a suitable solution to the problem of
pipeline transportation of this high pour point (30°C) Bombay High crude oil to these
refineries during winter. It was reported by model pipeline tests that the line will not
be able to take a restart after cooling statically to low winter temperature of around
16°C.
A number of flow improver additives were tested for their effectiveness on Bombay
High crude. From preliminary tests, Shell-swim-5T and Esso Paradyne-80 were
reported to be the most effective additives in lowering pour point. Further tests by
rotational viscometers indicated that, for similar level of dosage, both effective
viscosity and yield stress were reported to be lower in case of Shell-swim-5T as
compared to Esso Paradyne-80. It was therefore concluded that shell-swim-5T is
superior to Esso Paradyne-80. Subsequently, Shell-swim-5T was used for
transportation of the Bombay High crude to Uran terminal through the submarine
pipeline from the production platform. Extensive studies were subsequently done at
Dehradun, and Gujarat Refinery to determine the optimum doping conditions for
Shell-swim-5T in Bombay High crude. From these-studies the optimum doping levels
were reported to be 250-300ppm of the Shell.swim-5T. The effect of doping
temperature on the pour point was reported to be negligible.
Effect of the Shell.swim-5T improver on Yield Stress showed significant reduction with
200 ppm doping. Further improvement with higher doping levels is, however,
marginal. In fact in some cases the trend was reported to be reversed with higher
doping levels.
El-Emam et. al.[19] performed studies on choosing how to boost waxy crude oil flow
depends on oils qualities. Their results showed the Casson yield stress (k) remain
The effect of thermal and chemical treatments on the restart of the Gnpoc crude-oil pipeline (waxy crude) 27

Chapter Three Literature Review
constant up to 100 ppm and after that decreases with increasing concentration. At
any concentration, the reduction in k obtained by the polymer additive is the highest,
while that obtained by the ester type is the lowest. Also the crude approaches
Newtonian behavior when treated by 500 ppm of inhibitor. and there is no change in
the pour point at concentration greater than 500 ppm in cases of polymer and ester
but the paraffin inhibitors showed a reduction in pour point, however, up to 1000
ppm.
The effect of thermal and chemical treatments on the restart of the Gnpoc crude-oil pipeline (waxy crude) 28

Chapter Four
Experimental Work

Chapter Four Experimental Work
Chapter 4: Experimental work 4.1 Introduction
A number of tests were performed in the fluid mechanics laboratory at university of
Khartoum during the first quarter of 2008 to determine the yield stress and pour point
4.1.1 To check the effect of thermal treatment two groups of
experiments were done; group A and B experiments.
4.1.1.1 Group A:
In this group of experiments the crude oil samples were heated to 95º C, 90º
C, 85º C, 80º C, and 75º C, respectively and the yield stress and pour point
were measured.
4.1.1.2 group B:
In this group of experiments the crude oil samples were heated to 95ºC and
then cooled to 70º C in different cooling period ( 5, 10, 15, and 20 minutes)
and then yield stress and pour point were found.
4.1.2 To test the effect of pour-point depressant three groups of
experiments were done; group C, D, and E.
4.1.2.1 Group C:
In this group the yield stress and pour point were found by adding different
PPD doses to crude oil (100, 200, 300, 400, and 500ppm)
4.1.2.2 Group D:
This group shows the effect on yield stress and pour point due to adding PPD
doses at different temperatures above the wax appearance temperature 55º C,
60º C, 65º C, 70º C and 75º C.
4.1.2.3 Group E:
In this group the yield stress and pour point were found using PPD-dosed
samples passed through dynamic cooling from 70 ºC to 56 ºC and then
reheated to 65º C and repeated the reheating times.
The effect of thermal and chemical treatments on the restart of the Gnpoc crude-oil pipeline (waxy crude) 29

Chapter Four Experimental Work
4.2. Sample
Crude oil sample obtained directly from a Greater Nile Petroleum Operating Company
(GNPOC) field was used in this study.
4.3. Pour point test
The pour point of a crude oil is an index of the lowest temperature of handleability for
certain applications. Crude oil is first heated in a reservoir bottle to a temperature in
the range 90 - 95ºC,which is sufficiently high to dissolve all wax, asphaltenes and
resins. The oil is then shock-chilled to 70ºC. The starting test temperature for pour
point a round 45ºC
4.3.1. Apparatus
Pour Point Test Apparatus (see Figs. 4.2 A & B):[20]
4.3.1.1. Test Jar, cylindrical, of clear glass, flat bottomed, outside diameter 34.8
mm, and height 125 mm. The inside diameter of the jar 32.4 mm, within
the constraint that the wall thickness shall be no greater than 1.6 mm.
The jar shall have a line to indicate a sample height 54 + or - 3 mm
above the inside bottom. The inside of the test jar (up to the mark) shall
be visibly clean and free of scratches.
4.3.1.2. Thermometers, having the following ranges and conforming to the
requirements prescribed in Specification E 1 for thermometers, table 4.1
shows the specification of thermometers:
Table 4.1 Thermometers Specification
Temperature Range Thermometer Number
Thermometer ASTM IP
High cloud and pour −38 to + 50°C 5C 1C
4.3.1.3. Cork, to fit the test jar, bored centrally for the test thermometer.
The effect of thermal and chemical treatments on the restart of the Gnpoc crude-oil pipeline (waxy crude) 30

Chapter Four Experimental Work
Fig. 4.1 test jar with thermometers and cork
4.3.1.4. Water Bath—two baths were used in the test, one for heating the
sample and the other for cooling process using water at 9ºC. An
available support was used to hold the test jar that was immersed in the
bath vertically. The sample height in the test jar was lower than the
water level in the water bath.
Fig. 4.2 A Fig. 4.2 B Apparatus for pour point
The effect of thermal and chemical treatments on the restart of the Gnpoc crude-oil pipeline (waxy crude) 31

Chapter Four Experimental Work
4.3.2. Procedure1
4.3.2.1 Test sample was poured into the two test jars to the level mark.
4.3.2.2 Immediately the test jar was closed with the cork carrying the high cloud
and pour thermometer.
4.3.2.3 The position of the cork and thermometer was adjusted so the cork fits
tightly, the thermometer and the jar are coaxial, and the thermometer bulb
is immersed to a depth that places the beginning of the capillary 3 mm
below the surface of the test specimen.
4.3.2.4 Test jar was inserted into the jacket in the second bath maintained at 9°C
and pour point observations were commenced. Pour points are expressed in
temperatures which are positive or negative multiples of 3°C.
4.3.2.5 The appearance of the test specimen was examined at a temperature of
9°C above the expected pour point (estimated as a multiple of 3°C). The
test jar was removed from the jacket for every 3°C below the starting
temperature. When necessary, moisture that limits visibility of the test
specimen was removed by wiping the surface of the test jar with a clean
cloth moistened in alcohol. The test jar was tilted just enough to ascertain
whether there is movement of the test specimen in the test jar. When
movement is observed, immediately the test jar was returned into the
jacket. The complete operation of removal and replacement required not
more than 3 s.
4.3.2.6 As soon as the test specimen in the jar does not flow when tilted, the jar
was held in a horizontal position for 5 s, and observed carefully.
4.3.2.7 When the test specimen shows a movement, the test jar was replaced
immediately in the jacket and a test for flow was repeated at the next
temperature, 3°C lower.
1 Appendix one
The effect of thermal and chemical treatments on the restart of the Gnpoc crude-oil pipeline (waxy crude) 32

Chapter Four Experimental Work
4.3.2.8 The process was continued in the above mentioned manner until a point is
reached at which the test specimen shows no movement when the test jar
is held in a horizontal position for 5 s. The observed reading of the test
temperature was recorded.
4.3.2.9 The pour point was obtained by adding 3°C to the temperature recorded.
4.4. Measurement of yield stress
The yield stress of crude oil under shutdown pipeline condition was studied in the
laboratory using model pipelines. A one m x 4.3 mm bore stainless steel pipe is
immerse in a temperature controlled bath
4.4.1. Instruments
4.4.1.1 Cartridge pump – MasterFlex L/STM model 7519-20 as shown in Fig. 4.3
4.4.1.2 Water bath Grant instruments (Cambridge) Ltd. – LTC6-30RS as shown in Fig. 4.4
The effect of thermal and chemical treatments on the restart of the Gnpoc
Fig. 4.4 Water bath & flow line
Fig. 4.3 Cartridge Pumpcrude-oil pipeline (waxy crude) 33

Chapter Four Experimental Work
4.4.1.3 magnetic stirrer as shown in Fig. 4.5
4.4.1.4 Modular Controller – Cole-Parmer Instrument company as shown in Fig.
4.6
4.4.1.5
4.4.2. Pro
4.4.2.1.
4.4.2.1.1
4.4.2.1.2
2 Appendix two
The effect of the
Fig. 4.5 Stirrer
Pico logger to control and setting the temin Fig. 4.7
Fig. 4.7 Pico
cedure2
Loop preparation
Oil was heated in reservoir to 95°C.
Oil was cooled within tank rapidly to 7
rmal and chemical treatments on the restart of the G
Fig. 4.6 Modular controller
perature on flow line as shown
0°C.
npoc crude-oil pipeline (waxy crude) 34

Chapter Four Experimental Work
4.4.2.2. Pre-shutdown procedure
4.4.2.2.1 All loop parts (water bath, flow line, and reservoir bottle) were
heated to 70°C.
4.4.2.2.2 The sample was charged to the reservoir bottle at 70-75°C .A
magnetic stirrer bar was inserted and stirring started. Inserting a
thermometer monitored temperature, where necessary the heating
facility on the magnetic stirrer was used to help keep the crude at
the correct temperature. The heat was gently supplied by a magnetic
stirrer. The temperature of the plastic tubes and metal pipes was
kept at the same temperature by using a heating tape around each;
tape’s temperature was controlled from the Pico logger screen.
4.4.2.2.3 The 3-way valve was turned towards the pump; flow was started at
a low flow rate (speed no 3) until oil recovered from the outlet of the
3-way valve, then the pump was stopped.
4.4.2.2.4 The 3-way valve was turned towards the bath and pump was
restarted. This time flow was increased to a high rate (speed 10 –
shear rate 60s-1) and oil was pumped to the coil, flowing was kept
until a steady stream flew from the outlet. It was a continuous flow
with no evidence of air bubbles in the stream. By then the coil was
filled with oil from reservoir.
4.4.2.2.5 The cooling profile was started. A step cooling approach was used,
as follow:
3.4.2.2.5.1 Ramp to 52° C in 2 hours
3.4.2.2.5.2 Pump was stopped and static cooling to 25 ° C was continued in 2
hours
The effect of thermal and chemical treatments on the restart of the Gnpoc crude-oil pipeline (waxy crude) 35

Chapter Four Experimental Work
4.4.2.3. Shutdown procedure
4.4.2.3.1 After completion of the cooling cycle and shut –in time, the stirrer
was turned on to heat the rig components over 70 ºC, the 3-way
valve was turned towards the pump and it was restarted (speed 3) to
re-establish flow of hot oil. The oil was collected from outlet using a
measuring cylinder (a test tube can be used). The time of flow was
recorded and the flow was calculated, in order to set the same flow
for all tests (same base for comparison).
4.4.2.3.2 The system was checked and the pump was stopped.
4.4.2.4. Restart procedure
4.4.2.4.1 The 3-way valve was turned towards the bath and the pump was
started in the other side at a speed near to 0 (at shear rate 7s-1).The
build up of pressure was monitored using digital camera instead of
the data logger, until pressure began to fall. The highest pressure
was registered as the RESTART PRESSURE.
4.4.2.4.2 After completion of the test, the data was collected.
4.4.2.4.3 The bath, tubes and pipes were heated to the start temperature to
allow easy cleaning of test coil for the next test.
The effect of thermal and chemical treatments on the restart of the Gnpoc crude-oil pipeline (waxy crude) 36

Chapter Five
Results Analysis and discussions

Chapter Five Results analysis and discussions
Chapter 5: Results analysis and discussions
In this chapter; An analysis shall be performed for all the experiments described in
Chapter 4. The experiments were illustrated graphically concentrating on the effects of
thermal and chemical treatment on both pour point and yield stress (numerical data of
Figures 5.1 to 5.20 is available in appendix) 3. Based on this analysis some points would
be discussed regarding the best restarting conditions.
It’s worth mentioning the following equation has be3en used in sketching the graphs of
yield stress:
L
PPDe 4
)( 21 −=τ …………………………………………. 5.1
5.1 Group A:
Fig. 5.1 effect of thermal treatment on restart gel strength of crude oil
0
20
40
60
80
100
120
140
0 30 60 90 120 150 180 210 240 270 300 330 360 390
restart time (S)
gel s
tren
gth
(Pa)
95ºC
90ºC
85ºC
80ºC
75ºC
5.1.1 Figure 5.1 shows the gel strength behavior in thermal treatments for a range of
temperature (75˚ ~ 95˚C).
3 Appendix three
The effect of thermal and chemical treatments on the restart of the Gnpoc crude-oil pipeline (waxy crude) 37

Chapter Five Results analysis and discussions
5.1.2 The gel strength of crude oil would vary inversely with the increasing of heating
temperature, thereby; the thermal treatment is effective in decreasing gel
strength.
5.1.3 The gel strength has greatly increased in the heating effective range (75˚ ~
80˚C), in the same range the strength is increasing rapidly, which is not the case
for a temperature above 80˚C.
5.1.4 In each thermal treatment; the gel strength is increasing rapidly with the start
time till the yield point (static yield point). Afterward, the gel strength would
rapidly decrease to a one-minute restart time.
5.1.5 For a restart time above 60 seconds there is no significant variations in the gel
strength (the curve is approximately steady) those points are defined as dynamic
yield strength.
Fig. 5.2 effect of heating for several preheating temperatures on pour point
32
33
34
35
36
37
38
39
40
70 75 80 85 90 95 100
temp. (ºC)
pour
poi
nt (º
C)
5.1.6 Figure (5.2) illustrates pour points variation with the preheating temperature in the
range (75˚ ~ 95˚C)
5.1.7 In the (75˚ ~ 95˚C) range of preheating temperatures; the pour points decreases
as the temperature increases.
The effect of thermal and chemical treatments on the restart of the Gnpoc crude-oil pipeline (waxy crude) 38

Chapter Five Results analysis and discussions
5.1.8 There is no variation in pour point in the ranges (80˚ ~ 85˚C) and (90˚ ~ 95˚C).
It’s important to mention that procedures of the ASTM - D97 followed have a
tolerance of maximum value 3˚C.
Fig. 5.3 effect of heating for several temp. on yield stress
0
20
40
60
80
100
120
140
70 75 80 85 90 95 100
temperature (ºC)
yiel
d st
ress
(Pa)
5.1.9 The yield stress varies inversely with preheating temperature of crude oil; the
smoothness of variation is most like the exponential variation as shown in figure
(5.3).
5.1.10 The changes in yield stresses in the lower preheated temperature (75˚ ~ 85˚C)
are too rapid than the change in the higher temperature ranges (85˚ ~ 95˚C).
5.1.11 There is no obvious change in the yield stress when the temperature increases
from 90˚ to 95˚C.
The effect of thermal and chemical treatments on the restart of the Gnpoc crude-oil pipeline (waxy crude) 39

Chapter Five Results analysis and discussions
Fig. 5.4 effect of heating on restart time
0
5
10
15
20
25
30
35
40
45
50
70 75 80 85 90 95 100
temperature (ºC)
time
(s)
5.1.12 The restart time decreases linearly with increasing of crude oil preheating
temperature as shown in figure 5.4.
5.2 Group B:
Fig. 5.5 effect of cooling time from 95 to 70ºC on restart gel strength of crude oil
0
10
20
30
40
50
60
0 30 60 90 120 150 180 210 240 270 300 330 360 390
restart time (S)
gel s
tren
gth
(Pa)
coo ling in 5 min.coo lin in 10 min.coo ling in 15 min.coo ling in 20 min.
The effect of thermal and chemical treatments on the restart of the Gnpoc crude-oil pipeline (waxy crude) 40

Chapter Five Results analysis and discussions
5.2.1 Figure (5.5) illustrates the effect of cooling time on restart gel strength.
5.2.2 The gel strength increases directly with increasing of the cooling time.
Fig. 5.6 effect of cooling period from 95 to 70ºC on pour point
30
31
32
33
34
35
0 5 10 15 20 25
cooling time (min.)
pour
poi
nt (º
C)
5.2.3 There is absolutely no change in the pour point when the cooling time is increasing
from 5 to 20 minutes as shown by fig. (5.6)
Fig. 5.7 effect of cooling period from 95 to 70ºC on yield stress
0
10
20
30
40
50
60
0 5 10 15 20 25
cooling time (min.)
yiel
d st
ress
(Pa)
The effect of thermal and chemical treatments on the restart of the Gnpoc crude-oil pipeline (waxy crude) 41

Chapter Five Results analysis and discussions
5.2.4 The yield stress varies directly with increasing of the cooling time in a range of (5
~ 20 minutes) as illustrated by fig. 5.7.
5.2.5 For a cooling time longer than 15 minutes the changes in yield stress are not so
rapid as for shorter cooling times.
Fig. 5.8 effect of cooling period from 95 to 70ºC on restart time
0
5
10
15
20
25
0 5 10 15 20 25
cooling time (min.)
time
(s)
5.2.6 Fig. 5.8 shows that the increasing of cooling time increases the restart time, the
direct variation is obvious in the cooling time range (5 to 20 minutes)
5.3 Group C:
Fig. 5.9 effect of adding different ppd doses on restart gel strength of crude oil
0
10
20
30
40
50
60
0 30 60 90 120 150 180 210 240 270 300 330 360 390
restart time (S)
gel s
tren
gth
(Pa)
100 ppm200 ppm300 ppm400 ppm500 ppm
The effect of thermal and chemical treatments on the restart of the Gnpoc crude-oil pipeline (waxy crude) 42
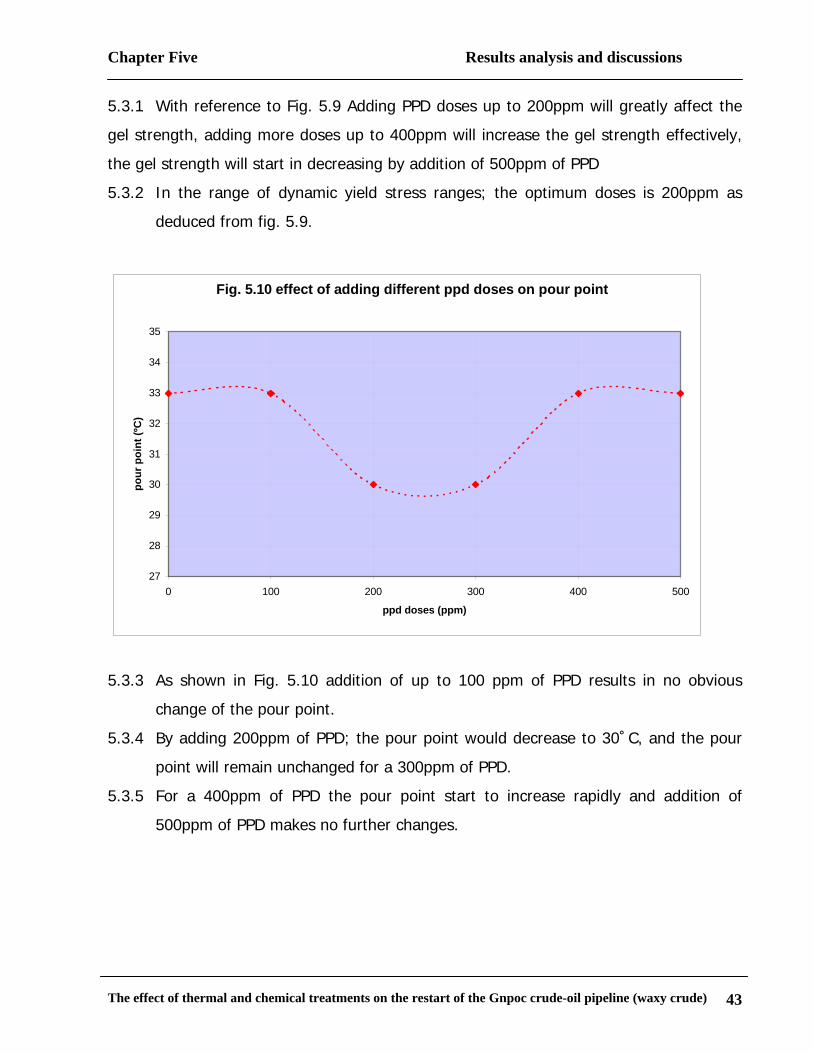
Chapter Five Results analysis and discussions
5.3.1 With reference to Fig. 5.9 Adding PPD doses up to 200ppm will greatly affect the
gel strength, adding more doses up to 400ppm will increase the gel strength effectively,
the gel strength will start in decreasing by addition of 500ppm of PPD
5.3.2 In the range of dynamic yield stress ranges; the optimum doses is 200ppm as
deduced from fig. 5.9.
Fig. 5.10 effect of adding different ppd doses on pour point
27
28
29
30
31
32
33
34
35
0 100 200 300 400 500
ppd doses (ppm)
pour
poi
nt (º
C)
5.3.3 As shown in Fig. 5.10 addition of up to 100 ppm of PPD results in no obvious
change of the pour point.
5.3.4 By adding 200ppm of PPD; the pour point would decrease to 30˚C, and the pour
point will remain unchanged for a 300ppm of PPD.
5.3.5 For a 400ppm of PPD the pour point start to increase rapidly and addition of
500ppm of PPD makes no further changes.
The effect of thermal and chemical treatments on the restart of the Gnpoc crude-oil pipeline (waxy crude) 43

Chapter Five Results analysis and discussions
Fig. 5.11 effect of adding different ppd doses on yield stress
0
10
20
30
40
50
60
0 100 200 300 400 500 600
ppd doses (ppm)
yiel
d st
ress
(Pa)
5.3.6 The effect of adding PPD on the yield stress shows a relatively complex behavior
as illustrated by Fig 5.11. The yield stress decreases when PPD doses are
increased up to 200ppm, adding more doses of PPD tend to increase the yield
stress to 56 Pa at 400ppm doses of PPD. Adding more PPD will result in decreasing
the yield stress again to reach 37 Pa at 500ppm doses of PPD.
Fig. 5.12 effect of adding different ppd doses on restart time
0
5
10
15
20
25
30
0 100 200 300 400 500 600
ppd doses (ppm)
time
(s)
5.3.7 The restart time would decrease slightly by adding doses of PPD up to 200ppm,
the restart time is rapidly increased up to 25 seconds at 300ppm, and the restart
The effect of thermal and chemical treatments on the restart of the Gnpoc crude-oil pipeline (waxy crude) 44

Chapter Five Results analysis and discussions
time would remain unchanged by adding 400ppm, then it would decrease rapidly
to 20 seconds at 500ppm of PPD doses, these are shown by Fig. 5.12.
5.4 Group D:
Fig. 5.13 effect of adding 200ppm of ppd doses at different temp. on restart gel strength
0
5
10
15
20
25
30
35
40
0 30 60 90 120 150 180 210 240 270 300 330 360 390
restart time (S)
gel s
tren
gth
(Pa)
At 55 ºCAt 60 ºCAt 65 ºCAt 70 ºCAt 75 ºC
5.4.1 Fig (5.13) shows the effect of adding 200ppm doses of PPD at different
temperature on restart gel strength.
5.4.2 The gel strength would increase directly with the increase of restart time in the
limit not more than 30 seconds, then the gel strength would decrease rapidly
until reaching the dynamic yield stress zone.
5.4.3 The gel strength varies inversely with temperature.
The effect of thermal and chemical treatments on the restart of the Gnpoc crude-oil pipeline (waxy crude) 45

Chapter Five Results analysis and discussions
Fig. 5.14 effect of adding ppd at different temp. on pour point
27
28
29
30
31
32
33
50 55 60 65 70 75 80
adding temp. (ºC)
pour
poi
nt (º
C)
5.4.4 There is no effect of adding temperature on pour point as shown in Fig. 5.14.
5.4.5 The pour point would remain 30°C in the temperature range (55° ~ 75°C)
Fig. 5.15 effect of adding ppd at different temp. on yield stress
31
32
33
34
35
36
37
38
50 55 60 65 70 75 80
adding temp. (ºC)
yiel
d st
ress
(Pa)
5.4.6 Fig (5.15) indicates that there is no change in yield stress in temperature range
55°- 60°C, then the significant decay occurred when PPD are added at 65°C, the
yield stress continues to decrease slightly till 32 Pa at 70°C, and thereafter until
75°C remains constant.
The effect of thermal and chemical treatments on the restart of the Gnpoc crude-oil pipeline (waxy crude) 46

Chapter Five Results analysis and discussions
Fig 5.16 effect of adding ppd at different temp. on restart time
0
5
10
15
20
25
30
50 55 60 65 70 75 80
adding temp. (ºC)
time
(s)
5.4.7 The restart time decreases slightly with increasing of temperature in the range
(55° to 70°), and it would be unchanged till 75°C.
5.5 Group E:
Fig. 5.17 effect of reheating (ppd aging) on restart gel strength
0
10
20
30
40
50
60
0 30 60 90 120 150 180 210 240 270 300 330 360 390
restart time (S)
gel s
tren
gth
(Pa)
without reheatingreheating one timereheating two times
5.5.1 In Fig (5.17) the reheating of crude oil that followed the dynamic cooling will
affect PPD negatively by influencing the gel strength.
The effect of thermal and chemical treatments on the restart of the Gnpoc crude-oil pipeline (waxy crude) 47

Chapter Five Results analysis and discussions
5.5.2 The experiment was conducted in three phases; without reheating, one-time
reheating and two-times reheating,
5.5.3 The gel strength behavior in one and two-times reheating is nearly the same in
restart time not more than 30 seconds, for longer times, the dynamic yield
stresses for double-times reheating are higher than one-time reheating.
5.5.4 The effectiveness of PPD would be hedged in continuous reheating, as it make no
effect in two-times reheating.
Fig. 5.18 effect of reheating (ppd aging) on pour point
27
28
29
30
31
32
33
34
35
0 1
reheating times
pour
poi
nt (º
C)
2
5.5.5 The pour point has increased to 33°C in reheating for one time, and remained
constant in two times reheating as shown in Fig. 5.18.
The effect of thermal and chemical treatments on the restart of the Gnpoc crude-oil pipeline (waxy crude) 48

Chapter Five Results analysis and discussions
Fig. 5.19 effect of reheating (ppd aging) on yield stress
20
25
30
35
40
45
50
55
60
65
0 1
reheating times
yiel
d st
ress
(Pa)
2
5.5.6 The yield stress has increased to 56 Pa in reheating for one time, and remained
constant in two times reheating as illustrated in Fig. 5.19.
Fig. 5.20 effect of reheating (ppd aging) on restart time
20
2122
2324
25
2627
2829
30
0 1
reheating times
time
(s)
2
5.5.7 Fig. 5.20 shows that the restart time increases slightly with the times of oil
reheating.
The effect of thermal and chemical treatments on the restart of the Gnpoc crude-oil pipeline (waxy crude) 49

Chapter Six
Conclusion and Recommendations

Chapter Six Conclusion and Recommendations
Chapter 6: Conclusion and Recommendations
6.1 The empirical rule states that the thermal treatments of the crude oil to a
temperature above 80°C enables it to attain its initial state at pumping from well
is applicable to the Sudanese crude (GNPOC crude) since there is an obvious
improvement in reducing the gel strength when the crude is thermally treated to
85°C and higher to 95°C.
6.2 The optimum pour point is achieved by treating in the range (90°C-95°C). This
also applies to yield stress for it was minimum when heating to 90°C and 95°C
and the difference in the yield stress when heating to 90°C and 95°C was
negligible. So we can fairly state that the thermal treatment should be in the
range (90°C-95°C).
6.3 Theory states nothing regarding the rate at which rapid cooling from 95°C to 70
°C should be performed; but from our experiments we deduced that using
different rates of cooling doesn’t affect the pour point; it only affects the yield
stress clearly in a proportional manner; reducing cooling period reduces the yield
stress.
6.4 Using the pour point reducer; a minimum pour point occurred at 200ppm and
300ppm and a minimum yield stress at 200ppm. So it was concluded that adding
200ppm –in the range (100ppm-500ppm) - is the optimum resulting in minimum
pour point and yield stress; hence implying a low restart pressure.
6.5 In theory no specified addition temperature-the temperature at which PPD is
added- only stated that it should be 20 °C above the pour point; others prefer it
to be higher than the WAT. Here PPD was added between 55°C and 75°C and
this didn’t affect the pour point since the same value was recorded in all cases;
but it affected the yield stress; in the low range (55°C-60°C) the yield stress
wasn’t affected ;but addition of PPD in a high range (65°C-75°C) reduced the
yield stress significantly.
The effect of thermal and chemical treatments on the restart of the Gnpoc crude-oil pipeline (waxy crude) 50

Chapter Six Conclusion and Recommendations
6.6 It is recommended that in order to obtain a minimum yield stress; PPD should be
added in the range (70°C-75°C).
6.7 Regarding the effect of reheating on the long term effectiveness of the PPD; this
work discovered that reheating causes the effectiveness of the PPD to cease
completely since the pour point and the yield stress attained their original values
before addition of PPD at reheating.
Reheating is not applied in GNPOC pipelines; but it is found in Petrodar pipeline.
6.8 It was also deduced that reheating many times –after the first time- has no
further effects.
The effect of thermal and chemical treatments on the restart of the Gnpoc crude-oil pipeline (waxy crude) 51

Appendixes


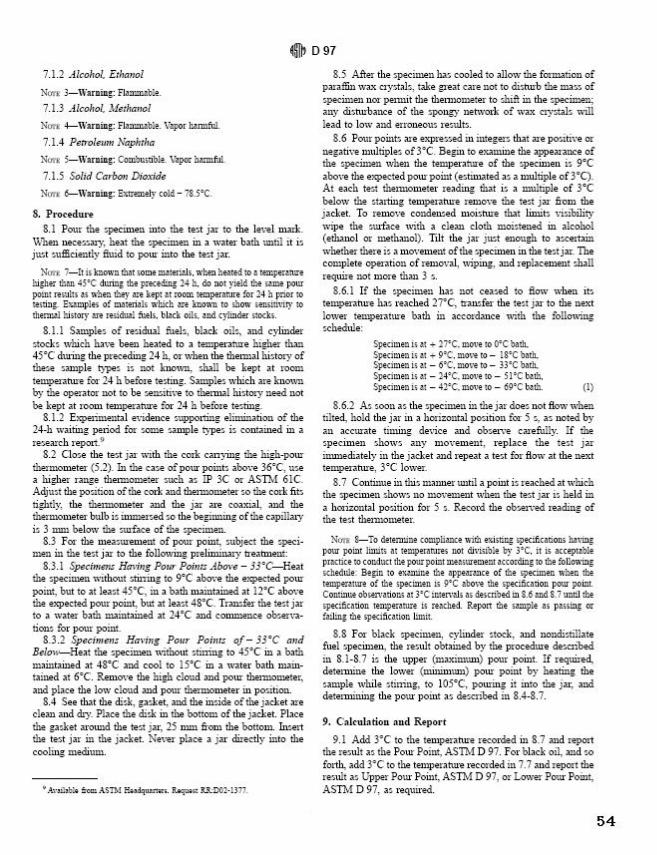

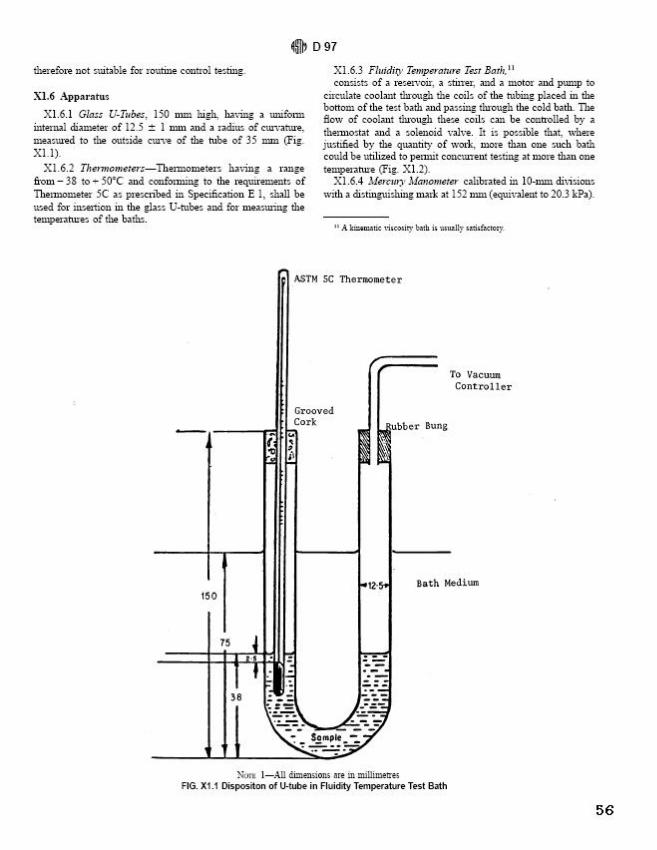


Appendix Three
Group A
95 ºC 90 ºC 85 ºC 80 ºC 75 ºC
T(Sec) gel str.
(pa) T(Sec) gel str.
(pa) T(Sec)gel str.
(pa) T(Sec)gel str.
(pa) T(Sec) Gel str.
(pa) 0 0 0 0 0 0 0 0 0 0 10 22 10 15 10 13 10 11 10 11 20 44 20 37 20 30 20 30 20 30 22 56 27 57 30 56 30 52 30 63 30 30 30 48 32 61 38 82 40 104 40 19 40 30 35 52 50 44 44 122 50 15 50 26 40 37 60 37 50 74 60 15 60 24 50 35 70 37 60 56 70 15 70 22 60 33 80 37 70 56 80 15 80 22 70 32 90 37 80 52 90 15 90 22 80 32 100 39 90 52
100 15 100 22 90 32 110 39 100 52 110 15 110 22 100 32 120 39 110 52 120 15 120 22 110 32 150 41 120 52 150 17 150 24 120 32 180 41 150 52 180 19 180 24 150 32 210 41 180 52 210 22 210 26 180 32 240 43 210 52 240 22 240 26 210 32 270 43 240 56 270 22 270 26 240 30 300 43 270 56 300 24 300 26 270 30 330 43 300 56 330 26 330 28 300 30 360 43 330 56 360 26 360 28 330 30 360 56
360 30
Ttemperature ºC Pour point 95 33 90 33 85 36 80 36 75 39
63

Group B cooling in 5 min cooling in 10 min cooling in 15 min cooling in 20 min
T(Sec) gel str.
(pa) T(Sec) gel str.
(pa) T(Sec) gel str.
(pa) T(Sec) gel str.
(pa) 0 0 0 0 0 0 0 0 10 19 10 15 10 19 10 22 16 37 19 46 20 41 20 44 20 26 20 41 21 54 22 56 30 22 30 30 30 30 30 30 40 20 40 22 40 20 40 19 50 19 50 22 50 20 50 15 60 17 60 20 60 19 60 15 70 17 70 20 70 19 70 15 80 17 80 20 80 19 80 15 90 17 90 19 90 17 90 15
100 17 100 19 100 17 100 15 110 17 110 19 110 17 110 15 120 17 120 19 120 17 120 15 150 17 150 19 150 19 150 17 180 17 180 19 180 19 180 19 210 17 210 19 210 20 210 22 240 17 240 19 240 20 240 22 270 19 270 19 270 20 270 22 300 19 300 19 300 20 300 24 330 19 330 19 330 22 330 26 360 19 360 19 360 22 360 26
Cooling time Pour point 5 33
10 33 15 33 20 33
64

Group C
100 ppm 200 ppm 300 ppm 400 ppm 500 ppm
T(Sec) gel str.
(pa) T(Sec) gel str.
(pa) T(Sec)gel str.
(pa) T(Sec)gel str.
(pa) T(Sec) gel str.
(pa) 0 0 0 0 0 0 0 0 0 0 10 7 10 15 10 15 10 15 10 15 20 22 20 30 20 30 20 39 20 37 21 37 21 32 25 48 25 56 30 20 30 24 30 19 30 37 30 41 40 19 40 19 40 13 40 30 40 30 50 19 50 17 50 11 50 26 50 26 60 19 60 15 60 11 60 26 60 24 70 20 70 15 70 11 70 24 70 24 80 20 80 15 80 11 80 24 80 22 90 20 90 15 90 11 90 24 90 22 100 22
100 15 100 13 100 24 100 22 110 22 110 15 110 13 110 24 110 22 120 22 120 15 120 13 120 24 120 22 150 22 150 15 150 13 150 26 150 22 180 22 180 15 180 13 180 30 180 22 210 22 210 15 210 13 210 30 210 22 240 22 240 15 240 13 240 30 240 22 270 22 270 15 270 13 270 30 270 22 300 22 300 15 300 13 300 30 300 22 330 22 330 15 330 13 330 30 330 22 360 22 360 15 360 13 360 30 360 22
PPD doses Pour point 0 33
100 33 200 30 300 30 400 33
65

Group D
At 55 ºC At 60 ºC At 65 ºC At 70 ºC At 75 ºC
T(Sec) gel str.
(pa) T(Sec) gel str.
(pa) T(Sec)gel str.
(pa) T(Sec)gel str.
(pa) T(Sec) gel str.
(pa) 0 0 0 0 0 0 0 0 0 0 10 7 10 15 10 17 10 15 10 15 20 26 20 28 20 28 20 28 20 30 27 37 25 37 23 33 21 32 21 32 30 28 30 26 30 24 30 20 30 19 40 20 40 19 40 19 40 17 40 13 50 17 50 15 50 19 50 17 50 11 60 15 60 13 60 17 60 15 60 11 70 15 70 13 70 17 70 15 70 11 80 15 80 13 80 15 80 15 80 11 90 15 90 13 90 15 90 15 90 11
100 15 100 13 100 15 100 15 100 13 110 15 110 13 110 15 110 15 110 13 120 15 120 13 120 15 120 15 120 13 150 15 150 13 150 15 150 15 150 13 180 15 180 13 180 15 180 15 180 13 210 15 210 13 210 15 210 15 210 13 240 15 240 13 240 15 240 15 240 13 270 15 270 13 270 15 270 15 270 13 300 15 300 13 300 15 300 15 300 13 330 15 330 15 330 15 330 15 330 13 360 15 360 15 360 15 360 15 360 13
Ttemperature ºC Pour point 55 30 60 30 65 30 70 30 75 30
66

Group E
Without reheating Reheating one time Reheating two times T(Sec) gel str. (pa) T(Sec) gel str. (pa) T(Sec) gel str. (pa)
0 0 0 0 0 0 10 15 10 19 10 17 20 30 20 37 20 35 21 32 24 56 25 56 30 19 30 37 30 39 40 13 40 22 40 26 50 11 50 19 50 22 60 11 60 17 60 20 70 11 70 17 70 19 80 11 80 17 80 19 90 11 90 17 90 19
100 13 100 17 100 19 110 13 110 15 110 19 120 13 120 15 120 19 150 13 150 15 150 19 180 13 180 15 180 19 210 13 210 15 210 19 240 13 240 15 240 19 270 13 270 15 270 19 300 13 300 15 300 19 330 13 330 15 330 19 360 13 360 15 360 19
Reheating times Pour point 0 30 1 33 2 33
67

References

References
1. Davidson, M. R., Nguyen, Q. D., Chang, C., and Petter, H., “A model for
restart of a pipeline with compressible gelled waxy crude oil”, J. of Non-
Newtonian Fluid Mechanics, September 2004
2. Vinay, G., Wachs, A., and Agassant, J. F.,"Numerical simulation of weakly
compressible Bingham flows: The restart of pipeline flows of waxy crude
oils”, J. of Non-Newtonian Fluid Mechanics, March 2006
3. Herh, P. K.W., Mei, B. C., Roye, N., and Hedman, K., “Rheology of crude
oil at high pressure”, American laboratory, June 2003
4. Venkatesan, R., Nagarajan, N. R., Paso, K., Sastry, A.M., and Fogler, H.S.,
“The strength of paraffin gels formed under static and flow conditions,
Chemical Engineering Science”, February 2005
5. Prasad, R., “Petroleum Refining Technology”, Khanna Publishers, first
edition, march 2000
6. Szilas, A. P., “Production and Transport of oil and Gas”, Elsevier publishing
company Amsterdam – Oxford – New York, 1975
7. Smith, P. B., and Ramsden, M. J., “The prediction of oil gelation in
Submarine pipelines and the pressure required for restarting flow”,
European offshore Petroleum Conference & Exhibitation, October 1978
8. http://tigger.uic.edu/~mansoori/Wax.and.Waxy.Crude_html
9. Mukhopadhyay, A. K., “Conditioning process solves crude transport
problem”, pipeline Industry, June 1979
10. Horn, S., “Nile Blend Crude Oil Problems – Sudan”, Minton Treharne &
Davies Ltd
11. Sevetgoff, J., “Paraffin problems can be resolved with chemicals”, Oil &
Gas Journal, February 1984
12. Liddell, P. V., and Boger, “Yield stress measurements with the vane”, J. of
Non-Newtonian Fluid Mechanics, November 1995
68

13. Barnes, H. A., “The yield stress—a review or ‘лαντα ρει’—everything
flows?”, J. of Non-Newtonian Fluid Mechanics
14. Groffe, Groffe, Takhar and Andersen, “A wax inhibition solution to
problematic fields: A chemical remediation process”, petroleum science
and technology, 2001
15. Chang, C., Boger, D. V., and Nguyen, Q.D., “Influence of thermal history
on the waxy structure of statically cooled waxy crude oil”, SPE Journal,
June 2000
16. Russell, R. J., and Chapman, E. D., “The pumping of 85º F pour point
Assam (Nahorkatiay) crude oil at 65ºF”, Volume 57, Number 55, March
1971
17. Mendell, J. L. Jessen, F. W., “Paraffin inhibition and flow improvement in
crude oil system”, J. Can. Pet. Technol.,1972
18. Verma, L. K., Mukhdeo, “Effect of surfactants on pour point of crude oil”,
In 1st Nat. Con. Of Chem. Eng. Calcutta, Feb 21-23, 1986
19. El-Emam, Bayoumi, El-Gamal, and Abu-Zaid, “Choosing how to boost
waxy crude line flow depends on oils qualities”, Oil & Gas Journal, April
1993
20. ASTM, “D97 Standard Test Method for Pour Point of Petroleum Products”, January 1997
69