Embed Size (px)
Citation preview
FAILURE MECHANISMS IN UNIDIRECTIONAL COMPOSITES UNDER
TRANSVERSE AND LONGITUDINAL TENSION
A Dissertation
by
LINQI ZHUANG
Submitted to the Office of Graduate and Professional Studies of
Texas A&M University
in partial fulfillment of the requirements for the degree of
DOCTOR OF PHILOSOPHY
Chair of Committee, Ramesh Talreja
Committee Members, Vikram Kinra
J.N. Reddy
Anastasia Muliana
Head of Department, Rodney Bowersox
May 2018
Major Subject: Aerospace Engineering
Copyright 2018 Linqi Zhuang

ii
ABSTRACT
This dissertation deals with analysis of failure mechanisms in unidirectional
reinforced fiber composites under axial and transverse tensile loads. These two failure
modes are fundamental in governing the performance of composite materials in most
applications. In spite of many years of research in the mechanisms underlying these
failure modes, gaps in their understanding have remained. This dissertation attempts to
fill those gaps.
Two particular issues are addressed in the studies conducted here: 1) under
transverse tension, what is the process by which fiber/matrix debond cracks link up to
form transverse cracks, and 2) under longitudinal tension, how does a fracture plane
form? In the study, related to transverse tension, plausible mechanisms for transverse
crack formation are considered in two scenarios: Scenario 1 where a pre-existing single
fiber/matrix debond crack kinks out into the matrix and induces fiber/matrix debonding
at neighboring fibers, and Scenario 2 where multiple pre-existing debond cracks link up
by the debond growth and crack kink-out process. A 2-D finite element model consisting
of a circular region of matrix with a central fiber surrounded by six fibers in a hexagonal
pattern is used for the local stress analysis. The region is embedded in a homogenized
unidirectional composite of rectangular outer boundary. Energy release rates (ERRs) of
interface cracks and kinked-out cracks are calculated under applied tension normal to
fibers. Results show that Scenario 2 is more likely to lead to formation of a transverse
crack than Scenario 1. The study related to longitudinal tension considers a broken fiber

iii
as the nucleation site for formation of a plane whose unstable growth leads to failure. To
analyze the conditions for formation of this “critical fracture plane”, an axisymmetrical
finite element model is constructed with the broken fiber at the center surrounded by
intact fibers. Here, too, two scenarios are considered: one, where the broken fiber results
from the manufacturing process, and two, where a fiber fails at a weak point under
loading. In the first case, a matrix crack is found to initiate from the broken fiber end and
grow normal to the fiber axis, while in the second case, a matrix crack kinks out of an
assumed short fiber/matrix debond crack and grows out toward the neighboring fibers.
The studies conducted here provide valuable input into multiscale approaches
that link the local failure to global response of composite structures.

iv
ACKNOWLEDGEMENTS
It’s sad that my journey at Texas A&M University is coming to an end. There are
too many people I would like to thank. First of all, I would like to thank my Ph.D.
advisor Dr. Talreja for bringing me to the world of composites research and guiding me
step by step. It’s a truly life changing eight years. I would also like to thank Dr. Varna,
my Ph.D. advisor in Sweden for his detailed discussions, advice and even critics. I am
very fortunate to have not one but two of the best advisors in the world. Their
dedications to research and the standard they’ve set motivate me to become a better
version of myself every single day.
Thanks also go to Dr. Kinra for being my mentor at teaching fellow program and
sharing valuable teaching tricks and experience to me, and to Dr. Reddy, Dr. Muliana for
being my committee members and for their guidance and support throughout the course
of this research.
I would also like to thank the department faculty and staff, particularly Ms. Gail
Rowe and Ms. Karen Knabe, for helping me with many official formalities. I also want
to extend my thanks to all the friends I met here at Texas A&M University for making
my time at Texas A&M University a great experience
Finally, thanks to my mother, for bringing life to me and giving me the
opportunity to see this wonderful world, and to my father and my wife, for always
standing by me, throughout ups and downs. I would not be here without them. This
dissertation is for all my loved ones!

v
CONTRIBUTORS AND FUNDING SOURCES
This work was supervised by a dissertation committee consisting of Professor
Ramesh Talreja, Professors Vikram Kinra and J.N. Reddy of the Department of
Aerospace Engineering and Professor Anastasia Muliana of the Department of
Mechanical Engineering. All work for the dissertation was completed independently by
the student.
Graduate study was supported by graduate research assistantship from
Department of Aerospace Engineering and a teaching fellowship from Texas A&M
University.

vi
NOMENCLATURE
ERR Energy Release Rate
FE Finite Element
FFM Finite Fracture Mechanics
IFF Inter Fiber Failure
PEEK Polyether Ether Ketone
UD Composites Unidirectional Composites
VCCT Virtual Crack Closure Technique
XFEM Extended Finite Element Method

vii
TABLE OF CONTENTS
Page
ABSTRACT ....................................................................................................................... ii
ACKNOWLEDGEMENTS .............................................................................................. iv
CONTRIBUTORS AND FUNDING SOURCES ............................................................. v
NOMENCLATURE ......................................................................................................... vi
TABLE OF CONTENTS ................................................................................................. vii
LIST OF FIGURES .......................................................................................................... ix
LIST OF TABLES .......................................................................................................... xiii
1. INTRODUCTION ......................................................................................................... 1
1.1 Background ........................................................................................................ 1
1.1.1 Characteristics of continuous fiber reinforced polymer based composites.... 1
1.1.1.1 Fiber reinforcements ............................................................................. 1
1.1.1.2 Polymer matrices .................................................................................. 5
1.1.1.3 Fiber/matrix interface ........................................................................... 6
1.1.2 Failure modes of composites ......................................................................... 8
1.1.2.1 Literature review: Failure of unidirectional composites under
transverse tension ................................................................................................... 9
1.1.2.2 Literature review: Failure of unidirectional composites under
longitudinal tension .............................................................................................. 14
1.1.2.3 Urgent need to fully understand failure mechanisms in composites .. 18
1.2 Problem statement and objectives .................................................................... 19
1.3 Approaches ...................................................................................................... 20
1.4 Layout of the dissertation ................................................................................ 21
2. FAILURE MECHANISMS OF UD COMPOSITES UNDER TRANSVERSE
TENSION ........................................................................................................................ 23
2.1 Introduction ............................................................................................................ 23
2.2 Initiation of fiber/matrix interface debonding under transverse tension ................ 23
2.3 Transverse crack formation by linking of individual fiber/matrix debonds .......... 27
2.3.1 Scenario I: One pre-existing fiber/matrix debond........................................... 27
2.3.1.1 FE model description and validation ....................................................... 27
2.3.1.2 Debond growth along fiber/matrix interface ............................................ 31
viii
2.3.1.3 Crack kinking from fiber/matrix interface ............................................... 34
2.3.1.4 Matrix crack propagation and induces debonding in a nearby fiber ........ 40
2.3.1.5 Effects of thermal stresses ....................................................................... 43
2.3.2 Scenario II: Transverse crack formed by the link-up of nearby debonds ....... 46
2.3.2.1 Fiber/matrix interfacial debond growth with presence of a nearby
debond .................................................................................................................. 47
2.3.2.2 Crack kinking with the presence of a nearby debond .............................. 51
2.3.2.3 Effects of thermal stresses ....................................................................... 54
2.4 Summary ................................................................................................................ 57
3. FAILURE MECHANISMS OF UD COMPOSITES UNDER LONGITUDINAL
TENSION ........................................................................................................................ 59
3.1 Introduction ............................................................................................................ 59
3.2 Case I: Fiber breaks due to manufacturing process ............................................... 63
3.2.1 Finite element model descriptions .................................................................. 63
3.2.2 Matrix cracking ............................................................................................... 66
3.2.3 Neighboring fiber breakage ............................................................................ 75
3.3 Case II: Fiber breaks during loading ...................................................................... 80
3.3.1 FE model description ...................................................................................... 80
3.3.2 Matrix cracking ............................................................................................... 83
3.3.3 Neighboring fiber breakage ............................................................................ 88
3.4 Effects of thermal stresses ..................................................................................... 91
3.5 Summary ................................................................................................................ 95
4. CONCLUDING REMARKS AND RECOMMENDED FUTURE WORK .............. 98
4.1 Concluding remarks ............................................................................................... 98
4.2 Recommended future work .................................................................................. 103
REFERENCES .............................................................................................................. 106

ix
LIST OF FIGURES
Page
Figure 1.1 Schematic representation of carbon fiber structure (Figure reprinted from
[1]) ...................................................................................................................... 2
Figure 1.2 Table showing typical carbon fibers mechanical properties (Figure data
reprinted from [2]) .............................................................................................. 3
Figure 1.3 Table showing typical glass fibers mechanical properties (Figure data
reprinted from [7]) .............................................................................................. 4
Figure 1.4 Illustration of flaws a) inside a carbon fiber and b) at the carbon fiber
surface (Figure reprinted from [1]) ..................................................................... 5
Figure 1.5 Illustration of interphase region in Carbon/PEEK composites (Figure
reprinted from [11]) ............................................................................................ 8
Figure 1.6 Delamination induced by transverse cracking (Figure reprinted from [22]) .. 10
Figure 1.7 Microscopic feature of transverse crack (Figure reprinted from [30]) ........... 12
Figure 1.8 Illustration of single fiber composite subjected to transverse tension
(Figure reprinted from [45]) ............................................................................. 13
Figure 1.9 Fracture surface of a UD composite. (Figure reprinted from [54]) ................ 16
Figure 1.10 Illustration of “critical fracture plane” observed by X-ray tomography
(Figure reprinted from [67]) ............................................................................. 17
Figure 2.1 Illustration of cavitation and matrix cracking under a) equi-triaxial stress
state where star like matrix crack forms as a result of cavitation and b)
matrix crack resulting from cavitation grows perpendicular to dominant
principal stress direction. (Figure reprinted from [24]) .................................... 26
Figure 2.2 a) The fiber/matrix interfacial debonding model b) Illustration of FE mesh
near debond tip ................................................................................................. 30
Figure 2.3 Influence of near tip element size on ERRs .................................................... 30
Figure 2.4 Comparison of obtained ERR results for a single fiber composite with
numerical model in reference [40] .................................................................... 31
Figure 2.5 ERR of debond crack subjected to pure mechanical loading ......................... 32

x
Figure 2.6 Radial separation of the debond crack surfaces at different 𝜃 ........................ 33
Figure 2.7 Illustration of crack kinking model ................................................................. 35
Figure 2.8 Comparison of ERR between kinked crack and debond for IDn=0.15 .......... 37
Figure 2.9 Comparison of ERR between kinked crack and debond for IDn=0.35 .......... 38
Figure 2.10 Difference in Mode I ERR between kinked crack and debond .................... 38
Figure 2.11 𝜃d distributions based on experimental observation. (Figure reprinted
from [90]) .......................................................................................................... 39
Figure 2.12 Predicted matrix crack and radial stress along Fiber#1 interface.
(IDn=0.35, θ=40º) ............................................................................................. 41
Figure 2.13 Radial stress distribution along interface for Fiber#1 ................................... 42
Figure 2.14 Predicted matrix crack and radial stress along Fiber#1 interface.
(IDn=0.15, θ=35º) ............................................................................................. 42
Figure 2.15 Scenario I typed debond link-up process (Figure reprinted from [92]) ........ 43
Figure 2.16 Variation of ERRs of kinked crack for pure mechanical and thermo-
mechanical cases ............................................................................................... 45
Figure 2.17 Thermal stress 𝜎xx distribution in matrix material surrounding central
fiber after cooldown .......................................................................................... 46
Figure 2.18 Cooldown induced debonds in a close vicinity (Figure reprinted from
[95]) .................................................................................................................. 47
Figure 2.19 Illustration of the two debonds model .......................................................... 48
Figure 2.20 Comparison of GI of central debond between single debond and two-
debond case ....................................................................................................... 49
Figure 2.21 Comparison of GI of central debond between single debond and two-
debond case ....................................................................................................... 50
Figure 2.22 Illustration of 𝜃=60° situation. IDn=0.15 (radial stress in central fiber is
shown in this figure) ......................................................................................... 50
Figure 2.23 Debonds stay within interface (Figure reprinted from [31]) ......................... 51
Figure 2.24 Comparison of kinked crack and debond ERR for Case I (L=0.04rf) .......... 52

xi
Figure 2.25 Comparison of kinked crack and debond ERR for Case II (L=0.04rf) ......... 53
Figure 2.26 Effects of thermal stress on ERRs of the debond crack for Case I and
Case II ............................................................................................................... 56
Figure 2.27 Effects of thermal stress on ERRs of the kinked crack for Case I and Case
II ........................................................................................................................ 56
Figure 3.1 Illustration of relationship between laminate strength and UD plies
strength (Figure reprinted from [96]) ............................................................... 60
Figure 3.2 Characteristics of UD longitudinally tensile failure (Figure reprinted from
[62]) .................................................................................................................. 61
Figure 3.3 Illustration of simplified composite model ..................................................... 63
Figure 3.4 a) Illustration of numerical model for case I. F: fiber, M: matrix, C:
composite; b) Detail of near debond tip region mesh ....................................... 66
Figure 3.5 a) Distortional energy density distribution and b) Dilatational energy
density distribution ........................................................................................... 69
Figure 3.6 Variations of the maximum energy densities with the applied load ............... 71
Figure 3.7 Stress ratio between maximum principal stress and mean principal stress .... 73
Figure 3.8 Predicted matrix crack trajectory based on XFEM. The complete
axisymmetric model is shown in Figure 3.4 ..................................................... 74
Figure 3.9 Mean stress concentration factor in fibers neighboring a broken fiber at
different stages of matrix crack growth. For crack-tip locations a, b and c,
see Figure 3.8 .................................................................................................... 77
Figure 3.10 Illustration of the numerical model for Scenario II ...................................... 81
Figure 3.11 a) Matrix attached to pull-out fibers and b) Debond growth in one
direction from fiber break (Figure 3.11a reprinted from [123], Figure 3.11b
reprinted from [122]) ........................................................................................ 82
Figure 3.12 Description of potential kinked crack. F: Fiber, M: Matrix .......................... 84
Figure 3.13 Predicted kinking angle based on reference (Figure adapted from [87]) ...... 86
Figure 3.14 ERR of debond crack and kinked crack for at each debond crack length.
0.1% applied strain ........................................................................................... 87

xii
Figure 3.15 Superposition of predicted matrix crack path for different initial debond
length. F: Fiber, M: Matrix. .............................................................................. 88
Figure 3.16 Mean tensile SCF within stress enhancement region in neighboring fiber
when matrix crack propagates to neighboring fiber ......................................... 89
Figure 3.17 Effect of thermal stresses on matrix crack ERR for Case I .......................... 93
Figure 3.18 Effect of thermal stress on predicted kinking angle for Case II ................... 94
Figure 3.19 Variation of ERR of kinked crack for different initial debond cases under
thermo-mechanical loading for Case II ............................................................ 94

xiii
LIST OF TABLES
Page
Table 2.1 Thermo-elastic properties of constituents ........................................................ 31
Table 2.2 Effect of assumed kinked crack length L (𝜀x = 0.5%, IDn=0.35) .................... 36
Table 2.3 Mode I ERR for different kinked crack length (IDn=0.15) ............................. 54
Table 3.1 Thermo-elastic properties of constituents ........................................................ 66
Table 3.2 The enhanced probability of failure factor calculated over different fiber
regions at a reference applied strain of 0.6%. ................................................... 79
Table 3.3 Kink angles corresponding to maximum ERR for different debond lengths. .. 84
Table 3.4 The enhanced probability of failure factor F(σ) over two different fiber
regions for different initial debond lengths at the applied strain of 0.6%. ....... 90
Table 3.5 The enhanced probability of failure factor F(σ) over different fiber regions
for dl =10.0μm and applied strain of 0.6%. ...................................................... 90

1
1. INTRODUCTION
1.1 Background
1.1.1 Characteristics of continuous fiber reinforced polymer based composites
Composite materials are building blocks for a very broad range of industrial
applications. The word “composite” literally describes the characteristics of materials,
which are made up of at least two different constituents. In a composite material, more
stiffer constituents which are called reinforcements are often embedded in a more
compliant constituent called matrix. For reinforcements, they could be made of various
materials and in the form of continuous fibers, short fibers and particles. For matrices,
they are mostly made of polymers and metals. Because of numerous possible
arrangements of constituents, the failure of composites can be vastly complicated
compared to monolithic materials such as metals. To analyze the failure of composites,
we need to first have an understanding of their constituents. It should be noted that in the
following, unless mentioned otherwise, composite materials (or composites) refer to
continuous fiber reinforced polymer based composites.
1.1.1.1 Fiber reinforcements
Depending on the applications, many fiber reinforcements are available. Among
these, carbon fibers and glass fibers are extensively used in polymer-based composites
for a wide range of industrial applications such as in aerospace, wind energy and
automotive industries.

2
Carbon fiber usually consists of small crystallites of “turbostratic” graphite. The
representative structure of a carbon fiber is presented in Figure 1.1. For years, the use of
carbon fiber reinforced composites has been driven by the applications in aerospace,
automotive and sports goods industries. Recently, carbon fiber reinforced composites
have also seen their applications increasing in Wind energy industry as turbine blade size
continues to increase.
Figure 1.1 Schematic representation of carbon fiber structure (Figure reprinted
from [1])
Depending on the manufacturing process, there are two major types of carbon
fibers used. One is polyacrylonitrile (PAN) based fibers and the other is mesophase
pitch-based fibers. Both fibers were introduced back in the 1960s. Carbon fibers are
usually 4~8μm in diameters, and have much higher strength and modulus compared to

3
other typical fiber reinforcements such as glass fibers. Figure 1.2 shows the table
reprinted from [2] containing typical mechanical properties of carbon fibers.
Figure 1.2 Table showing typical carbon fibers mechanical properties (Figure data
reprinted from [2])
It should be noted that data presented in Figure 1.2 are mainly the mechanical
properties along fiber axis and carbon fibers are generally considered as transversely

4
isotropic. Compared to their longitudinal properties, it is more difficulty to test carbon
fiber transverse properties and obtained results vary significantly among different studies
[3-5]. Based on the available literature, the transverse modulus of carbon fibers is in the
range of 6GPa ~30GPa.
Most glass fibers are based on silica (SiO2) with additions of oxides of calcium,
boron, sodium, iron and aluminum [6]. Compared to carbon fibers, the diameters of glass
fibers are large, in a range of 10μm ~ 17μm for most of commercial ones [7]. In contrast
to carbon fibers, glass fibers are considered as isotropic and properties for most
commonly used glass fibers are presented in Figure 1.3.
Figure 1.3 Table showing typical glass fibers mechanical properties (Figure data
reprinted from [7])
Both carbon and glass fibers are essentially brittle. As a result, they do not have a
well-defined tensile strength as it depends on the presence of flaws (at surface or
internal) along fiber axis, as demonstrated in Figure 1.4 for carbon fibers. To account for
the flaws, the fiber strength is usually treated on a statistical basis. The statistical nature

5
of fiber strength is vital when it comes to analyzing the longitudinal failure of
composites, as will be discussed in Section 3.
a) b)
Figure 1.4 Illustration of flaws a) inside a carbon fiber and b) at the carbon fiber
surface (Figure reprinted from [1])
1.1.1.2 Polymer matrices
Two types of polymer matrices are widely adopted in applications. One is
thermosetting resins and the other is thermoplastics. The most common thermosetting
resins are epoxy, unsaturated polyester and vinyl ester. For thermosetting polymers,
cross-linking process transforms liquid resin into a hard solid and this is usually
6
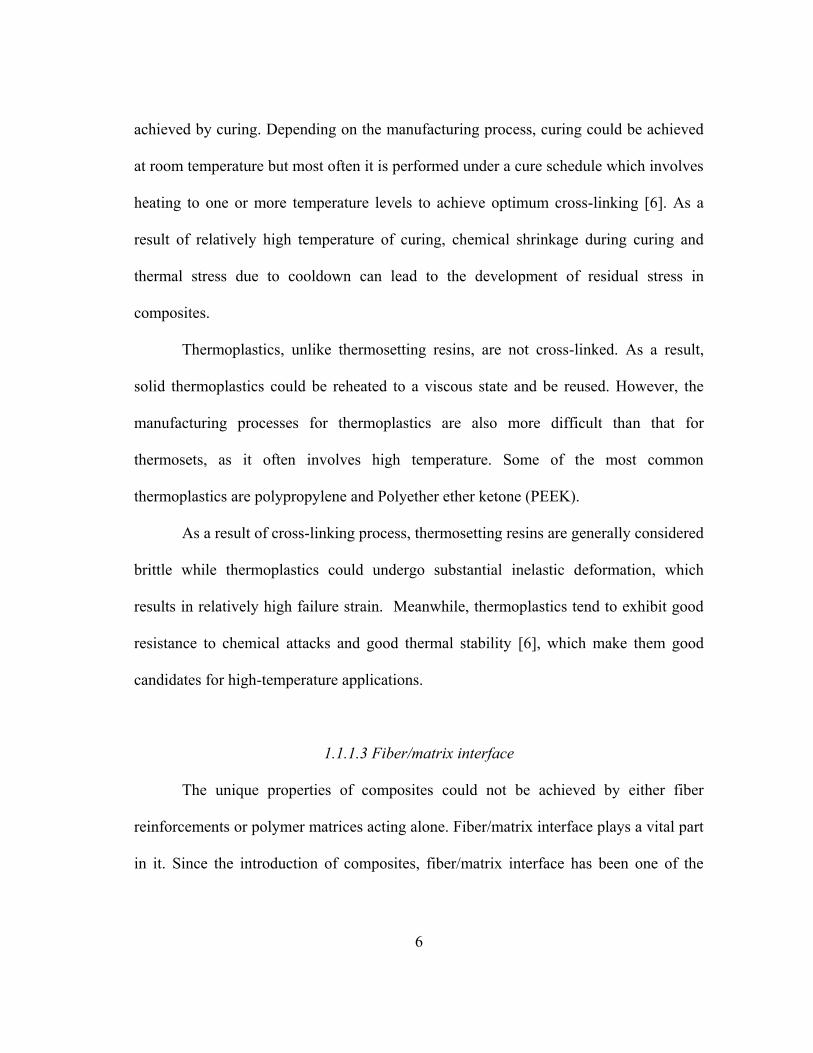
achieved by curing. Depending on the manufacturing process, curing could be achieved
at room temperature but most often it is performed under a cure schedule which involves
heating to one or more temperature levels to achieve optimum cross-linking [6]. As a
result of relatively high temperature of curing, chemical shrinkage during curing and
thermal stress due to cooldown can lead to the development of residual stress in
composites.
Thermoplastics, unlike thermosetting resins, are not cross-linked. As a result,
solid thermoplastics could be reheated to a viscous state and be reused. However, the
manufacturing processes for thermoplastics are also more difficult than that for
thermosets, as it often involves high temperature. Some of the most common
thermoplastics are polypropylene and Polyether ether ketone (PEEK).
As a result of cross-linking process, thermosetting resins are generally considered
brittle while thermoplastics could undergo substantial inelastic deformation, which
results in relatively high failure strain. Meanwhile, thermoplastics tend to exhibit good
resistance to chemical attacks and good thermal stability [6], which make them good
candidates for high-temperature applications.
1.1.1.3 Fiber/matrix interface
The unique properties of composites could not be achieved by either fiber
reinforcements or polymer matrices acting alone. Fiber/matrix interface plays a vital part
in it. Since the introduction of composites, fiber/matrix interface has been one of the

7
most investigated topics and yet it is still one of the most debatable areas in composites
research, from its exact definition to properties characterizations.
An interface is mostly understood as the common boundary between fibers and
matrix, bonding the constituents together for transfers of loads, and often considered to
have zero thickness or (volume) [8]. Such definition has been debated for years as to
whether interface is indeed zero thickness, or a three-dimensional region close to fiber/
matrix boundary with unique properties different from either fiber or matrix. According
to [8], a more proper term for such three-dimensional region should be “interphase” and
an interphase contains “ the surface of classical fiber-matrix contact as well as the region
of finite thickness therefrom of which chemical, physical and morphological features are
different from the bulk material. Imposed on this region are the processing conditions
which allow chemical reactions, residual stresses and volumetric changes to take place.”
An example of the interphase could be seen in Figure 1.5 where partial crystallization of
matrix occurs near the fibers.
Due to the existence of the interphase region, depending on the fiber/matrix
bonding qualities, composites can have fiber/matrix interface debonding, or interphase
failure. As a result, when it comes to the “interface strength”, it is still debatable whether
it should be counted as the amount of work to separate the fiber/matrix common surface
(bond) or to fail the interphase. Regarding the former, various experimental techniques
such as “fiber pull-out” test have been developed to calculated the interfacial bonding
strength. For more detailed reviews of corresponding techniques, readers are encouraged

8
to read [8, 9]. It is much more challenging to characterize the properties of interphase;
one of the few examples is in [10].
Figure 1.5 Illustration of interphase region in Carbon/PEEK composites (Figure
reprinted from [11])
1.1.2 Failure modes of composites
Based on the discussion above, it is clear that the structure of a fiber reinforced
composite has hierarchy: from macro-scale composite laminates to a much smaller scale
of interphase. As a result of such unique characteristics of composite materials, when
subjected to loading, multiple failure modes could occur simultaneously or sequentially
at different scales, which make it extremely challenging to analyze the failure of

9
composite materials. In the following sections, we will narrow our discussions on two
most commonly found failure modes within composites.
1.1.2.1 Literature review: Failure of unidirectional composites under transverse tension
When subjected to transverse tension, i.e., normal to the fiber axis, cracking
within the plies of a composite laminate, often referred to as matrix cracking or
transverse cracking, is inevitably the first failure event to occur. Although by itself
transverse cracking may not affect the performance of the laminate significantly, but as
shown in Figure 1.6, it could lead to the initiation of other failure modes, e.g.
delamination and fiber breakage, which can have detrimental effects on the load bearing
capability of the laminate. Therefore, understanding what governs the initiation and
evolution of cracking within the plies is of great interest. The early studies of this failure
mode, (e.g. [12-16] ),were focused on explaining the observed multiplication of the
matrix cracks by simple one-dimensional models. More rigorous mechanics treatments
of the evolution of the crack number density and its effects on laminate stiffness
reduction were developed later [17-20]. For a more comprehensive review on transverse
crack multiplication and stiffness degradation prediction, readers are encouraged to see
[21]. Common to all such analyses is the assumption of homogenized plies in which
cracks appear according to a strength or a fracture toughness based criterion, and then
multiplication of cracks occurs under increased loading when the local stresses between
the cracks satisfy a failure criterion.

10
Figure 1.6 Delamination induced by transverse cracking (Figure reprinted from
[22])
In recent years, the detailed process of matrix crack formation within the plies
has been examined by considering the local stress fields in the matrix between the fibers.
Among the earliest works in this direction were studies of the effect of tri-axiality in the
local stress field on cavitation in the matrix polymer [23]. Further studies of this
phenomenon led to the development of a dilatation energy density criterion for brittle
cracking in the matrix [24] and its predictions agreed well with experimental data [25].
Since the favorable locations for satisfaction of the criterion are points in the matrix
close to the fiber surfaces, it is reasonably assumed that the matrix failure leads to
debond cracks at the fiber/matrix interfaces. Other assumed criteria for the debond crack
initiation resort to fiber/matrix interface properties such as strength or fracture toughness
based on finite fracture mechanics [26], or a combination of these via a cohesive zone

11
model for single-fiber debonding [27] or multiple-fiber debonding [28]. The interface
properties in a cohesive zone model cannot be found independently and must be inferred
or calibrated. It is worth noting that the inferred interface properties depend on the stress
state on the fiber/matrix interface at incipient failure. A comprehensive review of various
methods to infer the interfacial strength has been given in [29].
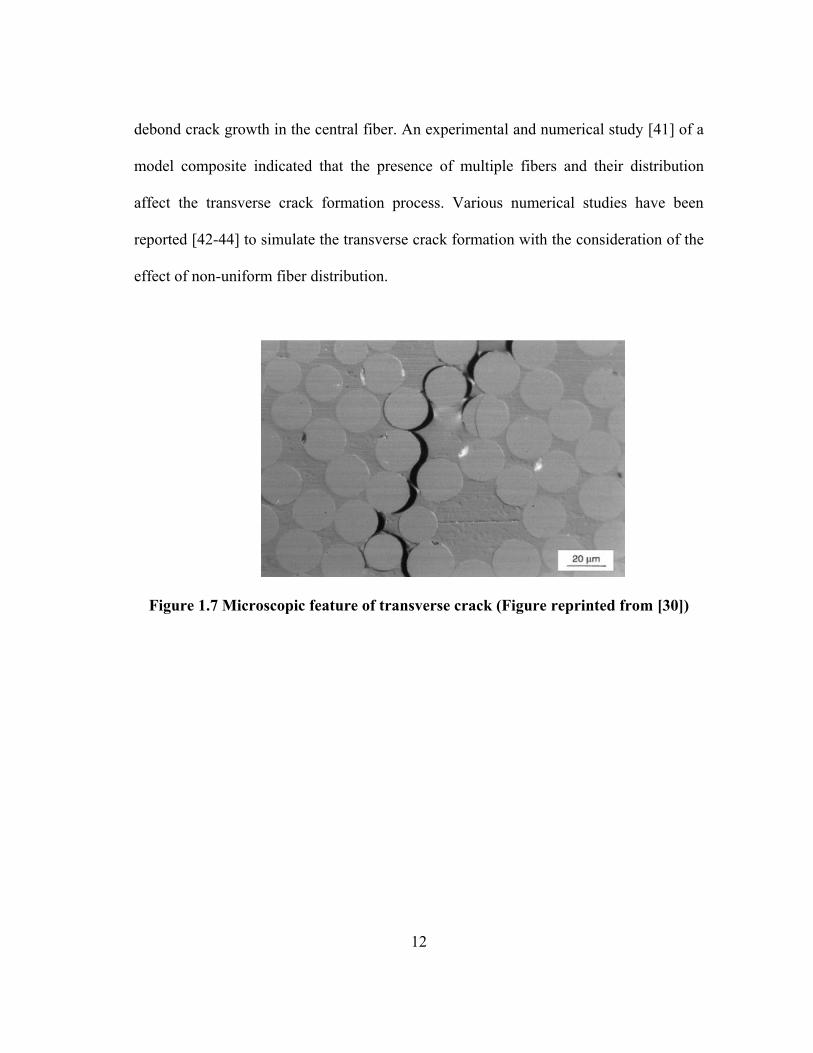
Experimental observations [30, 31], such as the one shown in Figure 1.7, suggest
that the individual fiber/matrix debond cracks connect through the matrix to form
transverse cracks. The results obtained in these studies do not provide sufficient details
of the mechanisms by which the debond cracks connect. Since in situ observations are
difficult to make other than perhaps for model composites, numerous studies have
attempted to understand the governing conditions underlying the mechanisms involved
by analysis. For this, single fiber composite is widely adopted due to its relative
simplicity. Figure 1.8 shows the general set-up of a single fiber composite subjected to
transverse tension where a single fiber is placed at the center of a matrix material, and
the whole specimen is subjected to transverse tension. For fiber/matrix interfacial
debond growth, a single-fiber composite has been considered in an analytical study [32]
and in numerous numerical studies (e.g. [33-38]). The kinking out of a debond crack has
also been studied in a single-fiber model [39]. Recognizing the importance of the
presence of neighboring fibers on the debonding and crack kinking process, later studies
considered a two-fiber model [40] and found that the presence of a nearby fiber
accelerates the initiation of debond crack growth in the central fiber only when it is
aligned with the external loading direction, and for the rest of positions, it inhibits the
12
debond crack growth in the central fiber. An experimental and numerical study [41] of a
model composite indicated that the presence of multiple fibers and their distribution
affect the transverse crack formation process. Various numerical studies have been
reported [42-44] to simulate the transverse crack formation with the consideration of the
effect of non-uniform fiber distribution.
Figure 1.7 Microscopic feature of transverse crack (Figure reprinted from [30])

13
Figure 1.8 Illustration of single fiber composite subjected to transverse tension
(Figure reprinted from [45])
Despite the fact that transverse cracking has been investigated by numerous
researchers, it needs to be noted that none of these studies, however, explicitly analysed
the debond crack linking mechanism in the transverse crack formation process. Clearly,
the linking of the fiber/matrix debond cracks must play a key role in the transverse crack
formation process. Without understanding this role, the effects of fiber volume fraction
and fiber clustering in non-uniform fiber distribution on the composite transverse
strength cannot be explained. To understand the debond crack linking process, the
conditions governing the kinking out of a debond crack must be clarified.

14
1.1.2.2 Literature review: Failure of unidirectional composites under longitudinal
tension
When a composite is subjected to longitudinal tension, final failure is governed
by the failure of unidirectional (UD) plies aligned along the loading direction. Such
failure usually starts with an individual fiber breaking at its weakest location, leading to
the stress redistribution along fiber axis as well as stress enhancement in nearby intact
fibers. With the further increase of applied load or load cycles, more fibers break, along
with other forms of damage such as fiber/matrix debonding and matrix cracking. Final
failure of such plies occurs when the so-called “critical fracture plane” is formed and its
unstable growth leads to the separation of the entire composite.
Due to the statistical nature of the fiber breakage process, numerous statistical
models have been proposed in order to predict the final failure of composites. Among all
the models, the majority of them assume only fibers carry the axial loads and a UD
composite fails when certain number of fibers are broken.
The first comprehensive analytical model to predict the tensile failure of a UD
composite was developed by Rosen [46]. In his model, the axial loads are assumed to be
carried by fibers only, and the extra load caused by the fiber breakage is shared by rest
of the fibers in a cross-section. The strength of the fibers is assumed to follow Weibull
distribution. Based on the “weakest link” theory that assumes a fiber fails when the local
stress exceeds its lowest strength value, the composite failure occurs when a cross-
section fails. Zweben [47], Zweben and Rosen [48] later proposed a statistical model
based on the accumulative weakening of fibers that included the stress concentration.

15
The basis of their model lies on the argument that the breakage of a single fiber will
cause stress concentration in the nearest fibers in a 2-D fiber array, which will then
increase the probability of failure of the nearest two fibers, and the breakage of these
fibers will subsequently cause a higher stress concentration in the surrounding fibers
which will further increase the probability of failure of those fibers. The final failure of a
composite is assumed to occur when a first multi-fractured group of fibers is formed. A
few years later, Harlow and Phoenix [49, 50] also developed their own statistical model
to predict the failure of UD composites. It should be noted that, until now, the analytical
models we have discussed are all considered as the “chain of bundles” models, that is
each fiber is considered as one chain within a bundle, and the weakest fiber fails first,
the composite then fails when the fiber bundle fails. The “chain of bundles” model
constitutes majority of the early years’ models to predict the final failure of a UD
composite until Batdorf [51] proposed his model concentrating on the formation and
growth of multiple fiber fractures. In his work, Batdorf also adopted weakest link theory
to predict the isolated single fiber breakage (singlet), double fractures (doublet) and
multiple fractures (multiplets) with respect to increasing applied load. A UD composite
is considered to fail when a Griffith-type instability occurs that corresponds to a certain
number of broken fibers at the same location. This approach significantly simplifies the
procedures in previous “chain of bundles” models and he and his co-worker [52] as well
as others [53] found that the number of broken fibers at the same location causing
instability most often varies from 6-14 fibers. This prediction was supported by the
fractography investigation by Purslow [54], who found that the number of broken fibers

16
within a bundle in the fracture surface of a UD composite fell within that range of
numbers, as shown in Figure 1.9. Besides the analytical models discussed, numerous
numerical models were also developed to predict the failure of UD composite with focus
on fiber fractures, for example, in [55-61]. These models, although agreeing relatively
well with the experimentally obtained failure strain of a UD composite, are all focused
only on the fiber breakages, which do not capture the exact failure mechanism of the UD
composite.
Figure 1.9 Fracture surface of a UD composite. (Figure reprinted from [54])

17
Recently, with the help of X-ray tomography technique [62-68], we have gotten
more insights on the longitudinal failure of UD composites, especially the characteristics
of the “critical fracture plane”. Take the experimental work conducted by Garcea et al
[67] for example. As shown in Figure 1.10, the fracture plane contains clusters of broken
fibers and a closer look at these two figures reveals that the fracture plane is not strictly
planar and broken fibers are in fact connected by the means of fiber/matrix interface
debonding and matrix cracking. This important feature could not be captured by the
models discussed above as interface debonding and matrix cracking are both ignored in
the development of the models. Despite the direct experimental findings concerning the
role of fiber/matrix debonding and matrix cracking in the formation of “critical fracture
plane” and how do these affect the failure process of composites under longitudinal
tension remains unclear.
Figure 1.10 Illustration of “critical fracture plane” observed by X-ray tomography
(Figure reprinted from [67])

18
1.1.2.3 Urgent need to fully understand failure mechanisms in composites
Numerous studies cited above have contributed to our understanding of the
failure in composites. However, despite the progress made, it is noteworthy that too
often the failure models have focused on “matching” the predicted failure strain or stress
with experimental data without addressing the underlining failure mechanisms. This
approach has limited use and can lead to unreliable predictions.
To begin with, it is much easier to adjust the input parameters in failure modeling
to match the selected experimental results than to have fixed material values that are
obtained from independent tests. The risk in adjustable parameters is that the model
predictions can become significantly off outside the range in which the parameters were
fixed. Interestingly, this issue was also discussed in a recent blog published on the
website of European FibreMOD program [69] where the author called to “stop the
hypocrisy of nicely matching experimental validations”. Based on his previous work
[66], Swolfs concluded that although the model predicted the failure load reasonable
well, the internal damage development was severely off, which hampers the predictive
capability of the model. Therefore, the input parameters entering a model should be
those that govern the failure process and they should be identified at the outset of the
modeling effort. Clearly, this cannot be done without the proper understanding on the
failure mechanisms.
Knowing the failure mechanisms also has positive impact on designing structures
for industrial applications. Currently, most composite component designs are overly
conservative. Take wind turbine blades as an example. Here, inter-fiber failure (IFF) is

19
usually considered as the first failure event within composites. The presence of IFF
would lead to stiffness degradation as well as subsequent failures such as delamination.
From a structural point of view, delamination is more severe than IFF for the integrity of
the composite structure. As a result, it is important to evaluate the tendency for
delamination after IFF occurs, which requires understanding of IFF related failure
mechanisms for the particular blade composite layups. Once these failure mechanisms
are known, the designer needs only to apply needed reinforcement to the IFF hotspot
region where IFF causes high tendency for delamination rather than reinforce the entire
structure. This procedure is a major improvement towards optimizing the composite
material usages in blade design and thus makes wind turbine blade design more cost-
effective.
1.2 Problem statement and objectives
Based on the discussions in the previous sections, there should be no doubt that
proper understanding of composite failure mechanisms is vital for failure model
development as well as for improved industrial applications.
In this dissertation, plausible failure mechanisms in UD composites under
transverse and longitudinal tension are investigated. Realizing the gap in current
understanding of the mechanisms related to the transverse tension case, we will
specifically study the link-up process of individual fiber/matrix debonds. Similarly, for
the longitudinal tension case, we will investigate the mechanisms for the “critical
20
fracture plane” formation with focus on the role of fiber/matrix debonding and matrix
cracking.
The specific objectives of present dissertation research are:
1. To analyze the individual debond crack link-up process under transverse
tension and to identify the most important material parameters governing the
transverse failure process;
2. To clarify the roles of fiber/matrix interface debonding and matrix cracking
in the failure process under longitudinal tension in order to help explain the
observed discrepancy between the predictions of existing failure models and
experimental observations.
1.3 Approaches
In the present dissertation research, the failure mechanisms of UD composites
under transverse tension are investigated by Finite Element (FE) analysis. In the FE
model, Energy Release Rate (ERR) is considered as the driving force for fiber/matrix
interface debonding as well as debond crack kinking and is calculated through Virtual
Crack Closure Technique (VCCT). The VCCT was first proposed by Rybicki in [70] and
was then adopted in various FE codes to enable the mode separation calculation. Readers
can refer to [71, 72] for complete reviews of VCCT and its implementation in
commercial software.
The failure mechanisms under longitudinal tension are also studied by FE
analysis. In the FE model, the competition between matrix cracking and fiber/matrix

21
debonding from fiber break is evaluated. To account for the potential debond crack
kinking, ERR of kinked crack is calculated based on VCCT and kinked crack
propagation is simulated through Extended Finite Element Model (XFEM), which is FE
method to model crack propagation without remeshing as originally proposed in [73].
Finally, the effect of the neighboring fiber breakages on the longitudinal failure is
discussed based on a statistical model accounting for the statistical distribution of fiber
strength.
1.4 Layout of the dissertation
In this section (Section 1), the characteristics of fiber reinforced polymer based
composites have been discussed for a general reader not familiar with this material
system. The literature related to the two specific failure modes was reviewed to give the
current state of understanding of this field and to point out the important issues
remaining to be addressed. Following that, we presented the problems to be investigated
in the current dissertation and outlined the approaches to address the problems.
In Section 2, the obtained results concerning failure mechanisms under transverse
tension are presented. Most of the discussion is based on the published work by the
author in 2018 [74]. In this section, two plausible debond crack link-up scenarios are
investigated. For each scenario, inter-fiber distance is varied in order to assess the effects
of neighboring fibers on investigated debond link-up scenarios. Experimental results
from existing literature are also considered to evaluate the obtained results.
22
Section 3 discusses the failure mechanisms of UD composites under longitudinal
tension. Most of the discussion is based on the published work by the author in 2016
[75]. Results presented in this section clarify the roles of fiber/matrix interface
debonding and matrix cracking on the failure process, the two important aspects that are
often ignored in the literature.
In the final section (Section 4), major conclusions from the dissertation research
are presented and recommendations for future research are made.

23
2. FAILURE MECHANISMS OF UD COMPOSITES UNDER TRANSVERSE
TENSION*
2.1 Introduction
As discussed in Section 1, the microscopic observations reveal that the macro-
sized transverse crack is indeed formed by the link-up of individual fiber/matrix
interfacial debonds, which is not well understood and often overlooked. As a result, in
this section, we will try to clarify the failure mechanisms of UD composites under
transverse tension with focus on investigating the link-up process of individual debonds.
Two most likely link-up scenarios are discussed: 1. where one fiber is debonded and
subsequent debond growth and kink-out induces debonding of a nearby fiber, and 2.
where multiple debonds are present in close vicinity and the linking between each other.
To achieve completeness, a brief discussion on the initiation of fiber/matrix interfacial
debonding is also presented based on the reported literature results.
2.2 Initiation of fiber/matrix interface debonding under transverse tension
For composites, it is well recognized that fiber/matrix interface plays an
important role in the overall transverse failure process. Numerous research efforts have
been devoted in order to clarify the exact mechanism for the initiation of fiber/matrix
*Part of this section is reprinted with permission from Zhuang, L., R. Talreja, and J.
Varna, “Transverse crack formation in unidirectional composites by linking of
fibre/matrix debond cracks”. Composites Part A: Applied Science and Manufacturing,
2018. 107: p. 294-303. Copyright 2018 by Elsevier.
24
debonding, apart from the obvious poorly bonded fiber/matrix interface during
manufacturing process. As one of the most logical starting points, the fiber/matrix
interface strength has always been a focus by various studies. The approach assumes that
fiber/matrix interface debonding initiates when the local stress at a point of fiber/matrix
interface exceeds its strength. HobbieBrunken et al. [76] conducted both experimental
and numerical analysis and concluded that fiber/matrix interfacial normal strength
governs failure under transverse tension and provide its measurement based on in-situ
observation of damage initiation in 90° plies of a cross-ply laminate. Besides strength-
based approach, another typical way to study this issue is by using Finite Fracture
Mechanics (FFM) where the initiation of fiber/matrix interfacial debonding is governed
by a stress and energy criterion. Some of the FFM examples could be found in [26, 77].
With the development of computational techniques, Cohesive Zone Modelling (e.g [78,
79]) becomes a popular FE tool to investigate the onset of interfacial debonding where
the debonding process is modelled as the separation of elements when the stress and
energy criterions are both met.
Based on the discussion above, one would expect the improvement on
fiber/matrix interfacial properties should be the key to increase transverse strain to
failure of a UD composite, as the strength and fracture toughness of fiber/matrix
interface both improve. However, it is proven that the transverse failure strain of a UD
composite remains low and often in a range of 0.4% ~ 0.6% regardless of the
improvement of fiber/matrix interfacial properties. Such results indicate that approaches

25
discussed above might not properly capture the actual mechanism of fiber/matrix
interface debonding in a composite material.
In 1995, Asp et al.[23] conducted an poker-chip test on typical epoxy matrix
materials and found that the strain to failure of epoxy under poker-chip test (equi-triaxial
tension) was much lower (0.5% ~0.8%) than that under uniaxial tension (1.8% ~7%).
They suggested that micro-cavitation is the main mechanism for epoxy failure at lower
strain level under equi-triaxial loading. For fiber reinforced composites, because of the
constraint of stiffer fibers, the stress state near fiber/matrix interface is always triaxial
regardless of the loading. As a result, Asp et al. [24] further postulated that under equi-
triaxial or nearly equi-triaxial stress state, cavitation occurs when the critical value of
dilatational energy density exceeds and results in the initiation of matrix crack, as shown
in Figure 2.1. The same authors further applied this critical dilatational energy density
criterion for prediction of transverse failure in a glass-fiber UD composite [25] and
achieved good agreement with experimental results. In this scenario, fiber/matrix
interface debonds as a result of unstable growth of nearby cavitation induced matrix
cracks into interface.

26
Figure 2.1 Illustration of cavitation and matrix cracking under a) equi-triaxial
stress state where star like matrix crack forms as a result of cavitation and b)
matrix crack resulting from cavitation grows perpendicular to dominant principal
stress direction. (Figure reprinted from [24])
The idea of cavitation induced matrix cracking has gain more and more
recognitions within composites research community in recent years and is further
supported by a most recent work in [80] where the authors found tri-axial stress state
governs epoxy cavitation using Molecular Dynamic (MD) simulation. However, it
should be noted that cavitation induced matrix cracking still represents a particular
scenario in composites and no experiment has confirmed this postulation due to obvious
difficulty to conduct experiment under such small scale. As a result, it’s fair to conclude
that the exact mechanism for fiber/matrix interface debonding onset is still up to debate
and we will leave it here and proceed to discuss the link-up of individual debonds in the
following section.

27
2.3 Transverse crack formation by linking of individual fiber/matrix debonds
2.3.1 Scenario I: One pre-existing fiber/matrix debond
2.3.1.1 FE model description and validation
The finite element (FE) model adopted in this study is shown in Figure 2.2a. Due
to the symmetry, only half of the region is shown. As seen in the figure, the central fiber
is debonded on one side with the center of the arc-shaped debond crack lying on the
horizontal tensile load axis. The debonded fiber is surrounded by six fibers placed in a
hexagonal pattern. The circular region of seven-fiber assembly is embedded in a
homogenized composite of rectangular outer boundary. The homogenized composite in a
FE model is of importance as Pupurs and Varna [81] found that the ignorance of it
would lead to significant errors in ERR calculation of debond under longitudinal tension.
The distance between the surfaces of the central fiber and the neighbouring fibers,
denoted ID, is varied in order to study the effects of inter-fiber spacing. The fiber radius
rf = 4μm and the radius RMO of circular matrix region (Figure 2.2a) are chosen such that
the fiber volume fraction Vf within this region equals to the global fiber volume fraction
of the composite. The half-height and the width of the model are chosen as H=20×RMO
and W=40×RMO, respectively, beyond which the calculated ERR of the debond crack is
taken not to be affected by the size of the model.
As shown in Figure 2.2a, the x-displacement is applied uniformly to the right
edge (x = W) of the model, while it is constrained on the left edge, to induce the strain εx
= 0.5%. 2-D quadratic plane strain elements (PLANE 183) were adopted in the FE
model and in addition to that, contact elements were generated on the debond surface in

28
ANSYS. For the FE models adopted in the present study, each one has around 200,000 ~
260,000 elements generated. The ERR is calculated by the virtual crack closure
technique (VCCT) using the ANSYS FE software [82]. It has been well documented that
for an interface crack between two dissimilar materials (here: debond), Mode I and
Mode II components of the ERR are not well defined [71, 83-85]. As a result, the
calculated ERR modes here depend on the size of the near tip element. Figure 2.2b
shows the typical mesh near debond tip adopted in the current study where uniform
quadrilateral element were generated ahead and behind the debond tip. The size of the
near tip element is 𝑟𝑓 ∙ 𝑑𝜃. In the present study, the dependence of obtained ERR on
element near tip element size was investigated and obtained normalized ERR (ERR / G0)
results for debond angle 𝜃=10° are shown in Figure 2.3. For full expression of G0,
readers can refer to [40]. From Figure 2.3 it is shown that GI and GII tend to converge as
element size decreases, similar finding has also been reported in [83]. As element size
increases, the obtained ERRs becomes more constant. As a result, in the present study,
the element size of 𝑑𝜃 = 0.5° was selected. To validate the present FE model, the
obtained ERR results based on this element size is compared with ERR results
calculated by Boundary Element Method (BEM) in [40] for a single glass-fiber
composite case. To simulate the single fiber case, the four fibers surrounding central
fiber, as well as the effective composite were replaced with matrix properties. The
comparison results are shown in Figure 2.4, the obtained ERR was normalized with G0
(3.38J/m2) to be consistent with results shown in [40]. As displayed in Figure 2.4, the

29
ERR obtained by current model agrees well with the one obtained by BEM, which
validates the accuracy of present FE model.
The material system used in the present study is carbon fibers in an epoxy matrix
with volume fraction Vf =0.6. The elastic material properties for each constituent are
displayed in Table 2.1. The transverse properties of carbon fiber were estimated based
on the discussions in [3-5]. In order to generate a preferred failure initiation site in the
composite, two different values of the inter-fiber spacing were chosen as: IDn (ID/rf)
=0.15 and IDn=0.35 (as a reference, the inter-fiber spacing in a uniform hexagonally
packed UD composite of Vf =0.6 is IDn≈0.48), which could be consider as a local
cluster of fibers where the interactions between fibers are significant. For Scenario I, we
first investigated the pure mechanical loading case for generality followed by a
discussion on thermal stresses effect.
a)

30
b)
Figure 2.2 a) The fiber/matrix interfacial debonding model b) Illustration of FE
mesh near debond tip
Figure 2.3 Influence of near tip element size on ERRs

31
Figure 2.4 Comparison of obtained ERR results for a single fiber composite with
numerical model in reference [40]
Table 2.1 Thermo-elastic properties of constituents
2.3.1.2 Debond growth along fiber/matrix interface
Once debond initiates, the debond growth along fiber/matrix interface was
studied in the present section. Results for the two cases of IDn = 0.15 and 0.35 under
pure mechanical loading εx = 0.5% are shown in Figure 2.5. As displayed in Figure 2.5,
Material E1
(GPa)
E2
(GPa)
υ12 G12
(GPa)
υ23 α1
(1/°c)
α2
(1/°c)
CF 500 30 0.2 20 0.45 -1∙10-6 7.8∙10-6
Epoxy 3.5 3.5 0.4 1.25 0.4 60∙10-6 60∙10-6
CF/EP
(Vf=0.6)
301.4 11.04 0.27 4.06 0.54 0.66∙10-6 35.85∙10-6
32
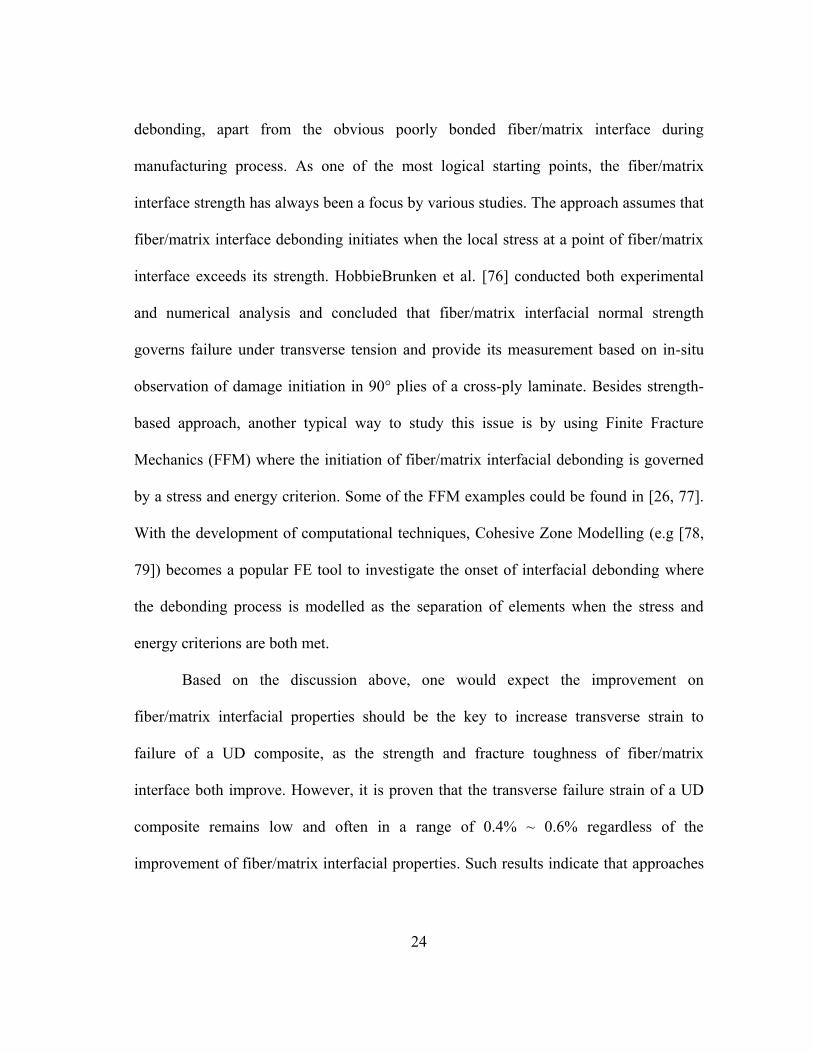
all ERR of the debond crack are lower at closer inter-fiber spacing as a result of
constraint effect of neighbouring fibers (see details in author’s previous work in [86]).
For both cases, the debond growth is in mixed-mode. Both Mode I ERR component (GI)
and Mode II ERR component (GII) increase first and then decrease with increasing
debond angle θ, and the same trend results for total ERR GT (GT = GI + GII). When
debond crack grows to an angle θ ≈ 70º, a finite contact zone is detected between two
debond surfaces and GI diminishes while GII remains high. This angle is of interest with
regard to the kinking of the debond crack, as suggested by the experimental observations
[87] of debonding on the free surface and numerical computations[39] for a single-fiber
composite. Based on these studies, it is reasonable to assume that even though the Mode
II ERR is high beyond θ ≈ 70º, the debond growth on the fiber surface is governed by the
Mode I ERR and would therefore cease at this angle.
Figure 2.5 ERR of debond crack subjected to pure mechanical loading
33
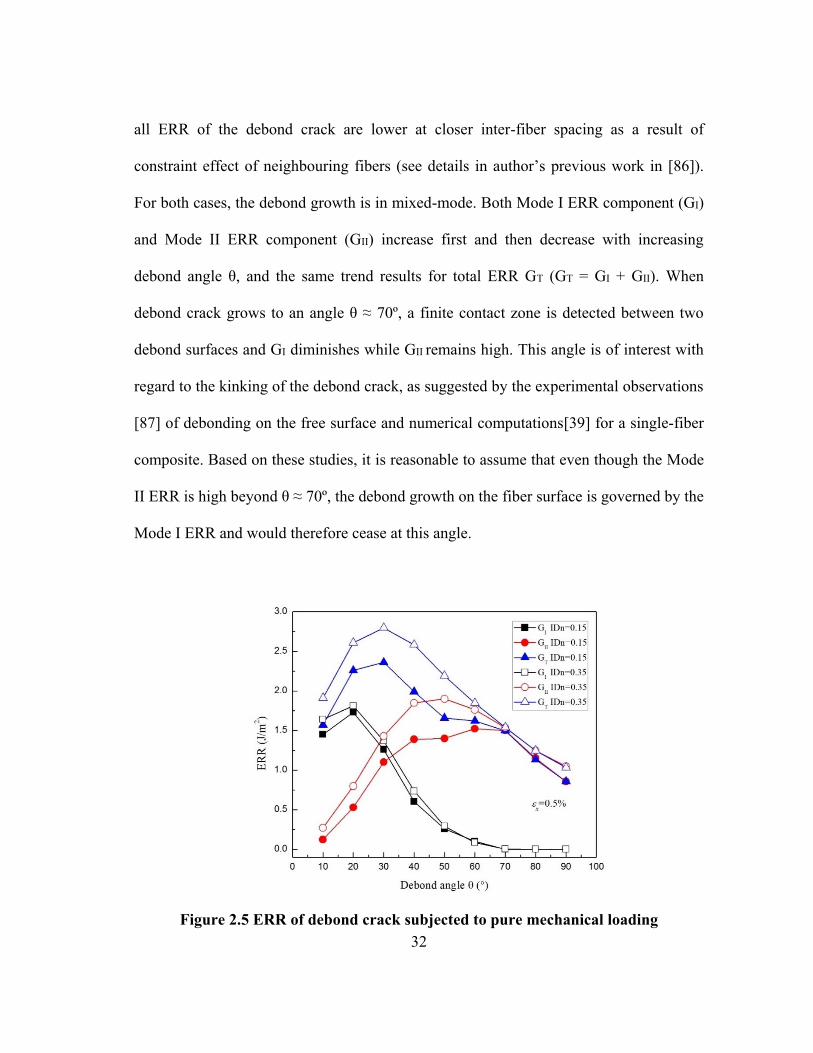
To further explain the observed ERR behaviors, the relative radial displacement,
i.e., radial separation, of the two debond surfaces, is shown in Figure 2.6 for different
debond arc angles at IDn=0.15. As seen in the figure, for larger angles (𝜃>30°), the
radial surface separation towards the debond crack tip decreases, indicating a closing
action. At 𝜃=70°, the debond surfaces come clearly into contact and beyond this angle
the contact zone increases with increasing debond angle. These results further support
the ERR based inference, stated above, that beyond 𝜃 ≈ 70º the debond crack is not
likely to grow.
Figure 2.6 Radial separation of the debond crack surfaces at different 𝜃
34
2.3.1.3 Crack kinking from fiber/matrix interface
In the previous section we have discussed the debond growth along fiber/matrix
interface. However, debonds by itself would not form a macro-sized transverse crack. As
found by numerous experimental studies such as [30, 31], the macro-sized transverse
crack is formed by the coalesce of individual debonds through matrix cracking. As a
result, in this section, we will discuss the potential debond crack kinking towards matrix
from fiber/matrix interface.
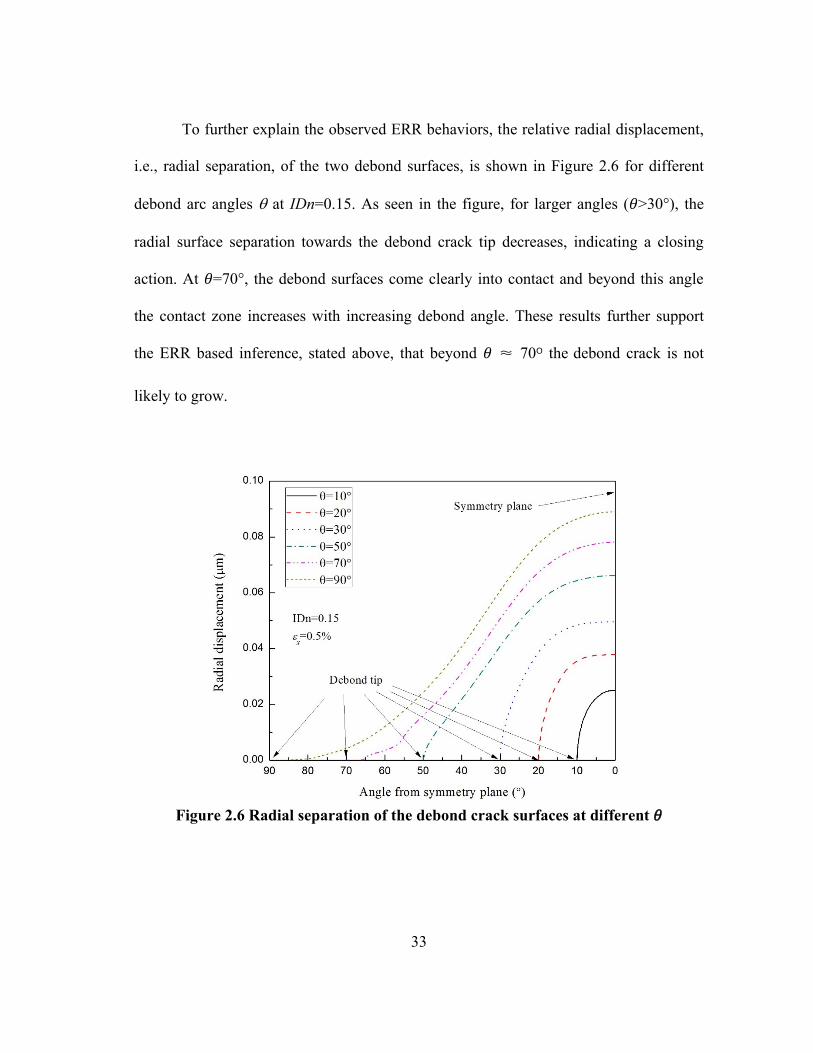
Figure 2.7 illustrates the FE model used to investigate the potential debond crack
kinking. For interface crack between two dissimilar material, He and Hutchinson [88]
suggested that the interface crack tends to kink towards more compliant material, which
is the matrix in the present study. The condition for kinking, however, depends on the
resistance for either debond growth or debond kinking or the available driving force for
either case. As a result, in this section, ERR for both kinked crack and debond will be
discussed as the driving force for debond kinking and growth, respectively. The
geometry indicated in Figure 2.7 is the same as in Figure 2.2a. For each debond angle θ,
a kinked crack of length L=0.04rf is assumed to emanate from debond tip and grow
towards matrix in an angle θk with respect to the horizontal axis of the model. The
kinking angle θk is determined based on the maximum energy release rate criteria: i.e.
crack is assumed to kink out of interface in a direction that maximizes the ERR of
kinked crack. As discussed by He and Hutchinson [88], the selection of initial kinked
crack length is of great importance: too small of a selection would result in strong
oscillation on obtained ERR. As a result, a case study on the influence of chosen kinked

35
crack length on obtained ERR in present model was conduct for IDn =0.35 and results
are shown in Table 2.2. For the crack lengths considered in Table 2.2, there is only a
small variation on the obtained ERR, more importantly, the trend for predicting ERR
remains the same, as well as the predicting kinking angle. As a result, given the need for
easier FE model meshing, larger kinked crack length L=0.04rf is adopted in the present
study to investigate the crack kinking. In the present study, no contact element was
applied to the kinked crack surfaces as: 1. earlier study by Whitcomb [89] found that
total energy release rate obtained from non-contact analysis agrees well with that of
contact analysis when the crack tip surfaces are in contact and 2. it was found that there
is no contact between kinked crack surfaces in all cases investigated. A convergence
study was performed before obtaining any ERR results.
Figure 2.7 Illustration of crack kinking model

36
Table 2.2 Effect of assumed kinked crack length L (𝜀x = 0.5%, IDn=0.35)
𝜃 (°) GT (J/m2)
L=0.005rf L=0.01rf L=0.02rf L=0.04rf
20 3.9585 3.8434 3.7376 3.6644
30 4.9977 4.8055 4.5855 4.3292
40 5.2257 5.0566 4.8227 4.4803
50 4.7229 4.6329 4.4868 4.1983
60 4.0498 4.0028 3.9335 3.7628
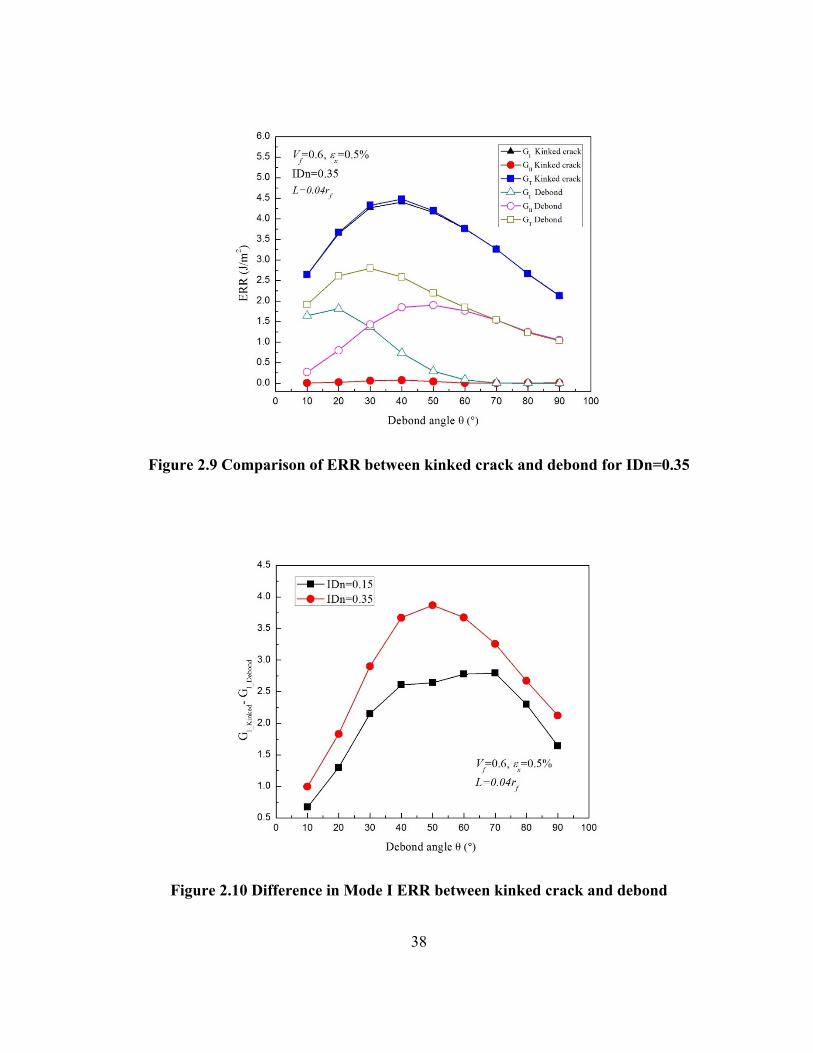
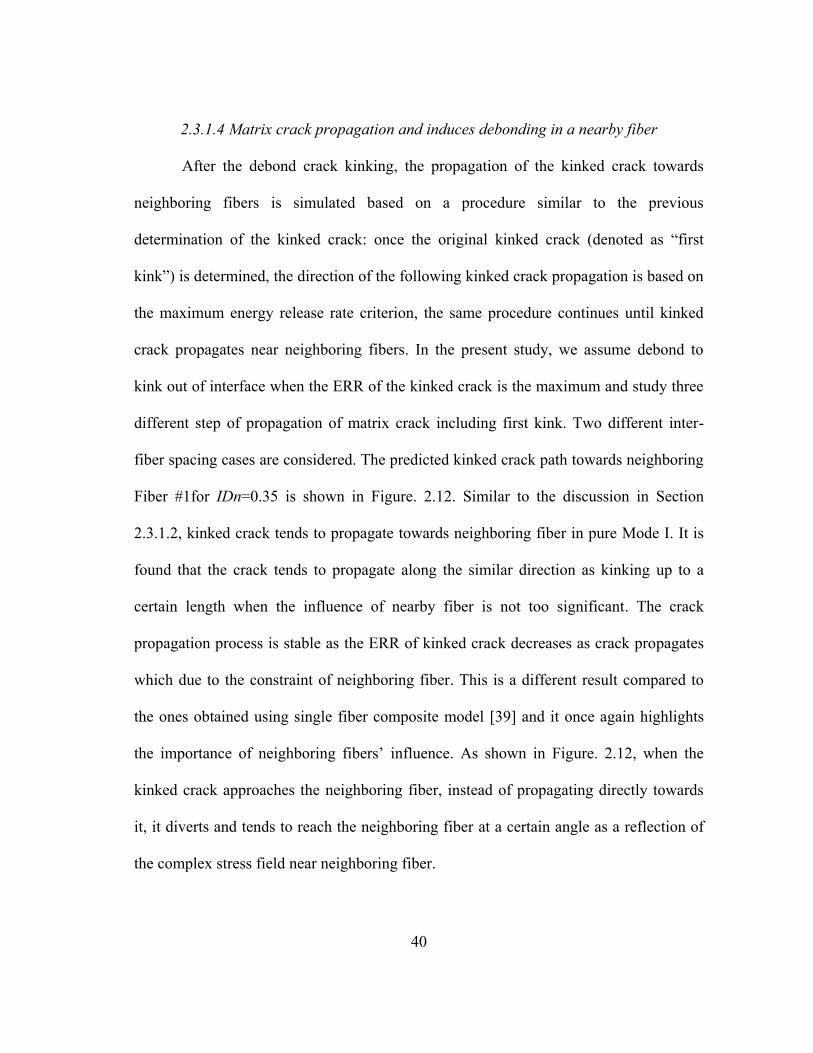
Figures 2.8 and 2.9 display the obtained ERR for the kinked crack and the debond
for two different inter-fiber spacing cases. For both cases, the potential kinking angle θ’
is found to be between 75º ~ 95º for all the debond angles studied and increases with
increasing debond angle. Once again although we only consider pure mechanical loading
in the present studies.
As shown in Figure 2.8, although we predict the crack kinking based on the
maximum energy release rate criterion, the obtained ERR of kinked crack indicates that
debond crack tends to kink out of interface in pure Mode I. This is a well-known result
which has also been found by other studies [75, 90]. From Figures 2.8 and 2.9 it is found
that the ERR of kinked crack reaches its maximum value at θ ≈ 30º for IDn=0.15 and θ ≈
40º for IDn=0.35. It should be note that Paris et al [39] found the debond angle for
maximum ERR of kinked crack is between 𝜃 = 60º and 70º for a single fiber composite.
Such difference between present study and a single fiber composite case clearly
demonstrate the influence of neighboring fibers. However, if one considers single fiber
composite as large inter-fiber spacing to approach this case, a closer look at the results

37
would suggest that the debond grows further before kinking out of the interface as the
inter-fiber spacing is increased.
Figure 2.8 Comparison of ERR between kinked crack and debond for IDn=0.15
38
Figure 2.9 Comparison of ERR between kinked crack and debond for IDn=0.35
Figure 2.10 Difference in Mode I ERR between kinked crack and debond

39
A closer look at Figures 2.8 and 2.9 shows that the maximum ERR of kinked
crack occurs when the Mode I component of debond is decreasing. The difference of
Mode I ERR between kinked crack and debond increasing as debond angle increases
until debond closes. This could be demonstrated better in Figure 2.10. As displayed in
Figure 2.10, the difference of Mode I ERR between kinked crack and debond increases
significantly when the ERR of kinked crack reaches the maximum value, indicating the
highest tendency for kinking. As a result, it is reasonable to suggest that debond crack
would most likely to kink out at a smaller debond angle compared to that in a single
fiber composite. This conclusion is supported by a most recent microscopical
observations [91] where the authors found the debond angle when kinking occurs are
generally smaller in 90° layers of a cross-ply laminate than that in a single fiber
composite. Their results are shown in Figure 2.11 for better demonstrate where 𝜃d is the
debond angle when kinking occurs.
Figure 2.11 𝜃d distributions based on experimental observation. (Figure reprinted
from [91])
40
2.3.1.4 Matrix crack propagation and induces debonding in a nearby fiber
After the debond crack kinking, the propagation of the kinked crack towards
neighboring fibers is simulated based on a procedure similar to the previous
determination of the kinked crack: once the original kinked crack (denoted as “first
kink”) is determined, the direction of the following kinked crack propagation is based on
the maximum energy release rate criterion, the same procedure continues until kinked
crack propagates near neighboring fibers. In the present study, we assume debond to
kink out of interface when the ERR of the kinked crack is the maximum and study three
different step of propagation of matrix crack including first kink. Two different inter-
fiber spacing cases are considered. The predicted kinked crack path towards neighboring
Fiber #1for IDn=0.35 is shown in Figure. 2.12. Similar to the discussion in Section
2.3.1.2, kinked crack tends to propagate towards neighboring fiber in pure Mode I. It is
found that the crack tends to propagate along the similar direction as kinking up to a
certain length when the influence of nearby fiber is not too significant. The crack
propagation process is stable as the ERR of kinked crack decreases as crack propagates
which due to the constraint of neighboring fiber. This is a different result compared to
the ones obtained using single fiber composite model [39] and it once again highlights
the importance of neighboring fibers’ influence. As shown in Figure. 2.12, when the
kinked crack approaches the neighboring fiber, instead of propagating directly towards
it, it diverts and tends to reach the neighboring fiber at a certain angle as a reflection of
the complex stress field near neighboring fiber.

41
Figure 2.12 Predicted matrix crack and radial stress along Fiber#1 interface.
(IDn=0.35, θ=40º)
Figure 2.13 display the normalized radial stress distribution (local radial stress /
far field transverse normal stress) along the interface of Fiber #1 during kinked crack
propagation (θn is indicated in Figure 2.7 and is positive clock-wise along Fiber #1). As
shown in Figure 2.13, when the kinked crack gets closer to Fiber #1 (third kink) as
indicated in Figure 2.12, a small region close to kinked crack tip with very high radial
tensile stress developed in Fiber #1 and is increasing as kinked crack approaches, this
localized high radial tensile stress, if reaching the critical value to break the bonds of
fiber/matrix interface, will initiate fiber/matrix debonding process in Fiber#1.
Investigation from [92] indicates that, once a new debond initiates in Fiber #1, it will
immediately propagate along fiber/matrix interface close-wise and debond kinking
process would also occur in Fiber#1 if the correct conditions are met. The repeat of the
whole process will eventually become unstable which leads to the formation of macro-
sized transverse crack. The similar failure process could be drawn for the case IDn=0.15

42
and is shown in Figure 2.14 and the experimental observations that match the whole
debond linking process discussed above could be found in [93] (shown in Figure 2.15).
Figure 2.13 Radial stress distribution along interface for Fiber#1
Figure 2.14 Predicted matrix crack and radial stress along Fiber#1 interface.
(IDn=0.15, θ=35º)

43
Figure 2.15 Scenario I typed debond link-up process (Figure reprinted from [93])
Finally, as indicated by the analysis above, for IDn = 0.15, the ERR values of
debond and kinked cracks are lower for this spacing compared to those for IDn = 0.35
(see Figures. 2.8, 2.9 and 2.10), which suggests that the transverse crack formation in
this scenario is more difficult as the inter-fiber spacing decreases.
2.3.1.5 Effects of thermal stresses
So far, we have investigated Scenario I based on pure mechanical loading in
order to keep generality of the case. However, as discussed in the introduction section,
processing of carbon/epoxy composites often involves cooldown from the curing
temperature, it would be interesting to see the effects of local thermal stresses generated
by cooldown process on the failure process discussed above. The effect of thermal
stresses on single debond growth along interface has been studied by the same authors in

44
[86] and it is found that the presence of thermal stresses has a protective effect (reduce
ERR of debond) on debond growth in a UD composite due to the overall compressive
stress developed due to thermal cooldown. In this section, we continue to investigate the
effect of the local thermal stresses on crack kinking.
To account for thermal stresses, A temperature change of ΔT = -100°C was
applied uniformly to the model (Figure 2.7) and was followed by a uniform
displacement at 𝑥 = 𝑊 to result in the mechanical strain 𝜀𝑥 = 0.5%. The residual stress
field induced by chemical shrinkage due to curing was, however, not included directly.
As shown in [94], the thermal cooldown is the main contributor to the development of
residual stresses and in a linear thermo-elastic analysis the effect of chemical shrinkage
can be formally included as a part of thermal stresses by taking a higher stress free
temperature [95]. We selected the case of inter-fiber spacing IDn = 0.35 to demonstrate
the thermal stresses effect.
Figure 2.16 shows the variation of ERR of kinked crack for pure mechanical
loading and thermo-mechanical loading cases. The debond angle varies from 𝜃 = 10° to
𝜃 = 70° when crack kinking is not likely to occur as debond tip closes (see Figures 2.5
and 2.6). The definition of the kinked crack is the same as discussed in Section 2.3.1.2.
from Figure 2.16 it’s found that at small debond angle (up to 𝜃=35°), the presence of
thermal stresses reduces Mode I ERR of kinked crack. For larger debond angle (𝜃 =35°-
70°), it increases the Mode I ERR of kinked crack. It should be noted that despite the
switch of trend with the increase of debond angle, the predicted potential kinking angle
𝜃k is found to be similar with or without the thermal stresses. Meanwhile, the observed
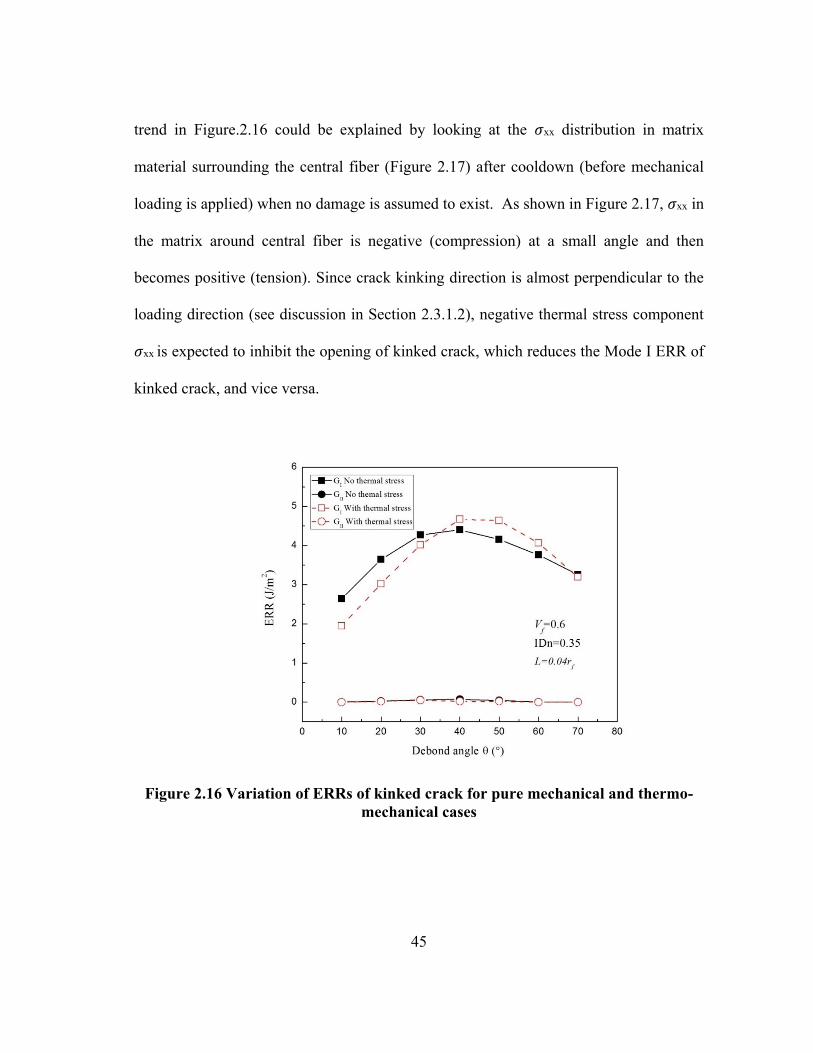
45
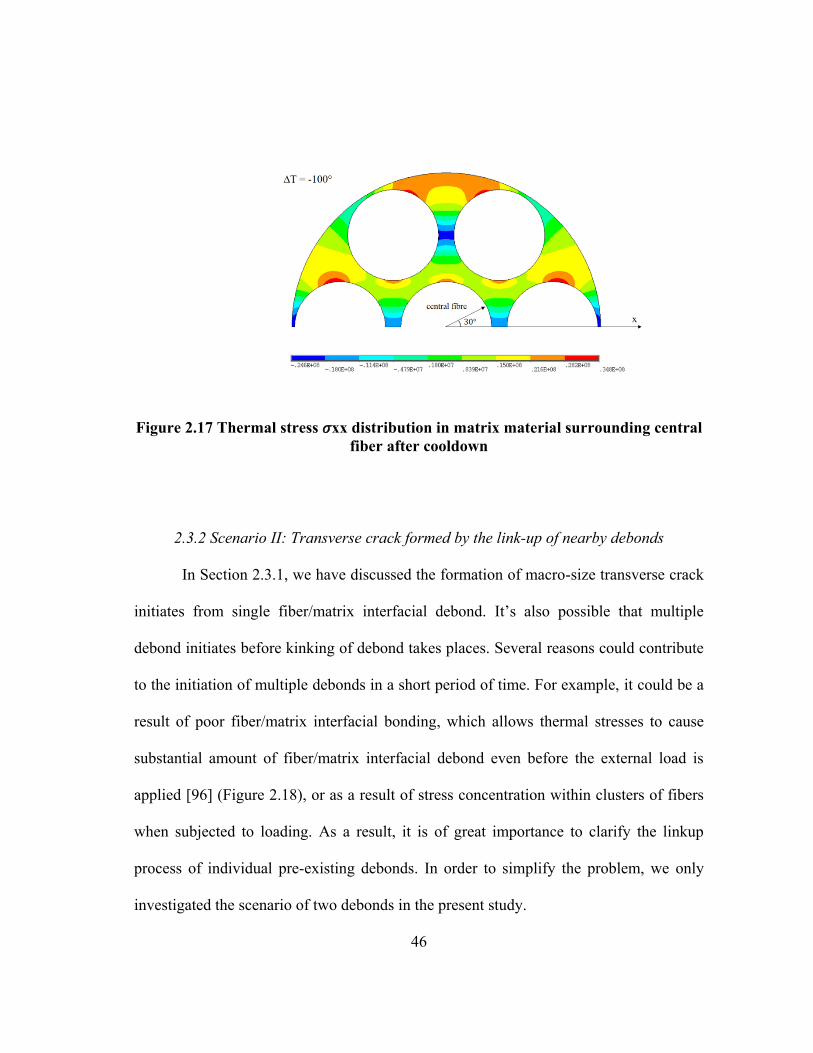
trend in Figure.2.16 could be explained by looking at the 𝜎xx distribution in matrix
material surrounding the central fiber (Figure 2.17) after cooldown (before mechanical
loading is applied) when no damage is assumed to exist. As shown in Figure 2.17, 𝜎xx in
the matrix around central fiber is negative (compression) at a small angle and then
becomes positive (tension). Since crack kinking direction is almost perpendicular to the
loading direction (see discussion in Section 2.3.1.2), negative thermal stress component
𝜎xx is expected to inhibit the opening of kinked crack, which reduces the Mode I ERR of
kinked crack, and vice versa.
Figure 2.16 Variation of ERRs of kinked crack for pure mechanical and thermo-
mechanical cases
46
Figure 2.17 Thermal stress 𝜎xx distribution in matrix material surrounding central
fiber after cooldown
2.3.2 Scenario II: Transverse crack formed by the link-up of nearby debonds
In Section 2.3.1, we have discussed the formation of macro-size transverse crack
initiates from single fiber/matrix interfacial debond. It’s also possible that multiple
debond initiates before kinking of debond takes places. Several reasons could contribute
to the initiation of multiple debonds in a short period of time. For example, it could be a
result of poor fiber/matrix interfacial bonding, which allows thermal stresses to cause
substantial amount of fiber/matrix interfacial debond even before the external load is
applied [96] (Figure 2.18), or as a result of stress concentration within clusters of fibers
when subjected to loading. As a result, it is of great importance to clarify the linkup
process of individual pre-existing debonds. In order to simplify the problem, we only
investigated the scenario of two debonds in the present study.

47
Figure 2.18 Cooldown induced debonds in a close vicinity (Figure reprinted from
[96])
2.3.2.1 Fiber/matrix interfacial debond growth with presence of a nearby debond
Before we proceed to discuss the influence of a nearby debond, we first define
two cases we will be investigating in the present study as indicated in Figure 2.19:
Case I: A nearby fiber/matrix debond at left side of Fiber #1 together with the central
debond;
Case II: A nearby fiber/matrix debond at the right side of Fiber #3 together with the
central debond.
For each case, the nearby debond size is characterized by its half angle 𝜃’ which
equals to 60° to represent a nearly fully propagated debond. And we’ll investigate the
effects of nearby debond on central debond propagation as well as kinking process.

48
Figure 2.19 Illustration of the two debonds model
In Case I, the two debond cracks are closer than in Case II, and that would
suggest that Case I is more favourable to transverse crack formation. However, since in
mutual interaction of cracks, both crack tip stress field enhancement and shielding are
involved, we consider both cases to gain a fuller understanding of the transverse crack
formation process. The parameters of the FE models adopted for this section are the
same as those shown in Figure. 2.2a except for the addition of the nearby debond. We
once again focus on the mechanical loading first and consider two different inter-fiber
spacings: IDn=0.15 and IDn=0.35.
Figures 2.20 and 2.21 show the obtained GI and GII of central debond in two-
debond scenario and single-debond scenario discussed in the previous section. From
Figures 2.20 and 2.21 it’s shown the presence of a nearby debond increases the ERR of
central debond significantly, and that enhancement intensifies with the decrease of inter-

49
fiber spacing. This is due to the interactions between two debond tips and the relaxation
of the nearby fiber constraint with the presence of debond. In the present study, we also
found that for the case of a smaller nearby debond angle 𝜃’=5°, the ERR of the central
fiber also increases, however, that increase is less significant and thus we chose not to
include this case in the present dissertation. The peak for GI of IDn=0.15 in Case I is
mainly due the strong interaction between two debond tips, as displayed in Figure 2.22.
That strong interaction also delays the closing of central debond tip as indicated by
Figure 2.20. Meanwhile, although we did not present in the current, it does worth
mentioning that the ERR of the two nearby debond crack tips especially for the one
closer to central debond also increases with the increasing of central debond size.
Figure 2.20 Comparison of GI of central debond between single debond and two-
debond case

50
Figure 2.21 Comparison of GI of central debond between single debond and two-
debond case
Figure 2.22 Illustration of 𝜃=60° situation. IDn=0.15 (radial stress in central fiber is
shown in this figure)

51
Based on the above findings, it is suggested that for two debonds that grows
simultaneously, if inter-fiber distance are small enough, instead of kinking of link-up
together, these two debonds might stay within corresponding interfaces. This situation
has been captured by Romanov et al. [31] experimentally and is displayed in Figure 2.23
for illustration.
Figure 2.23 Debonds stay within interface (Figure reprinted from [31])
2.3.2.2 Crack kinking with the presence of a nearby debond
We have now known that presence of a nearby debond would enhance central
debond growth based on the discussion above. It’s interesting to see how it would affect
the kinking process of central debond. Similar procedure as discussed in section 2.3.1.2
has been adopted with kinked crack length L chosen as 0.04rf.

52
Figures 2.24 and 2.25 display the obtained ERR results for kinked crack and
compared them with those of corresponding debond. From Figures 2.24 and 2.25 it’s
shown that the ERR of kinked crack increase with decreasing inter-fiber spacing and the
ERR of kinked crack in Case I is higher than the one in Case II of the same inter-fiber
spacing as central fiber is closer to the nearby fiber in Case I. If we compare results
shown in Figures 2.24 and 2.25 with results displayed in Figures 2.8 and 2.9, it is found
that the presence of a nearby debond increases the ERR of kinked crack significantly,
indication the positive effect on debond kinking process. Meanwhile, the debond angle
where the ERR of kinked crack is maximum is also larger which due to the fact the
larger the debond angle its, the closer kinked crack is to the nearby debond in Fiber#1.
Figure 2.24 Comparison of kinked crack and debond ERR for Case I (L=0.04rf)

53
Figure 2.25 Comparison of kinked crack and debond ERR for Case II (L=0.04rf)
As discussed in section 2.3.1.3, once debond kinked out of interface, the kinked
crack propagates towards the neighboring fiber stably, which it’s also valid for Case II in
the two-debond scenario. However, it does not always hold for Case I as two debonds
are closer. As shown in Table 2.3, for IDn=0.15, if we assume kinking occurs at 𝜃=60°
and compare the Mode I ERR of different kinked crack length L for single debond and
two-debond case with nearby debond angle 𝜃’ =60° discussed in the present study as
well as a case with intermediate nearby debond angle 𝜃’ =30°, it is very clear that kinked
crack propagation is unstable when 𝜃’ =60°. Meanwhile, the results listed in Table 2.3
also suggest that when the second debond crack tip is closer to the kinked crack, it tends
to intensify the growth rate of the kinked crack. On the other hand, when the

54
neighbouring fiber is fully bonded or insufficiently debonded, it dampens the growth of
the kinked crack.
Based on the discussion in the present section, it’s expected that if multiple
debonds exist in the close vicinity of each other, the debond growth, kinking and final
link-up process should be much faster compared to scenario I as the presence of nearby
debonds increases the driving force for both debond growth and kinking and more
importantly, that enhancement becomes more significant as the increase of debond size.
This conclusion is also supported by the experimental work conducted by Sjögren and
Berglund [96] as they found for the link-up of pre-existing debonds was very rapid and
continued over only a limited strain range for glass fiber reinforced cross-ply laminates.
Table 2.3 Mode I ERR for different kinked crack length (IDn=0.15)
Two-debond 𝜃’=60° Two-debond 𝜃’=30° Single debond
L GI (J/m2) GI (J/m2) GI (J/m2)
0.04rf 25.1437 6.1269 2.8772
0.08rf 31.6954 5.6734 2.4617
0.12rf 44.2344 5.1556 2.0195
2.3.2.3 Effects of thermal stresses
We are now investigating the effect of thermal stress on debond growth along
central fiber/matrix interface and debond crack kinking. Following the same approach
discussed in Section 2.5, a temperature change ΔT = -100°C was applied uniformly to
the corresponding model and was followed by a uniform displacement at 𝑥 = 𝑊 to

55
result in the mechanical strain 𝜀𝑥 = 0.5%. In this section, we selected to investigate the
case of inter-fiber spacing IDn =0.15 and results are presented in Figures 2.26 and 2.27.
As shown in Figure 2.26, the presence of thermal stresses show the same effect
on debond growth as discussed in [86] : it reduces the ERR of debond in central fiber for
both cases discussed in Scenario II but does not change the debonding behavior as the
overall trend of ERRs remains the same. Regarding the thermal stresses effect on debond
crack kinking, for Case I, the presence of thermal stresses reduces the Mode I ERR of
kinked crack for all the debond angles studied. This result somehow contradicts to the
result obtained for Scenario I (Figure 2.16), which could be contributed to the influence
of the neighboring debond. The result for Case II displayed in Figure 2.27 could further
support above assertion: for small debond angle, the influence of the neighboring debond
is negligible and thus the influence of thermal stresses on kinked crack follows the same
trend as the case in Scenario I (it reduces Mode I ERR of kinked crack first and then
increases). As debond continue growing, the presence of neighboring debond is starting
to be felt and now the presence of thermal stresses reduces Mode I ERR of kinked crack
again, which is similar to Case I.
Based on the discussion in this section, it is clearly that the presence of thermal
stresses would inhibit the debond growth in a UD composite, while its effect on debond
kinking is more complicated, which depends on many factors such as the location of
neighboring debond. However, despite the its influence on ERR, the presence of thermal
stresses does not change the overall conclusions we drawn on debond growth and
debond crack kinking based on pure mechanical loading.

56
Figure 2.26 Effects of thermal stress on ERRs of the debond crack for Case I and
Case II
Figure 2.27 Effects of thermal stress on ERRs of the kinked crack for Case I and
Case II

57
2.4 Summary
In the present study, two plausible transverse crack formation mechanisms have
been investigated. One is when transverse crack initiates from a single fiber/matrix
interfacial debond, in which case, the link-up mechanism will consist of debond crack
growth, its kinking out in the matrix, and the propagation of the kinked crack towards a
neighboring fiber, leading to the initiation of the fiber/matrix interfacial debonding in the
neighboring fiber. The whole process repeats until the linked-up crack grows unstably. It
has also been found that scenario I is a preferred mechanism for composite with
relatively low fiber volume fraction as the driving forces of debond growth, kinking and
propagation of the kinked crack increase with increasing inter-fiber spacing. The second
mechanism is multiple debonds inter-connecting one another, which is more likely to
occur in composites with high fiber volume fraction and the whole process requires less
work than the first mechanism.
The obtained results in the present study have clarified the various debond link-
up processes and highlighted their importance in the transverse failure process. The
numerical analyses match the documented experimental trends very well. Finally, it need
to be noted that although the FE model described in the present paper is well-suited to
investigate the failure mechanism, it is not able to predict the accurate failure strain for
composites under transverse tension. As discussed above, the inter-fiber spacing has
direct consequence on the transverse failure mechanism, and on the driving force for
debond growth, kinking as well as kinked crack propagation. In real composites, fibers
are non-uniformly distributed and their distribution also depends on the given

58
manufacturing process. As a result, a model that accounts for the non-uniform fiber
distribution due to a given manufacturing process is highly desired for accurate
prediction of the transverse failure strain.

59
3. FAILURE MECHANISMS OF UD COMPOSITES UNDER LONGITUDINAL
TENSION*
3.1 Introduction
Due to the architecture of fiber reinforced composite itself, multiple failure
events could occur simultaneously or sequentially when subjected to applied load, which
make it challenging to investigate the failure of composites. In a composite laminate,
transverse cracking discussed in Section 2 is often considered as the initiation of the
failure or one of the earliest failure events. Meanwhile, it’s proven that final failure of a
composite laminate is controlled by the 0° layers along One of the examples is shown in
Figure 3.1, as both static and fatigue strength of boron/epoxy laminates with different
layers all collapse into the diagonal line of UD plies strength [97].
Compared to the study on transverse failure, one of the major difficulties to
investigate failure of a UD composite under longitudinal tension is the lack of direct
experimental observations. This is due to the characteristic of such failure, as it involves
individual fiber breakage occurring inside the composite, which makes direct
observations extremely difficult especially for carbon fiber reinforced composites. For
years, observations could only be made based on final fracture surface or through single
fiber composite test. Recently, with the development of experimental technique such as
*Part of this section is reprinted with permission from Zhuang, L., R. Talreja, and J.
Varna, “Tensile failure of unidirectional composites from a local fracture plane”.
Composites Science and Technology, 2016. 133: p. 119-127. Copyright 2016 by
Elsevier.

60
the use of X-ray tomography, a direct observation of fiber breakage and accumulation of
broken fibers is made possible.
Figure 3.1 Illustration of relationship between laminate strength and UD plies
strength (Figure reprinted from [97])
Figure 3.2 displays the typical characteristic of UD composite failure process
under longitudinal tension based on X-ray microtomography [62]. As shown in Figure
3.2, upon loading, individual fiber breaks at discrete locations, with further increase of
applied load, more fiber breaks closer to the original broken fibers and catastrophic
failure occurs when a so-called “critical fracture plane” is formed and the whole plane
propagate unstably, causing the separation of the UD composite. Such “critical fracture

61
plane” contains only several broken fibers. The exact mechanism for the formation of
such plane, or in other word, how does individual broken fibers connect with each other
is still unknown and often ignored in failure model developments. As a result, one
should expect the results obtained from any models that overlooking the mechanism of
“critical fracture plane” formation to be questionable despite the claim of good
agreement with experimental results.
Figure 3.2 Characteristics of UD longitudinally tensile failure (Figure reprinted
from [62])
Realizing the urgent need for clarifying “critical fracture plane” formation
mechanism, in the present section, a FE analysis was carried out to investigate the

62
possible mechanism for “critical fracture plane” formation. The carbon fiber/epoxy UD
composite with 60% of fiber volume fraction is selected and fibers are assumed to be
hexagonally packed with uniform inter-fiber spacing. Two different scenarios are studied
and presented. One is for fiber breaks due to manufacturing process, in that case, only
fiber breakage is present and matrix cracking near fiber break is expected to be the
subsequent failure event. The other case is for fiber breaks at its weakest location during
loading application, in that case, due to high shear stress concentration near fiber break,
fiber/matrix debonding is usually expected following fiber breakage.
Fractography study by Purslow [54] suggests that the fracture zone in UD
composite under tensile loading originates from a single fiber fracture source. As a
result, In the composite a pre-existing broken fiber resulting from manufacturing process
or loading application is placed as a nucleation site for critical fracture plane formation.
The critical facture plane is considered to be formed once the 6 nearest intact
neighboring fibers are broken due to the resulting stress enhancement. For composites
with high fiber volume fraction, the distance between fibers is very small and thus the
effects of fibers on the stress field near broken fiber become dominant. As a result, the 6
nearest neighboring fibers could be simplified using an axisymmetric ring of fiber with
cross section area equals to the total sum of cross section areas of those 6 fibers as
shown in Figure 3.3. Another ring of matrix is placed around neighboring fiber ring in
order to ensure the fiber volume fraction equals to 0.6. Rest of the composite is then
modelled as another ring with homogenized composite properties, resulting in an
axisymmetric model containing 5- cylinder rings (Figure.3.3). Such model has been

63
successfully used to calculate the strain energy release rate of a single fiber-matrix
debond in author’s previous research [98].
Figure 3.3 Illustration of simplified composite model
3.2 Case I: Fiber breaks due to manufacturing process
3.2.1 Finite element model descriptions
Manufacturing induced defects such as voids, fiber misalignments and fiber
breakages are commonly found in composites. The effects of former two types of defects
have been well investigated in the past[99-104]. However, few studies have been done to
clarify the effects of fiber breaks due to manufacturing process. Discrete broken fiber
could be present even for a carefully manufactured composite structures. Such fiber
breakage usually would not cause any fiber/matrix debonding from it. Upon loading, it’s
expected that such fiber break would cause local stress concentration resulting in further

64
local damages. Given the preferred condition, the accumulation of local damages might
lead to the final failure of UD composite. In order to investigate that failure mechanism,
a FE study is conducted using the axisymmetric model discussed in the previous section.
Details of the FE model are in Figure 3.4a and the FE mesh near the debond tip
region, indicated by a rectangle in the figure, is displayed in Figure 3.4b. In Figure 3.4a,
z axis is the fiber axis and r axis is the radius axis in a cylindrical coordinate system In
the present paper, based on a convergence study conducted in [98], the model length L =
800μm is taken. At this length, the stress results are found to be independent of the
model length. The fiber break is sketched as a solid horizontal line in Fig. 2 (a) and is
placed at the distance d = 200 µm from the bottom plane. Initial computations showed
that the crack path was affected by the symmetry boundary conditions applied at the
plane of the broken fiber end, likely as an artifact of numerical implementation of the
boundary conditions. Instead, by shifting the bottom plane of the model by this distance,
the effect was nearly eliminated. In the FE model, fiber radius rf = 4µm. Inter-fiber
distance ID = 2µm, which is close to the normal inter-fiber distance of a hexagonally
packed fiber composite with 60% fiber volume fraction. The radius of the neighboring
fiber ring RMI is chosen such that the cross-sectional area of the neighboring fiber ring
equals to the total cross section areas of the six neighboring fibers. The radius of last
matrix ring, RMO, was selected to ensure that the fiber volume fraction in the
fiber/matrix unit represented by the four-cylinder rings equals to 60%. The composite
radius RC=5×RMO so that beyond which obtained results become independent on the

65
composite radius. To be consistent, the same material properties adopted from previous
section are shown in Table 3.1.
As shown in Figure 3.4a, at z=0 plane, displacement along z axis is constrained.
The whole model is subjected to a uniform displacement along fiber direction z on the
top plane. The thermal residual stresses are accounted for by imposing a uniform
temperature change of -100°C, which corresponds approximately to the cooldown
temperature for epoxies during curing. The residual stresses due to curing induced
shrinkage are not included, as these have been found to be small in comparison to the
thermal stresses [94]. First order axisymmetric FE elements CAX4 were adopted in the
current study using FE software ABAQUS [105].
The stress analysis is conducted outside a local region or core region near fiber
break within which material behaves significantly different from elastic theory due to
high stress concentration. Depending on the theories and experimental methods [106-
110], the shape and size of the core region may vary. However, it will later be shown
that the effect of exact shape and the size of the core region will not be significant in the
present study. As a result, to simplify the problem, the core region is assumed to be a
circle with a radius of r0 = 0.2 µm. Series of ring elements are placed in the matrix part
of core region with an angular resolution of 2.25° (Figure 3.4b).

66
Figure 3.4 a) Illustration of numerical model for case I. F: fiber, M: matrix, C:
composite; b) Detail of near debond tip region mesh
Table 3.1 Thermo-elastic properties of constituents
3.2.2 Matrix cracking
Under axial tension of the model, the first event of failure is expected to be in the
matrix close to the existing fiber break. As we discussed in the previous section, due to
the constraint of stiffer fibers, stress field near fiber/matrix interface is triaxial.
Depending on the level of triaxiality, brittle typed matrix cracking or ductile matrix
cracking would occur. Asp el al.[24] argued that under triaxial stress state, matrix
cavitation is the main cause for brittle typed cracking which depends on the local
Material E1
(GPa)
E2
(GPa)
υ12 G12
(GPa)
υ23 α1
(1/°c)
α2
(1/°c)
CF 500 30 0.2 20 0.45 -1∙10-6 7.8∙10-6
Epoxy 3.5 3.5 0.4 1.25 0.4 60∙10-6 60∙10-6
CF/EP
(Vf=0.6)
301.4 11.04 0.27 4.06 0.54 0.66∙10-6 35.85∙10-6

67
dilatational energy density. On the other hand, ductile matrix cracking depends on
distortional energy density. In order to characterize the stress field near fiber break
outside the core region, distortional energy density (denoted Ud) and dilatational energy
density (denoted Uv) distributions are calculated. The expressions for the two energy
densities are given in Eqn.3.1 and Eqn.3.2, from which it is apparent that their
expressions are similar to Von mises stress and hydrostatic stress, respectively.
However, contradicted to their stress counterparts, energy densities are independent of
temperature.
Ud= [(σ1 – σ2)2 + (σ1 – σ3)2 + (σ2 – σ3)2 ]
12𝐺 (3.1)
Uv = (1−2𝜐)(σ1+σ2+σ3)2
6𝐸 (3.2)
Where σ1, σ 2 and σ 3 are the principal stresses, υ, G and E are the Poisson’s ratio, shear
modulus and Young’s modulus of matrix, respectively.
In the present study, a temperature change of ΔT= 100°C is applied first to the
model to simulate the thermal cooldown process, followed by the mechanical loading.
Figure 3.5a and Figure 3.5b show the energy density distribution in matrix material
around fiber break at very small apply strain of 0.00575%. To better demonstrate the
result, core region is not shown in the figure. Although the exact energy density value

68
would change with increasing applied load, the characteristic of energy density
distribution remains the same: the maximum distortional energy density develops near
fiber/matrix interface (Figure 3.5a) while the maximum dilatational energy density
develops along fiber break plane, which is also the plane of symmetry (Figure 3.5b).
Both maximum energy density component occurs at the outside boundary of the core
region.
Based on the above observations, we could now re-visit the effects regarding the
shape and size of core region. As shown in Figure 3.5b, maximum dilatational energy
density occurs at fiber break plane, which is the plane of symmetry. As a result,
regardless of whether it is a circular shape as most of the researchers proposed or the
mises elastic-plastic boundary proposed by Theocaris and Andrianopoulos [109], the
most critical location will always be along that fiber break plane. Meanwhile, the size of
core region would only affect the damage initiation strain, it will not alter the mechanism
found in the current section. As a result, it is reasonable to assume that the following
statement made in the present study is independent of the choice of the core region.

69
a)
b)
Figure 3.5 a) Distortional energy density distribution and b) Dilatational energy
density distribution
In the FE model, due to the constraint of close packed neighboring stiff fibers,
tri-axial stress state develops within matrix material near fiber/matrix interface.
Meanwhile, along fiber break plane where maximum dilatational energy density occurs,
the stress state is found to be very close to equal tri-axiality, as shown in Figure 3.6

70
where the maximum energy density attained just out the core region w.r.t applied
loading is displayed. In the figure, the energy densities at 0% applied strain corresponds
to the thermal residual stresses contribution. For typical epoxy resin, Asp et al. [24]
conducted poker chip experiment and found the critical dilatational energy density to be
0.13~0.2MPa for formation of a matrix crack from unstable cavitation growth. As shown
in Figure 3.6, within that range, the Von mises stress corresponding to the maximum
distortional energy density is around 26.7 to 34.1 MPa, which is well below that required
for matrix yielding. Moreover, at the location of maximum dilatational energy density,
distortional energy density is much smaller (dash dot line). As a result, it could be
concluded that in the present study, for relatively high fiber volume fraction UD
composite, under tensile loading, the presence of tri-axial stress state develops within
matrix material and inhibits matrix plastic deformation around fiber break. This agrees
well with the experimental findings by Lorenzo and Hahn [111] as they conducted static
and fatigue tensile loading of a composite layer consisting of multiple fiber bundles and
found no plastic deformation in the matrix.

71
Figure 3.6 Variations of the maximum energy densities with the applied load
In order to predict failure initiation in the matrix near fiber break, critical
dilatational energy density criterion is adopted. This criterion was proposed by Asp et at
[24] and states that under tri-axial stress state, if the distortional energy density is lower
than that required for yielding, matrix cracking initiates through micro-cavitation when
dilatation energy density (right hand side of Eqn 3.2) reaches a critical value Uvc
(0.2MPa in the present study). For the extreme case where each principal stress
component is the same, i.e. under hydrostatic tension, micro-cavity would expand in a
spherical shape and once criticality is reached, crack would form in a star-shape with no
preferred propagation direction. However, if bias among three principal stresses exists,
as is the case in the current study (Figure 3.7), it would be expected that cavity to expand
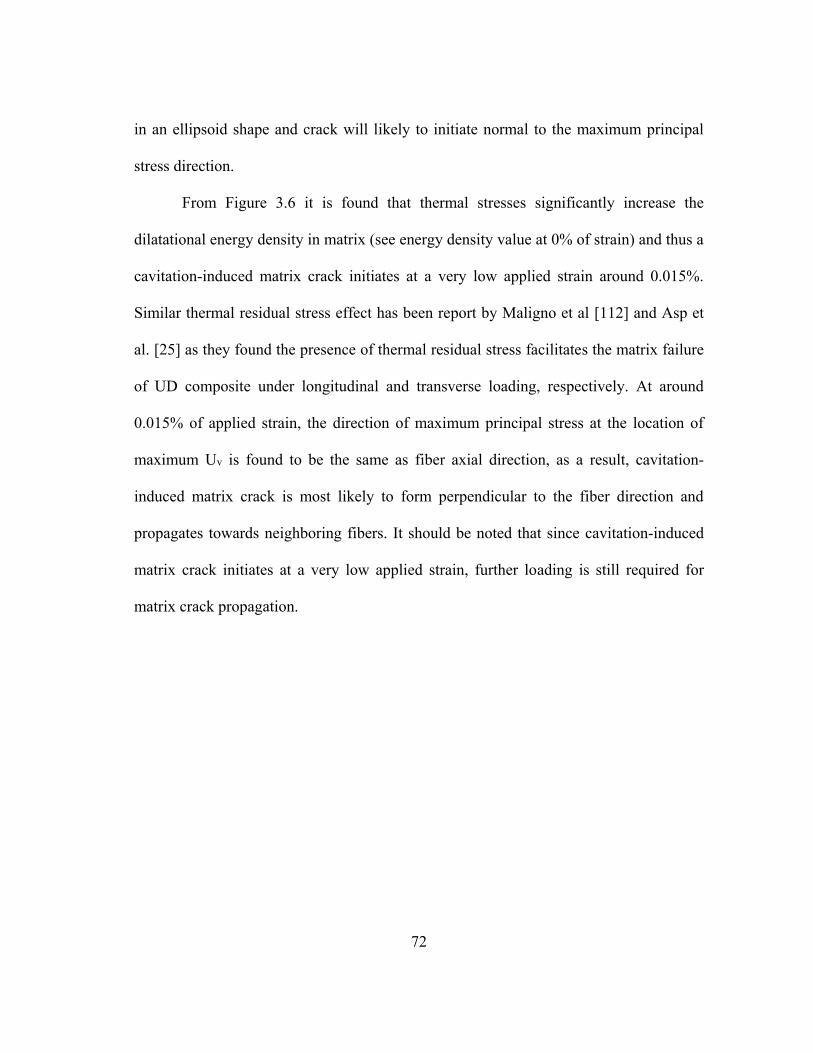
72
in an ellipsoid shape and crack will likely to initiate normal to the maximum principal
stress direction.
From Figure 3.6 it is found that thermal stresses significantly increase the
dilatational energy density in matrix (see energy density value at 0% of strain) and thus a
cavitation-induced matrix crack initiates at a very low applied strain around 0.015%.
Similar thermal residual stress effect has been report by Maligno et al [112] and Asp et
al. [25] as they found the presence of thermal residual stress facilitates the matrix failure
of UD composite under longitudinal and transverse loading, respectively. At around
0.015% of applied strain, the direction of maximum principal stress at the location of
maximum Uv is found to be the same as fiber axial direction, as a result, cavitation-
induced matrix crack is most likely to form perpendicular to the fiber direction and
propagates towards neighboring fibers. It should be noted that since cavitation-induced
matrix crack initiates at a very low applied strain, further loading is still required for
matrix crack propagation.
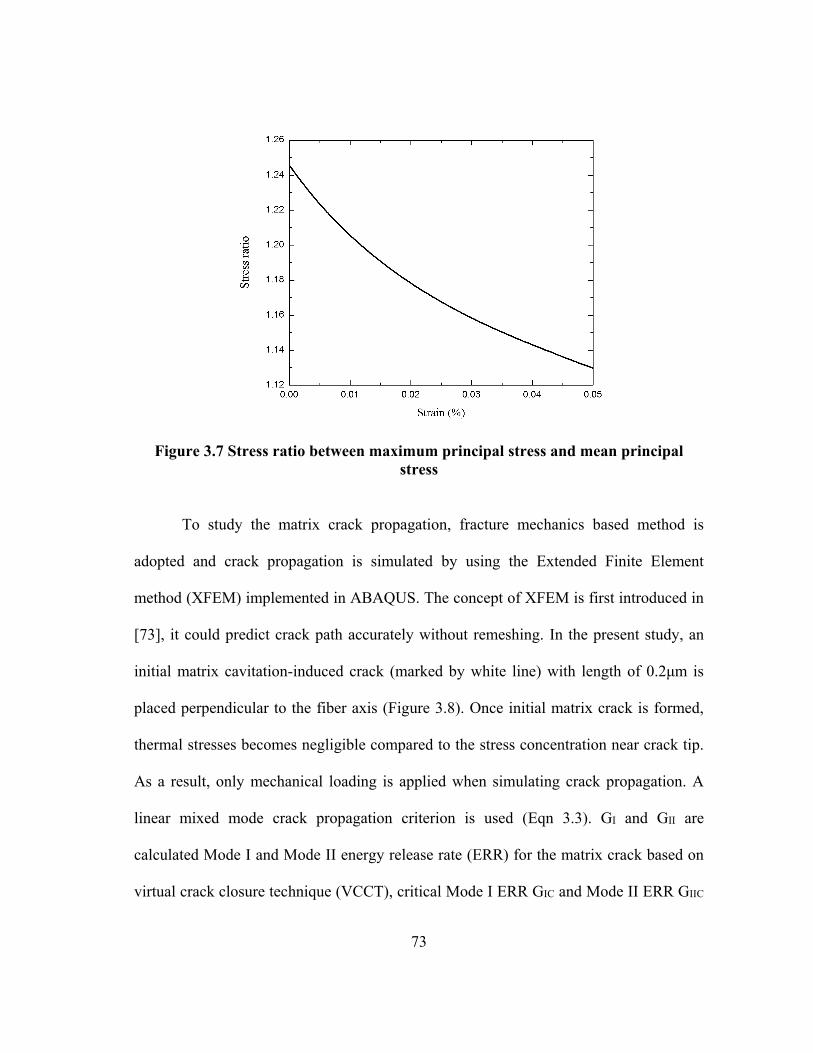
73
Figure 3.7 Stress ratio between maximum principal stress and mean principal
stress
To study the matrix crack propagation, fracture mechanics based method is
adopted and crack propagation is simulated by using the Extended Finite Element
method (XFEM) implemented in ABAQUS. The concept of XFEM is first introduced in
[73], it could predict crack path accurately without remeshing. In the present study, an
initial matrix cavitation-induced crack (marked by white line) with length of 0.2μm is
placed perpendicular to the fiber axis (Figure 3.8). Once initial matrix crack is formed,
thermal stresses becomes negligible compared to the stress concentration near crack tip.
As a result, only mechanical loading is applied when simulating crack propagation. A
linear mixed mode crack propagation criterion is used (Eqn 3.3). GI and GII are
calculated Mode I and Mode II energy release rate (ERR) for the matrix crack based on
virtual crack closure technique (VCCT), critical Mode I ERR GIC and Mode II ERR GIIC
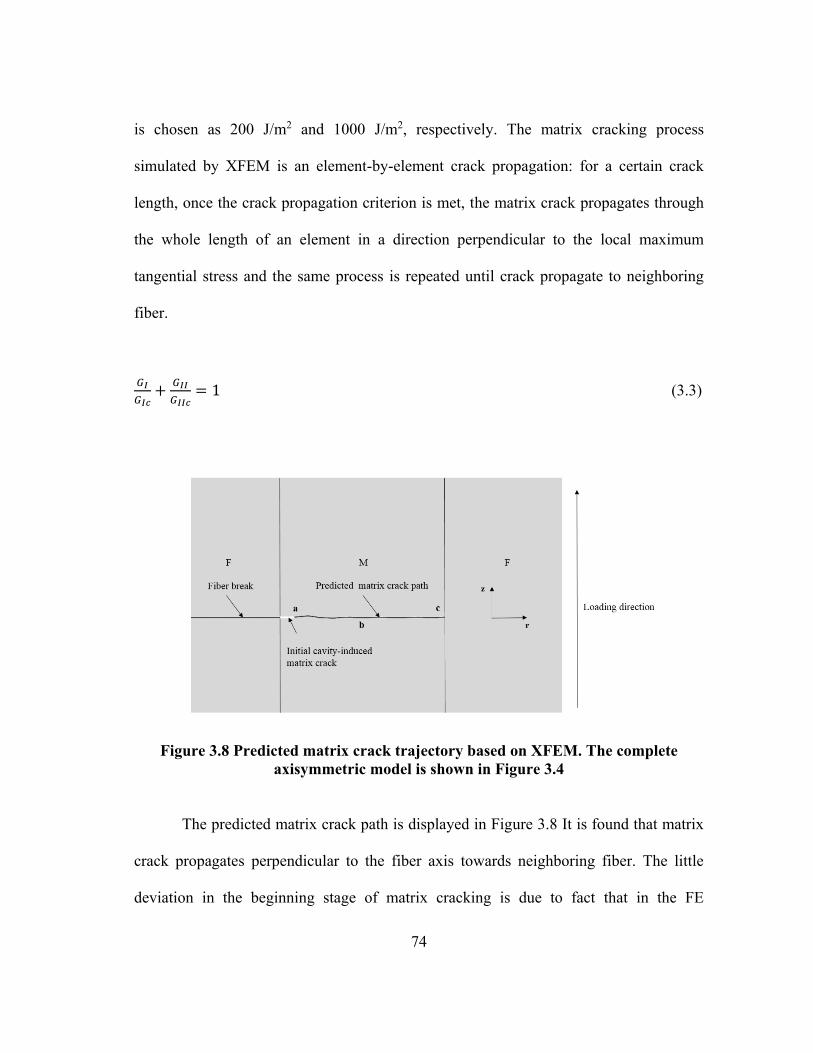
74
is chosen as 200 J/m2 and 1000 J/m2, respectively. The matrix cracking process
simulated by XFEM is an element-by-element crack propagation: for a certain crack
length, once the crack propagation criterion is met, the matrix crack propagates through
the whole length of an element in a direction perpendicular to the local maximum
tangential stress and the same process is repeated until crack propagate to neighboring
fiber.
𝐺𝐼
𝐺𝐼𝑐+
𝐺𝐼𝐼
𝐺𝐼𝐼𝑐= 1 (3.3)
Figure 3.8 Predicted matrix crack trajectory based on XFEM. The complete
axisymmetric model is shown in Figure 3.4
The predicted matrix crack path is displayed in Figure 3.8 It is found that matrix
crack propagates perpendicular to the fiber axis towards neighboring fiber. The little
deviation in the beginning stage of matrix cracking is due to fact that in the FE

75
calculation, even though fiber break plane is a symmetric plane along, there will be very
small shear stress along that plane, and that shear stress is higher closer to broken fiber,
which slightly perturbs the symmetric plane condition and thus cause the small deviation
of horizontal matrix crack at the beginning.
3.2.3 Neighboring fiber breakage
Evans et al. [113] found that for aligned stiff fiber composites, when a matrix
crack propagates to the fiber, it is not likely that the matrix crack will cut through fiber
and propagate, instead, it would tend to deflect along fiber axis causing fiber/matrix
debonding. For composites with good fiber/matrix interfacial bonding, it would also be
expected that matrix crack being constrained between fibers. Both scenarios have been
found in the experiment work conducted by Lorenzo and Hahn [111]. As a result, to
form the critical fracture plane, neighboring intact fibers are most likely to fail as a result
of stress enhancement caused by surrounding fiber breakage and subsequent matrix
cracking.
Previous studies, e.g. [114-119], dealing with stress enhancement in the fibers
neighboring a broken fiber have not considered the effect of a matrix crack emanating
from the broken fiber end. We do that here using the FE model described above. The
mean value of the stress concentration factor (SCF), as shown in Eqn. (3.4), defined as
the ratio of the local tensile mean stress (averaged over the fiber-ring cross-section) to
the remote stress in the fiber, is calculated for the initial condition when only fiber break
is present, i.e., with no matrix crack, and when the matrix crack has grown to different
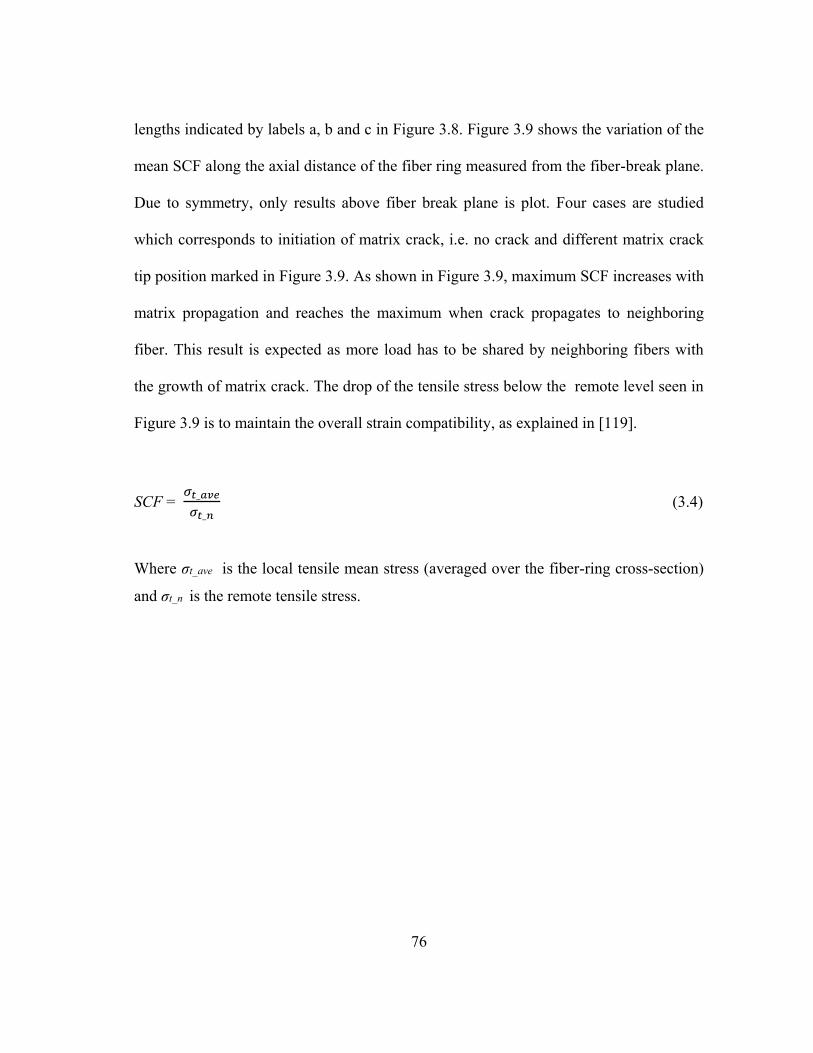
76
lengths indicated by labels a, b and c in Figure 3.8. Figure 3.9 shows the variation of the
mean SCF along the axial distance of the fiber ring measured from the fiber-break plane.
Due to symmetry, only results above fiber break plane is plot. Four cases are studied
which corresponds to initiation of matrix crack, i.e. no crack and different matrix crack
tip position marked in Figure 3.9. As shown in Figure 3.9, maximum SCF increases with
matrix propagation and reaches the maximum when crack propagates to neighboring
fiber. This result is expected as more load has to be shared by neighboring fibers with
the growth of matrix crack. The drop of the tensile stress below the remote level seen in
Figure 3.9 is to maintain the overall strain compatibility, as explained in [119].
SCF = 𝜎𝑡_𝑎𝑣𝑒
𝜎𝑡_𝑛 (3.4)
Where σt_ave is the local tensile mean stress (averaged over the fiber-ring cross-section)
and σt_n is the remote tensile stress.

77
Figure 3.9 Mean stress concentration factor in fibers neighboring a broken fiber at
different stages of matrix crack growth. For crack-tip locations a, b and c, see
Figure 3.8
Fiber breakage process is considered to be a statistical process since strength
along fiber axis is not constant. As a result, SCF itself is not sufficient to evaluate the
neighboring fiber breakage process, a more accurate way is to incorporate obtained
stress enhancement information into a statistical model, which has been done by some of
the pioneered work [46-48, 51, 52, 120, 121], however, in those research, the effect of
matrix cracking is neglected. As discussed and shown (Figure 3.9) in the current study,
matrix cracking has quite a significant effect on the obtained maximum SCF, so a more
complete model has to take that into account.
The stress enhancement information when matrix crack propagates to
neighboring fibers is adopted since it’s more critical. Assuming no further damage

78
developed (i.e. no further fiber/matrix debonding) and no matrix plasticity, the
probability of failure of neighboring fibers is then calculated by assuming the strength of
fiber follows a Weibull distribution such that the probability of survival of a fiber of a
certain length is given by
P(𝜎)=exp[-(l/l0)α (σ/σ0)m] (3.5)
Where P(𝜎) is the probability of survival, l the fiber length and σ the local mean stress.
The statistical data σ0 the characteristic strength of 3270 MPa, l0 the standard length of
62mm and m the shape parameter of 5.3 adopted from [115]. Correlation factor α =0.6
adopted from [121] are used in the calculation.
For each small size of element along fiber axis z, tensile mean stress is taken to
be constant when the probability of survival is calculated. Based on the weakest link
theory, the probability of survival of a certain length of fiber is then given by the product
of P(𝜎) of each element. The probability of failure F(𝜎) is then obtained by one minus
the probability of survival. In the present study, the probability of failures over three
regions of different fiber length are calculated: region I is the whole fiber length of
800µm in the model; region II is the stress enhancement region of 96µm where local
mean tensile stress at neighboring fiber is larger than the nominal tensile stress, region
III is the region up to 2 fiber diameters (8µm from above and below, respectively)
distance away from fiber break, where stress enhancement at the neighboring fiber is the
most significant. Then followed a similar approach by Nedele and Wisnom in [115,

79
119], the factor for the enhanced probability of failure (the ratio of probability of failure
of neighboring fibers to the probability of failure of the same length subjected to the
nominal tensile stress) is calculated at a medium overall applied strain 0f 0.6% and
results are listed in Table 3.2.
Table 3.2 The enhanced probability of failure factor calculated over different fiber
regions at a reference applied strain of 0.6%.
Enhanced probability of failure factor
Region I Region II Region III
Only fiber break 1.000 1.141 1.380
Fiber break with matrix crack 1.002 1.244 1.670
Based on the results from Table 3.2, it’s shown that although the stress
enhancement cause by the local damage events (i.e. fiber breakage and matrix cracking)
seems to have much smaller effect on the overall failure of neighboring fibers, as also
reported by Nedele and Wisnom [115, 119], it significantly increases of probability of
fiber failure at a local region closed to the location of matrix crack tip where that stress
enhancement is the largest. As a result, it would be expected that the critical fracture
plane formed by this mechanism is to be a small localized region close to the initial fiber
break plane. This supports the experimental finding in the X-ray tomography study [63],
which showed most broken fibers to be in the range m axial distance.
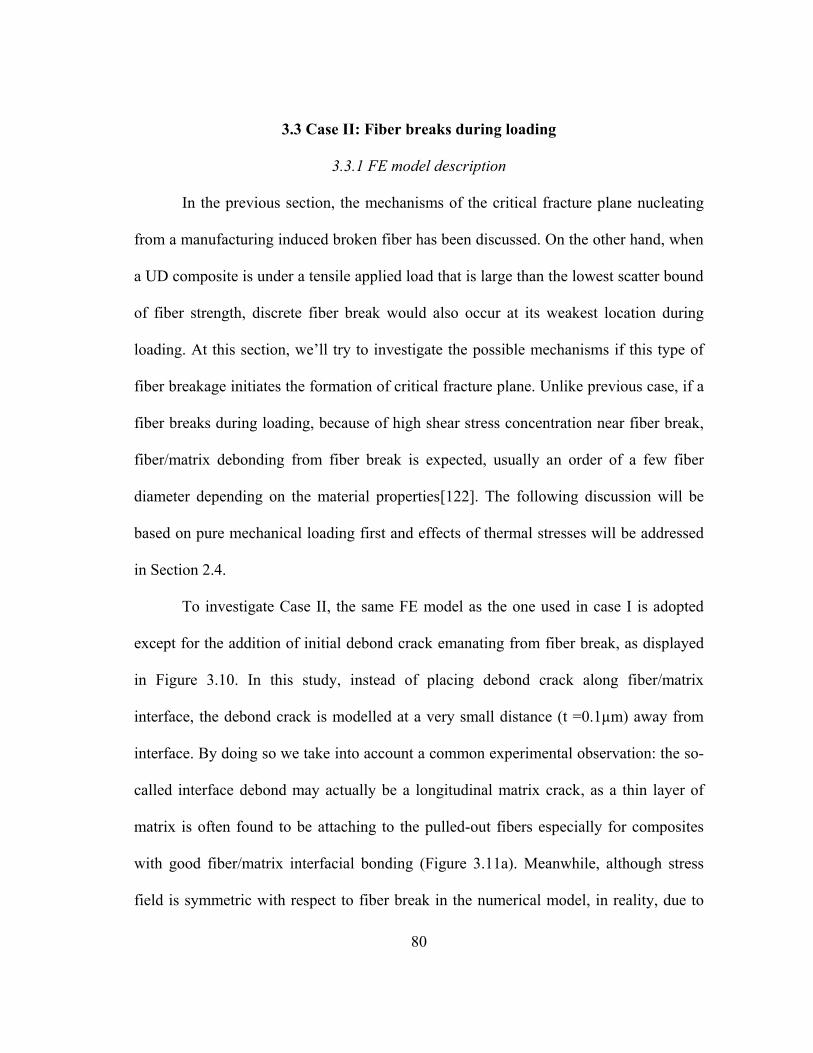
80
3.3 Case II: Fiber breaks during loading
3.3.1 FE model description
In the previous section, the mechanisms of the critical fracture plane nucleating
from a manufacturing induced broken fiber has been discussed. On the other hand, when
a UD composite is under a tensile applied load that is large than the lowest scatter bound
of fiber strength, discrete fiber break would also occur at its weakest location during
loading. At this section, we’ll try to investigate the possible mechanisms if this type of
fiber breakage initiates the formation of critical fracture plane. Unlike previous case, if a
fiber breaks during loading, because of high shear stress concentration near fiber break,
fiber/matrix debonding from fiber break is expected, usually an order of a few fiber
diameter depending on the material properties[122]. The following discussion will be
based on pure mechanical loading first and effects of thermal stresses will be addressed
in Section 2.4.
To investigate Case II, the same FE model as the one used in case I is adopted
except for the addition of initial debond crack emanating from fiber break, as displayed
in Figure 3.10. In this study, instead of placing debond crack along fiber/matrix
interface, the debond crack is modelled at a very small distance (t =0.1µm) away from
interface. By doing so we take into account a common experimental observation: the so-
called interface debond may actually be a longitudinal matrix crack, as a thin layer of
matrix is often found to be attaching to the pulled-out fibers especially for composites
with good fiber/matrix interfacial bonding (Figure 3.11a). Meanwhile, although stress
field is symmetric with respect to fiber break in the numerical model, in reality, due to

81
the unstable nature of initial debonding as well as statistical distribution of material
properties, it’s quite common that the debond crack only grows along one direction away
from fiber break (shown in Figure 3.11b). Readers can refer to the experimental work
conducted by Gamstedt and his colleagues [123, 124] for more details of such damage
features. As a result, in our model, initial debond crack (or longitudinal matrix crack) is
assumed to grow along positive fiber axis and initial debond length from dl from 1µm to
10µm when the energy release rate (ERR) for the debond crack is become constant is
studied.
Figure 3.10 Illustration of the numerical model for Scenario II

82
Figure 3.11 a) Matrix attached to pull-out fibers and b) Debond growth in one
direction from fiber break (Figure 3.11a reprinted from [124], Figure 3.11b
reprinted from [123])
Under longitudinal tension, the debond crack is found to grow in pure Mode II
under tensile loading [98] and thus surface interpenetration is expected if no contact
constraint is imposed between both debond surfaces, resulting in an artificial Mode I
ERR value GI. However, as proven by Whitcomb [89], for a Mode II dominated crack
growth, non-contact analysis would not significantly affect the obtained ERR, and total
value of obtained GII and artificial GI could well approximate the GII result in a contact
case. That is also supported by current authors when conducting the research work on
the interfacial debond growth [98] (not reported), it is found that for non-contact
analysis, the sum of GII and artificial GI as well as the total ERR obtained through J
integral method agree well with the obtained GII results in the contact analysis ( less than
1.5% of difference). As a result, in our model, no contact constraint is imposed in order
to achieve numerical efficiency.
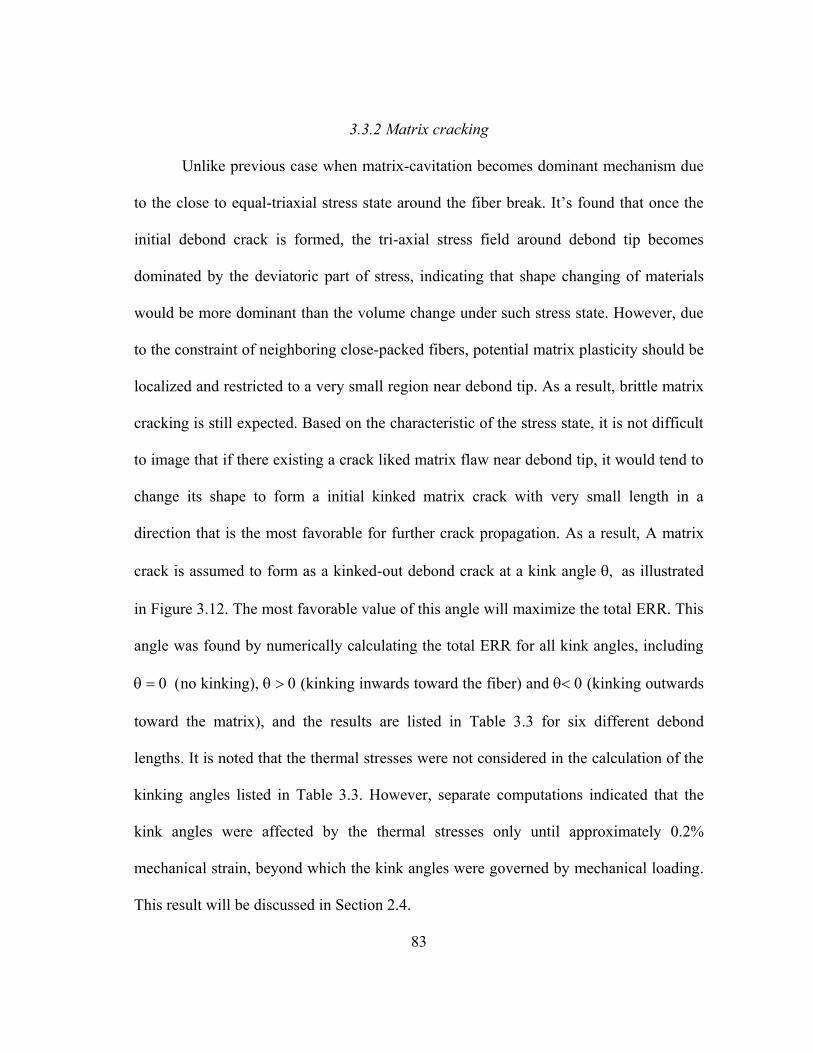
83
3.3.2 Matrix cracking
Unlike previous case when matrix-cavitation becomes dominant mechanism due
to the close to equal-triaxial stress state around the fiber break. It’s found that once the
initial debond crack is formed, the tri-axial stress field around debond tip becomes
dominated by the deviatoric part of stress, indicating that shape changing of materials
would be more dominant than the volume change under such stress state. However, due
to the constraint of neighboring close-packed fibers, potential matrix plasticity should be
localized and restricted to a very small region near debond tip. As a result, brittle matrix
cracking is still expected. Based on the characteristic of the stress state, it is not difficult
to image that if there existing a crack liked matrix flaw near debond tip, it would tend to
change its shape to form a initial kinked matrix crack with very small length in a
direction that is the most favorable for further crack propagation. As a result, A matrix
crack is assumed to form as a kinked-out debond crack at a kink angle as illustrated
in Figure 3.12. The most favorable value of this angle will maximize the total ERR. This
angle was found by numerically calculating the total ERR for all kink angles, including
no kinking), (kinking inwards toward the fiber) and (kinking outwards
toward the matrix), and the results are listed in Table 3.3 for six different debond
lengths. It is noted that the thermal stresses were not considered in the calculation of the
kinking angles listed in Table 3.3. However, separate computations indicated that the
kink angles were affected by the thermal stresses only until approximately 0.2%
mechanical strain, beyond which the kink angles were governed by mechanical loading.
This result will be discussed in Section 2.4.
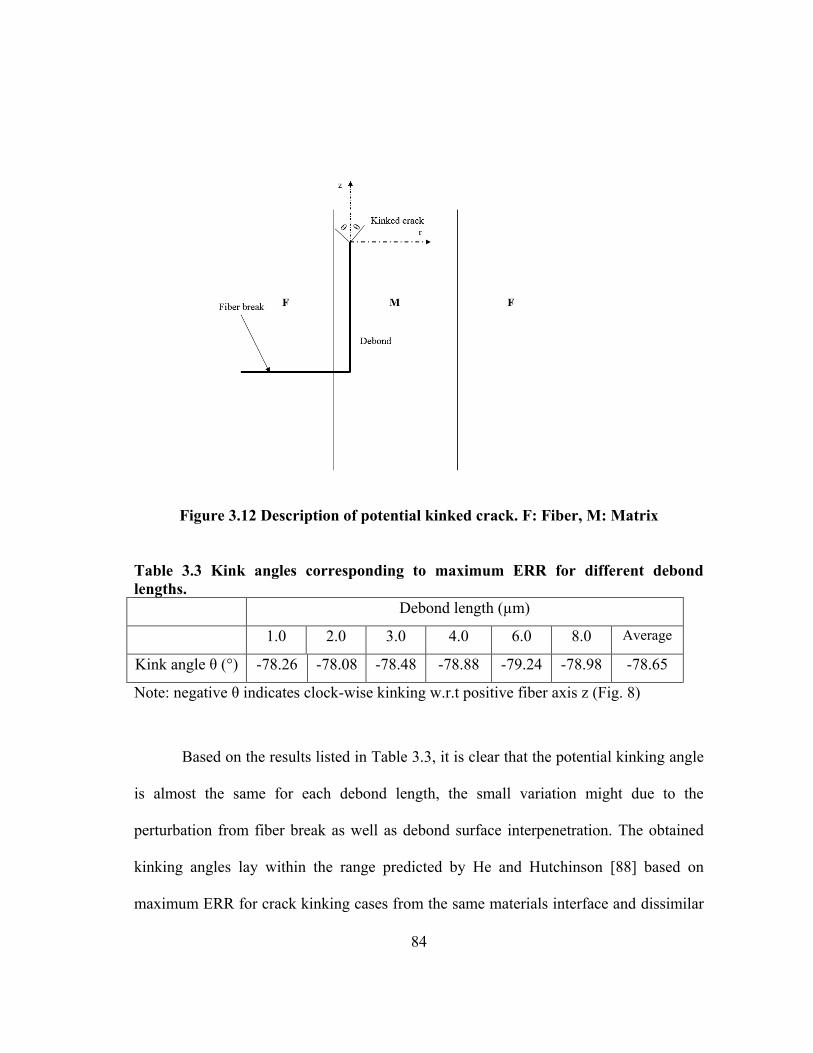
84
Figure 3.12 Description of potential kinked crack. F: Fiber, M: Matrix
Table 3.3 Kink angles corresponding to maximum ERR for different debond
lengths.
Debond length (µm)
1.0 2.0 3.0 4.0 6.0 8.0 Average
Kink angle θ (°) -78.26 -78.08 -78.48 -78.88 -79.24 -78.98 -78.65
Note: negative θ indicates clock-wise kinking w.r.t positive fiber axis z (Fig. 8)
Based on the results listed in Table 3.3, it is clear that the potential kinking angle
is almost the same for each debond length, the small variation might due to the
perturbation from fiber break as well as debond surface interpenetration. The obtained
kinking angles lay within the range predicted by He and Hutchinson [88] based on
maximum ERR for crack kinking cases from the same materials interface and dissimilar
85
materials interface that is similar as the fiber/matrix interface in our model characterized
by Dundurs parameters [125], as indicated in Figure 3.13, which further validates the
obtained results given that fact that debond crack is modelled as a longitudinal matrix
crack close to the interface. In order to evaluate the competition between debond crack
growth and kinked crack propagation, we compared the ERR of debond crack and
potential kinked crack. For kinked crack, the kinking angle is set as -78.654° by
averaging of kinking angle for each debond length. ERR at a reference applied strain
(0.1%) for debond crack at a certain length and potential kink crack emanating from it
with very small length of 0.204μm is then calculated by VCCT method and plotted in
Figure 3.14. It should be noted that all ERR results are obtained after convergence check
is performed. As shown in Figure 3.14, ERR for both debond crack and kinked crack is
decreasing with increasing debond length, which similar to the findings for interface
debond crack [98]. For each debond length, ERR of kinked crack is larger than that of
debond crack, more importantly, although the kinking angle is predicted based on the
maximum ERR criterion, the ERR of that kinked crack is found to be almost pure Mode
I, indicating that the kinking angle where ERR is the maximum is the same angle that
make crack grow in pure Mode I locally. Similar experimental and numerical findings
are also reported by Xie et al [90]. For epoxy materials, Mode I critical facture toughness
is usually smaller than the corresponding Mode II component, and thus it could be
concluded that for debond crack lying within matrix, once the kinked crack is formed, it
would deviate immediately from original debond crack plane and propagate towards
neighboring fiber and matrix crack is more likely to kink out at shorter debond length.

86
Finally, it should be noted that although not reported in the present paper, present
conclusion holds for the interface debond crack case except that the predicted kinking
angle as well as ERRs would be different. For interface debond crack, criterion proposed
by He and Huchinson [88] could be used to evaluate the competition between its growth
and kinked crack growth. However, one major challenge one has to face is to determine
the related interface properties.
Figure 3.13 Predicted kinking angle based on reference (Figure adapted from [88])

87
Figure 3.14 ERR of debond crack and kinked crack for at each debond crack
length. 0.1% applied strain
Once kinked crack is formed, similar approach as described in section 3.2.2 is
adopted to predict crack propagation path using XFEM method implemented in
ABAQUS. For each debond length, a kinked crack with length of 0.204μm is placed at
debond tip in an angle θ = -78.654° (Figure 3.12). Matrix crack propagation criterion is
the same as the one used in section 3.2.2. It’s found that matrix crack propagates to
neighboring fiber at lower applied strain when initial debond crack is shorter as ERR is
larger for the kinked crack. The predicted kinked crack path at each debond length is put
together and displayed in Figure 3.15. As shown in Figure 3.15, for shorter debond crack
(i.e. dl =1μm and dl =2μm), kinked crack is close to propagate perpendicular to the
loading direction, which is similar to the no debond case studied in section 3.2.2. For
longer debond, however, it is found that matrix crack propagates along initial kinking

88
angle until it comes closer to the neighboring fiber when it diverts and tend to propagate
along fiber/matrix interface, which is the reflection of change of local stress state when
the crack grows closer to the neighboring fiber as matrix crack tends to grows in a
direction that could retain Mode I fracture locally.
Figure 3.15 Superposition of predicted matrix crack path for different initial
debond length. F: Fiber, M: Matrix.
3.3.3 Neighboring fiber breakage
For each initial debond length, when the kinked crack propagates to neighboring
fiber, mean tensile SCF along neighboring fiber is calculated and stress enhancement
region is selected and plotted in Figure 3.16 to show the SCF distribution. As displayed

89
in Figure 3.16, the presence of debond causes stress redistribution along neighboring
fiber and thus varies the location of maximum SCF. Meanwhile, the maximum SCF is
decreasing with increasing initial debond length. However, it’s found that neighboring
fibers at longer debond case has larger region experiencing relatively high tensile stress
concentration compare to the shorter debond case where peak stress concentration only
occur at a very narrow region. Combining with the fact that fiber strength is not constant
along fiber axis, SCF itself again is not sufficient to evaluate the fiber breakage process,
a statistical analysis has to be carried out.
Figure 3.16 Mean tensile SCF within stress enhancement region in neighboring
fiber when matrix crack propagates to neighboring fiber
The statistical model adopted here is the same as the one discussed in section
3.2.3. Based on the findings from section 3.2.3, it’s known that the effect of stress

90
enhancement is very local, as a result, the enhanced probability of failure factor at
medium applied strain of 0.6% is studied here for two local regions with different fiber
length where region I corresponds to the stress enhancement region as shown in Figure
3.16, and region II is the region up to ±10μm from matrix crack tip, all results are listed
in Table 3.4. Meanwhile, for initial debond length dl =10μm, comparison of enhanced
probability of failure factor is made for regions up to ±5μm from fiber break and matrix
crack tip, respectively in order better evaluate which region of neighboring fiber is more
prone to break. Those results are shown in Table 3.5.
Table 3.4 The enhanced probability of failure factor F(σ) over two different fiber
regions for different initial debond lengths at the applied strain of 0.6%. dl =1.0 μm dl =2.0 μm dl =4.0 μm dl =10.0 μm
Region I Region II Region I Region II Region I Region II Region I Region II
F(σ) 1.245 1.696 1.245 1.695 1.253 1.711 1.271 1.699
Table 3.5 The enhanced probability of failure factor F(σ) over different fiber
regions for dl =10.0μm and applied strain of 0.6%.
dl =10μm
±4μm from fiber break ±4μm from matrix crack tip
F(σ) 1.692 1.750
From Table 3.4 it is shown that larger higher stress concentration region for
longer debond compensates its lower Maximum SCF, as a result, the probability of
failure over stress enhancement region is close to the same for each debond case.
Meanwhile, it once again suggests that the stress enhancement will only significantly

91
increase the probability of failure of neighboring fiber over a very local region close to
crack tip. Results from Table 3.5 further demonstrate that local region is most likely to
be the region close to crack tip instead of fiber break. Based on the above finding, it
could be concluded that for the case critical fracture plane nucleates from fiber breaks
during loading application, the critical fracture plane would most likely to show a
stagger pattern, which has been commonly found during experiment. It would also be
expected that for composite with good fiber/matrix bonding (i.e. shorter debond length),
the critical fracture plane would be more coordinated, otherwise it would show a more
random pattern involving longer length of pulled-out fibers. That may help explain the
commonly found “brittle typed” UD composites fracture and “brush like” UD composite
fracture during experiments [123, 124].
3.4 Effects of thermal stresses
Similar to Section 2, we chose to present the study based on mechanical loading
first in order to maintain the generality of the results as curing temperature varied and
depends on the applications and material systems specifically. Once the general trends
under mechanical loading has been understood, we then proceed to discuss the effects of
thermal stresses. In the present section, to include the thermal stress, two steps of the
analysis were carried out. In the first step, thermal cool down process was simulated by
applied ΔT= -100° of temperature change. At the second step, mechanical loading is
applied by applying uniform displacement to the model.

92
For Case I discussed in Section 3.2, it’s found that instead of fiber/matrix
interface debonds from fiber break, cavitation induced matrix cracking tends to be the
first failure event upon loading and matrix crack propagates perpendicular to the fiber
axis. As a result, it’s interesting to study the effects of thermal stresses on matrix crack
propagation process in Case I.
In order to study matrix crack propagation, energy release rate (ERR) was
calculated for initial cavitation induced matrix crack with length =0.2µm as
demonstrated in Figure 3.8. Results on ERR is shown in Figure 3.17. It’s found that that
the presence of thermal stresses increases ERR of matrix crack. This is due to the overall
tensile stress developed within matrix material as a result of thermal cooldown. Due to
the longitudinal thermal coefficient mismatch between matrix and fiber material (see
Table 3.1), after thermal cooldown, matrix materials tend to shrink while fibers want to
expand. As a result of strain compatibility, tensile stress developed within matrix and
fibers are subjected to compression after thermal cooldown. However, despite the
increase on ERR, the thermal stress contribution is still small compared to the
contribution of mechanical loading, especially at applied load level when the matrix
crack starts propagation (at around 0.17% of mechanical applied strain). More
importantly, the predicted crack path is not influenced by the thermal stress. As a result,
it is concluded that the trend discussed on matrix cracking based on mechanical loading
does not change with the inclusion of thermal stresses. Regarding fiber breakages
process, due to the compressive stress developed during cooldown as discussed above,
it’s expected that higher applied load is needed to break the neighboring fiber as
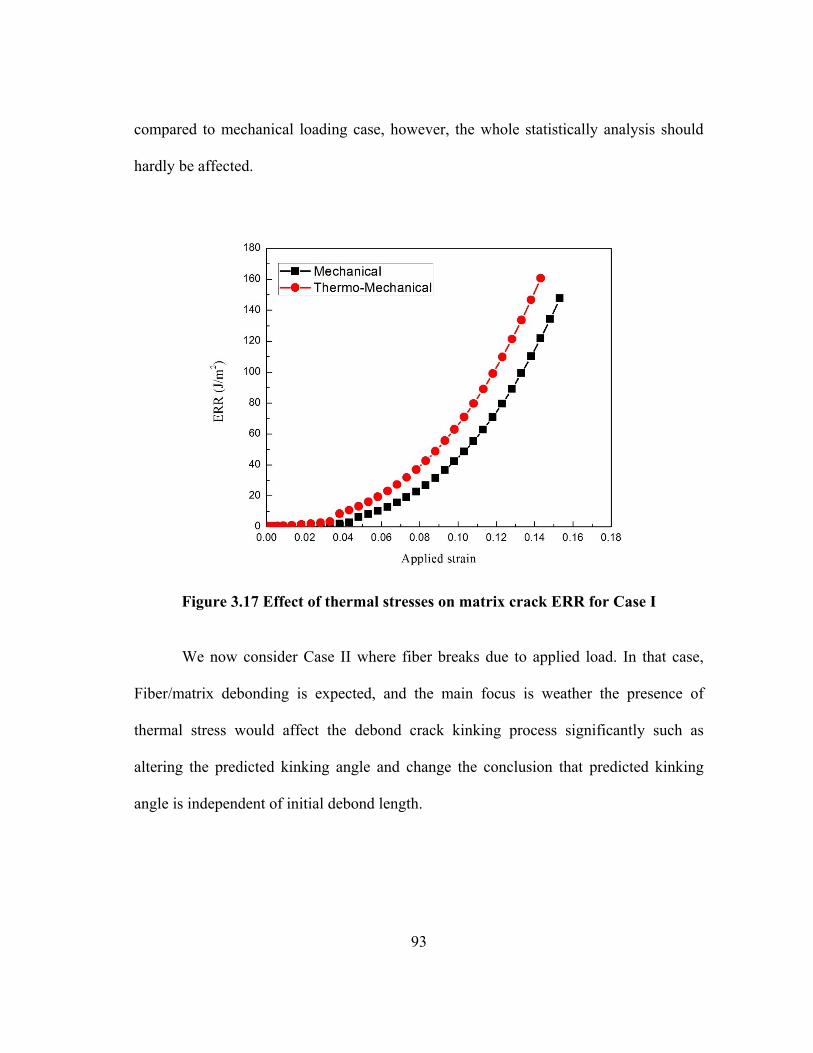
93
compared to mechanical loading case, however, the whole statistically analysis should
hardly be affected.
Figure 3.17 Effect of thermal stresses on matrix crack ERR for Case I
We now consider Case II where fiber breaks due to applied load. In that case,
Fiber/matrix debonding is expected, and the main focus is weather the presence of
thermal stress would affect the debond crack kinking process significantly such as
altering the predicted kinking angle and change the conclusion that predicted kinking
angle is independent of initial debond length.

94
Figure 3.18 Effect of thermal stress on predicted kinking angle for Case II
Figure 3.19 Variation of ERR of kinked crack for different initial debond cases
under thermo-mechanical loading for Case II

95
Figure 3.18 shows the results of predicted kinking angle against applied
mechanical strain based on maximum energy release rate criterion. It’s shown that
within small applied strain range (less than 0.2%), the predicted angle varied
significantly with increasing applied strain for each initial debond length. That was due
to the significant contribution of thermal stresses for small applied load. With the
increase of mechanical loading, the predicted angle is found to converge to the 76.8°
predicted in the present paper. Figure 3.19 shows the ERR of potential kinked crack of
the same length (0.204 µm) for four initial debond cases. It’s very clear from Figure 3.19
that the ERR of kinked crack is too small for kinking to occur at applied strain less than
0.2% and kinking is most likely to occur at higher applied load when predicted kinking
angle is almost the same for each initial debond cases at -76.8°, as indicated in Figure
3.18. As a result, it’s concluded that presence of thermal stresses has insignificant effects
on crack kinking in Case II. For matrix crack propagation and subsequent neighboring
fiber breakage, same conclusions are expected as for Case I.
3.5 Summary
In this section, possible mechanisms for the formation of a “critical fracture
plane” in UD composites with high fiber volume fraction under tensile loading has been
investigated numerically. It has been found that the critical fracture plane is most likely
to nucleate from individual broken fiber (we assumed one here). Depending on how the
broken fiber is introduced, two different cases are studied. If the critical fracture plane
nucleates from a broken fiber induced by the manufacturing process, then due to the

96
constraint of the closely spaced neighboring stiff fibers, nearly equal-triaxial stress state
developed in the matrix between fiber inhibits matrix plasticity. As a result, cavitation-
induced matrix crack initiates close to the broken fiber end upon loading and propagates
perpendicular towards the neighboring fiber upon further loading. The presence of
thermal stress is found to help facilitate the initiation of cavitation-induced matrix crack.
The fiber break and the subsequent matrix crack increase the probability of failure of the
fibers in the local region lying close to the initial broken fiber end. As a result, the
critical fracture plane would be expected to be relatively flat.
For the case of fiber breaks during loading at the weak positions along the fiber
length, fiber/matrix debonding is expected to result due to high shear stress
concentration at the broken fiber end. The length of the debond crack depends on the
fiber/matrix interface properties. In the present section, we considered the debond cracks
as longitudinal matrix cracks, which are often seen in experiments, especially for
composites with good fiber/matrix interfacial bonding. The debond crack is found to
kink out in a direction that retains Mode I fracture locally, and the kinking angle is found
to be almost constant regardless of the initial debond length even with the inclusion of
thermal stresses. As a result, once a kinked crack is formed, brittle matrix cracking
would quickly develop and propagate towards neighboring fibers. Depending on the
initial debond length, matrix cracking path varies. The matrix crack not only enhances
the stress concentration in the neighboring fibers, the crack tip also relocates the highest
stress concentration points along neighboring fibers as it approaches the fibers. This
significantly increases the probability of failure of fibers in the vicinity of the crack tip.

97
As a result, a staggered pattern of critical fracture plane is expected to form. The critical
fracture plane will be more coordinated among fibers for good fiber/matrix bonding,
while it would display more random features with longer length of pulled-out fibers for
composites with relatively weak fiber/matrix bonding.
98
4. CONCLUDING REMARKS AND RECOMMENDED FUTURE WORK
4.1 Concluding remarks
In the past few decades, fiber reinforced polymer composites have seen
themselves in virtually every aspect of industrial applications, from larger structures like
aircrafts and wind turbine blades to smaller personal items such as laptops. However, the
full potential of composite materials remains to be harnessed. Various reasons contribute
to this situation, among which the lack of understanding of their failure mechanisms
stands out the most. Due to the architecture of a composite, its properties could be
tailored to meet different design requirements by simply varying the layups or
constituents of a composite. However, such advantage also poses great challenges, as
various failure mechanisms occur simultaneously or sequentially at various length scales
when subjected to loading.
In this dissertation, we first highlighted the importance of proper understanding
on failure mechanisms in a composite in Section 1. I was demonstrated that lack of
understanding of composite failure mechanisms is one of the major causes contributing
to the overly conservative design of structural components. Meanwhile, although
investigations on failure mechanisms do not always provide accurate prediction of the
composite failure directly, they are vital for the development of failure models as they
clarify the most important parameters that govern the failure process. Without proper
consideration of those governing parameters, the accuracy of failure models is doubtful
even though they may match selected experimental data well.
99
In Section 2, we investigated the plausible failure mechanisms for UD
composites subjected to transverse tension. When the tensile load is applied to a UD
composite transversely, the composite often fails by forming transverse cracks. Based on
available experimental observations, it is generally recognized that the macro-size
transverse crack is formed by coalescence of individual fiber/matrix interfacial debond
through matrix cracking. At this moment, it is extremely difficult to clarify the exact
mechanism of fiber/matrix debonding due to the limitation of experimental techniques.
However, in the case of pure transverse tension, as stress state in the close vicinity of
fiber/matrix interface becomes equi-triaxial or nearly equi-triaxial, it is likely that
cavitation induced matrix cracking occurs and induces interface debonding.
In the present study, we only discussed the subsequent failure process after
debonding initiates, i.e. debond growth, debond crack kinking and link-up of debonds.
Two most plausible scenarios were investigated: 1. transverse crack forms from single
fiber/matrix interfacial debond and 2. transverse crack forms by link-up of multiple
debonds. For single debond scenario, its growth along interface has been investigated
thoroughly in author’s previous research and it is found that debond growth is mixed
mode for small debond angles and is Mode I dominated, and with increase of debond
angle, its growth becomes Mode II dominated and up to a certain angle (60° ~70° of half
debond angle for single debond) when debond surfaces come into contact and Mode I
component of ERR vanishes causing debond growth to stop. The debond crack kinking
has been studied and it has been found that kinking would most likely occur before
debond surfaces come into contact and the debond angle at kinking increases with

100
increasing inter-fiber distance. This angle is smaller than the angle observed in single
fiber composite case. This result was supported by a most recent published microscopic
observation conducted by a Spanish research group [91]. Once kinking occurs, the
kinked crack is found to propagate towards nearby fibers in a direction that would retain
pure Mode I growth of the kinked crack. As kinked crack propagates closer to the nearby
intact fiber, it causes high radial tensile stress concentration in that fiber, likely leading
to the initiation of a debond in that fiber. The same process of debond growth, debond
cracking and kinking crack propagation leading to the initiation of a new debond in a
neighboring fiber repeats and results in the final formation of macro-size transverse
crack. Based on the results obtained from two different inter-fiber distances, it has been
found that Scenario I is more favorable for larger inter-fiber distances. For Scenario II,
we first simplified the problem by studying the link-up of two nearby debonds. It was
found that the presence of two debonds facilitates the growth of debond, debond crack
kinking as well as kinked crack propagation. Meanwhile, it was shown that the mutual
enhancement intensified as debonded fiber got closer to each other. As a result,
transverse crack formed by Scenario II requires a much lower applied load level
compared to that in Scenario I.
Based on the discussion in Section 2, it is clear that fiber/matrix interface
properties, matrix fracture toughness as well as fiber volume fraction (in terms of inter-
fiber distance) are three material characteristics that govern the failure process of a UD
composite under transverse tension. Among all three parameters, the first two are quite
expected, however the fiber volume fraction is somewhat surprising. For UD

101
composites, there is often a misunderstanding that a higher fiber volume fraction gives
better performance. While the stiffness increases with the fiber volume fraction, the
results obtained from present study suggests that the improvement in transverse failure
does not follow. A recent study [126] by the author’s colleagues further validates the
argument as they found cavitation induced matrix cracking to occur at a much lower
strain in higher fiber volume fraction case. Again, present results prove the need to better
understand the corresponding failure mechanisms.
The transverse failure of UD composites in Section 2 is often considered as the
first failure event in a composite with general layups due to its relative low strain to
failure. For final failure of composites, it is usually controlled by the strength of UD
plies along loading direction. In Section 3, the failure mechanisms of UD composites
under longitudinal tension was discussed. Unlike transverse failure, the exact
longitudinal failure process of UD composites is difficult to observe experimentally as it
involves the breakage of individual fiber within the composites, which is impossible to
track directly other than for a small region. Recently, with the applications of X-ray
tomography, more direct experimental observations are made and it is generally
recognized that the final failure of a UD composite occurs when a so-call “critical
fracture plane” is formed and propagates unstably, leading to the separation of
composites. Based on the analytical and experimental results, it is clear that the “critical
fracture plane” only contains a small number of fibers, although the exact number of
fibers is still uncertain. For many years, research on longitudinal failure of composites
was heavily focused on the accumulation of broken fibers without properly accounting

102
for linkage of broken fibers. As a result, although various models have been proposed
and claim to be in good agreement with experimental strain to failure, they do not match
the failure characteristics observed, which makes their validity doubtful. Moreover,
broken fiber accumulation models do not provide all the information regarding materials
parameters that govern the longitudinal failure of a UD composite as fiber breakage, by
itself, does not form the “critical fracture plane”.
Realizing the discrepancy discussed above, we investigate the plausible
mechanisms responsible for “critical fracture plane” formation and try to identify the
most important material parameters that govern this formation process using an
axisymmetric FE model. Two different cases are studied: I. Fiber breaks during
manufacturing process and II. Fiber breaks during loading. For Case I, it was found that
upon loading, cavitation induced matrix cracking would most likely occur near a fiber
break. The propagation of matrix crack was then simulated based on XFEM, and it was
found that matrix crack propagates towards neighboring intact fibers in a direction
perpendicular to the tensile loading direction. The neighboring fiber breakage was
analyzed based on a statistical approach and it was found that the initial fiber break,
along with subsequent matrix crack significantly increase the probability of failure of a
local region near initial fiber break plane in neighboring fibers. As a result, it is expected
that the critical fracture plane resulting from initial manufacturing induced fiber break to
be planar. For Case II, due to the shear stress concentration, fiber/matrix interfacial
debond is expected as soon as fiber breaks. The exact length of initial debond depends
on the interface properties of composites. In Section 3, we investigated four different

103
initial debond cases and it was found that the angle at which the debond crack kinks out
is not sensitive to the length of debond. However, the subsequent matrix crack
propagation path depends highly on the debond length. The larger the initial debond, the
more tilted subsequent matrix cracking path is. When matrix crack propagates to
neighboring fibers, based on the statistical analysis, it is found that the presence of
debond results in larger positive influence region in neighboring fibers where local mean
tensile stress is higher than the nominal stresses and region closer to matrix crack tip in
neighboring fibers has higher probability of failure. As a result, for larger initial debond
case, the nearby fiber would most likely break far away from the initial fiber break
plane, resulting in a more staggered shape of “critical fracture plane”. Since the length of
initial debond is a representative of fiber/matrix interface quality, we could also
conclude that for composites with relatively poor fiber/matrix interface properties, the
“critical fracture plane” would be less planar and more fiber pull-outs are expected,
resulting in a “brush” like failure characteristics. Finally, based on the discussions on
Section 3, it is clear that the material parameters that govern the formation of “critical
fracture plane” are fiber strength and flaw distributions, matrix toughness as well as
fiber/matrix interfacial properties.
4.2 Recommended future work
The research on composite materials is a lifelong adventure, it does not stop with
the end of a PhD study. Despite the results we have at this moment, there is still much

104
more work needed to be done towards a better understanding of composite materials and
we will discuss some of the future research plans in this section.
The work presented in this dissertation intends to clarify the failure mechanisms
of UD composites under transverse and longitudinal tension and identify the most
important governing material parameters, which is vital for the future development of
failure models that could accurately capture the underlining failure characteristics and
predict the occurrence of failures with accuracy. For transverse failure, the debond
growth, debond crack kinking as well as link-up of individual debond have been
properly addressed in the present dissertation. For future research, there are two potential
areas of interests. The first one is the initiation of fiber/matrix interfacial debonding. As
discussed in Section 2, one of the most obvious causes for fiber/matrix interfacial
debonding is manufacturing induced poor fiber/matrix interfacial bonding. However, for
composites with proper fiber/matrix interfacial bonding, the exact mechanism for
debond initiation is still under debate. In order to properly investigate it, we might need
to look into smaller scales, i.e. the scale of polymer chains, which is difficult from
experimental and numerical modeling, though. The other area of interest that is more
suitable for current author to work on is to investigate if there is a critical state such as
numbers of link-up debonds beyond which transverse crack grows unstably. This is a
similar concept as the “critical fracture plane” under longitudinal tension and the results
obtained from this study would be very helpful for the future development of failure
mode that could predict the strain to failure (often based on the observation of macro-
size transverse crack) under transverse tension precisely.

105
For failure of UD composite under longitudinal tension, it is of great importance
to identify the numbers of broken fiber in a “critical fracture plane” correctly. One
should expect the number to be varied with different loading and material systems. At
this moment, majority of failure models proposed are based on the idea of accumulations
of broken fibers while ignoring the roles of fiber/matrix interfacial debonding and matrix
cracking. As a result, proposed models could not capture the exact failure characteristics.
There is no denial of the importance of fiber breakage itself, however, as shown in
Section 3, presence of fiber/matrix interfacial debonding as well as matrix cracking
determines the location where neighboring intact fibers have the highest probability of
failure. As a result, regarding future work, one of the possibility is to work on the failure
model to predict failure strain of UD composite under longitudinal tension. As major
improvement to the existing failure models, the interfacial debonding and matrix
cracking should be accounted in future models and the new statistical analysis on fiber
breakage should be able to address the influence of interface debonding and matrix
cracking on calculated probability of failure of intact fibers.

106
REFERENCES
1. Bennett, S., D. Johnson, and W. Johnson, Strength-structure relationships in
PAN-based carbon fibres. Journal of Materials Science, 1983. 18(11): p. 3337-
3347.
2. Shindo, A., Polyacrylonitrile (PAN)-based carbon fibers, in Comprehensive
Composite Materials, Anthony Kelly and C. Zweben, Editors. 2000, Elsevier. p.
1-33.
3. Csanádi, T., et al., Nanoindentation derived elastic constants of carbon fibres
and their nanostructural based predictions. Carbon, 2017. 119(Supplement C):
p. 314-325.
4. Miyagawa, H., et al., Transverse elastic modulus of carbon fibers measured by
Raman spectroscopy. Materials Science and Engineering: A, 2005. 412(1): p. 88-
92.
5. Maurin, R., et al., Transverse properties of carbon fibres by nano-indentation
and micro-mechanics. Applied Composite Materials, 2008. 15(2): p. 61.
6. Hull, D. and T. Clyne, An introduction to composite materials. 1996: Cambridge
University Press.
7. Dwight, D.W., 1.08 - Glass Fiber Reinforcements A2 - Kelly, Anthony, in
Comprehensive Composite Materials, C. Zweben, Editor. 2000, Pergamon:
Oxford. p. 231-261.
8. Kim, J.K. and Y.W. Mai, Interfaces in composites. 1993: Wiley Online Library.
9. Narkis, M., E. Chen, and R. Pipes, Review of methods for characterization of
interfacial fiber‐matrix interactions. Polymer Composites, 1988. 9(4): p. 245-
251.
10. Subramanian, S., et al., Characterization of the fiber-matrix interphase and its
influence on mechanical properties of unidirectional composites. Journal of
Composite Materials, 1996. 30(3): p. 309-332.
11. Barlow, C., J. Peacock, and A. Windle, Relationships between microstructures
and fracture energies in carbon fibre/PEEK composites. Composites, 1990.
21(5): p. 383-388.
12. Aveston, J. and A. Kelly, Theory of multiple fracture of fibrous composites.
Journal of Materials Science, 1973. 8(3): p. 352-362.
107
13. Garrett, K. and J. Bailey, Multiple transverse fracture in 90 cross-ply laminates
of a glass fibre-reinforced polyester. Journal of Materials Science, 1977. 12(1):
p. 157-168.
14. Parvizi, A. and J. Bailey, On multiple transverse cracking in glass fibre epoxy
cross-ply laminates. Journal of Materials Science, 1978. 13(10): p. 2131-2136.
15. Laws, N., G.J. Dvorak, and M. Hejazi, Stiffness changes in unidirectional
composites caused by crack systems. Mechanics of Materials, 1983. 2(2): p. 123-
37.
16. Hashin, Z., Analysis of cracked laminates: a variational approach. Mechanics of
Materials, 1985. 4(2): p. 121-136.
17. Talreja, R., Transverse cracking and stiffness reduction in composite laminates.
Journal of Composite Materials, 1985. 19(4): p. 355.
18. Nairn, J.A., The strain energy release rate of composite microcracking: a
variational approach. Journal of Composite Materials, 1989. 23(11): p. 1106-
1129.
19. Varna, J. and L. Berglund, Multiple transverse cracking and stiffness reduction
in cross-ply laminates. Journal of Composites Technology and Research, 1991.
13(2): p. 97-106.
20. Varna, J. and L.A. Berglund, Thermo-elastic properties of composite laminates
with transverse cracks. Journal of Composites Technology and Research, 1994.
16(1): p. 77-87.
21. Talreja, R. and C.V. Singh, Damage and failure of composite materials. 2012:
Cambridge University Press.
22. Tarpani, J.R., et al., Mechanical performance of carbon-epoxy laminates. Part II:
quasi-static and fatigue tensile properties. Materials Research, 2006. 9: p. 121-
130.
23. Asp, L.E., L.A. Berglund, and P. Gudmundson, Effects of a composite-like stress
state on the fracture of epoxies. Composites Science and Technology, 1995.
53(1): p. 27-37.
24. Asp, L., L.A. Berglund, and R. Talreja, A criterion for crack initiation in glassy
polymers subjected to a composite-like stress state. Composites Science and
Technology, 1996. 56(11): p. 1291-1301.

108
25. Asp, L., L.A. Berglund, and R. Talreja, Prediction of matrix-initiated transverse
failure in polymer composites. Composites Science and Technology, 1996. 56(9):
p. 1089-1097.
26. Carraro, P.A. and M. Quaresimin, Modelling fibre–matrix debonding under
biaxial loading. Composites Part A: Applied Science and Manufacturing, 2014.
61(0): p. 33-42.
27. Koyanagi, J., S. KIMURA, and H. KAWADA, Mixed-mode interfacial
debonding simulation in single-fiber composite under a transverse load. Journal
of Solid Mechanics and Materials Engineering, 2009. 3(5): p. 796-806.
28. Ghosh, S., et al., Interfacial debonding analysis in multiple fiber reinforced
composites. Mechanics of Materials, 2000. 32(10): p. 561-591.
29. Zhandarov, S. and E. Mäder, Characterization of fiber/matrix interface strength:
applicability of different tests, approaches and parameters. Composites Science
and Technology, 2005. 65(1): p. 149-160.
30. Gamstedt, E. and B. Sjögren, Micromechanisms in tension-compression fatigue
of composite laminates containing transverse plies. Composites Science and
Technology, 1999. 59(2): p. 167-178.
31. Romanov, V.S., et al., Modelling evidence of stress concentration mitigation at
the micro-scale in polymer composites by the addition of carbon nanotubes.
Carbon, 2015. 82: p. 184-194.
32. Toya, M., A crack along the interface of a circular inclusion embedded in an
infinite solid. Journal of the Mechanics and Physics of Solids, 1974. 22(5): p.
325-348.
33. París, F., J. Cano, and J. Varna, The fiber-matrix interface crack—a numerical
analysis using boundary elements. International Journal of Fracture, 1990. 82(1):
p. 11-29.
34. Varna, J., L. Berglund, and M. Ericson, Transverse single-fibre test for
interfacial debonding in composites: 2. Modelling. Composites Part A: Applied
Science and Manufacturing, 1997. 28(4): p. 317-326.
35. Varna, J., F. Paris, and J.C. del Cano, The effect of crack-face contact on
fiber/matrix debonding in transverse tensile loading. Composites Science and
Technology, 1997. 57(5): p. 523-532.

109
36. García, I.G., V. Mantič, and E. Graciani, Debonding at the fibre–matrix interface
under remote transverse tension. One debond or two symmetric debonds?
European Journal of Mechanics - A/Solids, 2015. 53: p. 75-88.
37. Mantič, V., et al., A linear elastic-brittle interface model: application for the
onset and propagation of a fibre-matrix interface crack under biaxial transverse
loads. International Journal of Fracture, 2015. 195(1-2): p. 15-38.
38. Muñoz-Reja, M., et al., Crack onset and propagation at fibre–matrix elastic
interfaces under biaxial loading using finite fracture mechanics. Composites Part
A: Applied Science and Manufacturing, 2015.
39. París, F., E. Correa, and V. Mantič, Kinking of transversal interface cracks
between fiber and matrix. Journal of Applied Mechanics, 2007. 74(4): p. 703-
716.
40. Sandino, C., E. Correa, and F. París, Numerical analysis of the influence of a
nearby fibre on the interface crack growth in composites under transverse tensile
load. Engineering Fracture Mechanics, 2016. 168, Part B: p. 58-75.
41. Tanaka, M., et al., Influence of non-uniform fiber arrangement on tensile fracture
behavior of unidirectional fiber/epoxy model composites. Composite Interfaces,
2005. 12(3-4): p. 365-378.
42. Vaughan, T.J. and C.T. McCarthy, Micromechanical modelling of the transverse
damage behaviour in fibre reinforced composites. Composites Science and
Technology, 2011. 71(3): p. 388-396.
43. Yang, L., et al., Microscopic failure mechanisms of fiber-reinforced polymer
composites under transverse tension and compression. Composites Science and
Technology, 2012. 72(15): p. 1818-1825.
44. Zhang, T. and Y. Yan, Micromechanical analysis of transverse damage of fibre-
reinforced composites. Composite Interfaces, 2016. 23(1): p. 75-88.
45. Zhang, H., et al., Transverse single-fibre test for interfacial debonding in
composites: 1. Experimental observations. Composites Part A: Applied Science
and Manufacturing, 1997. 28(4): p. 309-315.
46. Rosen, B.W., Tensile failure of fibrous composites. AIAA journal, 1964. 2(11):
p. 1985-1991.
47. Zweben, C., Tensile failure of fiber composites. AIAA journal, 1968. 6(12): p.
2325-2331.
110
48. Zweben, C. and B.W. Rosen, A statistical theory of material strength with
application to composite materials. Journal of the Mechanics and Physics of
Solids, 1970. 18(3): p. 189-206.
49. Harlow, D.G. and S.L. Phoenix, The chain-of-bundles probability model for the
strength of fibrous materials I: analysis and conjectures. Journal of Composite
Materials, 1978. 12(2): p. 195-214.
50. Harlow, D.G. and S.L. Phoenix, The chain-of-bundles probability model for the
strength of fibrous materials II: a numerical study of convergence. Journal of
Composite Materials, 1978. 12(3): p. 314-334.
51. Batdorf, S., Tensile strength of unidirectionally reinforced composites—I.
Journal of reinforced plastics and composites, 1982. 1(2): p. 153-164.
52. Batdorf, S. and R. Ghaffarian, Tensile strength of unidirectionally reinforced
composites—II. Journal of Reinforced Plastics and Composites, 1982. 1(2): p.
165-176.
53. Wisnom, M.R. and D. Green, Tensile failure due to interaction between fibre
breaks. Composites, 1995. 26(7): p. 499-508.
54. Purslow, D., Some fundamental aspects of composites fractography. Composites,
1981. 12(4): p. 241-247.
55. Blassiau, S., A. Thionnet, and A.R. Bunsell, Micromechanisms of load transfer
in a unidirectional carbon fibre–reinforced epoxy composite due to fibre failures.
Part 1: Micromechanisms and 3D analysis of load transfer: The elastic case.
Composite Structures, 2006. 74(3): p. 303-318.
56. Blassiau, S., A. Thionnet, and A.R. Bunsell, Micromechanisms of load transfer
in a unidirectional carbon fibre–reinforced epoxy composite due to fibre failures.
Part 2: Influence of viscoelastic and plastic matrices on the mechanisms of load
transfer. Composite Structures, 2006. 74(3): p. 319-331.
57. Thionnet, A., H.Y. Chou, and A. Bunsell, Fibre break processes in
unidirectional composites. Composites Part A: Applied Science and
Manufacturing, 2014. 65: p. 148-160.
58. Thionnet, A., H.-Y. Chou, and A. Bunsell, Fibre Break Failure Processes in
Unidirectional Composites. Part 1: Failure and Critical Damage State Induced
by Increasing Tensile Loading. Applied Composite Materials, 2014. 22(2): p.
119-140.

111
59. Swolfs, Y., I. Verpoest, and L. Gorbatikh, Issues in strength models for
unidirectional fibre-reinforced composites related to Weibull distributions, fibre
packings and boundary effects. Composites Science and Technology, 2015. 114:
p. 42-49.
60. Swolfs, Y., I. Verpoest, and L. Gorbatikh, A review of input data and modelling
assumptions in longitudinal strength models for unidirectional fibre-reinforced
composites. Composite Structures, 2016. 150: p. 153-172.
61. Vanegas-Jaramillo, J.D., et al., Analytical model for predicting the tensile
strength of unidirectional composites based on the density of fiber breaks.
Composites Part B: Engineering, 2018. 141: p. 84-91.
62. Aroush, D.R.-B., et al., A study of fracture of unidirectional composites using in
situ high-resolution synchrotron X-ray microtomography. Composites Science
and Technology, 2006. 66(10): p. 1348-1353.
63. Scott, A., et al., In situ fibre fracture measurement in carbon–epoxy laminates
using high resolution computed tomography. Composites Science and
Technology, 2011. 71(12): p. 1471-1477.
64. Scott, A., et al., Damage accumulation in a carbon/epoxy composite:
Comparison between a multiscale model and computed tomography
experimental results. Composites Part A: Applied Science and Manufacturing,
2012. 43(9): p. 1514-1522.
65. Garcea, S.C., et al., Fatigue micromechanism characterisation in carbon fibre
reinforced polymers using synchrotron radiation computed tomography.
Composites Science and Technology, 2014. 99: p. 23-30.
66. Swolfs, Y., et al., Synchrotron radiation computed tomography for experimental
validation of a tensile strength model for unidirectional fibre-reinforced
composites. Composites Part A: Applied Science and Manufacturing, 2015. 77:
p. 106-113.
67. Garcea, S.C., I. Sinclair, and S.M. Spearing, Fibre failure assessment in carbon
fibre reinforced polymers under fatigue loading by synchrotron X-ray computed
tomography. Composites Science and Technology, 2016. 133: p. 157-164.
68. Na, W., D. Kwon, and W.-R. Yu, X-ray computed tomography observation of
multiple fiber fracture in unidirectional CFRP under tensile loading. Composite
Structures, 2018. 188: p. 39-47.

112
69. http://www.fibremodproject.eu/news-and-blogs/item/let-us-stop-the-hypocrisy-of-
-nicely-matching-experimental-validations
70. Rybicki, E.F. and M. Kanninen, A finite element calculation of stress intensity
factors by a modified crack closure integral. Engineering Fracture Mechanics,
1977. 9(4): p. 931-938.
71. Krueger, R., Virtual crack closure technique: History, approach, and
applications. Applied Mechanics Reviews, 2004. 57: p. 109.
72. Krueger, R. and D. Goetze, Influence of finite element software on energy release
rates computed using the virtual crack closure technique. 2006: National
Aeronautics and Space Administration, Langley Research Center.
73. Moës, N., J. Dolbow, and T. Belytschko, A finite element method for crack
growth without remeshing. International Journal for Numerical Methods in
Engineering, 1999. 46(1): p. 131-150.
74. Zhuang, L., R. Talreja, and J. Varna, Transverse crack formation in
unidirectional composites by linking of fibre/matrix debond cracks. Composites
Part A: Applied Science and Manufacturing, 2018. 107: p. 294-303.
75. Zhuang, L., R. Talreja, and J. Varna, Tensile failure of unidirectional composites
from a local fracture plane. Composites Science and Technology, 2016. 133: p.
119-127.
76. Hobbiebrunken, T., et al., Evaluation of interfacial strength in CF/epoxies using
FEM and in-situ experiments. Composites Part A: Applied Science and
Manufacturing, 2006. 37(12): p. 2248-2256.
77. Mantič, V., Interface crack onset at a circular cylindrical inclusion under a
remote transverse tension. Application of a coupled stress and energy criterion.
International journal of Solids and Structures, 2009. 46(6): p. 1287-1304.
78. Kushch, V.I., et al., Numerical simulation of progressive debonding in fiber
reinforced composite under transverse loading. International Journal of
Engineering Science, 2011. 49(1): p. 17-29.
79. Bouhala, L., et al., Modelling of failure in long fibres reinforced composites by
X-FEM and cohesive zone model. Composites Part B: Engineering, 2013. 55: p.
352-361.
80. Neogi, A., N. Mitra, and R. Talreja, Cavitation in epoxies under composite-like
stress states. Composites Part A: Applied Science and Manufacturing, 2017.

113
81. Pupurs, A. and J. Varna, Steady-state energy release rate for fiber/matrix
interface debond growth in unidirectional composites. International Journal of
Damage Mechanics, 2015: p. 1056789515624000.
82. ANSYS Academic Research, Release 16.0. 2016: Canonsburg, Pennsylvania.
83. Sun, C.T. and C.J. Jih, On strain energy release rates for interfacial cracks in bi-
material media. Engineering Fracture Mechanics, 1987. 28(1): p. 13-20.
84. Raju, I.S., J.H. Crews, and M.A. Aminpour, Convergence of strain energy
release rate components for Edge-Delaminated composite laminates.
Engineering Fracture Mechanics, 1988. 30(3): p. 383-396.
85. Sun, C. and M. Manoharan, Strain energy release rates of an interfacial crack
between two orthotropic solids. Journal of Composite Materials, 1989. 23(5): p.
460-478.
86. Zhuang, L., et al., Effects of Inter-Fiber Spacing on Fiber-matrix Debond Crack
Growth in Unidirectional Composites under Transverse Loading Composites:
Part A, 2017. Submitted.
87. Martyniuk, K., et al., 3D in situ observations of glass fibre/matrix interfacial
debonding. Composites Part A: Applied Science and Manufacturing, 2013. 55: p.
63-73.
88. He, M.-Y. and J.W. Hutchinson, Kinking of a crack out of an interface. Journal
of Applied Mechanics, 1989. 56(2): p. 270-278.
89. Whitcomb, J.D. Strain-energy release rate analysis of cyclic delamination
growth in compressively loaded laminates. 1984. ASTM International.
90. Xie, D., et al., Fracture criterion for kinking cracks in a tri-material adhesively
bonded joint under mixed mode loading. Engineering Fracture Mechanics, 2005.
72(16): p. 2487-2504.
91. Correa, E., et al., Microscopical observations of inter-fibre failure under tension.
Composites Science and Technology, 2018. 155: p. 213-220.
92. Zhuang, L., R. Talreja, and J. Varna, Effect of cooldown induced fiber/matrix
interfacial disbond on transverse failure in composites, in 32nd ASC Technical
Conference, 2017, West Lafayette, Indiana.
93. Wood, C. and W. Bradley, Determination of the effect of seawater on the
interfacial strength of an interlayer E-glass/graphite/epoxy composite by in situ

114
observation of transverse cracking in an environmental SEM. Composites
science and technology, 1997. 57(8): p. 1033-1043.
94. Wisnom, M., et al., Mechanisms generating residual stresses and distortion
during manufacture of polymer–matrix composite structures. Composites Part A:
Applied Science and Manufacturing, 2006. 37(4): p. 522-529.
95. Pupurs, A., et al., Interface debond crack growth in tension–tension cyclic
loading of single fiber polymer composites. Composites Part A: Applied Science
and Manufacturing, 2013. 44: p. 86-94.
96. Sjögren, B. and L.A. Berglund, The effects of matrix and interface on damage in
GRP cross-ply laminates. Composites Science and Technology, 2000. 60(1): p.
9-21.
97. Awerbuch, J. and H. Hahn, Fatigue and proof-testing of unidirectional
graphite/epoxy composite, in Fatigue of Filamentary Composite Materials. 1977,
ASTM International.
98. Zhuang, L. and A. Pupurs. Effect of neighboring fibers on energy release rate
during fiber/matrix debond growth. in 16th European Conference on Composite
Materials, ECCM 2014. 2014.
99. Judd, N. and W. Wright, Voids and their effects on the mechanical properties of
composites- an appraisal. Sampe Journal, 1978. 14: p. 10-14.
100. Bowles, K.J. and S. Frimpong, Void effects on the interlaminar shear strength of
unidirectional graphite-fiber-reinforced composites. Journal of Composite
Materials, 1992. 26(10): p. 1487.
101. Varna, J., et al., Effect of voids on failure mechanisms in RTM laminates.
Composites Science and Technology, 1995. 53(2): p. 241-249.
102. Huang, H. and R. Talreja, Effects of void geometry on elastic properties of
unidirectional fiber reinforced composites. Composites Science and Technology,
2005. 65(13): p. 1964-1981.
103. Talreja, R., Defect damage mechanics: broader strategy for performance
evaluation of composites. Plastics, Rubber and Composites, 38, 2009. 2(4): p. 49-
54.
104. Zhuang, L. and R. Talreja, Effects of voids on postbuckling delamination growth
in unidirectional composites. International Journal of Solids and Structures,
2014. 51(5): p. 936-944.

115
105. ABAQUS/Standard User's Manual. Version 6.12.
106. Sih, G.C., Strain-energy-density factor applied to mixed mode crack problems.
International Journal of fracture, 1974. 10(3): p. 305-321.
107. Theocaris, P., The caustic as a means to define the core region in brittle fracture.
Engineering Fracture Mechanics, 1981. 14(2): p. 353-362.
108. Theocaris, P., Experimental determination of the core region in mixed-mode
fracture, in Mixed Mode Crack Propagation. 1981, Sijthoff and Noordhoff. p.
21-36.
109. Theocaris, P.S. and N.P. Andrianopoulos, The mises elastic-plastic boundary as
the core region in fracture criteria. Engineering Fracture Mechanics, 1982.
16(3): p. 425-432.
110. Sih, G., A special theory of crack propagation, in Mechanics of Fracture
Initiation and Propagation. 1991, Springer. p. 1-22.
111. Lorenzo, L. and H.T. Hahn, Fatigue failure mechanisms in unidirectional
composites. Composite Materials: Fatigue and Fracture, 1986: p. 210-232.
112. Maligno, A.R., N.A. Warrior, and A.C. Long, Effects of inter-fibre spacing on
damage evolution in unidirectional (UD) fibre-reinforced composites. European
Journal of Mechanics - A/Solids, 2009. 28(4): p. 768-776.
113. Evans, A.G., M.Y. He, and J.W. Hutchinson, Interface debonding and fiber
cracking in brittle matrix composites. Journal of the American Ceramic Society,
1989. 72(12): p. 2300-2303.
114. Hedgepeth, J.M. and P. Van Dyke, Local stress concentrations in imperfect
filamentary composite materials. Journal of composite materials, 1967. 1(3): p.
294-309.
115. Nedele, M.R. and M.R. Wisnom, Three-dimensional finite element analysis of
the stress concentration at a single fibre break. Composites Science and
Technology, 1994. 51(4): p. 517-524.
116. Beyerlein, I.J. and S.L. Phoenix, Stress concentrations around multiple fiber
breaks in an elastic matrix with local yielding or debonding using quadratic
influence superposition. Journal of the Mechanics and Physics of Solids, 1996.
44(12): p. 1997-2039.

116
117. Ohno, N., S. Okabe, and T. Okabe, Stress concentrations near a fiber break in
unidirectional composites with interfacial slip and matrix yielding. International
Journal of Solids and Structures, 2004. 41(16): p. 4263-4277.
118. Hedgepeth, J.M., Stress concentrations in filamentary structures. NASA TND-
882, 1961.
119. Nedele, M. and M. Wisnom, Stress concentration factors around a broken fibre
in a unidirectional carbon fibre-reinforced epoxy. Composites, 1994. 25(7): p.
549-557.
120. Scop, P.M. and A.S. Argon, Statistical theory of strength of laminated
composites II. Journal of composite materials, 1969. 3(1): p. 30-47.
121. Beyerlein, I.J. and S.L. Phoenix, Statistics for the strength and size effects of
microcomposites with four carbon fibers in epoxy resin. Composites Science and
Technology, 1996. 56(1): p. 75-92.
122. Talreja, R., Fatigue of composite materials: damage mechanisms and fatigue-life
diagrams. Proceedings of the Royal Society of London. A. Mathematical and
Physical Sciences, 1981. 378(1775): p. 461-475.
123. Gamstedt, E. and R. Talreja, Fatigue damage mechanisms in unidirectional
carbon-fibre-reinforced plastics. Journal of Materials Science, 1999. 34(11): p.
2535-2546.
124. Gamstedt, E.K., L.A. Berglund, and T. Peijs, Fatigue mechanisms in
unidirectional glass-fibre-reinforced polypropylene. Composites Science and
Technology, 1999. 59(5): p. 759-768.
125. Dundurs, J., Discussion: “Edge-Bonded Dissimilar Orthogonal Elastic Wedges
Under Normal and Shear Loading” (Bogy, D. B., 1968, ASME J. Appl. Mech.,
35, pp. 460–466). Journal of Applied Mechanics, 1969. 36(3): p. 650-652.
126. Elnekhaily, S.A. and R. Talreja, Damage initiation in unidirectional fiber
composites with different degrees of nonuniform fiber distribution. Composites
Science and Technology, 2018. 155: p. 22-32.