Embed Size (px)
Citation preview

The document was prepared using best effort. The authors make no warranty of any kind and shall not be liable in any event for incidental or consequential damages in connection with the application of the document.
© All rights on the format of this technical report reserved.
Failure Modes, Effects and Diagnostic Analysis
Project: Isolating Transducers IM33-**(Ex)-Hi/24VDC and Analog Signal
Transmitters IM35-**Ex-Hi/24VDC
Customer:
Hans Turck GmbH & Co. KG Mühlheim Germany
Contract No.: TURCK 04/07-14 Report No.: TURCK 04/07-14 R001
Version V2, Revision R0, February 2013 Stephan Aschenbrenner

© exida.com GmbH TURCK 04-07-14 R001 V2R0.doc; February 8, 2013 Stephan Aschenbrenner Page 2 of 4
Management summary This report summarizes the results of the hardware assessment carried out on the Isolating Transducers IM33-**(Ex)-Hi/24VDC and Analog Signal Transmitters IM35-**Ex-Hi/24VDC.
Table 1 gives an overview of the different versions that belong to the considered devices.
The hardware assessment consists of a Failure Modes, Effects and Diagnostics Analysis (FMEDA). A FMEDA is one of the steps taken to achieve functional safety assessment of a device per IEC 61508. From the FMEDA, failure rates are determined and consequently the Safe Failure Fraction (SFF) is calculated for the device. For full assessment purposes all requirements of IEC 61508 must be considered.
Table 1: Version overview
Type Description Parts List / Circuit Diagram
IM33-11Ex-Hi/24VDC IM33-11-Hi/24VDC
1 input / 1 output 12260705 / 2260700 Ind. A of 28.06.04
IM33-12Ex-Hi/24VDC 1 input / 2 outputs 12260704 and 12263704 / 12260700 Ind. A of 28.06.04
IM33-22Ex-Hi/24VDC IM33-22-Hi/24VDC
2 inputs / 2 outputs 12260703 and 12263703 / 12260700 Ind. A of 28.06.04
IM35-11Ex-Hi/24VDC 1 input / 1 output 12280003 / 12280000 Ind. – of 17.10.03
IM35-22Ex-Hi/24VDC 2 inputs / 2 outputs 12280001 and 12280101 / 12280000 Ind. – of 17.10.03
The failure rates used in this analysis are the basic failure rates from the Siemens standard SN 29500.
According to table 2 of IEC 61508-1 the average PFD for systems operating in low demand mode has to be ≥10-3 to < 10-2 for SIL 2 safety functions. However, as the modules under consideration are only one part of an entire safety function they should not claim more than 10% of this range, i.e. they should be better than or equal to 1,00E-03.
The Isolating Transducers IM33-**(Ex)-Hi/24VDC and Analog Signal Transmitters IM35-**Ex-Hi/24VDC are considered to be Type A1 components with a hardware fault tolerance of 0.
For Type A components the SFF has to be 60% to < 90% according to table 2 of IEC 61508-2 for SIL 2 (sub-) systems with a hardware fault tolerance of 0.
Assuming that a connected safety logic solver to the Isolating Transducers IM33-**(Ex)-Hi/24VDC can detect both over-range (fail high) and under-range (fail low), high and low failures can be classified as safe detected failures or dangerous detected failures depending on the application (see section 4.2.4). The following tables show how the above stated requirements are fulfilled based on the different applications.
1 Type A component: “Non-complex” component (all failure modes are well defined); for details see 7.4.3.1.2 of IEC 61508-2.
© exida.com GmbH TURCK 04-07-14 R001 V2R0.doc; February 8, 2013 Stephan Aschenbrenner Page 3 of 4
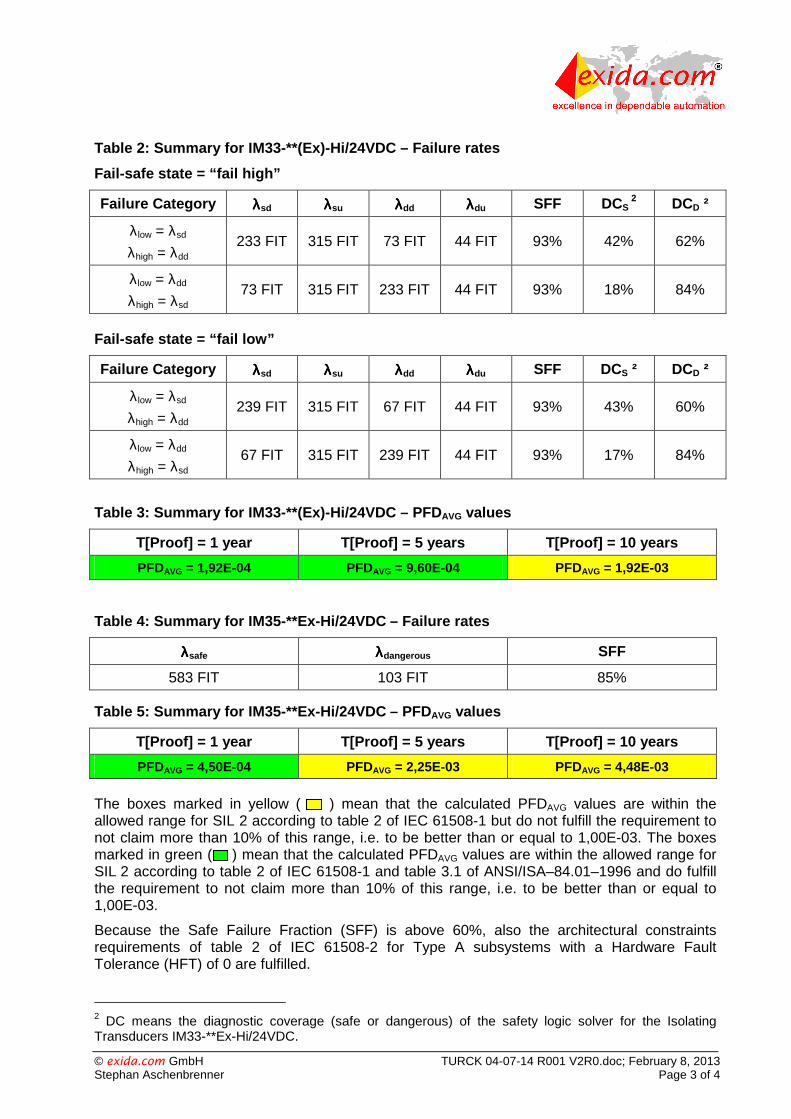
Table 2: Summary for IM33-**(Ex)-Hi/24VDC – Failure rates
Fail-safe state = “fail high”
Failure Category λλλλsd λλλλsu λλλλdd λλλλdu SFF DCS 2 DCD ²
λlow = λsd
λhigh = λdd 233 FIT 315 FIT 73 FIT 44 FIT 93% 42% 62%
λlow = λdd
λhigh = λsd 73 FIT 315 FIT 233 FIT 44 FIT 93% 18% 84%
Fail-safe state = “fail low”
Failure Category λλλλsd λλλλsu λλλλdd λλλλdu SFF DCS ² DCD ²
λlow = λsd
λhigh = λdd 239 FIT 315 FIT 67 FIT 44 FIT 93% 43% 60%
λlow = λdd
λhigh = λsd 67 FIT 315 FIT 239 FIT 44 FIT 93% 17% 84%
Table 3: Summary for IM33-**(Ex)-Hi/24VDC – PFD AVG values
T[Proof] = 1 year T[Proof] = 5 years T[Proof] = 10 years
PFDAVG = 1,92E-04 PFDAVG = 9,60E-04 PFDAVG = 1,92E-03
Table 4: Summary for IM35-**Ex-Hi/24VDC – Failure rates
λλλλsafe λλλλdangerous SFF
583 FIT 103 FIT 85%
Table 5: Summary for IM35-**Ex-Hi/24VDC – PFDAVG values
T[Proof] = 1 year T[Proof] = 5 years T[Proof] = 10 years
PFDAVG = 4,50E-04 PFDAVG = 2,25E-03 PFDAVG = 4,48E-03
The boxes marked in yellow ( ) mean that the calculated PFDAVG values are within the allowed range for SIL 2 according to table 2 of IEC 61508-1 but do not fulfill the requirement to not claim more than 10% of this range, i.e. to be better than or equal to 1,00E-03. The boxes marked in green ( ) mean that the calculated PFDAVG values are within the allowed range for SIL 2 according to table 2 of IEC 61508-1 and table 3.1 of ANSI/ISA–84.01–1996 and do fulfill the requirement to not claim more than 10% of this range, i.e. to be better than or equal to 1,00E-03.
Because the Safe Failure Fraction (SFF) is above 60%, also the architectural constraints requirements of table 2 of IEC 61508-2 for Type A subsystems with a Hardware Fault Tolerance (HFT) of 0 are fulfilled.
2 DC means the diagnostic coverage (safe or dangerous) of the safety logic solver for the Isolating Transducers IM33-**Ex-Hi/24VDC.

© exida.com GmbH TURCK 04-07-14 R001 V2R0.doc; February 8, 2013 Stephan Aschenbrenner Page 4 of 4
The two channels on a redundant board shall not be used to increase the hardware fault tolerance needed for a higher SIL as they contain common components.
A user of the Isolating Transducers IM33-**(Ex)-Hi/24VDC and Analog Signal Transmitters IM35-**Ex-Hi/24VDC can utilize these failure rates in a probabilistic model of a safety instrumented function (SIF) to determine suitability in part for safety instrumented system (SIS) usage in a particular safety integrity level (SIL). A full table of failure rates is presented in sections 5.1 and 5.2 along with all assumptions.
The failure rates are valid for the useful life of the Isolating Transducers IM33-**(Ex)-Hi/24VDC and Analog Signal Transmitters IM35-**Ex-Hi/24VDC, which is estimated to be between 8 and 12 years (see Appendix 2).
It is important to realize that the “no effect” failures are included in the “safe undetected” failure category according to IEC 61508. Note that these failures on its own will not affect system reliability or safety, and should not be included in spurious trip calculations.

© exida.com GmbH TURCK 04-07-14 R001 V2R0.doc; February 8, 2013 Stephan Aschenbrenner Page 5 of 25
Table of Contents
Management summary .................................................................................................... 2
1 Purpose and Scope ................................................................................................... 6
2 Project management .................................................................................................. 7
2.1 exida.com .......................................................................................................... 7
2.2 Roles of the parties involved .............................................................................. 7
2.3 Standards / Literature used ................................................................................ 7
2.4 Reference documents ........................................................................................ 8
2.4.1 Documentation provided by the customer ................................................ 8
2.4.2 Documentation generated by exida.com .................................................. 8
3 Description of the analyzed module ........................................................................... 9
3.1 Isolating Transducers IM33-22Ex-Hi/24VDC ...................................................... 9
3.2 Analog Signal Transmitter IM35-22Ex-Hi/24VDC ............................................. 10
4 Failure Modes, Effects, and Diagnostic Analysis ..................................................... 11
4.1 Description of the failure categories ................................................................. 11
4.2 Methodology – FMEDA, Failure rates .............................................................. 12
4.2.1 FMEDA ................................................................................................... 12
4.2.2 Failure rates ............................................................................................ 12
4.2.3 Assumptions ........................................................................................... 12
4.2.4 Example explaining the behavior of the safety logic solver .................... 13
5 Results of the assessment ....................................................................................... 14
5.1 Isolating Transducers IM33-**(Ex)-Hi/24VDC ................................................... 15
5.2 Analog Signal Transmitters IM35-**Ex-Hi/24VDC ............................................ 17
6 Terms and Definitions .............................................................................................. 19
7 Status of the document ............................................................................................ 20
7.1 Liability ............................................................................................................. 20
7.2 Releases .......................................................................................................... 20
7.3 Release Signatures .......................................................................................... 20
Appendix 1: Possibilities to reveal dangerous undetected faults during the proof test .. 21
Appendix 1.1: Possible proof tests to detect dangerous undetected faults............. 23
Appendix 2: Impact of lifetime of critical components on the failure rate ....................... 25

© exida.com GmbH TURCK 04-07-14 R001 V2R0.doc; February 8, 2013 Stephan Aschenbrenner Page 6 of 25
1 Purpose and Scope Generally three options exist when doing an assessment of sensors, interfaces and/or final elements.
Option 1: Hardware assessment according to IEC 61508
Option 1 is a hardware assessment by exida.com according to the relevant functional safety standard(s) like DIN V VDE 0801, IEC 61508 or EN 954-1. The hardware assessment consists of a FMEDA to determine the fault behavior and the failure rates of the device, which are then used to calculate the Safe Failure Fraction (SFF) and the average Probability of Failure on Demand (PFDAVG). This option for pre-existing hardware devices shall provide the safety instrumentation engineer with the required failure data as per IEC 61508 / IEC 61511 and does not consist of an assessment of the software development process
Option 2: Hardware assessment with proven-in-use consideration according to IEC 61508 / IEC 61511
Option 2 is an assessment by exida.com according to the relevant functional safety standard(s) like DIN V VDE 0801, IEC 61508 or EN 954-1. The hardware assessment consists of a FMEDA to determine the fault behavior and the failure rates of the device, which are then used to calculate the Safe Failure Fraction (SFF) and the average Probability of Failure on Demand (PFDAVG). In addition this option consists of an assessment of the proven-in-use documentation of the device and its software including the modification process. This option for pre-existing programmable electronic devices shall provide the safety instrumentation engineer with the required failure data as per IEC 61508 / IEC 61511 and justify the reduced fault tolerance requirements of IEC 61511 for sensors, final elements and other PE field devices.
Option 3: Full assessment according to IEC 61508
Option 3 is a full assessment by exida.com according to the relevant application standard(s) like IEC 61511 or EN 298 and the necessary functional safety standard(s) like DIN V VDE 0801, IEC 61508 or EN 954-1. The full assessment extends option 1 by an assessment of all fault avoidance and fault control measures during hardware and software development. This option is most suitable for newly developed software based field devices and programmable controllers to demonstrate full compliance with IEC 61508 to the end-user.
This assessment shall be done according to option 1 .
This document shall describe the results of the hardware assessment carried out on the Isolating Transducers IM33-**(Ex)-Hi/24VDC and Analog Signal Transmitters IM35-**Ex-Hi/24VDC. It shall be assessed whether the described Isolating Transducers and Analog Signal Transmitters meet the average Probability of Failure on Demand (PFDAVG) requirements and the architectural constraints for SIL 2 sub-systems according to IEC 61508.
It does not consider any calculations necessary for proving intrinsic safety.

© exida.com GmbH TURCK 04-07-14 R001 V2R0.doc; February 8, 2013 Stephan Aschenbrenner Page 7 of 25
2 Project management
2.1 exida.com
exida.com is one of the world’s leading knowledge companies specializing in automation system safety and availability with over 100 years of cumulative experience in functional safety. Founded by several of the world’s top reliability and safety experts from assessment organizations like TUV and manufacturers, exida.com is a partnership with offices around the world. exida.com offers training, coaching, project oriented consulting services, internet based safety engineering tools, detail product assurance and certification analysis and a collection of on-line safety and reliability resources. exida.com maintains a comprehensive failure rate and failure mode database on process equipment.
2.2 Roles of the parties involved
Werner Turck GmbH & Co. KG Manufacturer of the considered Isolating Transducers and Analog Signal Transmitters.
exida.com Performed the hardware assessment according to option 1 (see section 1).
Werner Turck GmbH & Co. KG contracted exida.com in August 2004 with the FMEDA and PFDAVG calculation of the above mentioned device.
2.3 Standards / Literature used The services delivered by exida.com were performed based on the following standards / literature.
[N1] IEC 61508-2:2000 Functional Safety of Electrical/Electronic/Programmable Electronic Safety-Related Systems
[N2] ISBN: 0471133019 John Wiley & Sons
Electronic Components: Selection and Application Guidelines by Victor Meeldijk
[N3] FMD-91, RAC 1991 Failure Mode / Mechanism Distributions
[N4] FMD-97, RAC 1997 Failure Mode / Mechanism Distributions
[N5] NPRD-95, RAC Non-electronic Parts – Reliability Data 1995
[N6] SN 29500 Failure rates of components

© exida.com GmbH TURCK 04-07-14 R001 V2R0.doc; February 8, 2013 Stephan Aschenbrenner Page 8 of 25
2.4 Reference documents
2.4.1 Documentation provided by the customer
[D1] im33_12Ex_Hi.pdf Description of the working principle
[D2] im35_12Ex_Hi.pdf Description of the working principle
[D3] Datenblatt IM33.pdf Data sheet
[D4] Datenblatt IM35.pdf Data sheet
[D5] IM33_Blocksch.pdf Page 7 of circuit diagram “IM33-22-Ex0-Hi/24DC 12260700 Ind. A”
[D6] NetzteilIM33.pdf Page 8 of circuit diagram “IM33-22-Ex0-Hi/24DC 12260700 Ind. A ”
[D7] IM33_E1_Basis.pdf Page 9 of circuit diagram “IM33-22-Ex0-Hi/24DC 12260700 Ind. A”
[D8] IM33_E2_Modul.pdf Page 8 of circuit diagram “IM33-22 Modul 12263700 Ind. A”
[D9] IM33_A1_Basis.pdf Page 10 of circuit diagram “IM33-22-Ex0-Hi/24DC 12260700 Ind. A”
[D10] IM33_A2_Modul.pdf Page 7 of circuit diagram “IM33-22 Modul 12263700 Ind. A”
[D11] IM35_Blocksch.pdf Page 7 of circuit diagram “IM35-22-Ex0-Hi(U)/24DC 12280000”
[D12] NetzteilIM35.pdf Page 10 of circuit diagram “IM35-22-Ex0-Hi(U)/24DC 12280000”
[D13] IM35_E1_Basis.pdf Page 9 of circuit diagram “IM35-22-Ex0-Hi(U)/24DC 12280000”
[D14] IM35_E2_Modul.pdf Page 7 of circuit diagram “IM35-22 Modul 12280100”
[D15] IM35_A1_Basis.pdf Page 8 of circuit diagram “IM35-22-Ex0-Hi(U)/24DC 12280000”
[D16] IM35_A2_Modul.pdf Page 8 of circuit diagram “IM35-22 Modul 12280100”
2.4.2 Documentation generated by exida.com
[R1] FMEDA V6 IM33-22-Ex0-Hi-24DC V0 R1.2.xls of 04.11.04
[R2] FMEDA V6 IM35-22Ex0-HiU-24DC V0 R1.2.xls of 04.11.04

© exida.com GmbH TURCK 04-07-14 R001 V2R0.doc; February 8, 2013 Stephan Aschenbrenner Page 9 of 25
3 Description of the analyzed module
3.1 Isolating Transducers IM33-22Ex-Hi/24VDC
The isolating transducer IM33-22Ex-Hi/24VDC is used to energize intrinsically safe 2-wire HART® transducers in the hazardous area and to transmit the measuring signals to the non-hazardous area.
In addition to analog signals, digital HART® communication signals can be transferred bidirectional.
Further it is possible to connect active 2-wire (II) and passive 3-wire (I) transmitters. The device features two channels with 0/4...20 mA input and output circuits.
The input circuits are galvanically isolated from the output circuits, the supply voltage and from each other.
The input signals are transferred without attenuation (1:1 transfer) to the output circuits in the non-hazardous area. Due to the 1:1 transmission characteristic, wire-break or short-circuit conditions in the transducer circuit are indicated by an output current of 0 mA or > 22.5 mA, respectively.
Figure 1: Block diagram of the Isolating Transducer IM33-22Ex-Hi/24VDC
The Isolating Transducers IM33-22Ex-Hi/24VDC are considered to be Type A components with a hardware fault tolerance of 0.
The description above is valid for all versions of the isolating transducer with the exception that this version has two input and two output channels. The differences between the versions are described in Table 1.

© exida.com GmbH TURCK 04-07-14 R001 V2R0.doc; February 8, 2013 Stephan Aschenbrenner Page 10 of 25
3.2 Analog Signal Transmitter IM35-22Ex-Hi/24VDC
The two-channel data transmitter IM35-22Ex-Hi/24VDC is designed to transfer standard galvanically isolated current signals from the safe area to the explosion hazardous area in a 1:1 transmission mode.
In addition to the analogue signal, digital HART® communication signals can be transferred bidirectional.
Typical applications are the control of I/P converters (e.g. at control valves / actuators) or of indicator displays in explosion hazardous areas.
Figure 2: Block diagram of the Analog Signal Transm itter IM35-22Ex-Hi/24VDC
The Analog Signal Transmitters IM35-22Ex-Hi/24VDC are considered to be Type A components with a hardware fault tolerance of 0.
The description above is valid for all versions of the analog signal transmitter with the exception that this version has two input and two output channels. The differences between the versions are described in Table 1.

© exida.com GmbH TURCK 04-07-14 R001 V2R0.doc; February 8, 2013 Stephan Aschenbrenner Page 11 of 25
4 Failure Modes, Effects, and Diagnostic Analysis
The Failure Modes, Effects, and Diagnostic Analysis was done together with Werner Turck GmbH & Co. KG and is documented in [R1] and [R2]. When the effect of a certain failure mode could not be analyzed theoretically, the failure modes were introduced on component level and the effects of these failure modes were examined on system level. This resulted in failures that can be classified according to the following failure categories.
4.1 Description of the failure categories
In order to judge the failure behavior of the Isolating Transducers IM33-**(Ex)-Hi/24VDC and Analog Signal Transmitters IM35-**Ex-Hi/24VDC, the following definitions for the failure of the product were considered.
Fail Safe Failure that causes the module / (sub)system to go to the defined fail-safe state without a demand from the process or has no effect on the safety function.
Fail Dangerous Failure that does not respond to a demand from the process (i.e. being unable to go to the defined fail-safe state) or deviates the output current by more than 2% full scale (+/-0.32mA).
Fail High Failure that causes the output signal to go to the maximum output current (> 21 mA)
Fail Low Failure that causes the output signal to go to the minimum output current (< 3.6 mA)
Fail No Effect Failure of a component that is part of the safety function but that has no effect on the safety function or deviates the output current by not more than 2% full scale. For the calculation of the SFF it is treated like a safe undetected failure.
Not part Failures of a component which is not part of the safety function but part of the circuit diagram and is listed for completeness. When calculating the SFF this failure mode is not taken into account. It is also not part of the total failure rate.
IM33-**(Ex)-Hi/24VDC
Fail-Safe State Depending on the application the fail-safe state is defined as the output going to "fail-low" or “fail high”.
IM35-**Ex-Hi/24VDC
Fail-Safe State The fail-safe state is defined as the output going to "fail-low".
The “no effect” failures are provided for those who wish to do reliability modeling more detailed than required by IEC 61508. In IEC 61508 the “no effect” failures are defined as safe undetected failures even though they will not cause the safety function to go to a safe state. Therefore they need to be considered in the Safe Failure Fraction calculation.

© exida.com GmbH TURCK 04-07-14 R001 V2R0.doc; February 8, 2013 Stephan Aschenbrenner Page 12 of 25
4.2 Methodology – FMEDA, Failure rates
4.2.1 FMEDA
A Failure Modes and Effects Analysis (FMEA) is a systematic way to identify and evaluate the effects of different component failure modes, to determine what could eliminate or reduce the chance of failure, and to document the system in consideration.
A FMEDA (Failure Modes, Effects, and Diagnostic Analysis) is a FMEA extension. It combines standard FMEA techniques with extension to identify online diagnostics techniques and the failure modes relevant to safety instrumented system design. It is a technique recommended to generate failure rates for each important category (safe detected, safe undetected, dangerous detected, dangerous undetected, fail high, fail low) in the safety models. The format for the FMEDA is an extension of the standard FMEA format from MIL STD 1629A, Failure Modes and Effects Analysis.
4.2.2 Failure rates
The failure rate data used by exida.com in this FMEDA are the basic failure rates from the Siemens SN 29500 failure rate database. The rates are considered to be appropriate for safety integrity level verification calculations. The rates match operating stress conditions typical of an industrial field environment similar to IEC 645-1, class C. It is expected that the actual number of field failures will be less than the number predicted by these failure rates. The user of these numbers is responsible for determining their applicability to any particular environment. Accurate plant specific data may be used for this purpose. If a user has data collected from a good proof test reporting system that indicates higher failure rates, the higher numbers shall be used. Some industrial plant sites have high levels of stress. Under those conditions the failure rate data is adjusted to a higher value to account for the specific conditions of the plant.
4.2.3 Assumptions
The following assumptions have been made during the Failure Modes, Effects, and Diagnostic Analysis of the Isolating Transducers IM33-**(Ex)-Hi/24VDC and Analog Signal Transmitters IM35-**Ex-Hi/24VDC.
• Failure rates are constant, wear out mechanisms are not included.
• Propagation of failures is not relevant.
• The time to restoration after a safe failure is 8 hours.
• All modules are operated in the low demand mode of operation.
• External power supply failure rates are not included.
• The HART protocol is only used for setup, calibration, and diagnostics purposes, not during normal operation.
• The two channels on a redundant board are not used to increase the hardware fault tolerance needed for a higher SIL as they contain common components.
• The stress levels are average for an industrial environment and can be compared to the Ground Fixed classification of MIL-HNBK-217F. Alternatively, the assumed environment is similar to:
o IEC 645-1, Class C (sheltered location) with temperature limits within the manufacturer’s rating and an average temperature over a long period of time of 40ºC. Humidity levels are assumed within manufacturer’s rating.
© exida.com GmbH TURCK 04-07-14 R001 V2R0.doc; February 8, 2013 Stephan Aschenbrenner Page 13 of 25
• Only the current output 4..20mA is used for safety applications.
• The application program in the safety logic solver is constructed in such a way that fail low and fail high failures are detected regardless of the effect, safe or dangerous, on the safety function3.
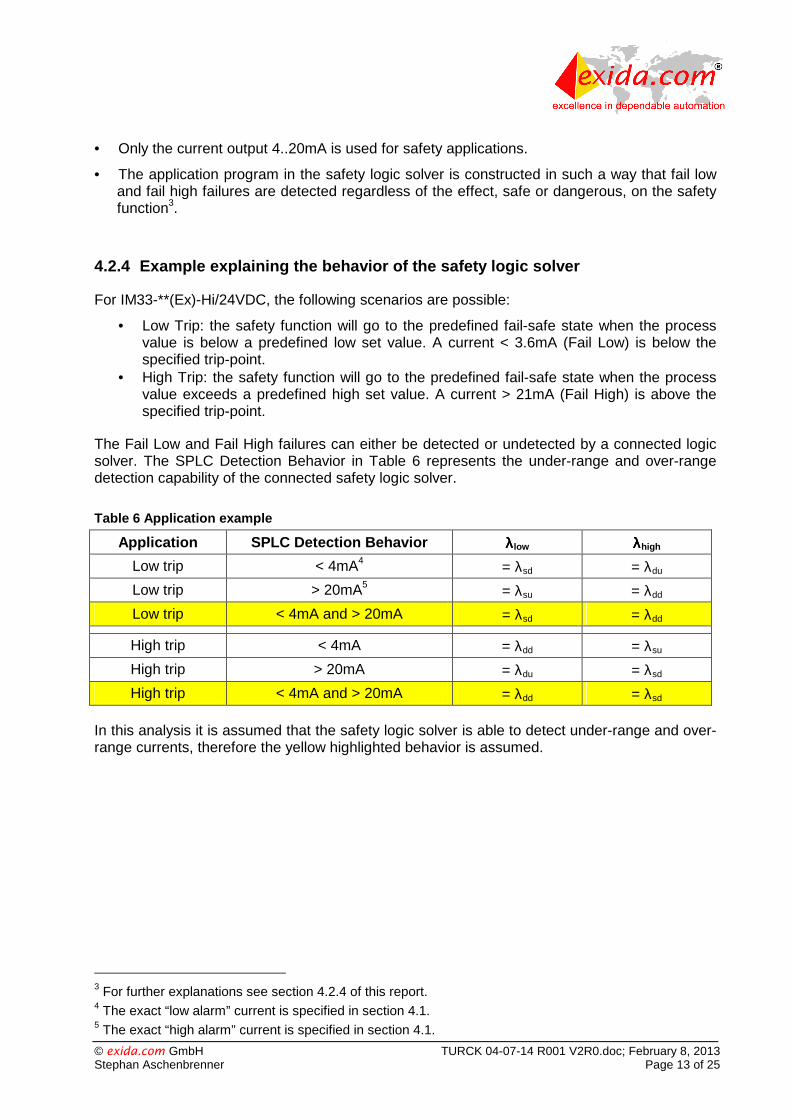
4.2.4 Example explaining the behavior of the safety logic solver
For IM33-**(Ex)-Hi/24VDC, the following scenarios are possible:
• Low Trip: the safety function will go to the predefined fail-safe state when the process value is below a predefined low set value. A current < 3.6mA (Fail Low) is below the specified trip-point.
• High Trip: the safety function will go to the predefined fail-safe state when the process value exceeds a predefined high set value. A current > 21mA (Fail High) is above the specified trip-point.
The Fail Low and Fail High failures can either be detected or undetected by a connected logic solver. The SPLC Detection Behavior in Table 6 represents the under-range and over-range detection capability of the connected safety logic solver.
Table 6 Application example
Application SPLC Detection Behavior λλλλlow λλλλhigh
Low trip < 4mA4 = λsd = λdu
Low trip > 20mA5 = λsu = λdd
Low trip < 4mA and > 20mA = λsd = λdd
High trip < 4mA = λdd = λsu
High trip > 20mA = λdu = λsd
High trip < 4mA and > 20mA = λdd = λsd
In this analysis it is assumed that the safety logic solver is able to detect under-range and over-range currents, therefore the yellow highlighted behavior is assumed.
3 For further explanations see section 4.2.4 of this report. 4 The exact “low alarm” current is specified in section 4.1. 5 The exact “high alarm” current is specified in section 4.1.
© exida.com GmbH TURCK 04-07-14 R001 V2R0.doc; February 8, 2013 Stephan Aschenbrenner Page 14 of 25
5 Results of the assessment exida.com did the FMEDAs together with Werner Turck GmbH & Co. KG.
For the calculation of the Safe Failure Fraction (SFF) the following has to be noted:
λtotal consists of the sum of all component failure rates. This means:
λtotal = λsafe + λdangerous + λno effect.
SFF = 1 – λdu / λtotal
For the FMEDAs failure modes and distributions were used based on information gained from [N3] to [N5].
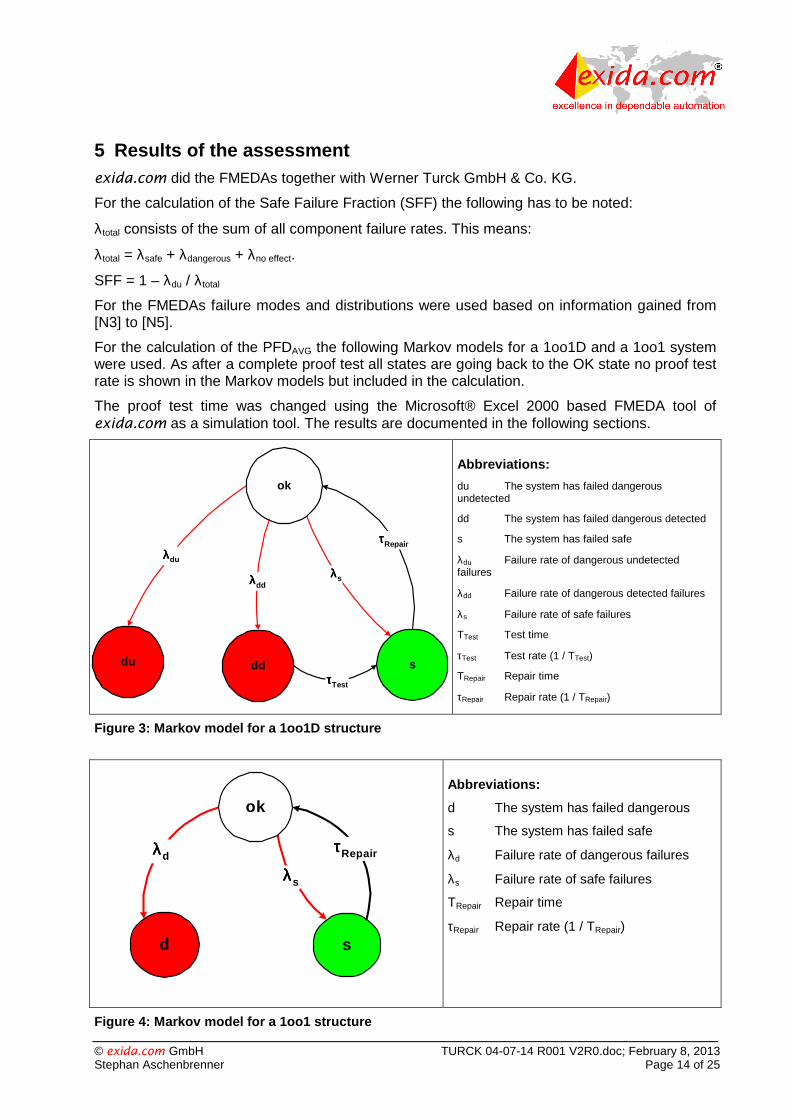
For the calculation of the PFDAVG the following Markov models for a 1oo1D and a 1oo1 system were used. As after a complete proof test all states are going back to the OK state no proof test rate is shown in the Markov models but included in the calculation.
The proof test time was changed using the Microsoft® Excel 2000 based FMEDA tool of exida.com as a simulation tool. The results are documented in the following sections.
Abbreviations:
du The system has failed dangerous undetected
dd The system has failed dangerous detected
s The system has failed safe
λdu Failure rate of dangerous undetected failures
λdd Failure rate of dangerous detected failures
λs Failure rate of safe failures
TTest Test time
τTest Test rate (1 / TTest)
TRepair Repair time
τRepair Repair rate (1 / TRepair)
Figure 3: Markov model for a 1oo1D structure
λλλλd
λλλλs
d
ok
s
ττττRepair
Abbreviations:
d The system has failed dangerous
s The system has failed safe
λd Failure rate of dangerous failures
λs Failure rate of safe failures
TRepair Repair time
τRepair Repair rate (1 / TRepair)
Figure 4: Markov model for a 1oo1 structure
λλλλdu
λλλλs
du dd
ok
s
λλλλdd
ττττRepair
ττττTest

© exida.com GmbH TURCK 04-07-14 R001 V2R0.doc; February 8, 2013 Stephan Aschenbrenner Page 15 of 25
5.1 Isolating Transducers IM33-**(Ex)-Hi/24VDC
The FMEDA carried out on the Isolating Transducer IM33-22Ex-Hi/24VDC leads under the assumptions described in sections 4.2.3 and 5 to the following failure rates:
λsd = 0,00E-00 1/h
λsu = 6,00E-09 1/h
λdd = 0,00E-00 1/h
λdu = 4,39E-08 1/h
λhigh = 6,71E-08 1/h
λlow = 2,33E-07 1/h
λno effect = 3,15E-07 1/h
λtotal = 6,65E-07 1/h
λnot part = 5,28E-08 1/h
MTBF = MTTF + MTTR = 1 / (λtotal + λnot part) + 8 h = 159 years
These failure rates can be turned over into the following typical failure rates:
Failure category (Failure rates in FIT) Fail-safe state = “fail high”
Fail-safe state = “fail low”
Fail High (detected by the logic solver) 73
67
Fail detected (int. diag.) = λsd + λsu 6 + λdd 6
Fail high (inherently) = λhigh 67
Fail Low (detected by the logic solver)
233
239
Fail detected (int. diag.) = λsd + λsu + λdd 6
Fail low (inherently) = λlow 233
Fail Dangerous Undetected 44 44
No Effect 315 315
Not part 53 53
MTBF = MTTF + MTTR 159 years 159 years
Under the assumptions described in section 4.2.4 and 5 the following tables show the failure rates according to IEC 61508 depending on whether fail low / fail high was considered to be dangerous detected or safe detected to:
6 These failures are not detected by internal diagnostics but because they lead to the safe state (e.g. by reaching the user defined trip point) they are detected by the logic solver independent of the user defined fail-safe state (“fail low” or “fail high”).

© exida.com GmbH TURCK 04-07-14 R001 V2R0.doc; February 8, 2013 Stephan Aschenbrenner Page 16 of 25
Fail-safe state = “fail high”
Failure Category λλλλsd λλλλsu λλλλdd λλλλdu SFF DCS DCD
λlow = λsd
λhigh = λdd 233 FIT 315 FIT 73 FIT 44 FIT 93,40% 42,52% 62,39%
λlow = λdd
λhigh = λsd 73 FIT 315 FIT 233 FIT 44 FIT 93,40% 18,81% 84,12%
Fail-safe state = “fail low”
Failure Category λλλλsd λλλλsu λλλλdd λλλλdu SFF DCS DCD
λlow = λsd
λhigh = λdd 239 FIT 315 FIT 67 FIT 44 FIT 93,40% 43,14% 60,36%
λlow = λdd
λhigh = λsd 67 FIT 315 FIT 239 FIT 44 FIT 93,40% 17,54% 84,45%
The PFDAVG was calculated for three different proof test times using the Markov model as described in Figure 3.
T[Proof] = 1 year T[Proof] = 5 years T[Proof] = 10 years
PFDAVG = 1,92E-04 PFDAVG = 9,60E-04 PFDAVG = 1,92E-03
The boxes marked in yellow ( ) mean that the calculated PFDAVG values are within the allowed range for SIL 2 according to table 2 of IEC 61508-1 and table 3.1 of ANSI/ISA–84.01–1996 but do not fulfill the requirement to not claim more than 10% of this range, i.e. to be better than or equal to 1,00E-03. The boxes marked in green ( ) mean that the calculated PFDAVG
values are within the allowed range for SIL 2 according to table 2 of IEC 61508-1 and table 3.1 of ANSI/ISA–84.01–1996 and do fulfill the requirement to not claim more than 10% of this range, i.e. to be better than or equal to 1,00E-03. Figure 5 shows the time dependent curve of PFDAVG.
0,00E+00
5,00E-04
1,00E-03
1,50E-03
2,00E-03
2,50E-03
0 1 2 3 4 5 6 7 8 9 10
Probability
Years
1oo1D structure
PFDavg
Figure 5: PFD AVG(t)

© exida.com GmbH TURCK 04-07-14 R001 V2R0.doc; February 8, 2013 Stephan Aschenbrenner Page 17 of 25
5.2 Analog Signal Transmitters IM35-**Ex-Hi/24VDC
The FMEDA carried out on the Analog Signal Transmitter IM35-22Ex-Hi/24VDC leads under the assumptions described in section 4.2.3 and 5 to the following failure rates:
λsd = 0,00E-00 1/h
λsu = 4,60E-09 1/h
λdd = 0,00E-00 1/h
λdu = 4,09E-08 1/h
λhigh = 6,18E-08 1/h
λlow = 2,53E-07 1/h
λno effect = 3,25E-07 1/h
λtotal = 6,85E-07 1/h
λnot part = 2,02E-08 1/h
MTBF = MTTF + MTTR = 1 / (λtotal + λnot part) + 8 h = 162 years
Under the assumptions described in section 5 and the definitions given in section 4.1 the following tables show the failure rates according to IEC 61508:
λλλλsafe λλλλdangerous SFF
583 FIT 103 FIT 85,01%
The PFDAVG was calculated for three different proof test times using the Markov model as described in Figure 4.
T[Proof] = 1 year T[Proof] = 5 years T[Proof] = 10 years
PFDAVG = 4,50E-04 PFDAVG = 2,25E-03 PFDAVG = 4,48E-03
The boxes marked in yellow ( ) mean that the calculated PFDAVG values are within the allowed range for SIL 2 according to table 2 of IEC 61508-1 and table 3.1 of ANSI/ISA–84.01–1996 but do not fulfill the requirement to not claim more than 10% of this range, i.e. to be better than or equal to 1,00E-03. The boxes marked in green ( ) mean that the calculated PFDAVG
values are within the allowed range for SIL 2 according to table 2 of IEC 61508-1 and table 3.1 of ANSI/ISA–84.01–1996 and do fulfill the requirement to not claim more than 10% of this range, i.e. to be better than or equal to 1,00E-03. Figure 6 shows the time dependent curve of PFDAVG.

© exida.com GmbH TURCK 04-07-14 R001 V2R0.doc; February 8, 2013 Stephan Aschenbrenner Page 18 of 25
1oo1 structure
0,00E+005,00E-041,00E-031,50E-032,00E-032,50E-033,00E-033,50E-034,00E-034,50E-035,00E-03
0 1 2 3 4 5 6 7 8 9 10
Years
Pro
babi
lity
PFDavg
Figure 6: PFD AVG(t)

© exida.com GmbH TURCK 04-07-14 R001 V2R0.doc; February 8, 2013 Stephan Aschenbrenner Page 19 of 25
6 Terms and Definitions DCS Diagnostic Coverage of safe failures (DCS = λsd / (λsd + λsu)
DCD Diagnostic Coverage of dangerous failures (DCD = λdd / (λdd + λdu)
FIT Failure In Time (1x10⁻⁹ failures per hour)
FMEDA Failure Modes, Effects, and Diagnostic Analysis
HART Highway Addressable Remote Transducer
HFT Hardware Fault Tolerance
Low demand mode Mode, where the frequency of demands for operation made on a safety-related system is no greater than one per year and no greater than twice the proof test frequency.
PFDAVG Average Probability of Failure on Demand
SFF Safe Failure Fraction summarizes the fraction of failures, which lead to a safe state and the fraction of failures which will be detected by diagnostic measures and lead to a defined safety action.
SIF Safety Instrumented Function
SIL Safety Integrity Level
Type A component “Non-complex” component (all failure modes are well defined); for details see 7.4.3.1.2 of IEC 61508-2.
T[Proof] Proof Test Interval
© exida.com GmbH TURCK 04-07-14 R001 V2R0.doc; February 8, 2013 Stephan Aschenbrenner Page 20 of 25
7 Status of the document
7.1 Liability
exida prepares reports based on methods advocated in International standards. Failure rates are obtained from a collection of industrial databases. exida accepts no liability whatsoever for the use of these numbers or for the correctness of the standards on which the general calculation methods are based.
Due to future potential changes in the standards, best available information and best practices, the current FMEDA results presented in this report may not be fully consistent with results that would be presented for the identical product at some future time. As a leader in the functional safety market place, exida is actively involved in evolving best practices prior to official release of updated standards so that our reports effectively anticipate any known changes. In addition, most changes are anticipated to be incremental in nature and results reported within the previous three year period should be sufficient for current usage without significant question.
Most products also tend to undergo incremental changes over time. If an exida FMEDA has not been updated within the last three years and the exact results are critical to the SIL verification you may wish to contact the product vendor to verify the current validity of the results.
7.2 Releases
Version History: V2R0: IM33-11-Hi/24VDC / IM33-22-Hi/24VDC added; February 8, 2013 V1, R1.0: Review comments integrated; November 15, 2004 V0, R1.0: Initial version; October 27, 2004 Authors: Stephan Aschenbrenner Review: V0, R1.0: Rachel Amkreutz (exida.com); October 29, 2004 Release status: Released to Werner Turck GmbH & Co. KG
7.3 Release Signatures
Dipl.-Ing. (Univ.) Stephan Aschenbrenner, Partner
Dipl.-Ing. (Univ.) Rainer Faller, Principal Partner

© exida.com GmbH TURCK 04-07-14 R001 V2R0.doc; February 8, 2013 Stephan Aschenbrenner Page 21 of 25
Appendix 1: Possibilities to reveal dangerous undet ected faults during the proof test
According to section 7.4.3.2.2 f) of IEC 61508-2 proof tests shall be undertaken to reveal dangerous faults which are undetected by diagnostic tests.
This means that it is necessary to specify how dangerous undetected faults which have been noted during the FMEDA can be detected during proof testing.
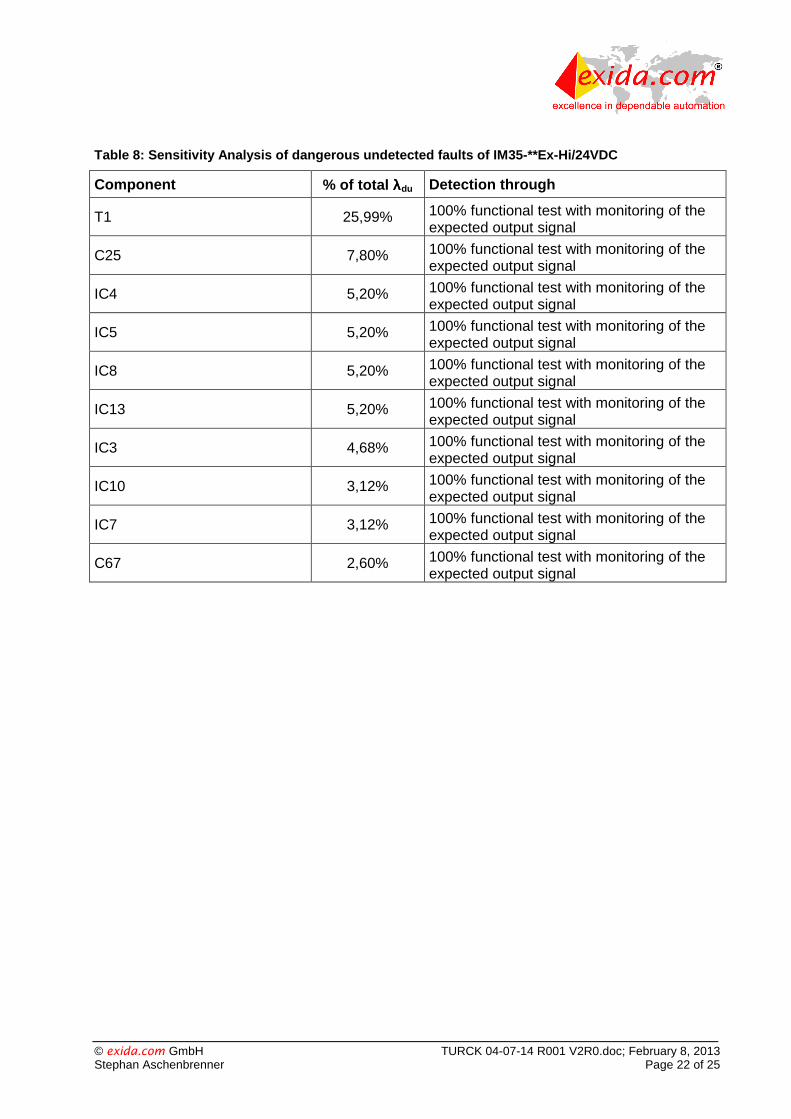
Table 7 and Table 8 show a sensitivity analysis of the ten most critical dangerous undetected faults and indicate how these faults can be detected during proof testing.
Appendix 1 shall be considered when writing the safety manual as it contains important safety related information.
Table 7: Sensitivity Analysis of dangerous undetect ed faults of IM33-**(Ex)-Hi/24VDC
Component % of total λλλλdu Detection through
T8 24,11% 100% functional test with monitoring of the expected output signal
IC6 8,44% 100% functional test with monitoring of the expected output signal
IC3 4,82% 100% functional test with monitoring of the expected output signal
IC4 4,82% 100% functional test with monitoring of the expected output signal
IC8 4,82% 100% functional test with monitoring of the expected output signal
IC13 4,82% 100% functional test with monitoring of the expected output signal
IC2 4,34% 100% functional test with monitoring of the expected output signal
IC9 2,89% 100% functional test with monitoring of the expected output signal
IC7 2,89% 100% functional test with monitoring of the expected output signal
C23 2,41% 100% functional test with monitoring of the expected output signal
© exida.com GmbH TURCK 04-07-14 R001 V2R0.doc; February 8, 2013 Stephan Aschenbrenner Page 22 of 25
Table 8: Sensitivity Analysis of dangerous undetect ed faults of IM35-**Ex-Hi/24VDC
Component % of total λλλλdu Detection through
T1 25,99% 100% functional test with monitoring of the expected output signal
C25 7,80% 100% functional test with monitoring of the expected output signal
IC4 5,20% 100% functional test with monitoring of the expected output signal
IC5 5,20% 100% functional test with monitoring of the expected output signal
IC8 5,20% 100% functional test with monitoring of the expected output signal
IC13 5,20% 100% functional test with monitoring of the expected output signal
IC3 4,68% 100% functional test with monitoring of the expected output signal
IC10 3,12% 100% functional test with monitoring of the expected output signal
IC7 3,12% 100% functional test with monitoring of the expected output signal
C67 2,60% 100% functional test with monitoring of the expected output signal

© exida.com GmbH TURCK 04-07-14 R001 V2R0.doc; February 8, 2013 Stephan Aschenbrenner Page 23 of 25
Appendix 1.1: Possible proof tests to detect danger ous undetected faults
Isolating Transducers
Proof test 1 consists of the following steps, as described in Table 9.
Table 9 Steps for Proof Test 1
Step Action 1 Bypass the safety PLC or take other appropriate action to avoid a false trip
2 Send a HART command to the Isolating Transducers to go to the high alarm current output and verify that the analog current reaches that value.
This tests for compliance voltage problems such as a low loop power supply voltage or increased wiring resistance. This also tests for other possible failures.
3 Send a HART command to the Isolating Transducers to go to the low alarm current output and verify that the analog current reaches that value.
This tests for possible quiescent current related failures
4 Restore the loop to full operation
5 Remove the bypass from the safety PLC or otherwise restore normal operation
This test will detect approximately 50% of possible “du” failures in the Isolating Transducers.
Proof test 2 consists of the following steps, as described in Table 10.
Table 10 Steps for Proof Test 2
Step Action 1 Bypass the safety PLC or take other appropriate action to avoid a false trip
2 Perform Proof Test 1
3 Perform a two-point calibration of the connected transmitter
This requires that the transmitter has already been tested without the Isolating Transducers and does not contain any dangerous undetected faults anymore.
4 Restore the loop to full operation
5 Remove the bypass from the safety PLC or otherwise restore normal operation
This test will detect approximately 99% of possible “du” failures in the Isolating Transducers.

© exida.com GmbH TURCK 04-07-14 R001 V2R0.doc; February 8, 2013 Stephan Aschenbrenner Page 24 of 25
Analog Signal Transmitter
Proof test 1 consists of the following steps, as described in Table 9.
Table 11 Steps for Proof Test 1
Step Action 1 Take appropriate action to avoid a false trip
2 Provide a 4mA control signal to the Analog Signal Transmitter to open/close the valve and verify that the valve is open/closed.
This tests for compliance voltage problems such as a low loop power supply voltage or increased wiring resistance. This also tests for other possible failures.
It requires, however, that the valve has already been tested without the Analog Signal Transmitter and does not contain any dangerous undetected faults anymore.
3 Restore the loop to full operation
4 Restore normal operation
This test will detect approximately 70% of possible “du” failures in the Analog Signal Transmitter.
Proof test 2 consists of the following steps, as described in Table 10.
Table 12 Steps for Proof Test 2
Step Action 1 Take appropriate action to avoid a false trip
2 Perform Proof Test 1
3 Provide a 4..20 mA control signal in steps of 1 mA to the Analog Signal Transmitter to open/close the valve and verify that the valve opens/closes accordingly.
This requires that the valve has already been tested without the repeater and does not contain any dangerous undetected faults anymore.
4 Restore the loop to full operation
5 Restore normal operation
This test will detect approximately 95% of possible “du” failures in the Analog Signal Transmitter.

© exida.com GmbH TURCK 04-07-14 R001 V2R0.doc; February 8, 2013 Stephan Aschenbrenner Page 25 of 25
Appendix 2: Impact of lifetime of critical componen ts on the failure rate
Although a constant failure rate is assumed by the probabilistic estimation method (see section 4.2.3) this only applies provided that the useful lifetime of components is not exceeded. Beyond their useful lifetime, the result of the probabilistic calculation method is meaningless, as the probability of failure significantly increases with time. The useful lifetime is highly dependent on the component itself and its operating conditions – temperature in particular (for example, electrolyte capacitors can be very sensitive).
This assumption of a constant failure rate is based on the bathtub curve, which shows the typical behavior for electronic components.
Therefore it is obvious that the PFDAVG calculation is only valid for components which have this constant domain and that the validity of the calculation is limited to the useful lifetime of each component.
It is assumed that early failures are detected to a huge percentage during the installation period and therefore the assumption of a constant failure rate during the useful lifetime is valid.
Table 13 shows which components are contributing to the dangerous undetected failure rate and therefore to the PFDAVG calculation and what their estimated useful lifetime is.
Table 13: Useful lifetime of components contributin g to λλλλdu
Type Name Useful life Capacitor (electrolytic) - Tantalum electrolytic, solid electrolyte
C38 (IM33-**(Ex)-Hi/24VDC) Appr. 500 000 hours
As there are no aluminium electrolytic capacitors used the only limiting factor are the Tantalum electrolytic capacitors with regard to the useful lifetime of the system, which have a useful lifetime of about 57 years.
However, according to section 7.4.7.4 of IEC 61508-2, a useful lifetime, based on experience, should be assumed. According to section 7.4.7.4 note 3 of IEC 61508-2 experience has shown that the useful lifetime often lies within a range of 8 to 12 years.