Embed Size (px)
Citation preview

Fair Trade and Free Entry: Can a Disequilibrium Market Serve as a Development Tool?
Alain de Janvry University of California at Berkeley, [email protected]
Craig McIntosh
University of California at San Diego, [email protected]
Elisabeth Sadoulet1 University of California at Berkeley, [email protected]
December 2012
Abstract
The Fair Trade initiative attempts to serve as an alternative to standard development assistance by channeling charity from consumers to poor producers via increased prices. We show that this effort to create rents in an otherwise competitive market is unlikely to benefit producers. The current rules of the Fair Trade system permit complete arbitraging away of rents due to costly over-certification of output. Using data from an association of coffee cooperatives in Central America, we verify the almost complete dissipation of producer rents, along with negative producer benefits when the FT floor price does not bind.
Keywords: Fair Trade, development impact, coffee supply chains, cooperatives
JEL Codes: O12, D45, P46
1 The authors are grateful to USAID-BASIS for financial support to the project, and to helpful comments from seminar participants at PacDev, Paris School of Economics, University of Minnesota, University of Wisconsin, UC Davis, UC Riverside, UCSC, Geneva Graduate Institute, University of Padova.

1
1. INTRODUCTION
The Fair Trade (FT) initiative seeks to channel a charitable donation to producers by passing
a price premium to them through commodity markets. The potential size of this market is huge:
75% of US private donations to international causes originate from individuals, ($30 billion in 2009,
equal to US foreign aid), and the FT coffee market alone sees sales of almost $200 million a year
(Giving USA Foundation, 2010). An effective system must be able to convey rents to producers
through a commodified supply chain, an endeavor that we expect to be beset by competitive
pressures. The institutions that have arisen to attempt this task are a network of non-governmental
organizations operating a global regulatory mechanism that certifies producers and ensures that
above-market prices are paid. How, then, does a competitive market with open access respond to
this rent in its midst? This paper presents a simple theoretical environment in order to show the
tremendous welfare-generating potential of such markets, as well as to predict the ways in which
market forces will conspire to arbitrage away producer rents within the rules of the current system.
We then use detailed micro-data that allows us to rigorously quantify the net price benefits that the
FT system has provided to producers.
FT certification is qualitatively different from other consumer certification mechanisms such
as organic, bird-friendly, or fair labor standards because it explicitly seeks to enhance producer
profits, whereas these other schemes seek to alter the production process used.2 Higher FT
consumer prices are intended to translate into higher producer profits, as opposed to a certification
such as organic where higher consumer prices are necessary simply to cover the greater costs of
producing organically. Overseen by FLO-CERT in Bonn, certifiers ensure that producers meet FT
standards, and producers are then entitled to transact sales under the FT rules: prices must be above
a fixed floor price and no less than 10¢/lb above the commodity market coffee price.3 This
mechanism appears to have been extremely effective in enforcing the rules of FT transactions:
prices in the market transact just as the FT system specifies they should, and there is little evidence
of leakage or improper certification. Despite this, the rules of the current system encourage an over-
certification of supply whose costs fall fully on producers, ultimately arbitraging away all expected
2 The first sentence of the legal Suggested Fair Trade Messaging reads: “Fair Trade Certified™ products directly support a better life for farmers and farm workers in the developing world through fair prices, community development, and environmental stewardship.” The last sentence reads: “all farmers and farm workers benefit from premiums that allow them to invest in building their communities and bettering their lives.” 3 Fair Trade USA, the US certification body, withdrew from FLO-CERT as of the end of 2011, but maintains the same price rules.

2
rents from the system. Our results suggest that the effort to transfer rents through prices in
competitive, commodified markets may be quixotic.
We develop a simple theory illustrating the exact ways in which two core features of the
current system (floor price system + no control of over-certification) combine to generate rent
dissipation. The presence of a FT floor price produces a financial service for producers that is most
akin to a put option. The fact that certification confers the right to try to sell under the FT rules but
no guarantee of a market leaves the total quantity of certified output as a free margin on which
arbitrage can occur. The fraction of certified production actually sold through the FT market falls
below one, and producers waste money by certifying output that will not be sold at FT prices. Far
from the FT system exerting effort to cartelize, the in-country certifiers who control the de facto
supply are paid piece-rate for each certification performed, exacerbating incentives towards over-
supply. The result is a contract that can be stylized as a put option with a fixed price, whose benefit
to producers is driven to zero as entry into the contract drives down the probability that the put can
be successfully exercised.
A set of predictions from this formalization are taken to data consisting of administrative
records from a large Central American association of coffee cooperatives, thereafter referred to as
the Association. These data provide an ideal window on FT markets for two reasons. First, they
give exact prices and dates on more than 11,000 independent sales transactions over 13 years that
span the coffee crisis and the more recent commodity boom. Second, the Association is FT
certified at the second-tier level, conferring certification on all its first-tier cooperative members. It
however sells only some of its coffee through FT markets each year, giving a unique natural
experiment through which we can examine FT sales and prices received. We provide rigorous
estimates of the effective FT premium, taking advantage of price data for those cooperatives whose
production is sold on both markets, including of specific delivery lots that are split and sold on the
FT and traditional markets at the same time.
We first confirm that the share of coffee sold through the FT system falls when the price
premium increases, an observational correlation that is inconsistent with producer decisionmaking
and indicative of oversupply during these years. This occurs in a manner that largely counteracts
swings in the FT premium, leaving producer benefits low even when the price floor binds. We then
proceed to estimate the net effective premiums actually received by coffee cooperatives over the 13
years 1997-2009. We find that even during the peak of the coffee crisis when the FT price was
60¢/lb above a market price of only 61¢/lb, producer cooperatives never received more than 10¢/lb

3
in effective premiums. Applying this estimated FT premium to the observed prices, we find that the
average monetary benefit of the FT option over the period of our data amounted to $3-$11 per year
for the median Guatemalan coffee grower, representing 1.5 to 5% of coffee-related income. The
average effective premium over the years 2005-2009 (when market prices were excess of the floor
price) has been negative, consistent with a put-option interpretation of the contract.
These lackluster results on the value of the FT contract for producers raise two policy issues
that we discuss in the conclusion of the paper: Why does FT persist in spite of lack of delivery as
rents to producers of the premium paid by ethical consumers? Then, are there alternative
mechanisms to FT that could transfer rents while relying on market forces?
In section 2 we provide a model showing how market entry pushes producer benefits
towards zero despite the fact that all contracts satisfy the explicit terms of FT. In section 3 we
explain the empirical specification in estimating FT premiums and the structure of the data. In
section 4, we give empirical evidence on over-certification and report several measurements of the
FT premium using rigorous methods to control for quality and estimate counterfactual prices. We
use these results in section 5 to calculate the welfare effects derived from FT per pound sold and per
participating household. Finally, in section 6 we summarize the results and discuss policy
implications for the future promise of FT markets.
2. A CONCEPTUAL DESCRIPTION OF THE FAIR TRADE MARKET
The academic economics literature on FT is nascent despite the tremendous attention the
movement has received in the popular press. Experiments on ‘ethical demand’ have shown that
there exists significant willingness to pay for charity-linked products (Elfenbein and McManus, 2010,
Hainmuller et al., 2011), motivated not only by the desire to transfer rent but also by an intrinsic
utility from consuming these products (Poret and Chambolle, 2007) or from the desire to be seen
doing good (Soetevent 2011). Consistent with this, FT coffee consumers have been shown to be less
price sensitive than non-FT consumers (Arnot et al., 2006; Basu and Hicks, 2008). The effect of FT
on rent transfers has been debated with little consensus, with some arguing that they can be
substantial (Smith, 2009) and others that they are limited (Haight, 2007; Henderson, 2008; Sidwell,
2008), and that the FT mechanism rewards low quality coffee (Henderson, 2008). On the broader
effect on the welfare of beneficiaries, several studies report positive results (Becchetti and
Constantino (2008) for Kenya, Utting-Chamorro (2005) for Nicaragua, and Arnould, Plastina, and

4
Ball (2009) for Peru, Nicaragua, and Guatemala), but these studies are either descriptive or lack
control over endogeneity biases.
We now lay out a simple theory of how FT supply chains should respond to the incentives
created by the system. The model is intended to be representative of the types of markets in which
fair trade mechanisms are most prevalent: commodified production and the absence of producer
profits in equilibrium. Such crops, particularly coffee, represent a disproportionately large share of
cash income for smallholder farmers in many poor parts of the world. When wealthy consumers of
boutique products meet these poor smallholder producers in the market, an enlightened consumer
would recognize that the overall welfare from the transaction should be increasing in the market
price.
2.1. The traditional market.
We start from a non-FT market, which we refer to as the “traditional” market, when there is no
FT supply or demand. Because production is commodified, entry occurs until the long-run expected
price provides no profit for producers overall, E( p) , where is the constant unit cost of
production. Each year however, the price p fluctuates around the zero-profit level as a function of
aggregate shocks, such as weather in Brazil.4 Producers of commodity coffee thus receive no rents in
expectation, although the stochastic commodity price means that ex-post they will profit in some
years and lose in others. Producer welfare per unit of production is given by U p , where
is producer marginal utility, decreasing in producer income. Consumers purchase one unit of
output, and realize a consumption utility given by u p , with giving the marginal effect of
prices on consumer utility. Free entry hands market rents to consumers, who realize the benefits
from the creation of the market. Market welfare in a year of realized aggregate production X and
price p is given by X p .
2.2. Justification for ‘ethical trade’.
An immediate justification for a departure from this competitive equilibrium can be seen
from the middle term in the welfare expression, p . This term reflects the fact that the price
4 We suppress time subscripts through the theoretical presentation in order to simplify notations.

5
mechanism represents a transfer of income from the consumer to the producer. For products in
which rich and price-insensitive consumers transact with poor producers, is positive and
hence aggregate welfare is improved as the price increases. An enlightened consumer would be
aware of this effect (“they need it much more than I do”) and may be expected to incorporate it at
least partially into decisionmaking. Such a consumer will display a lower price elasticity of demand
when transacting with poor producers.5
A second, distinct justification for ethical trade could arise from the well-documented ‘warm
glow’ effect that is experienced by consumers when they purchase (or are seen to purchase) a
product with a charitable motivation (Null, 2011). In contrast to the profit-transfer motive this
benefit should be innate to the purchase and is not directly related to the benefit that the producer
receives from the transaction.
We parameterize ‘ethical’ demand through both of these channels. First, 0,1 gives
the extent to which the consumer internalizes the welfare-increasing effect of prices, enjoying an
improvement in producer welfare as an increase in utility (with 0 the consumer is the standard
hedonist, and with 1 the consumer is a welfare maximizer). The ‘warm glow’ benefit is given by
the scalar that contributes to consumer utility when purchasing the ethical product. We can
represent an idealized ethical trade market as delivering a price p p , while imposing on producers
some additional cost c . Assume that all producers in this ethical market are identical and each
produces a quantity q , so that the unit cost of obtaining the ethical label is c q. Consumer utility in
this market is u p p c q , meaning that a consumer would wish to use the
ethical market as long as p c q ( p p) . If all consumers were ‘ethical’, an
idealized ethical market would realize an aggregate welfare that is higher than the competitive
equilibrium by X p p p c q p p c q , which will be positive as
long as
c q
p p p p p 1 . Hence, an ‘ethical trade’ market can in theory
improve consumer welfare via warm glow effects and via utility preferences over welfare
5 For a more general discussion of ‘fair’ division when parties of unequal income negotiate with each other, see Crawford (1977).

6
maximization while raising prices for producers, provided that the cost of the mechanism is
sufficiently small.
Unfortunately, the free-entry condition means that this welfare-improving price cannot be a
competitive equilibrium as long as the ethical market remains demand constrained, meaning that the
potential supply in the ethical market is larger than the potential demand. Attempts to create rents
will be doomed by entry. That the market will put pressure on a successful rent-generating
mechanism is confirmed by the long literature on cartels. The Fair Trade mechanism that exists in
reality implements a set of rules that allow for complete rent dissipation entirely within the
mechanism, and hence may never have created the incentives to try to contravene the rules.
2.3. The Fair Trade mechanism in reality.
The current FT mechanism permits certified producers to sell coffee at a price that features
both a floor and a premium above the market price. The floor price pf varies by regions of the
world, and was set for Central America at $1.21/lb until June 2008, when it was raised to $1.25/lb.
The ‘social premium’ is a separate and additional payment for social investment by the producer
group, which was originally set at 5¢/lb until June 2007 when it was raised to 10¢/lb. This nominal
social premium is paid to the cooperative and is intended for social investment. The price-setting
rule for FT coffee is then that producers should be paid no less than the floor price or the market
price p, whichever is higher, where the reference market is the New York Coffee Exchange ‘C’
contract (NY ‘C’ thereafter), plus the FT social premium: p max p, p
f . In order to be
certified to sell through the FT system, producers must be family farmers organized in cooperatives,
and the cooperative must pay the cost of certification inspections annually. Once producers have
paid the costs of certification they have the right to sell all of their output through the FT market
but there is no guarantee that they will be able to do so. The FT price p nails down the nominal
premium p p that producers face. Producers do not know the NY ‘C’ price that will prevail at
harvest time, and consequently do not know the FT premium.
2.4. Rent dissipation through over-certification.
Because the FT system does not guarantee that all certified output can be sold at FT prices, it
creates a simple mechanism for rent dissipation: over-certification. Estimates of the degree of over-

7
certification vary, but only somewhere between 1/2 and 1/7th of the certified output actually sells on
the FT market.6 This arises because the current system is demand-constrained, meaning that the
supply of certifiable output exceeds demand. This says that while producers must pay certification
costs on all of their output, they receive FT rents only on a share of that output.
Consider producers’ decisions if each certified producer succeeds in selling the same share s
of output through the FT channel. A certified producer receives the ex-post price sp 1 s p ,
but the certification decision must be taken prior to the realization of prices. In order to focus on
the issue of market price fluctuations, we ignore the stochastic nature of individual production.7 The
equilibrium FT sales share *s is then given by the arbitrage condition:
s* c q
E p p . (1)
Even if a nascent FT market begins with a sales share close to one, new producers will pile into the
system as long as expected benefits exist. Expected producer profits are zero at this equilibrium
despite the presence of per-unit rents at the margin, and increases in the expected FT premium are
met with an increase in over-certification. The equilibrium certified sales share will move inversely
to the expected nominal premium, a prediction we verify in Section 4.1. The problem of wasteful
over-entry in the presence of rents is not new to the literature (Hsieh and Moretti (2003) for
example show that property price increases in the US trigger more entry and less efficiency by
realtors while leaving profits unchanged) but its implication for producer rents in the FT system has
not been rigorously explored empirically.
Producer expectations over the nominal FT premium are complicated by the presence of the
floor price, which provides an unusual kind of put contract.8 Both the price of the put (the cost of
certification) and the benefit of exercising the put (the nominal FT premium) are fixed by the rules
6 See Muradian and Pelupessy (2005) and Haight (2007). It is conceptually possible that the FT producer criteria could be set so tightly that the system becomes supply-constrained, at which point FT has become cartelized, and while over-certification will no longer be the relevant problem, maintaining the cartel becomes critical. We return in the conclusion to a discussion of the long-term viability of maintaining a cartelized, supply-constrained FT system. 7 Individual output is likely orthogonal to commodity price variation, which is caused by production fluctuations in a few large countries such as Brazil or Vietnam. 8 While renewal of certification is done every year, re-certification of a lapsed producer is substantially more expensive than maintaining ongoing certification. This, plus narrative reports that producers fear losing relationships with FT buyers if they fall out of the mechanism, appears to represent a rigidity in the speed at which FT supply can adjust to price changes across years as well as the predetermination of certification within a season.

8
of the system. The margin on which arbitrage occurs is the probability that the put can be exercised.
Ex-post to the realization of prices the benefits from certification are:
s* p
f p c q if p p
f
s* c q if p pf
,
where *s is given by expression (1) above. Since the realized benefits to FT are positive for a
sufficiently low p , the benefits to the system when the put is not exercised, s* c q , must be
negative.
Given the put dimension of the contract, expected returns may be depressed for two
additional reasons. First, the contract provides additional option value (Black and Scholes, 1973;
Bondarenko, 2009). Second, coffee producers may face missing markets such as credit (Stiglitz and
Weiss, 1981) and futures (Marcus and Modest, 1984) and hence face unhedged price risk. In this
case the put will provide direct utility through transferring income from good states to bad. The
intrinsic cost of the put, as well as the option and insurance values will conspire to cause FT rents to
be negative in equilibrium when the FT floor does not bind.9 These losses represent the premiums
paid by producers in order to gain access to the price insurance created by the FT floor.
The analysis of the certified sales share motivates the following predictions:
H1. The ratio of FT coffee sales to FT certified coffee will be less than one.
H2. This ratio will move inversely to the FT premium.
H3. The actual net benefit to participation in the FT system will be negative in years in which the
floor price turns out not to bind.
H4. Over-certification will push the effective long-run benefit of the FT system to producers to
zero.
3. SPECIFICATION AND DATA
3.1. Empirical Specification
When we turn to trying to estimate the effective premium received by FT producers, the
substantial variation in coffee quality emerges as an empirical challenge. The traditional market
recognizes quality and all contract prices are quoted in premiums over the commodity NY`C’ to
9 Assuming traditional prices are autocorrelated, when the NY ‘C’ is high certification will be driven primarily by the social premium, when the NY ‘C’ is low certification will be driven primarily by the floor, and the option value will be particularly important in driving certification when the NY ‘C’ is close to the FT floor.
9
reflect quality. Hence, if the types of coffee that are predisposed to sell through FT would anyways
have garnished a higher price on the traditional market, then the difference between the FT price
and the NY`C’ would over-represent the benefit of FT certification on prices.
The empirical difficulty emerges because quality is only recorded with some coarse
qualifications, while buyers and sellers that directly negotiate prices of every sale have important
information that is known to themselves only (and not to the econometrician). This information is
derived from private information on specific conditions of the beans, conditions of production that
affect the quality of the coffee after being roasted that cannot even been seen in the beans, and in
many cases based on micro-roasted samples sent to the buyers. There is therefore an important
element of the coffee quality that will always remain unobservable to outsiders. In this sense, the
only straightforward way to infer quality is through the price that a given coffee receives on the
traditional market.
The problem is compound in the case of trying to estimate the FT premium by the fact that
the quality coffee moving through the FT market will likely vary from one year to another
depending on the NY`C’ price. Because the FT price and floor are quality-invariant, it should be the
case that producers of high-quality coffee should be willing to sell through the FT market only when
the premium available is high, meaning during a collapse of market prices. This suggests that the
quality of coffee in the FT market should move inversely with the commodity price.
There is a close analogy here to the problem of causal inference in an impact analysis of a
program with endogenous selection: if we think of FT as a ‘treatment’ whose impact on prices we
wish to establish, we do not in general observe the same lot of coffee in both markets at the same
time. Measuring the correct effective FT premium requires that we know what price each lot of FT
coffee would have received had it been sold on the traditional market. Because quality contains some
unobservable component, and given that the decision to certify as FT is driven precisely by a quality
known to producers but not to the econometrician, any simple measure of the effective premium is
likely to suffer from omitted variables bias.
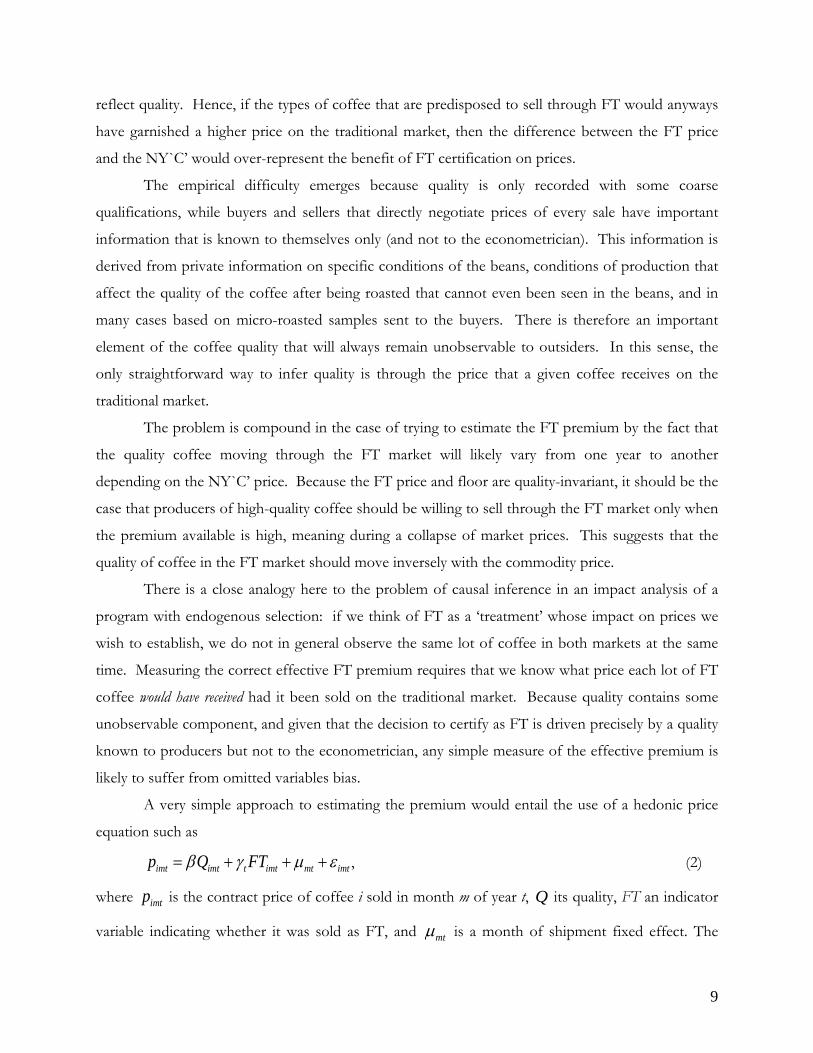
A very simple approach to estimating the premium would entail the use of a hedonic price
equation such as
imt imt t imt mt imtp Q FT , (2)
where imtp is the contract price of coffee i sold in month m of year t, Q its quality, FT an indicator
variable indicating whether it was sold as FT, and mt is a month of shipment fixed effect. The

10
identification problem comes from the fact that there is no independent indicator for quality, and if
we use an imperfect imtQ then FT may be correlated with the unobservable part of quality.
Fortunately, the structure of the Association provides a unique opportunity to gain empirical
traction on this problem. Because the Association sells only a fraction of its total output as FT
(despite the legal right to sell it all) we observe an intensive margin over which to compare prices
between FT and non-FT coffee in a relatively homogenous context. Furthermore, the complexity of
the internal supply chain in the Association means that within a single year a given cooperative’s
production may be split into different sales lots that are then sold through different channels.
Finally, there are cases in which even a specific delivery of coffee from a cooperative is split and sold
on both the FT and the traditional markets. While these transactions represent a subset of all the
transactions, they give us the best possible counterfactual because the exact same coffee is sold on
the traditional and the FT markets at the same time. Therefore regressions done over different units
of observation for coffee i (sale, delivery by a cooperative, or even part of a delivery) that include
observable quality characteristics and fixed effects at the cooperative or delivery level create a
transparent quality counterfactual, allowing us to measure the true quality-adjusted sales premium
received on the FT market.
3.2. Data
The data consist of the Association’s records on all coffee acquisitions and sales for the
period 1997 to 2009. Each year the Association procures coffee from about 100 cooperatives. Over
the 13-year period, the Association purchased coffee from 300 cooperatives. Suppliers deliver
unhusked (parchment) coffee in small batches from September to the following May. The median
supplier sells 94,000 pounds of coffee per year, the average is 280,000 pounds, in 10 to 12 separate
deliveries. The Association then processes and stocks the coffee, and sells green (unroasted) coffee
beans to international buyers in bags of 150 pounds. Annual sales have increased from less than
100,000 bags to 250,000 bags over this 13-year period (Table 1). Shipment size has not increased; it
is the number of sales that has increased from less than 200 per year to more than 400. Over the
whole period, we thus observe 15,340 deliveries of coffee from cooperatives to the Association and
3,556 sales from the Association to international buyers.
Coffee quality. Although some observable characteristics of the delivery could be informative
as to coffee quality (such as its color, moisture, presence of debris, etc.) most of it is revealed after
processing and tasting. Characteristics and tasting results at the delivery level are not systematically

11
recorded. The only systematic records on quality we have are those reported on the sale contract.
They consist of 13 quality labels such as Extra Prime Washed, Prime Washed, Extra Prime, Strictly
Hard Bean, Hard Bean, Small Bean, etc. There is no doubt however that quality factors
unobservable to us are known to the Association. We can improve the quality control through a
cooperative specific fixed effect, exploiting the fact that most cooperatives have their coffee sold on
both markets at some point. Our final, preferred specification uses fixed effects all the way down to
the delivery level to provide the finest possible control for quality across cooperatives and across
lots.
Prices. On the purchase side, final prices paid to the cooperatives are determined strictly
according to the NY ‘C’ price at the time of the contract, and then the overall net benefits made by
the Association (from FT or quality premium) are distributed across cooperatives proportionately to
their deliveries. This price is therefore not informative of quality. On the sales side however, each
price is negotiated between the Association and the international buyers. Gourmet coffee is a highly
differentiated product, and buyers have specific preferences. Sale contracts are negotiated
throughout the year, but mostly from September to March, for deliveries to take place several weeks
and months later. Price negotiations revolve around a differential to be paid over the future NY ‘C’
price for the position just after the planned delivery. The coffee futures market has 5 positions per
year, in March, May, July, September, and December. For example, a sale contract settled on
December 8 for a delivery of coffee the following April, will use as reference price the December 8
quotation for the May position.10 Contracts report both the future NY ‘C’ price and the differential,
with a mention that the differential accounts for quality and, when applicable, the FT social and
organic premiums. This information on the NY ‘C’ future price and the differential are however not
separately reported in the database; only the resulting final price is. We thus use the time series
provided by the International Coffee Organization, labeled “Indicator price for other Arabica”,
which we refer to in the rest of the paper as the NYC price without quotation marks on the C.11 It is
built as a monthly average of the future price for the following 2nd and 3rd positions, which
approximates the future price that serves in most contracts.
Figure 1 and Table 1 show the evolution of the traditional (non FT) and FT market prices
for conventional and organic coffee for the 13 years of our analysis. The FT floor price has been
10 Sale contracts proceed in two steps. In a first step, negotiation takes place and a contract is signed that specifies quantity, date of delivery, and the differential to be paid relative to the NY ‘C’. The final price is “fixed” at a later date, when the NY ‘C’ price is read and applied to the contract. 11 http://www.ico.org/coffee_prices.asp

12
binding for most of the 20 years since FT was established, except for periods around 1994 (frost
damage in Brazil), 1997-99 (droughts in Brazil), and from 2006 to the present (world food
crisis/commodity boom). Particularly during the coffee crisis of 1999-2003, FT was successful in
delivering large nominal premiums to producers, in some cases exceeding 60¢/lb. Thanks to
effectiveness of the audits conducted by the 19 world labeling initiatives (such as Fair Trade USA for
the US), there appear to be virtually no documented cases of corrupt sales in which FT contracts
were transacted below the minimum price, meaning that the mechanisms in place to monitor prices
seem to be effective.
The average non-FT coffee price received by the Association is very close to the NYC price
in all years. The average FT price calculated from the Association data tracks the FT minimum price
perfectly during periods in which the NYC price falls beneath the floor. During periods when the
NYC price rises above the floor, the average FT price tracks the NYC price quite closely, with some
small surplus visible in average prices. All of the FT prices used in this analysis include the social
premium. The FT organic coffee, on the other hand, while only sold by the Association from 2004
onwards, trades at a large premium compared to all other kinds of coffee.
Unit of observation. Cooperatives provide deliveries of coffee that the Association splits and
reassembles to compose sales lots for foreign buyers. There are many deliveries feeding into any
one sale, but deliveries are also frequently split across different sales. Prices are defined at the sale
level, while quality is partially recorded at the sale level, but also includes unobservables that can only
be captured by cooperative fixed effects. Our analysis will thus exploit these various levels of
observation. First, sales are characterized by their price, date (month and year), and observable
characteristics of coffee quality. Second, in order to build on the knowledge of the cooperative of
origin of the different deliveries, most of the analysis will be done at the delivery-sale pair level, with
the price defined by the sale but quality characterized by the attributes of the deliveries. This data
structure allows us to incorporate fixed effects at the cooperative- or even the delivery-level.
4. EVIDENCE ON RENT DISSIPATION MECHANISMS
4.1. The problem of over-certification
This section provides evidence on predictions H1-H2 from Section 2.4. We start by
calculating the share of all sales that move through the FT market within the Association. To date
the literature has provided no systematic evidence on the total number of producers or coffee
production that are FT certified. We were able to find three estimates of the share of certified

13
coffee that was actually successfully sold on the FT market during the high-premium era: 13.6% in
2001 (Muradian and Pelupessy, 2005), around 50% in 2003 (Levi and Linton, 2003), and 23% in
2006 (Haight 2007).12 However, given that its coffee is all certified, the share of the Association’s
output sold on the FT market allows us to measure this quantity very exactly. Clearly, were it facing
unconstrained demand and an effective premium, the Association would sell no coffee on the
traditional market. This is what happens on the organic market. Less than 5% of the Association’s
coffee was organic, and it was all sold under the FT label. On the non-organic market, the share of
coffee sold as FT averages around 20% and never exceeds 30%, confirming H1.
As seen in Table 1 and in Figure 2, the share of coffee that was sold as FT was particularly
low (down to 13%) in the years where the premium was high, and then as the premium fell over the
past five years of our data the share of coffee sold as FT began to rise again, reaching 27% in 2008-
09. The correlation between the nominal FT premium and the FT sales share is -0.8 in our data.
The specific sales shares are consistent with our theoretical prediction H2: when the floor price is
irrelevant the share of certified coffee sold on the FT market given in equation (1) should equal
30%, the per-unit cost of certification (3¢/lb, as established further down) divided by the social
premium (10¢/lb).
The negative relationship between the FT premium and the share of coffee sold as FT is
difficult to square with any decision that would be taken by the producer, and seems consistent only
with a story in which supply piles into the market when the premium is high, driving down the share
that certified producers are able to sell through the FT channel. Although estimates of the global
FT sales share do not agree exactly with the values from our data, it does appear that the Association
provides a reasonable microcosm of the overall market in terms of the share sold through the FT
market. The Association, uniquely certified to sell whatever it can as FT, saw its ability to move
coffee through the FT channel most constrained by oversupply on the global market in years of high
premium.
4.2. Estimating the FT Premium.
We now move to a direct comparison of FT and non-FT prices, presenting estimates of the
empirical FT premium moving through successively more robust control structures. First, we
12 All are from sources citing FLO’s unpublished data: Raynolds (2002), and Calo and Wise (2005).

14
estimate a hedonic price equation, including fixed effects for the thirteen quality labels recorded in
the Association data. The regression specification is:
smt smt t smt mt smtp Z FT , (3)
where smtp is the contract price of sale s in month m of year t, Z the vector of indicator variables
for each quality label as well as UTZ certified, mt is a month of shipment fixed effect, and FT is an
indicator variable indicating coffee sold as FT. The t parameters are thus the average annual FT
premiums, holding quality premiums constant across time and within quality categories.
As sales prices are explicitly established in reference to the NY ‘C’ price, this suggests an
alternative specification as follows:
psmt
NYCmt Z
smt
tFT
smt
smt, (4)
for the price differential calculated over the NYC price in the corresponding month.
We then use the matching of each delivery to the corresponding sale to perform the
estimation at the delivery-sale pair level. Once we know the cooperative of origin for each delivery,
we can substantially improve the degree of quality control through the inclusion of cooperative fixed
effects. The contract price equation that can be estimated is:
dcsmt smt t smt mt c dcsmtp Z FT , (5)
where the unit of analysis is the delivery d from cooperative c included in sale s in month m of year t.
The advantage of this approach is the possibility of adding a cooperative fixed effect c that absorbs
all the cooperative-specific coffee quality known to the Association or the buyers and hence
potentially used in the selection of coffee for the FT contracts and in the price negotiation. A similar
equation for the price differential with the NYC price is also estimated.
The most rigorous control for quality can be obtained from the coffee deliveries that are
split and then partially sold under FT and partially sold without the FT label. The splitting and
recombination of deliveries to compose sale batches is very common, and these split deliveries are
not different from any other cooperative deliveries in terms of coffee quality, cooperative size, and
average sale price fetched. We observe between 80 and 300 such deliveries each year. For each of
these deliveries we have a price for the part sold under the FT contract and a price for that sold
without the FT label, while in all aspects the product is completely homogeneous. This is a rare case
of a perfect counterfactual for a FT price because we effectively observe the same unit in the

15
‘treated’ and ‘untreated’ states. The only potential substantial difference between these sales is their
timing. We therefore control for the sale time by estimating the following equation:
idsmt t idsmt mt d idsmtp FT (6)
where idsmtp is the price observed for the part i of the delivery d that was sold in sale s in month m of
year t. With a delivery fixed effect d , the coefficient t measures the average FT premium on these
split deliveries.
Estimated annual premiums from these different models are reported in Table 2. Columns
(1) and (2) report results for the contract price (equation 5) and column (3) for the price differential
(equation 6). They show similar results, except for the last year where the price differential model
estimates a lower premium. Estimations including cooperative fixed effects are reported in columns
(4), (5), and (7). In column (5), we restrict the sample to the deliveries that were only sold as either
FT or without the FT label. This provides an estimation from a sample that is completely distinct
from the sample of split deliveries. In column (6), instead of using individual quality categories, we
use a quality index Zsmt̂ , with ̂ obtained from estimating equation (3) on the sale price in non-FT
contracts. The idea is to ensure that the quality control is not affected by some potential different
appreciation of quality in FT contracts. Results on the sub-sample of split deliveries are reported in
column (8). The sample is further restricted to the split deliveries sold in the same month in column
(9).
The estimated FT premiums are similar across the different specifications and samples. The
estimates show that the nominal premium was quite significant in the years 2001 to 2004 with low
NYC price, reaching an average of 62¢/lb over a market price of 63¢/lb, but falling to 6¢/lb over a
market price of 126¢/lb in 2006-2008. These estimated FT premiums are 5-10¢/lb below the value
expected from the FLO formula (FLO, 2009) due to the fact that the quality of the coffee sold as
FT is higher than the coffee that sells at the NYC price. These annual premiums are represented in
Figure 3.
We now bring in the two quantities needed to speak to the net economic benefits of FT
which are the subject of predictions H3 and H4. These are the rate of over-certification and the
cost of certification. First, the product of the sales share and the premium gives the effective
premium per unit of coffee certified, rather than per unit sold through FT. The negative correlation
between the share of the coffee that the Association is able to sell as FT and the premium largely
erases the differential average premium received across the years. This effective premium remained

16
very low, never exceeding 12¢/lb while the coffee sold under the FT label carried a 60-70¢/lb
nominal premium (Figure 3 and Table 1).
Finally, in order to arrive at a correct estimate of net effective premiums, we need estimates
of certification costs. Data from the Association give a figure of 3.09¢/lb. Because this organization
is large it has somewhat lower per-unit costs than those estimated based on a small sample of 16
first-tier Guatemalan cooperatives (3.4¢/lb) for which we calculated certification expenses ourselves.
Certification costs are higher in the first year (6.2¢/lb), and so as a means of picking a conservative
number that captures the ongoing per-pound costs of certification, we use 3¢/lb for our analysis.
Subtracting this amount off of the effective quality-adjusted premium gives our final annual estimate
of the per-pound benefit of FT certification.
The lowest line in Figure 3 gives our estimate of the effective net premium from FT
certification. We see that this benefit has never exceeded 10¢/lb (although coffee was selling for
60¢/lb when the premium was at its highest) and the average net premium over the 13 years of our
data is 1.6¢/lb over an average NY ‘C’ price of 107¢/lb. Over the last five years, 2005-2009, the
average result of participating in the FT market is a loss of 1.2¢/lb, confirming the put-option
pricing of the FT contract due to the presence of the floor. These losses when the floor is not
binding indicate that producers believe that they will in fact be able to exercise the FT option on at
least some of their output in the event of another coffee crisis. These results are entirely consistent
with the story that we have free entry to a mechanism that provides producers with a put on the NY
‘C’. These results are consistent with H4 (an overall very small benefit) and H3 (a negative benefit in
years in which the floor price has been non-binding).
5. ASSESSING THE PRODUCER WELFARE GAINS FROM FT PREMIUMS
Using the rigorously estimated FT premium, we now assess the welfare gains of FT to
producers by simulating alternative price realizations for the 1997-2009 period. This is done both on
a per pound sold basis and, using information on average farm household coffee production, on a
per household basis.
5.1. Producer welfare gains per pound sold
We use our estimation of the FT premium to calculate two sets of counterfactual prices.
First, we consider the price that would have occurred in the absence of the FT opportunity. This is
17
simply calculated by subtracting the estimated average annual FT premium t from the price of
each FT sale psmt
. The difference between the resulting price and the NYC price is attributable to
quality.
psmtnonFT psmt tFTsmt
Alternatively, by applying the FLO price rule strictly, we can compute the prices that would
have prevailed had the FT contract applied to all sales. This simulated FLO price is:
psmtFLO max psmt tFTsmt , NYCmt
The distributions of these simulated prices for all sales made over the period are shown in
Figure 4 and Table 3. Under the FLO rule, no prices should have been observed below the floor
price. This is not the case. However, prices observed below the floor are less frequent than would
have prevailed had the FT premium not been applied, showing that FT did offer some price
protection despite the fact that the Association could not sell 100% of its output at the FT floor
during years in which prices were low.
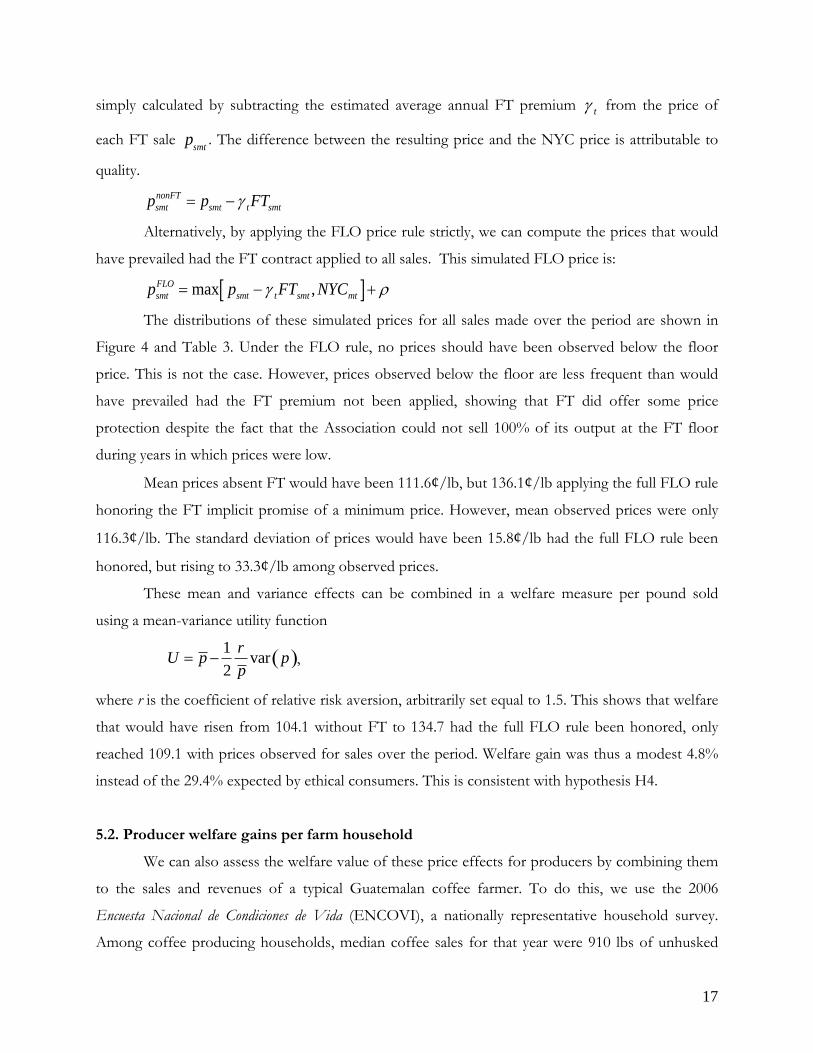
Mean prices absent FT would have been 111.6¢/lb, but 136.1¢/lb applying the full FLO rule
honoring the FT implicit promise of a minimum price. However, mean observed prices were only
116.3¢/lb. The standard deviation of prices would have been 15.8¢/lb had the full FLO rule been
honored, but rising to 33.3¢/lb among observed prices.
These mean and variance effects can be combined in a welfare measure per pound sold
using a mean-variance utility function
1var
2
rU p p
p ,
where r is the coefficient of relative risk aversion, arbitrarily set equal to 1.5. This shows that welfare
that would have risen from 104.1 without FT to 134.7 had the full FLO rule been honored, only
reached 109.1 with prices observed for sales over the period. Welfare gain was thus a modest 4.8%
instead of the 29.4% expected by ethical consumers. This is consistent with hypothesis H4.
5.2. Producer welfare gains per farm household
We can also assess the welfare value of these price effects for producers by combining them
to the sales and revenues of a typical Guatemalan coffee farmer. To do this, we use the 2006
Encuesta Nacional de Condiciones de Vida (ENCOVI), a nationally representative household survey.
Among coffee producing households, median coffee sales for that year were 910 lbs of unhusked

18
(parchment) coffee, which corresponds to roughly 725 lbs of green coffee. This means that if the
whole FT average effective transfer of 1.6¢/lb were transferred through to producers (a big if), the
producer’s income would have increased by about $11 over the course of a year, relative to a median
reported coffee sales value of $206. However, these data also suggest that producers actually receive
around 28¢/lb in a year where the NY‘C’ market price was just over a dollar, so if an analogous
share of the FT premium is passed through, this average benefit would fall to $11*0.28, a gain of $3
per year.
6. CONCLUSION FT is a highly visible and widely used mechanism to attempt to channel benefits to certified
poor producers through the price system. However, can markets be used as the medium for this
transfer without the rents being arbitraged away by competitive pressures? To answer this question,
we used unique data from a large Central American association of coffee cooperatives to measure
the price premium effectively paid to member cooperatives for FT coffee. Batches delivered by a
particular cooperative were often split between FT and non-FT sales, allowing us to observe exactly
the same coffee being sold at the same time on the two markets and providing us with an ideal
natural experiment to identify the premium actually paid to FT coffee producers. We find that while
the nominal FT price premium was up to 60¢/lb at the worst of the coffee crisis, the effective
premium at that time was only about 10¢/lb once adjustments are made for over-certification and
coffee quality. Over the 13 year period for which sales are observed, the average NY ‘C’ market
price was 107¢/lb. Subtracting a conservative certification cost of 3¢/lb, the adjusted FT premium
over the period was 1.6¢/lb. Over the last 5 years, the premium was negative, equal to –1.2¢/lb.
Once rent dissipation mechanisms have been taken into account, it appears to be the case that FT
price premiums have been close to zero. Consistent with a simple theoretical model, FT has worked
as a utility-priced put option whose price is fixed, and whose benefit to producers is pushed to zero
by the effect of entry on the probability that the put can be exercised.
Our results are based on a single organization within a single country, and so it is natural to
question the extent to which they are representative of FT coffee markets as a whole. Our estimates
of the effective premium are composed of three basic quantities: the nominal FT premium net of
quality, the share of certified coffee sold as FT, and the per-unit costs of certification. Because of
the internal diversity and second-tier certification of our study institution, we have an unusual ability

19
to look at price variation within seasons, within individual cooperatives, and even within specific
deliveries across FT and non-FT sales. We therefore believe that the most rigorously estimated part
of the study is the nominal FT premium. As for the share sold as FT, there is no particular reason
that any one institution is representative of the market as a whole. However, the average share sold
as FT by our study institution (22%) is close to the average of independent estimates of the global
sales share (26%) and so it appears that this institution is broadly representative of the overall
market.13 Finally, our per-unit certification cost (3¢/lb) is for recertifying a large cooperative, and
therefore if anything underestimates the cost for an average-sized cooperative considering the
decision to undertake certification on the margin. Overall, it therefore appears that our results do
provide real insights into the working of the FT coffee market.
We close by discussing two aspects of the FT puzzle: Why does it persist in spite of lack of
delivery? Are there other ways of using the market mechanism to transfer to producers the price
premiums paid by ethical consumers?
We started from the observation that 75% of private donations in the United States originate
from individuals, posing the challenge of how to effectively transfer millions of dispersed small
donations to intended beneficiaries. By using the market mechanism and the existing value chain for
coffee, FT promises to combine low transactions costs with the ability to target benefits to “the
hands that picked my coffee”. We suggest that this promise is not borne out in reality because of a
lack of control over entry to the system. The current FT market fails to deliver large benefits
because the system codifies prices while leaving quantity and quality as free parameters. The design
of the current system thereby allows for the complete dissipation of producer rents without any
infraction of the rules. Lack of transparency in the rent dissipation mechanisms helps explain the
puzzling coincidence of persistent high popularity among ethical consumers and lack of substantial
benefits to producers. Consumers cannot easily infer the two quantities they would need to know to
correctly gauge producer rents: the share of coffee from that certified producer that was not sold as
FT, and the price of that exact same coffee on the traditional market. Producer benefits may indeed
have been large when the system was nascent, and the trend towards rent dissipation is quite opaque
to consumers. In this sense, the publication of results such as these creates a natural experiment: if
all consumer welfare from FT arises from the desire for producer profits , this fully arbitraged
13 Replacing the observed annual share sold as FT from our institution with the constant average from the independent estimates (26%) makes virtually no difference to our results; the peak effective premium would be 2-3¢/lb higher during the coffee crisis but would still have been negative for four of the last five years.

20
market is inherently unstable and may collapse if consumers come to perceive that producers realize
no benefit. If on the other hand FT demand results primarily from an intrinsic benefit to
consumers, then the market can continue to endure in the open-access equilibrium despite delivering
no rents to producers.
Finally, it is worth considering whether some alternative market-based mechanism might
successfully deliver the benefits that ethical consumers willingly seek to transfer to producers. While
this paper has revealed the specific mechanisms that cause price arbitrage under the current FT
system, careful consideration of other potential market-linked charity mechanisms seems to suggest
that pessimism is in order. One is cartelization of FT, limiting the number of members that are
allowed to obtain certification, as a solution to the free entry problem studied here. However, given
the enormous extensive margin of genuinely poor and deserving coffee producers, any effort to
cartelize FT is likely to come under the well-known competitive pressures; both within any given
label and from alternative labeling that will mimic the FT objective. This can already be seen in the
multiplication of similar labels , such as Whole Foods ‘Whole Trade’ label, Equal Exchange, and the
recent resignation of Fair Trade USA from the international Fair Trade Labeling Organization so as
to be able to ‘extend the benefits of Fair Trade to millions more farmers and workers’.14
Alternatively, individual buyers or roasters of coffee can elect to transact with specific producers at
above-market prices via ‘direct trade’, but precisely because they do not exploit commodity
exchanges these systems are likely to be difficult to scale because of high transactions costs. The
logic laid out in this paper suggests that well-intentioned consumers may be better served by
institutions that transfer benefits directly rather than trying to channel them through product
markets.
14 http://fairtradeforall.com/q-and-a/making-it-happen/why-is-fair-trade-usa-leaving-the-international-fairtrade-system/

21
REFERENCES
Arnould, Eric, Alejandro Plastina, and Dwayne Ball. 2009. “Does Fair Trade Deliver on Its Core Value Proposition? Effects on Income, Educational Attainment, and Health in Three Countries.” Journal of Public Policy & Marketing 28(2): 186-201.
Arnot, Chris, Peter Boxall, and Sean Cash. 2006. “Do Ethical Consumers Care about Price? A Revealed Preference Analysis of Fair Trade Coffee Purchases.” Canadian Journal of Agricultural Economics 54(4): 555-565.
Basu, Arnab, and Robert Hicks. 2008. “Label Performance and the Willingness to Pay for Fair Trade Coffee: A Cross-National Perspective.” International Journal of Consumer Studies 32(5): 470-78.
Becchetti, Leonardo, and Marco Constantino. 2008. “The Effects of Fair Trade on Affiliated Producers: An Impact Analysis for Kenyan Farmers.” World Development 36(5): 823-42.
Black, Fischer, and Myron Scholes. 1973. “The Pricing of Options and Corporate Liabilities.” The The Journal of Political Economy 81(3): 637-654.
Bondarenko, Oleg. 2009. “Why are Put Options So Expensive?” Mimeo, University of Illinois at Chicago.
Calo, Muriel, and Timothy Wise. 2005. “Revaluing Peasant Coffee Production: Organic and Fair Trade Markets in Mexico.” Global Development and Environment Institute, Tufts University.
Crawford, Vincent. 1977. “A Game of Fair Division.” The Review of Economic Studies 44(2): 235-247. Elfenbein, Daniel, and Brian McManus. 2010. “A Greater Price for a Greater Good? Evidence that
Consumers Pay More for Charity-Linked Products.” American Economic Journal: Economic Policy 2(2): 28-60.
FLO. 2009. Fair Trade Minimum Price and Fair Trade Premium Table. Current version: 22.07.2009. Available at http://www.fairtrade.net/fileadmin/user_upload/content/2009 /standards/ documents/ 220709_EN_FTMP_and_P_Table.pdf.
Giving USA Foundation. 2010. Giving USA 2010: The annual report on philanthropy for the year 2009. The Center of Philanthropy at Indiana University.
Haight, Colleen. 2007. “Does Fair Trade Coffee Help the Poor? Evidence from Guatemala and Costa Rica.” Mercatus Center, Policy comment #11, George Mason University.
Hainmuller, Jens, Michael Hiscox, and Sandra Sequeira. 2011. “Consumer Demand for the Fair Trade Label: Evidence from a Field Experiment.” MIT Political Science Department Research Paper No. 2011-9B.
Henderson, David. 2008. “Fair Trade is Counterproductive and Unfair.” Economic Affairs 28(3): 62-64.
Hsieh, Chang-Tai, and Enrico Moretti. 2003. “Can Free Entry be Inefficient? Fixed Commissions and Social Waste in the Real Estate Industry.” Journal of Political Economy 111(5): 1076-1122.
Levi, Margaret, and April Linton. 2003. “Fair Trade: A Cup at a Time?” Politics and Society 31(3): 407-32.
Marcus, Alan and David Modest. 1984. “Futures Markets and Production Decisions.” The Journal of Political Economy 92(3): 409-426.
Muradian, Rodlan, and Wim Pelupessy. 2005. “Governing the Coffee Chain: The Role of Voluntary Regulatory Systems.” World Development 33(12): 2029-2044.
Null, Claire. 2011. “Warm glow, information, and inefficient charitable giving.” Journal of Public Economics 95(5-6): 455-65.
Poret, Sylvaine, and Claire Chambolle. 2007. “Fair Trade Labeling: Inside or Outside Supermarkets?” Journal of Agricultural and Food Industrial Organization 5(1): Article 9. Berkeley Electronic Press.

22
Raynolds, Laura. 2002 “Poverty Alleviation Through Participation in Fair Trade Coffee Networks: Existing Research and Critical Issues.” http://www.colostate.edu/Depts/ Sociology/FairTradeResearchGroup
Sidwell, Marc. 2008. Unfair Trade. London: Adam Smith Institute. Smith, Alastair. 2009. “Evaluating the Criticisms of Fair Trade.” Economic Affairs 29(4): 29-36. Soetevent, Adriaan. 2011. “Payment Choice, Image Motivation, and Contributions to Charity:
Evidence from a Field Experiment.” American Economic Journal: Economic Policy 3(1): 180-205. Stiglitz, Joseph, and Andrew Weiss. 1981. “Credit rationing in markets with imperfect information.”
American Economic Review 71(3): 393-410. Utting-Chamorro, Karla. 2005. “Does Fair Trade Make a Difference? The Case of Small Coffee
Producers in Nicaragua.” Development in Practice 15(3): 584-99.

23
Figure 1. Evolution of coffee prices over time (US¢/lb)
Note: NYC price is the International Coffee Organization Indicator price for other Arabica (www.ico.org/coffee_prices.asp). Average prices are from the Association sales.

24
Figure 2. Gross FT premium and share of non-organic coffee sold under FT contracts
Note: The gross FT premium reported is from column (4) in Table 2. Share is from the Association sales data.
Figure 3. Net effective FT premium over time
0
10
20
30
40
50
60
70
80
1996 1998 2000 2002 2004 2006 2008 2010
Fai
r T
rad
e p
rem
ium
(U
S c
ents
/lb
)
0
5
10
15
20
25
30
35
Sh
are
of F
T in
tot
al s
ales
(%
)
-10
0
10
20
30
40
50
60
70
80
1996 1997 1998 1999 2000 2001 2002 2003 2004 2005 2006 2007 2008 2009 2010
Fai
r T
rad
e p
rem
ium
(U
S c
ents
/lb
)

25
Figure 4. Price distribution under different pricing rules
FLO rule (right scale)
Observed priceWithout FT premium
0.0
2.0
4.0
6.0
8.1
FL
O p
rice
rul
e
0.0
1.0
2.0
3.0
4.0
5
0 50 100 150 200 250Sale price (US cts/lb)

26
Table 1. Share of non-organic coffee sold under FT contract and effective premium
Shipment Total sales Fair Trade NYC price FT av. price FT premiumyear (bags of 69kg) share (%) US$ cents/lb US$ cents/lb FLO formula on FT sales Effective (% of FT price)
1997* 14,065 23.1 171.5 190.6 5.0 3.3 0.8 1.71998 65,025 27.1 143.0 161.4 7.9 16.1 4.4 10.01999 105,801 22.1 105.3 127.9 25.7 9.8 2.2 7.72000 131,805 14.3 91.6 126.7 39.4 27.4 3.9 21.62001 128,293 18.7 64.9 127.8 66.1 64.3 12.0 50.32002 153,290 12.6 60.8 129.8 70.2 61.0 7.7 47.02003 153,533 19.3 64.2 130.1 66.8 61.7 11.9 47.42004 164,237 19.7 78.7 130.2 52.3 42.7 8.4 32.82005 187,302 22.1 119.5 134.3 13.2 4.1 0.9 3.02006 200,744 26.5 113.3 133.0 17.8 9.3 2.5 7.02007 216,474 23.6 120.0 138.6 14.4 6.4 1.5 4.62008 251,739 27.3 143.6 159.1 11.3 2.0 0.5 1.32009* 227,360 26.6 139.4 153.0 12.4 12.8 3.4 8.3
NYC price: Indicator price for other Arabica, International Coffee Organization
* Sales in 1997 are only those of the 1997 harvest, which occurred in November and December. Sales in 2009, up to July 2009.
FT premium (US$ cents/lb)
The FLO formula is based on the FT floor price, the NYC price, and the social premium; The premium on FT sales is estimated, controlling for observed quality characteritics, and cooperative and shipment time fixed effects. The effective premium is obtained by multiplying the premium of FT sales by the share of the coffee sold with the FT label.

27
Table 2. Estimation of the annual FT premium
Contract price
(US cts/lb)
Contract price
(US cts/lb)
Price differential (US cts/lb)
Contract price
(US cts/lb)
Contract price
(US cts/lb)
Contract price
(US cts/lb)
Price differential (US cts/lb)
Contract price
(US cts/lb)
Contract price
(US cts/lb)(1) (2) (3) (4) (5) (6) (7) (8) (9)
Fair trade premium1997 11.25 6.31 10.07 3.26 14.86 4.74 8.80 4.73 4.73
[5.16]* [5.21] [7.28] [4.70] [5.80]* [4.47] [7.00] [1.03]** [1.02]**1998 7.87 11.79 8.51 16.12 14.42 15.75 7.01 18.22 22.50
[3.19]* [2.85]** [1.95]** [3.91]** [4.45]** [3.72]** [3.24]* [1.27]** [1.20]**1999 10.79 12.54 15.60 9.83 13.06 9.79 13.45 10.97 10.95
[1.70]** [1.50]** [1.51]** [1.48]** [1.90]** [1.49]** [1.88]** [0.65]** [0.66]**2000 25.14 24.03 27.59 27.36 27.97 27.42 31.17 19.62 20.35
[2.94]** [2.80]** [2.71]** [2.78]** [7.49]** [2.81]** [2.86]** [0.75]** [0.73]**2001 64.57 64.41 58.52 64.26 64.73 63.24 58.08 60.88 61.11
[1.09]** [1.08]** [0.96]** [0.88]** [1.15]** [0.82]** [0.80]** [0.60]** [0.59]**2002 61.85 61.90 64.72 60.97 62.34 60.84 63.55 53.71 52.80
[1.24]** [1.28]** [1.08]** [1.65]** [1.07]** [1.49]** [1.15]** [2.80]** [3.27]**2003 60.60 61.69 60.66 61.69 61.57 60.82 58.33 57.51 53.83
[0.87]** [0.79]** [0.66]** [0.55]** [0.65]** [0.49]** [0.58]** [1.16]** [1.46]**2004 45.19 46.51 46.17 42.71 43.18 41.92 42.56 41.17 45.22
[1.45]** [1.40]** [0.87]** [1.72]** [1.47]** [1.71]** [0.94]** [1.84]** [1.68]**2005 6.73 7.62 12.24 4.09 3.92 4.04 9.91 0.79 2.63
[1.17]** [1.10]** [1.14]** [1.11]** [1.18]** [1.06]** [1.29]** [1.62] [2.32]2006 12.58 13.55 16.54 9.26 9.19 8.89 10.14 6.87 6.76
[1.33]** [1.30]** [1.35]** [0.69]** [0.76]** [0.67]** [0.76]** [0.80]** [1.07]**2007 12.36 12.86 14.83 6.44 6.1 6.59 7.00 8.27 9.14
[1.27]** [1.22]** [1.11]** [0.99]** [1.03]** [0.91]** [0.95]** [0.82]** [1.03]**2008 17.79 17.66 19.63 2.01 1.96 1.93 4.56 0.14 3.34
[2.49]** [2.41]** [2.50]** [1.28] [1.45] [1.25] [1.58]** [1.05] [1.29]**2009 19.74 21.49 14.60 12.77 13.32 11.44 4.09 5.55 2.83
[2.54]** [2.50]** [2.32]** [1.32]** [1.33]** [1.30]** [1.43]** [2.41]* [3.31]Controls Quality N Individual Individual Individual Individual Index Individual - - Shipment month FE Y Y N Y Y Y N Y - Coop FE N N N Y Y N Y N N Delivery FE N N N N N N N Y YUnit of analysis Sale Sale SaleObservations 3934 3934 3934 16312 12480 16312 16312 5759 4403Number of coops / deliveries FE 296 286 296 1874 1451R-squared 0.83 0.86 0.57 0.94 0.94 0.93 0.67 0.73 0.68Robust standard errors in brackets (clustered at the sale level for columns (4) to (7)).* significant at 5%; ** significant at 1%
Coop delivery - sale
Individual quality indicators are: Prime-washed, Extra Prime washed, HB, SHB, Fancy SHB, SHB-HH, SHB-EPW, GAP, and Small Beans. All regressions also control for UTZ certification.Restricted samples: (5) deliveries exclusively sold as FT or non-FT, (8) deliveries sold partly as FT and partly as non-FT, (9) deliveries sold partlyas FT and partly as non-FT with same shipment month.

28
Table 3. Decomposing the welfare effects of FT: Price distribution and utility under different
pricing rules
Mean price (US cts/lb)
Standard deviation of prices Mean-variance
(US cts/lb) welfare
1 Observed prices less estimated FT premium
2 Applying FLO rule3 Observed prices
Welfare = (mean - 0.5 (rho/mean) variance), w
111.6
136.1116.3
where relative risk aversi
33.5 104.1
15.8 134.733.3 109.1
ion rho = 1.5.