Embed Size (px)
Citation preview
520 Fifth Avenue Fairbanks, Alaska 99701 | (907) 452-2000 | www.k12northstar.org
Fairbanks North Star Borough School District
2017 - 2018 Budget Fairbanks North Star Borough Assembly | April 20, 2017

Dr. Karen Gaborik Superintendent of Schools

Our mission is to provide
an excellent, equitable
education in a safe,
supportive environment
so all students will
succeed and contribute
to a diverse and
changing society.

Core Values
Student-Centered
Respect
Safe Environment
High Expectations
Collaborative
Innovative
Integrity
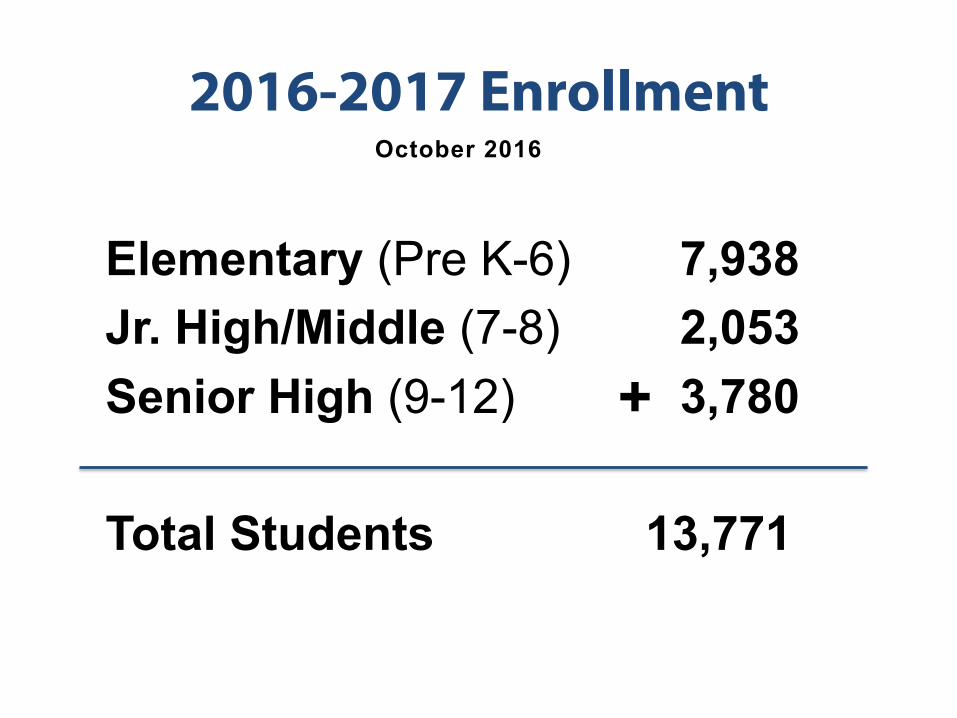
2016-2017 Enrollment
Elementary (Pre K-6) 7,938 Jr. High/Middle (7-8) 2,053 Senior High (9-12) 3,780 Total Students 13,771
October 2016
+
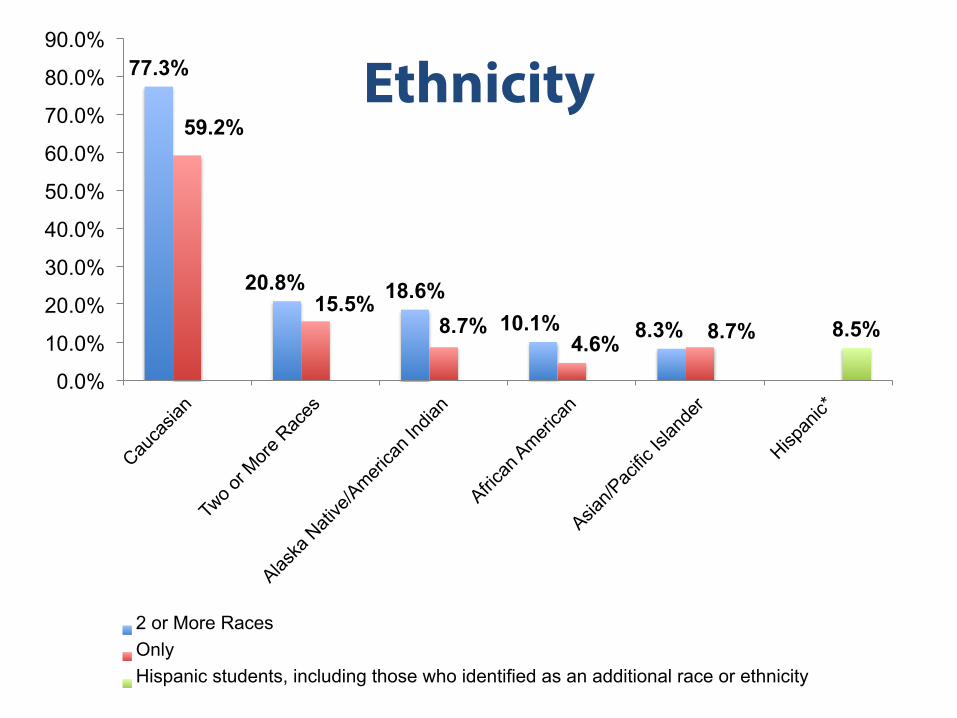
Ethnicity 77.3%
20.8% 18.6% 10.1% 8.3%
59.2%
15.5% 8.7%
4.6% 8.7% 8.5%
0.0%
10.0%
20.0%
30.0%
40.0%
50.0%
60.0%
70.0%
80.0%
90.0%
2 or More Races Only Hispanic students, including those who identified as an additional race or ethnicity
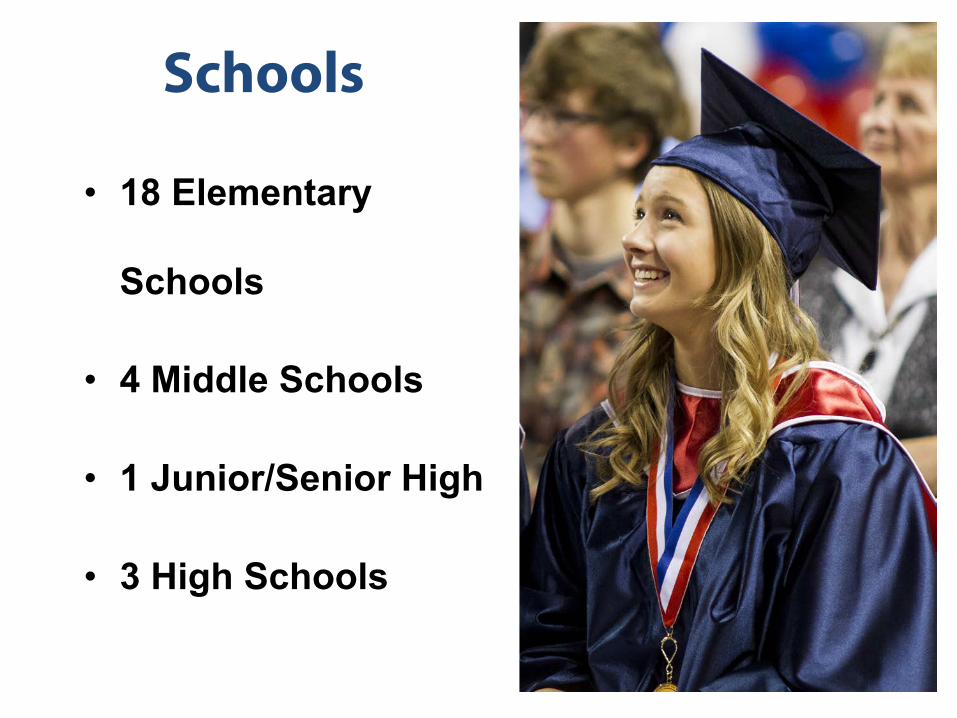
Schools
• 18 Elementary
Schools
• 4 Middle Schools
• 1 Junior/Senior High
• 3 High Schools
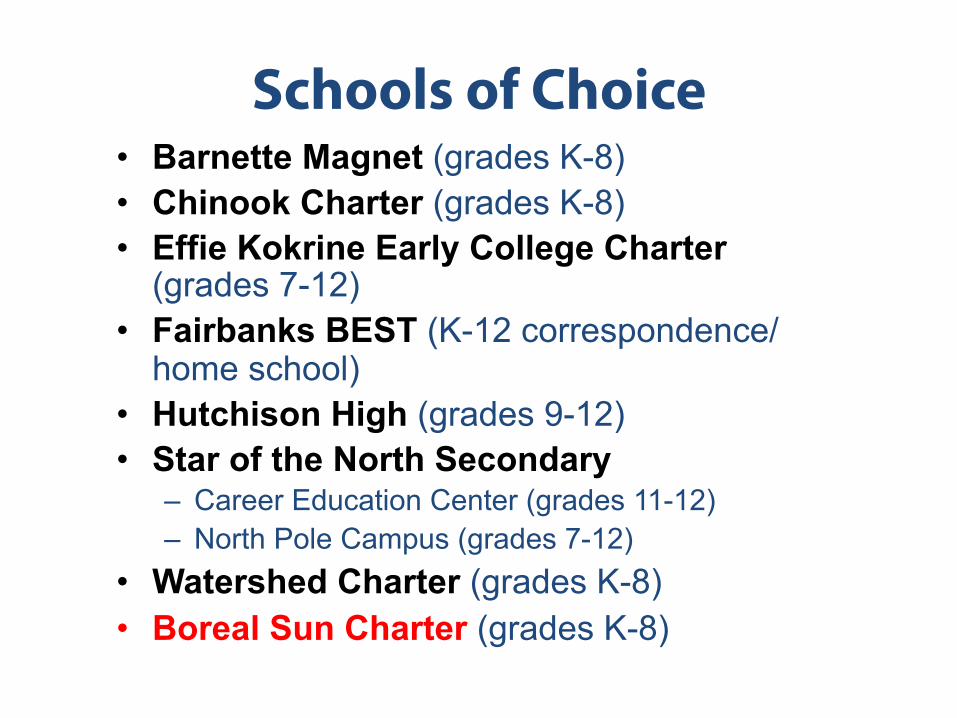
Schools of Choice • Barnette Magnet (grades K-8) • Chinook Charter (grades K-8) • Effie Kokrine Early College Charter
(grades 7-12) • Fairbanks BEST (K-12 correspondence/
home school) • Hutchison High (grades 9-12) • Star of the North Secondary
– Career Education Center (grades 11-12) – North Pole Campus (grades 7-12)
• Watershed Charter (grades K-8) • Boreal Sun Charter (grades K-8)
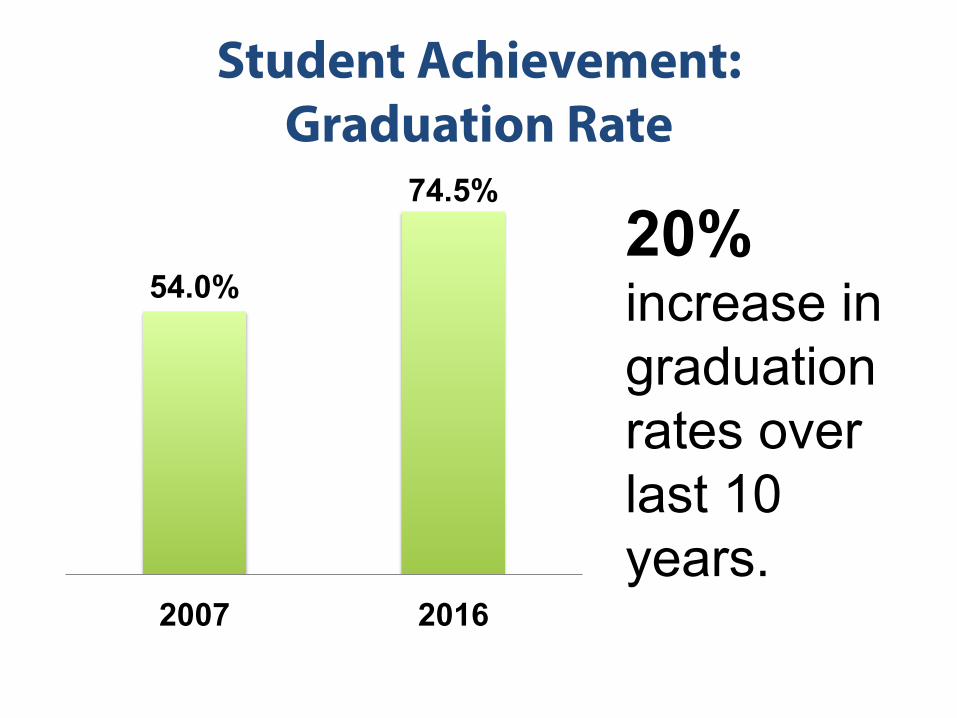
Student Achievement: Graduation Rate
54.0%
74.5%
2007 2016
20% increase in graduation rates over last 10 years.
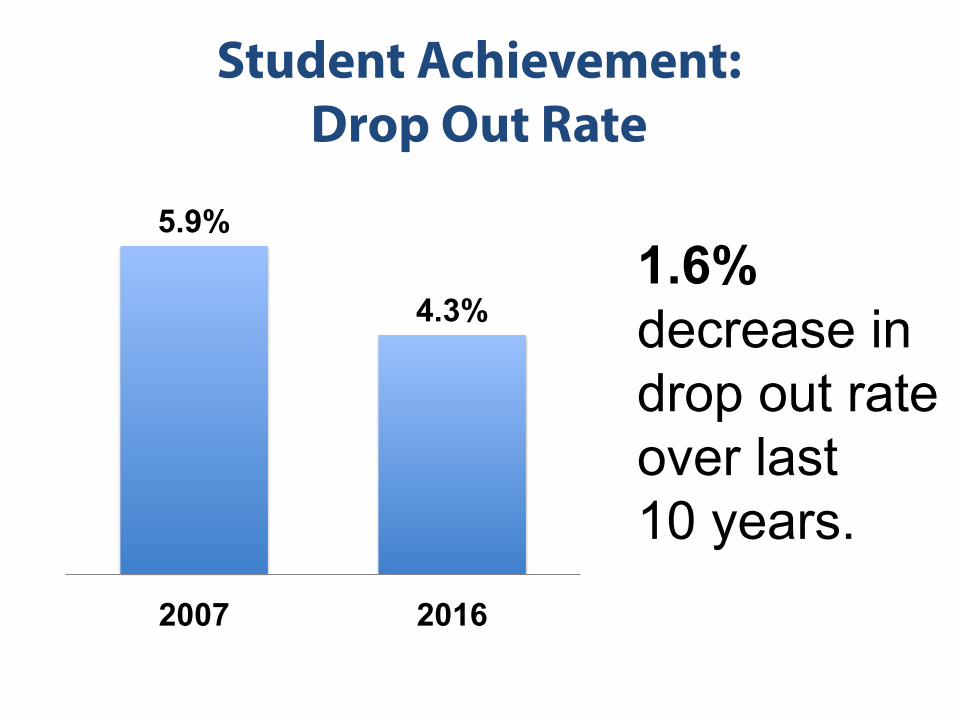
Student Achievement: Drop Out Rate
5.9%
4.3%
2007 2016
1.6% decrease in drop out rate over last 10 years.
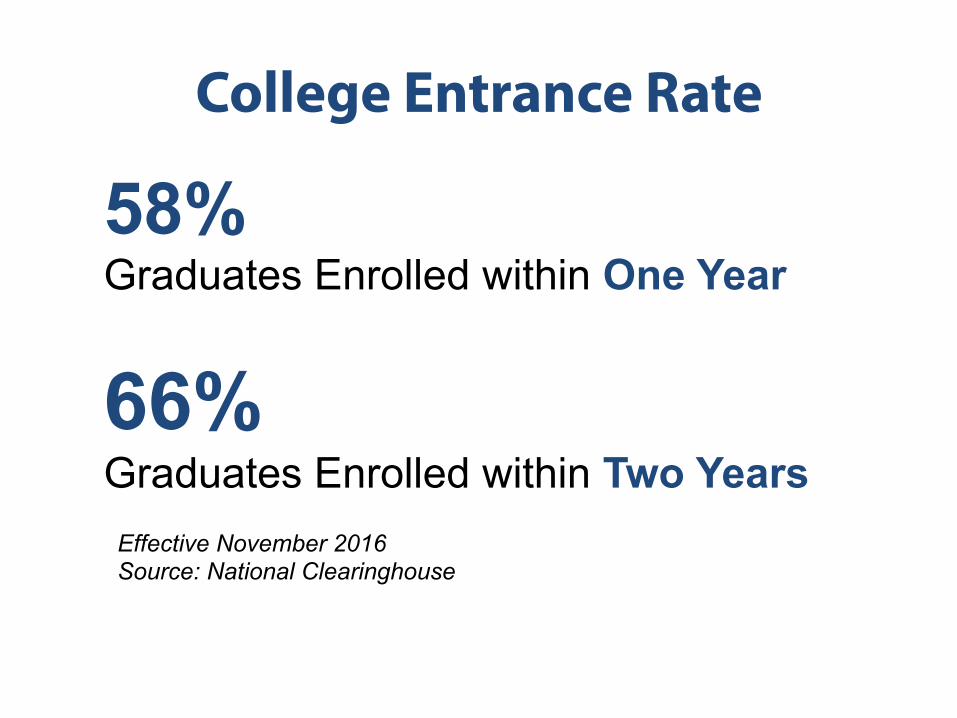
College Entrance Rate
58% Graduates Enrolled within One Year
66% Graduates Enrolled within Two Years
Effective November 2016 Source: National Clearinghouse
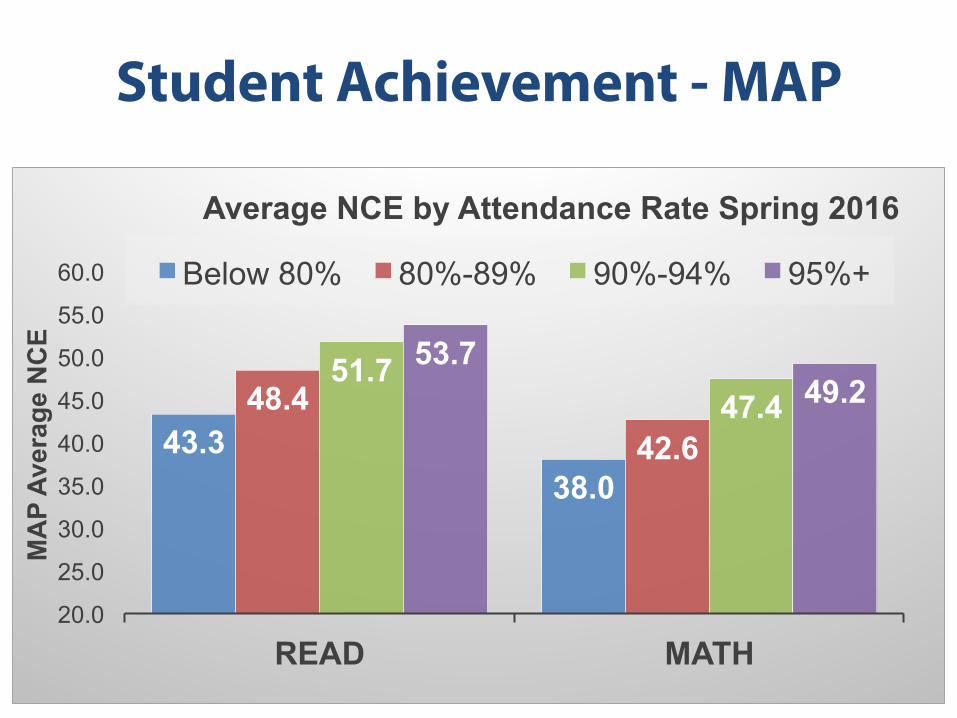
Student Achievement - MAP
43.3 38.0
48.4 42.6
51.7 47.4
53.7 49.2
20.0
25.0
30.0
35.0
40.0
45.0
50.0
55.0
60.0
READ MATH
MA
P Av
erag
e N
CE
Average NCE by Attendance Rate Spring 2016
Below 80% 80%-89% 90%-94% 95%+

Student Achievement
We envision learning without boundaries, where every student achieves his/her path to academic and career success. Learning will be driven by student need, through flexible and adaptive options. Supporting the district’s educational system are highly engaged families; proven technology infrastructure; staff that are continually raising the bar in their profession; and a community that is committed to growing our future.

Lisa Pearce, SFO Chief Financial Officer
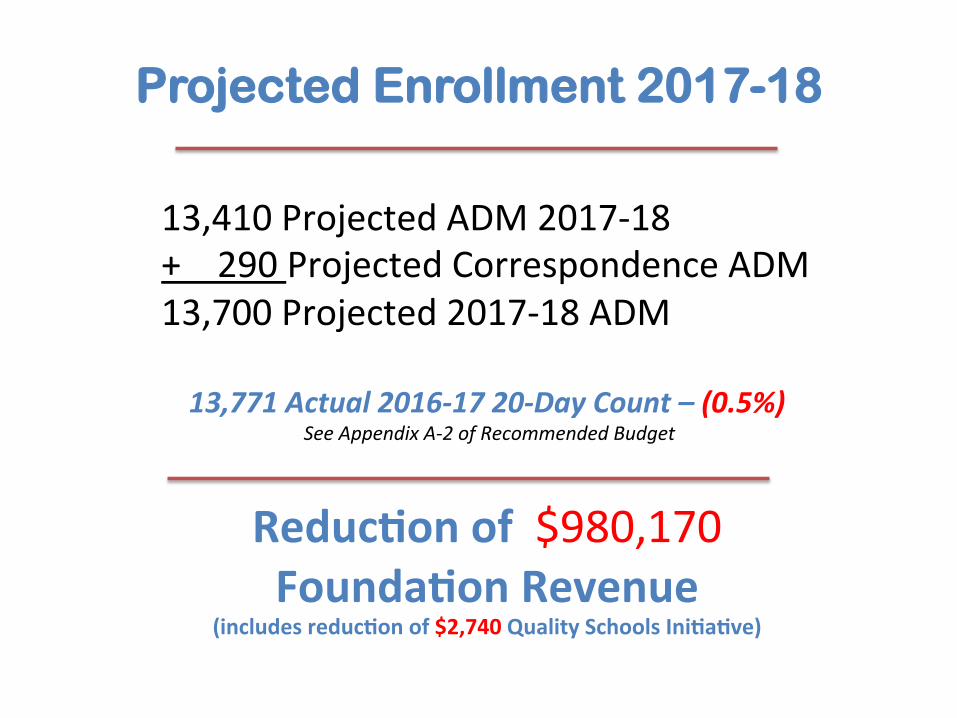
13,410ProjectedADM2017-18 +290ProjectedCorrespondenceADM 13,700Projected2017-18ADM
13,771Actual2016-1720-DayCount–(0.5%)
SeeAppendixA-2ofRecommendedBudget
Reduc&onof$980,170Founda&onRevenue
(includesreduc&onof$2,740QualitySchoolsIni&a&ve)
Projected Enrollment 2017-18
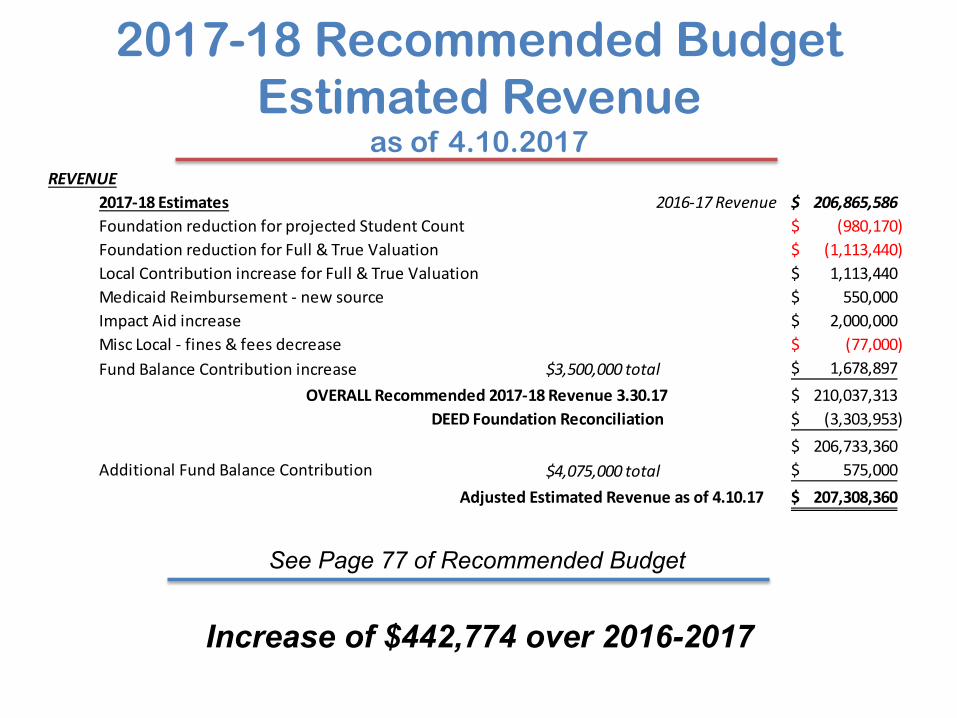
2017-18 Recommended Budget Estimated Revenue
as of 4.10.2017
Increase of $442,774 over 2016-2017
REVENUE2017-18Estimates 2016-17Revenue 206,865,586$FoundationreductionforprojectedStudentCount (980,170)$FoundationreductionforFull&TrueValuation (1,113,440)$LocalContributionincreaseforFull&TrueValuation 1,113,440$MedicaidReimbursement-newsource 550,000$ImpactAidincrease 2,000,000$MiscLocal-fines&feesdecrease (77,000)$FundBalanceContributionincrease $3,500,000total 1,678,897$
OVERALLRecommended2017-18Revenue3.30.17 210,037,313$DEEDFoundationReconciliation (3,303,953)$
206,733,360$AdditionalFundBalanceContribution $4,075,000total 575,000$
AdjustedEstimatedRevenueasof4.10.17 207,308,360$
See Page 77 of Recommended Budget
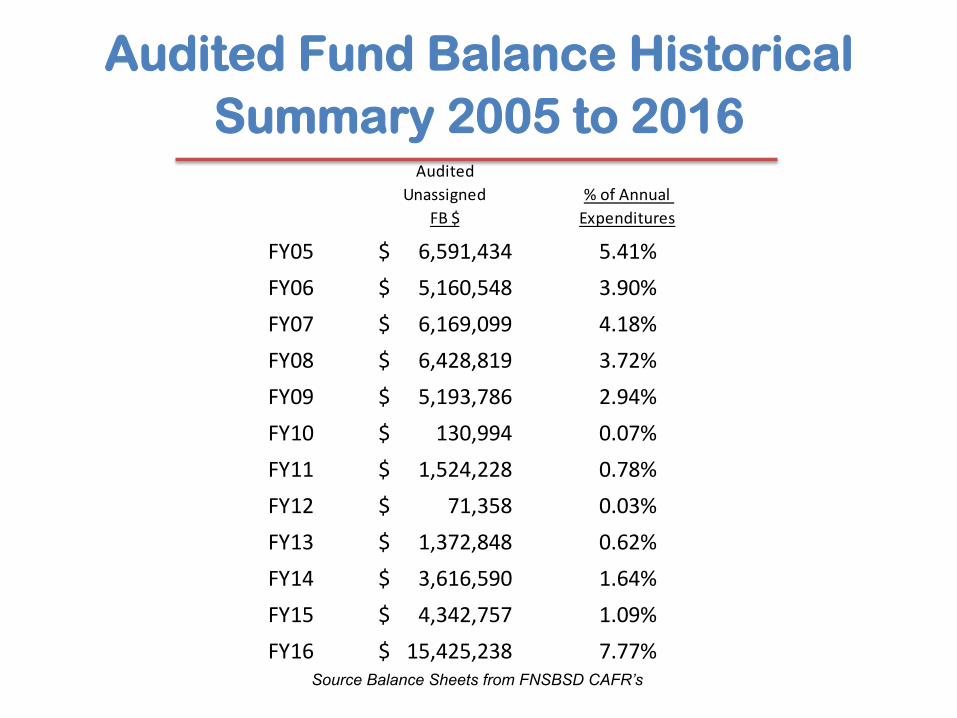
Audited Fund Balance Historical
Summary 2005 to 2016 Audited
UnassignedFB$
%ofAnnualExpenditures
FY05 6,591,434$ 5.41%FY06 5,160,548$ 3.90%FY07 6,169,099$ 4.18%FY08 6,428,819$ 3.72%FY09 5,193,786$ 2.94%FY10 130,994$ 0.07%FY11 1,524,228$ 0.78%FY12 71,358$ 0.03%FY13 1,372,848$ 0.62%FY14 3,616,590$ 1.64%FY15 4,342,757$ 1.09%FY16 15,425,238$ 7.77%
Source Balance Sheets from FNSBSD CAFR’s
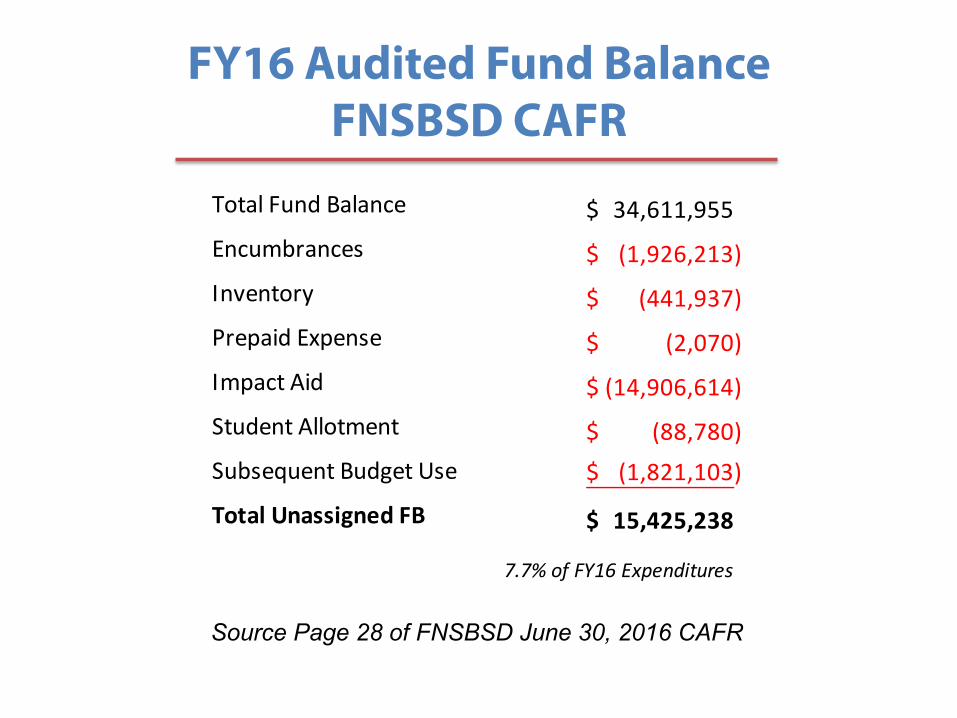
FY16 Audited Fund Balance FNSBSD CAFR
TotalFundBalance 34,611,955$Encumbrances (1,926,213)$Inventory (441,937)$PrepaidExpense (2,070)$ImpactAid (14,906,614)$StudentAllotment (88,780)$SubsequentBudgetUse (1,821,103)$
TotalUnassignedFB 15,425,238$
7.7%ofFY16Expenditures
Source Page 28 of FNSBSD June 30, 2016 CAFR
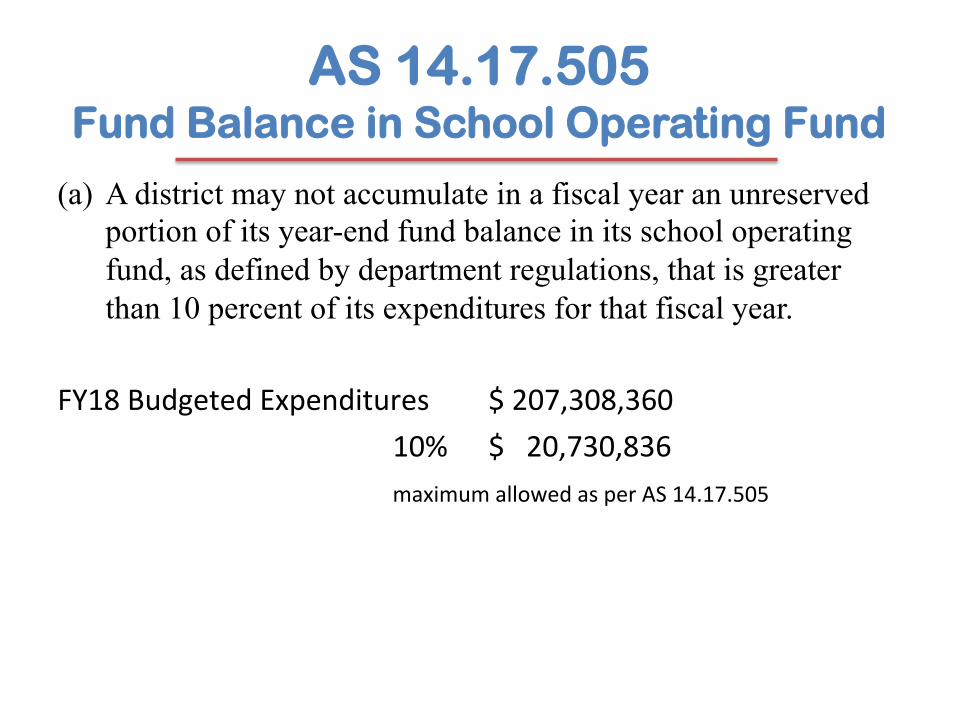
AS 14.17.505 Fund Balance in School Operating Fund
(a) A district may not accumulate in a fiscal year an unreserved portion of its year-end fund balance in its school operating fund, as defined by department regulations, that is greater than 10 percent of its expenditures for that fiscal year.
FY18BudgetedExpenditures $207,308,360
10% $20,730,836 maximumallowedasperAS14.17.505
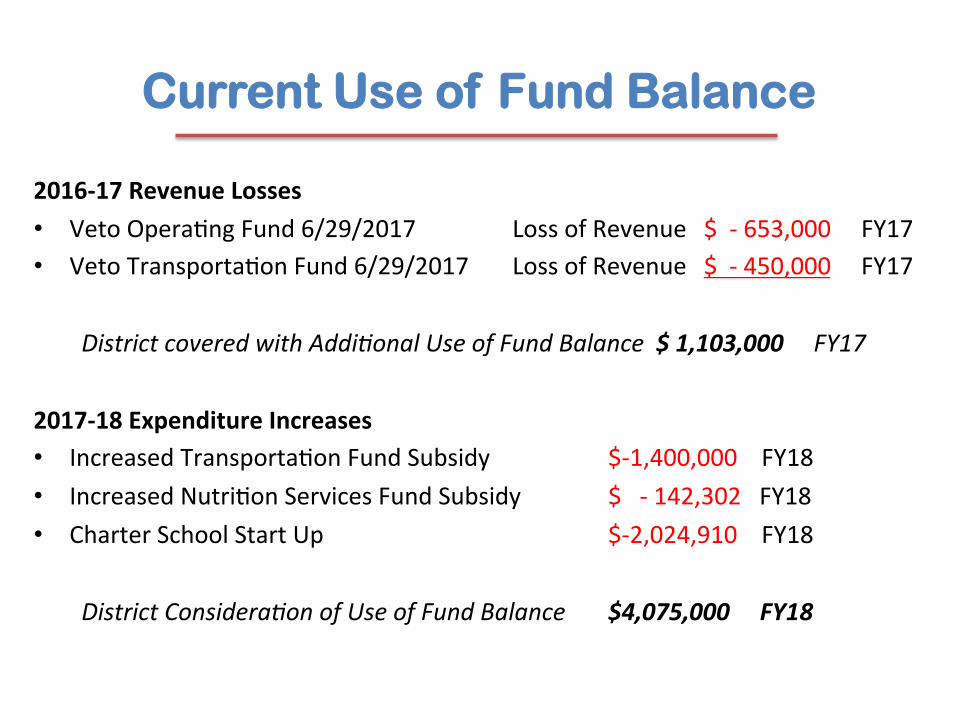
Current Use of Fund Balance
2016-17RevenueLosses• VetoOperaPngFund6/29/2017 LossofRevenue $-653,000FY17• VetoTransportaPonFund6/29/2017 LossofRevenue $-450,000FY17
DistrictcoveredwithAddi;onalUseofFundBalance $1,103,000FY172017-18ExpenditureIncreases• IncreasedTransportaPonFundSubsidy $-1,400,000FY18• IncreasedNutriPonServicesFundSubsidy $-142,302FY18• CharterSchoolStartUp $-2,024,910FY18
DistrictConsidera;onofUseofFundBalance $4,075,000FY18
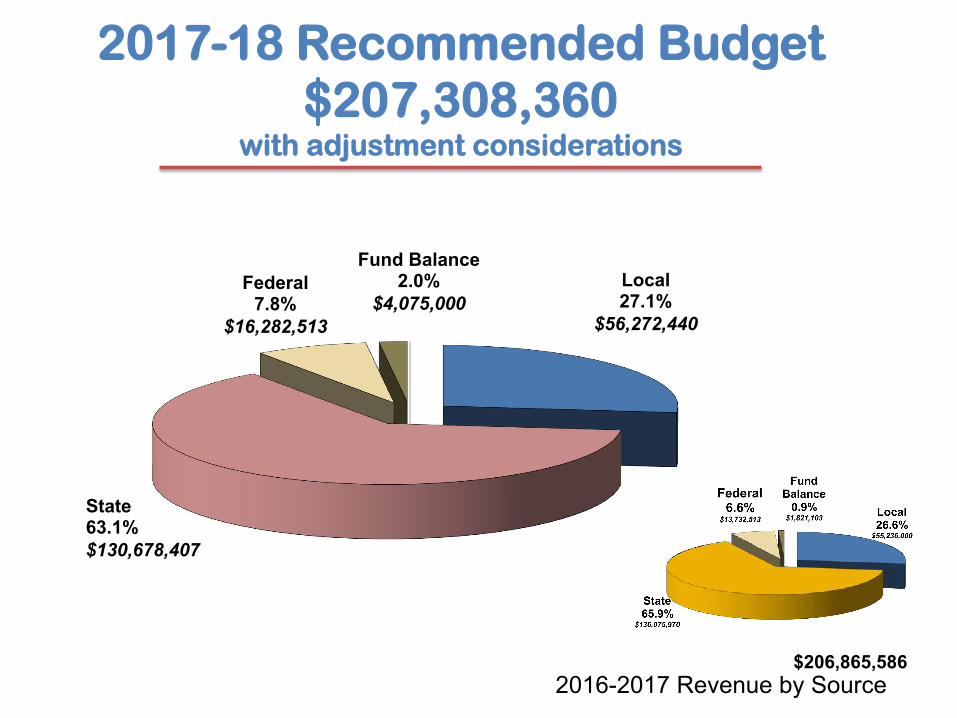
2017-18 Recommended Budget $207,308,360
with adjustment considerations
Local 27.1%
$56,272,440
State 63.1% $130,678,407
Federal 7.8%
$16,282,513
Fund Balance 2.0%
$4,075,000
2016-2017 Revenue by Source $206,865,586
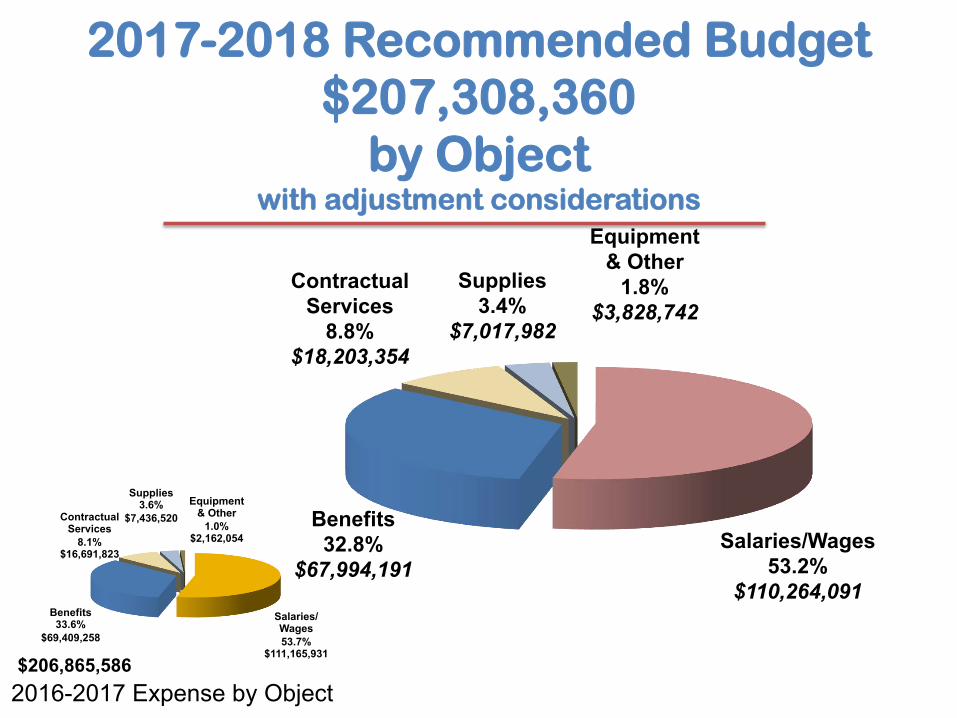
2017-2018 Recommended Budget $207,308,360
by Object with adjustment considerations
Salaries/Wages 53.2%
$110,264,091
Benefits 32.8%
$67,994,191
Contractual Services
8.8% $18,203,354
Supplies 3.4%
$7,017,982
Equipment & Other
1.8% $3,828,742
2016-2017 Expense by Object
Salaries/Wages 53.7%
$111,165,931
Benefits 33.6%
$69,409,258
Contractual Services
8.1% $16,691,823
Supplies 3.6%
$7,436,520
Equipment & Other
1.0% $2,162,054
$206,865,586
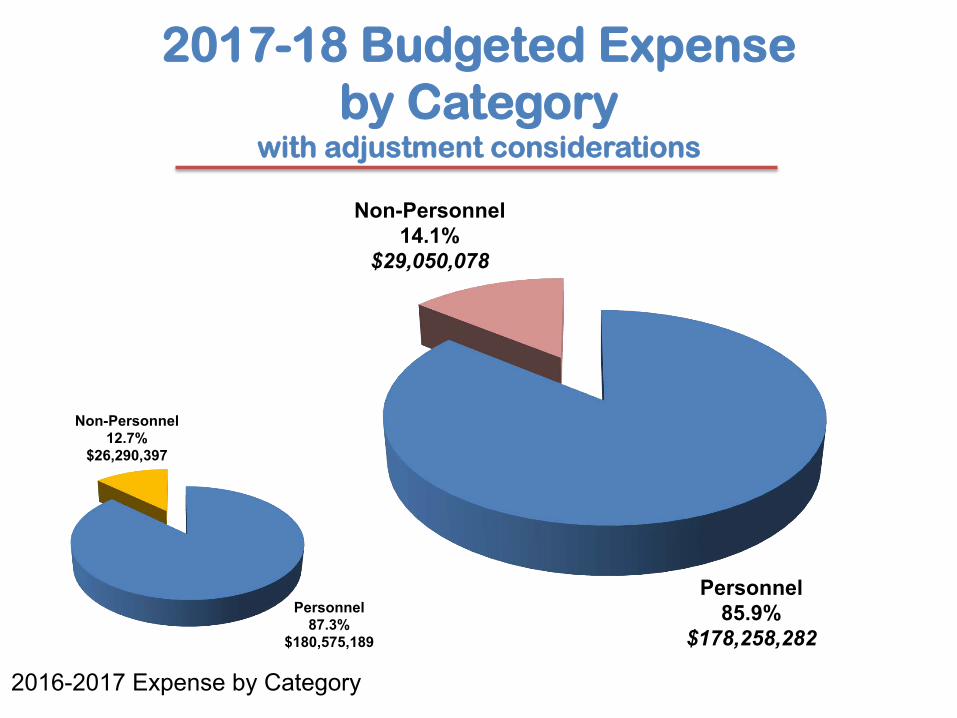
2017-18 Budgeted Expense by Category
with adjustment considerations
Personnel 85.9%
$178,258,282
Non-Personnel 14.1%
$29,050,078
2016-2017 Expense by Category
Personnel 87.3%
$180,575,189
Non-Personnel 12.7%
$26,290,397
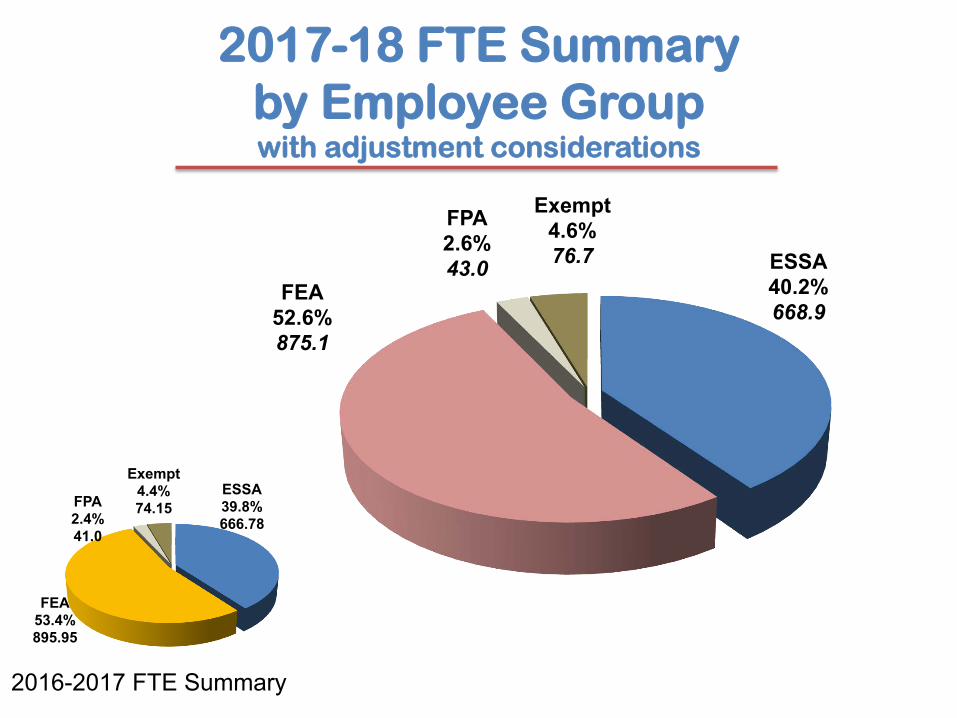
ESSA 40.2% 668.9
Exempt 4.6% 76.7
FPA 2.6% 43.0
FEA 52.6% 875.1
2017-18 FTE Summary by Employee Group with adjustment considerations
2016-2017 FTE Summary
FEA 53.4% 895.95
FPA 2.4% 41.0
Exempt 4.4% 74.15
ESSA 39.8% 666.78
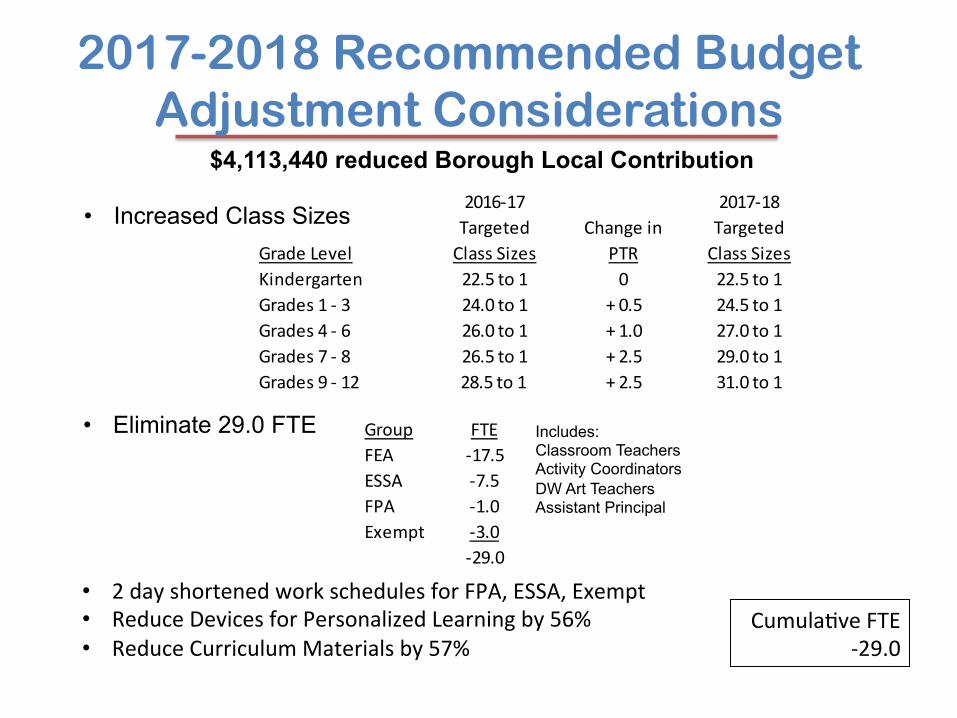
2017-2018 Recommended Budget Adjustment Considerations
$4,113,440 reduced Borough Local Contribution
• Increased Class Sizes
• Eliminate 29.0 FTE
• 2dayshortenedworkschedulesforFPA,ESSA,Exempt• ReduceDevicesforPersonalizedLearningby56%• ReduceCurriculumMaterialsby57%
Includes: Classroom Teachers Activity Coordinators DW Art Teachers Assistant Principal
Group FTEFEA -17.5ESSA -7.5FPA -1.0Exempt -3.0
-29.0
2016-17 2017-18Targeted Changein Targeted
GradeLevel ClassSizes PTR ClassSizesKindergarten 22.5to1 0 22.5to1Grades1-3 24.0to1 +0.5 24.5to1Grades4-6 26.0to1 +1.0 27.0to1Grades7-8 26.5to1 +2.5 29.0to1Grades9-12 28.5to1 +2.5 31.0to1
CumulaPveFTE-29.0
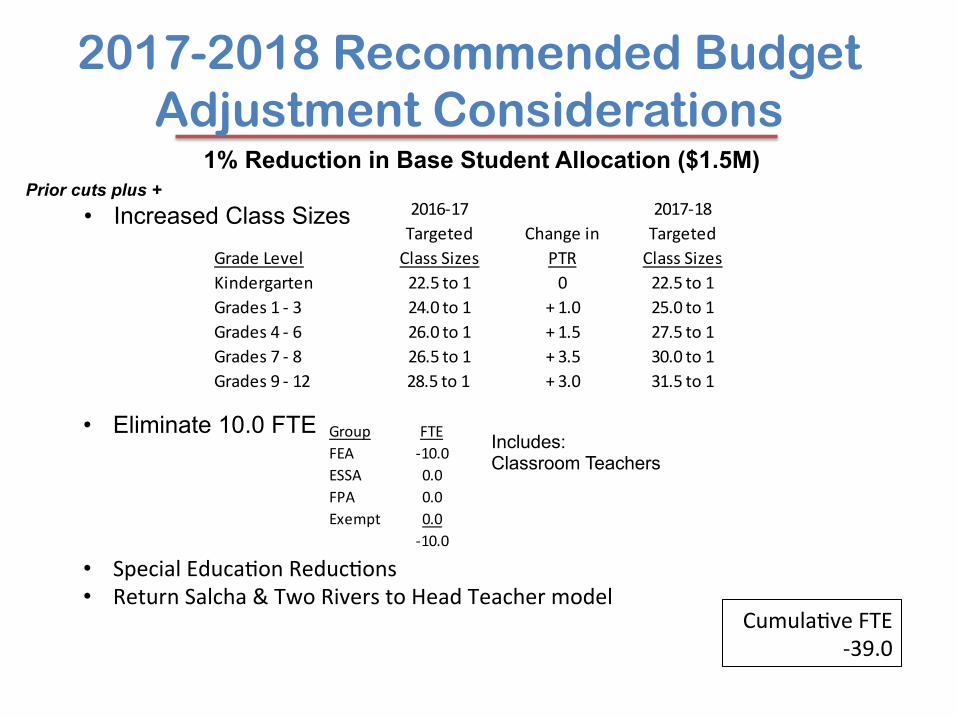
2017-2018 Recommended Budget Adjustment Considerations
1% Reduction in Base Student Allocation ($1.5M)
• Increased Class Sizes
• Eliminate 10.0 FTE
• SpecialEducaPonReducPons• ReturnSalcha&TwoRiverstoHeadTeachermodel
CumulaPveFTE-39.0
Group FTEFEA -10.0ESSA 0.0FPA 0.0Exempt 0.0
-10.0
Includes: Classroom Teachers
Prior cuts plus + 2016-17 2017-18Targeted Changein Targeted
GradeLevel ClassSizes PTR ClassSizesKindergarten 22.5to1 0 22.5to1Grades1-3 24.0to1 +1.0 25.0to1Grades4-6 26.0to1 +1.5 27.5to1Grades7-8 26.5to1 +3.5 30.0to1Grades9-12 28.5to1 +3.0 31.5to1
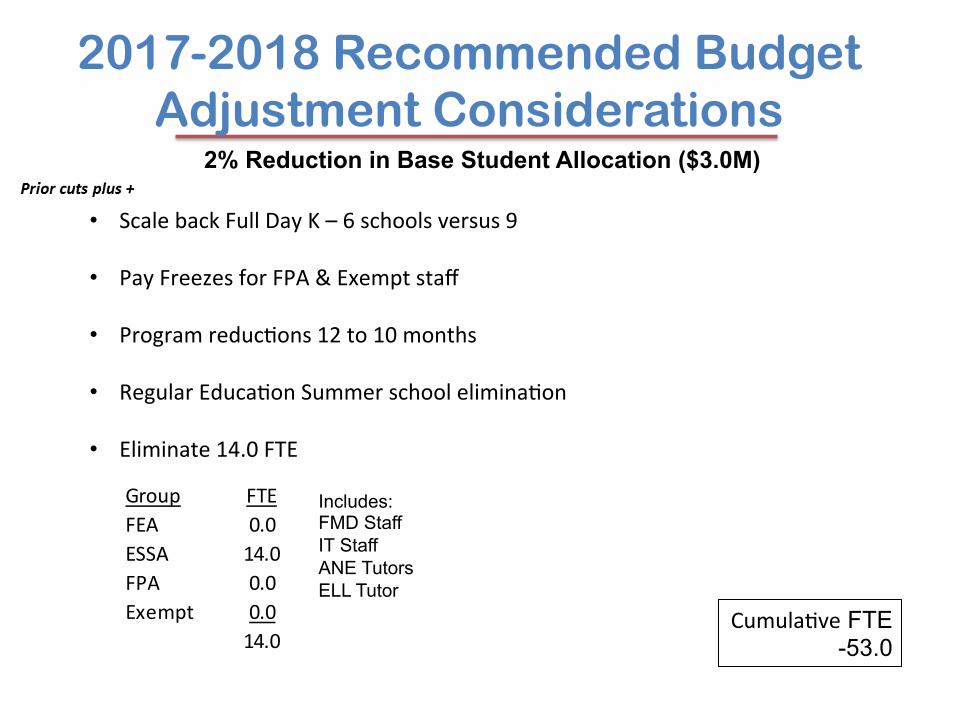
2017-2018 Recommended Budget Adjustment Considerations
2% Reduction in Base Student Allocation ($3.0M)
• ScalebackFullDayK–6schoolsversus9• PayFreezesforFPA&Exemptstaff• ProgramreducPons12to10months• RegularEducaPonSummerschooleliminaPon
• Eliminate14.0FTE
CumulaPve FTE -53.0
Group FTEFEA 0.0ESSA 14.0FPA 0.0Exempt 0.0
14.0
Includes: FMD Staff IT Staff ANE Tutors ELL Tutor
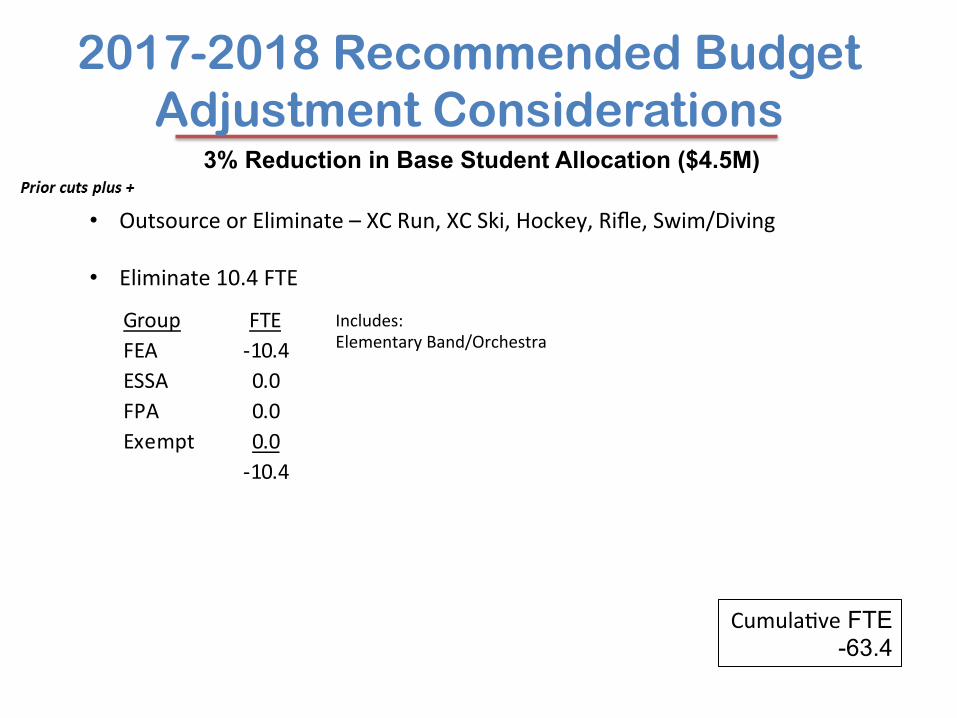
2017-2018 Recommended Budget Adjustment Considerations
3% Reduction in Base Student Allocation ($4.5M)
• OutsourceorEliminate–XCRun,XCSki,Hockey,Rifle,Swim/Diving
• Eliminate10.4FTE
CumulaPve FTE -63.4
Includes:ElementaryBand/Orchestra
Group FTEFEA -10.4ESSA 0.0FPA 0.0Exempt 0.0
-10.4
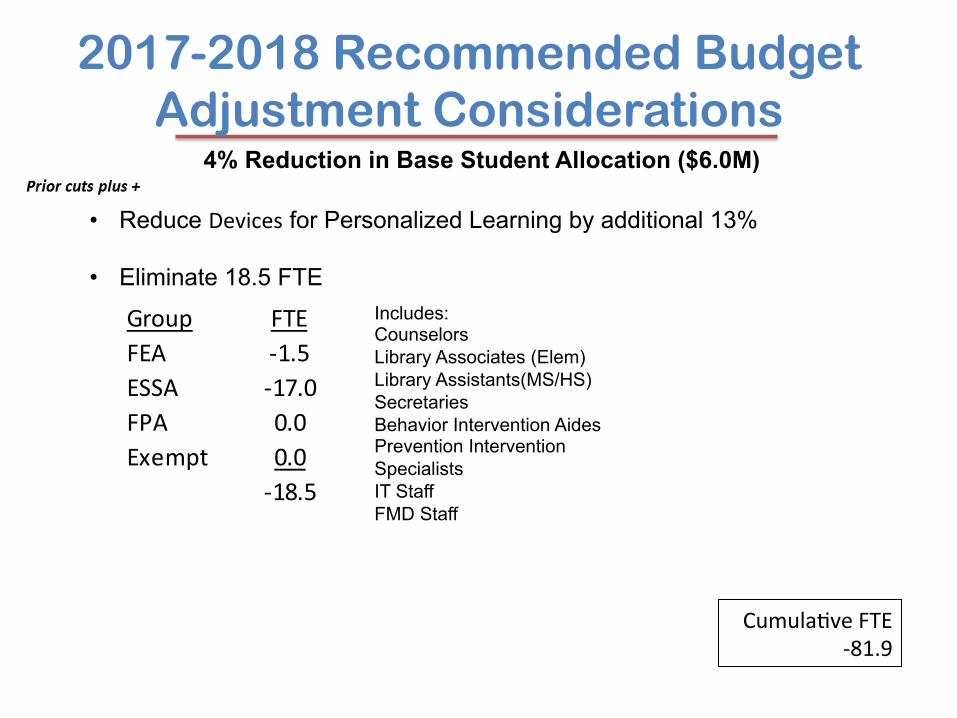
2017-2018 Recommended Budget Adjustment Considerations
4% Reduction in Base Student Allocation ($6.0M)
• Reduce Devices for Personalized Learning by additional 13%
• Eliminate 18.5 FTE
CumulaPveFTE-81.9
Includes: Counselors Library Associates (Elem) Library Assistants(MS/HS) Secretaries Behavior Intervention Aides Prevention Intervention Specialists IT Staff FMD Staff
Group FTEFEA -1.5ESSA -17.0FPA 0.0Exempt 0.0
-18.5
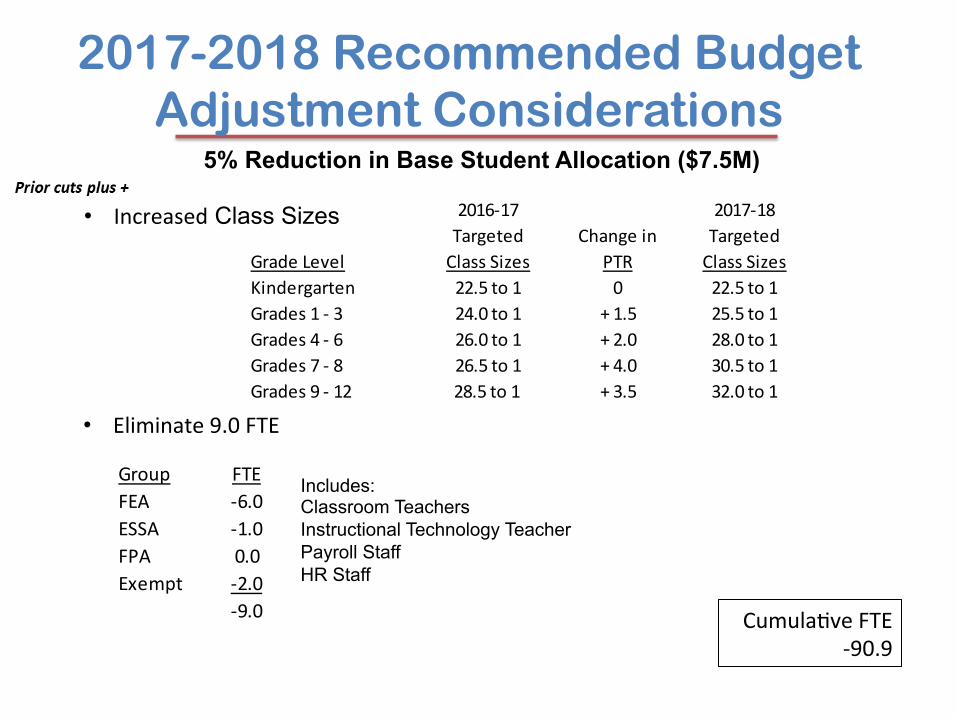
2017-2018 Recommended Budget Adjustment Considerations
5% Reduction in Base Student Allocation ($7.5M)
• Increased Class Sizes
• Eliminate9.0FTE
CumulaPveFTE-90.9
Group FTEFEA -6.0ESSA -1.0FPA 0.0Exempt -2.0
-9.0
Includes: Classroom Teachers Instructional Technology Teacher Payroll Staff HR Staff
2016-17 2017-18Targeted Changein Targeted
GradeLevel ClassSizes PTR ClassSizesKindergarten 22.5to1 0 22.5to1Grades1-3 24.0to1 +1.5 25.5to1Grades4-6 26.0to1 +2.0 28.0to1Grades7-8 26.5to1 +4.0 30.5to1Grades9-12 28.5to1 +3.5 32.0to1

Heidi Haas Board of Education President
2017-2018 Budget
The School Board respectfully requests the Fairbanks North Star Borough Assembly to maintain its local contribution to the school district by appropriating $55,282,440 for the 2017-2018 budget, which is 26.7% of the total operating fund revenue.
2017-2018 Budget
The School Board also respectfully requests the Fairbanks North Star Borough Assembly make whole the school district’s loss in state foundation revenue, currently estimated at $1,113,440, due to the increase in the borough’s certified full and true property valuation.

Strategic Goals
Personalized Learning
Effective Communication
Parent & Community Engagement
Organizational Excellence
Technology Integration