Embed Size (px)
Citation preview
FAIRHOLMEIgnore the crowd.
FAIRXFOCIXFAAFX
SEMI–ANNUAL REPORT
March 29, 2021, as permitted by regulations adopted by the Securities and Exchange Commission, paper copies of each Fund’s annual and
semi-annual shareholder reports no longer sent by mail, unless you specifically request paper copies of the reports from the Fund or from
your financial intermediary, such as a broker-dealer or bank. Instead, the reports made available on website, and you
will be notified by mail each time a report is posted and provided with a website link to access the report.
If you already elected to receive shareholder reports electronically, you will not be affected by this change and you need not take any action. You may
elect to receive shareholder reports and other communications from a Fund or your financial intermediary electronically at any time by contacting
your financial intermediary (such as a broker-dealer or bank) or, if you are a direct investor, by calling the Fund at (866) 202-2263.
You may elect to receive all future reports in paper form free of charge. If you invest through a financial intermediary, you can contact your financial
intermediary to request that you continue to receive paper copies of your shareholder reports; if you invest directly with a Fund, you can call the Fund
at (866) 202-2263. Your election to receive reports in paper form will apply to all funds held in your account with your financial intermediary or, if you
invest directly, to all funds held with Fairholme Funds, Inc.

This page is not part of the Fairholme Funds, Inc. 20 Semi-Annual Report

This page is not part of the Fairholme Funds, Inc. 20 Semi-Annual Report
FAIRHOLMEIgnore the crowd.
PORTFOLIO MANAGER’S REPORT FOR EACH SERIES OF FAIRHOLME FUNDS, INC.
July 20

$0
$10,000
$20,000
$30,000
$40,000
$50,000
$60,000
$70,000
$80,000
$90,000
2000 2001 2002 2003 2004 2005 2006 2007 2008 2009 2010 2011 2012 2013 2014 2015 2016 2017 2018 2019 2020 2021
ONE YEAR
FIVE YEARS
TEN YEARS
FIFTEEN YEARS
SINCE INCEPTION(12/29/1999)
CumulativeThe Fairholme Fund 51.98% 62.52% 97.38% 163.94% 691.87%S&P 500 40.79% 125.36% 298.94% 361.20% 344.17%AnnualizedThe Fairholme Fund 51.98% 10.20% 7.04% 6.68% 10.10%S&P 500 40.79% 17.65% 14.84% 10.73% 7.18%
FAIRHOLME CAPITAL MANAGEMENT, L.L.C.PORTFOLIO MANAGER’S REPORT
For the Six Months Ended June 30, 2021
This page is not part of the Fairholme Funds, Inc. 2021 Semi-Annual Report
i
THE FAIRHOLME FUNDTOTAL RETURN
$79,187
S&P 500TOTAL RETURN
$44,417
THE FAIRHOLME FUND TOTAL RETURN S&P 500 TOTAL RETURN
Mutual fund investing involves risks, including possible loss of principal. Unless otherwise specified, all information is shown as of June 30, 2021.Past performance information quoted below does not guarantee future results. The investment return and principal value of an investment in TheFairholme Fund (the “Fund”) will fluctuate so that the value of an investor’s shares, when redeemed, may be worth more or less than their originalcost. Current performance may be lower or higher than quoted performance information quoted below. Performance figures reflect the deduction ofexpenses and assume reinvestment of dividends and capital gains but do not reflect a 2.00% redemption fee imposed by the Fund on sharesredeemed or exchanged within 60 calendar days of their purchase. Most recent month-end performance and answers to any questions you mayhave can be obtained by calling Shareholder Services at (866) 202-2263. The Fund maintains a focused portfolio of investments in a limited numberof issuers and does not seek to diversify its investments. This exposes the Fund to the risk of unanticipated industry conditions and risks particularto a single company or the securities of a single company within its portfolio. Current and future portfolio holdings are subject to change and risk.The S&P 500 Index (the “S&P 500”) is a widely recognized, unmanaged index of 500 of the largest companies in the United States as measured bymarket capitalization and the performance of the S&P 500 assumes the reinvestment of all dividends and distributions. The S&P 500 is used forcomparative purposes only, and is not meant to be indicative of the Fund’s performance, asset composition, or volatility. The Fund’s performancemay differ markedly from the performance of the S&P 500 in either up or down market trends. Because an index cannot be invested in directly, theindex returns do not reflect a deduction for fees, expenses, or taxes. The expense ratio for the Fund reflected in the current prospectus dated March30, 2021, is 1.03%, and may differ from the actual expenses incurred by the Fund for the period covered by the Fund’s Semi-Annual Report. Theexpense ratio includes any acquired fund fees and expenses which are incurred indirectly by the Fund as a result of investments in securities issuedby one or more investment companies, including money market funds.
Effective January 1, 2018, the Manager agreed to waive, on a voluntary basis, a portion of the management fee of the Fund to the extent necessary to limit themanagement fee paid to the Manager by the Fund to an annual rate of 0.80% of the Fund’s daily average net asset value. This undertaking may be terminated by theManager upon 60 days’ written notice to the Fund.
The Portfolio Manager’s Report is not part of The Fairholme Funds, Inc. Semi-Annual Report due to forward-looking statements that, by their nature,cannot be attested to, as required by regulation. The Portfolio Manager’s Report is based on calendar-year performance. A more formalManagement Discussion and Analysis is included in the Semi-Annual Report. Opinions of the Portfolio Manager are intended as such, and not asstatements of fact requiring attestation.
The following graph and performance table compare The Fairholme Fund’s unaudited performance (after expenses) with that of the S&P 500, withdividends and distributions reinvested. The value of a $10,000 investment in The Fairholme Fund at inception was worth $79,187 (assumesreinvestment of distributions into additional Fund shares) compared to $44,417 for the S&P 500 at June 30, 2021. Focused investing has led tovolatility, long periods of underperformance, and overall cumulative performance since inception that is twice that of the S&P 500.
The Fairholme Fund

FAIRHOLME CAPITAL MANAGEMENT, L.L.C.PORTFOLIO MANAGER’S REPORT (continued)
For the Six Months Ended June 30, 2021
July 30, 2021
Dear Fellow Shareholders:
St. Joe (JOE) was incorporated in the State of Florida in 1936. JOE is a real estate development, asset management and operating company. JOEowns 171,000 acres of land in Northwest Florida. The Bay-Walton Sector Plan (“Sector Plan”) entitles, or gives legal rights, for JOE to develop over170,000 residential dwelling units, over 22 million square feet of retail, commercial and industrial space and over 3,000 hotel rooms on lands withinFlorida’s Bay and Walton counties. JOE also has additional entitlements or legal rights, to develop acreage outside of the Sector Plan.Approximately 86% of JOE’s real estate is located in Florida’s Bay, Gulf, and Walton Counties. Approximately 90% of JOE’s real estate is locatedwithin 15 miles of the Gulf of Mexico.
JOE has become by far the Fund’s largest investment as the company obtained what may be the largest residential entitlement in the United Sates,initiated the first of what I expect to be many billion-dollar growth plans on coastal lands held for decades, and repurchased 36.3% of its stock at anaverage price of $17.63 per share. Charlie Munger had it right when he said that “The big money is not in the buying or selling, but in the waiting.”Second quarter 2021 revenue at JOE increased by 100%. Operating income increased by 177%. For the first six months of this year, JOE grewcash before distributions and investments by 127% to $1.00 per share. In the words of CEO Jorge Gonzalez in the latest quarterly earningsrelease, JOE “is only scratching the surface…for multi-generational growth.”
PANAMA CITY BEACH, Fla.--Jul. 28, 2021-- The St. Joe Company (NYSE: JOE) (the “Company”) today announced revenue for thesecond quarter of 2021 increased by 100% to $72.2 million as compared to $36.1 million for the second quarter of 2020. The increasewas broad-based with a 133% increase in real estate revenue, a 95% increase in hospitality revenue and a 31% increase in leasingrevenue. Operating income increased by 177% to $30.7 million for the three months ended June 30, 2021 as compared to $11.1million for the three months ended June 30, 2020. Net income increased by 26% to $24.2 million, or $0.41 per share, compared to netincome of $19.2 million, or $0.33 per share, for the same period in 2020. The three months ended June 30, 2020 included a one-timeafter-tax gain of $11.6 million related to the transfer of land to the unconsolidated Latitude Margaritaville Watersound joint venture. Forthe six months ended June 30, 2021, the Company’s net income increased by 55% to $27.4 million, or $0.47 per share, compared tonet income of $17.7 million, or $0.30 per share, for the same period last year.
Net Cash Provided by Operating Activities for the three months ended June 30, 2021 increased by approximately $28.0 million to$37.4 million compared to $9.4 million for the same period in 2020. For the six months ended June 30, 2021, the Net Cash Providedby Operating Activities increased by approximately $34.7 million to $47.2 million as compared to $12.5 million for the same period in2020. Cash Generated for Distribution or Investment (“CGFDI”), a non-GAAP measure that is detailed in the Financial Data includedbelow, for the three months ended June 30, 2021 increased by approximately $20.3 million to $38.4 million compared to $18.1 millionfor the same period in 2020. For the six months ended June 30, 2021, CGFDI increased by approximately $32.4 million to $58.6million as compared to $26.2 million for the same period in 2020.
In the second quarter of 2021, the Company invested $46.9 million in capital expenditures, which when combined with the $37.2million invested in the first quarter of 2021, totaled $84.1 million for the six months ended June 30, 2021. In addition, the Companypaid $4.7 million in cash dividends in each quarter of 2021. As of June 30, 2021, the Company had $143.6 million in cash, cashequivalents and investments.
On July 28, 2021, the Board of Directors declared a cash dividend of $0.08 per share on its common stock, payable on September 10,2021 to shareholders of record as of the close of business on August 13, 2021.
Jorge Gonzalez, the Company’s President and Chief Executive Officer, said, “We attribute these record results to methodical andconsistent preparation and execution of our business strategy with specific focus on growth, diversification and recurring revenuestreams which we believe is creating a synergistic ecosystem of primary residential, active adult, apartments, commercial leasing,medical, lodging, hospitality, retail and entertainment components. Northwest Florida, with its high quality of life, natural beauty andworld class amenities, is being discovered by more people from more places than ever before. All of this is creating long-termshareholder value with strong operating results today and sets, what we believe to be, a concrete foundation for continued growth.”
Mr. Gonzalez continued, “At the May 2019 shareholders’ meeting, we presented the 2021 unit milestones breaking down our broadgrowth plans and diversification into five categories. These include homesites, apartment and senior living, commercial leasing, hotelsand club memberships. These milestones are important since they represent future growth in revenue and create the synergisticecosystem tying together growth in the Northwest Florida region with shareholder value of the Company. With the opening of newresidential communities, new hotels, additional apartments and commercial buildings, we intend to update the milestones in the yearsahead. We believe that we have only started to scratch the surface of our region’s potential as it is poised for multi-generationalgrowth.”
The entire news release and Form 10Q can be found at www.joe.com. JOE is reaping record results with, in our view, much more to come.
This page is not part of the Fairholme Funds, Inc. 2021 Semi-Annual Report
ii

FAIRHOLME CAPITAL MANAGEMENT, L.L.C.PORTFOLIO MANAGER’S REPORT (continued)
For the Six Months Ended June 30, 2021
This page is not part of the Fairholme Funds, Inc. 2021 Semi-Annual Report
iii
Imperial Metals owns 30% of Red Chris, a copper, silver, and gold open pit mining operation in British Columbia. Newcrest Mining purchased 70%of Red Chris in 2019. Newcrest reported Red Chris’ all-in gross margin to be $1,129 per gold ounce and continues to discover additional zones ofhigher-grade mineralization, which highlights profit potential and resource growth. Newcrest’s plans for Red Chris follow Newcrest’s Cadia miningoperation, which produces multiples more at an all-in gross margin of $2,157 per gold ounce.
A unanimous U.S. Supreme Court ruled that federal law allows the United States to do whatever it believes is in its best interests when it comes toFannie Mae and Freddie Mac. Unfortunately, I believe what is in the best interest of the U.S. is to honor ownership rights. Fannie and Freddiepreferred stock price declines reflect little if any sanctity or even recognition of contracts as the enterprises retain tens of billions of annual earnings.I wait for the Biden administration’s re-privatization plans (if any) and further judicial actions.
U.S. Treasury Bills and Treasury money market funds comprise 23% of Fund assets at June 30, 2021. T-Bills are safe and liquid as they areguaranteed by the U.S. Government, but earn less than one-tenth of one percent while, for example, the price of a Big Mac as reported by TheAltoona Mirror increases by five percent annually. The Fund is swapping T-Bills for securities that have the potential to yield more and better hedgeagainst inflation.
I and affiliates own 28% of the Fund.
Respectfully submitted,
Bruce R. BerkowitzChief Investment Officer
$5,000
$10,000
$15,000
$20,000
$25,000
2010 2011 2012 2013 2014 2015 2016 2017 2018 2019 2020 2021
FAIRHOLME CAPITAL MANAGEMENT, L.L.C.PORTFOLIO MANAGER’S REPORT
For the Six Months Ended June 30, 2021
*The 30-Day SEC Yield represents net investment income earned by The Income Fund over the 30-Day period, expressed as an annual percentage rate based on TheIncome Fund’s share price at the end of the 30-Day period. The 30-Day unsubsidized SEC Yield does not reflect any fee waivers/reimbursements/limits in effect.
This page is not part of the Fairholme Funds, Inc. 2021 Semi-Annual Report
i
ONE YEAR
FIVE YEARS
TENYEARS
SINCE INCEPTION(12/31/2009)
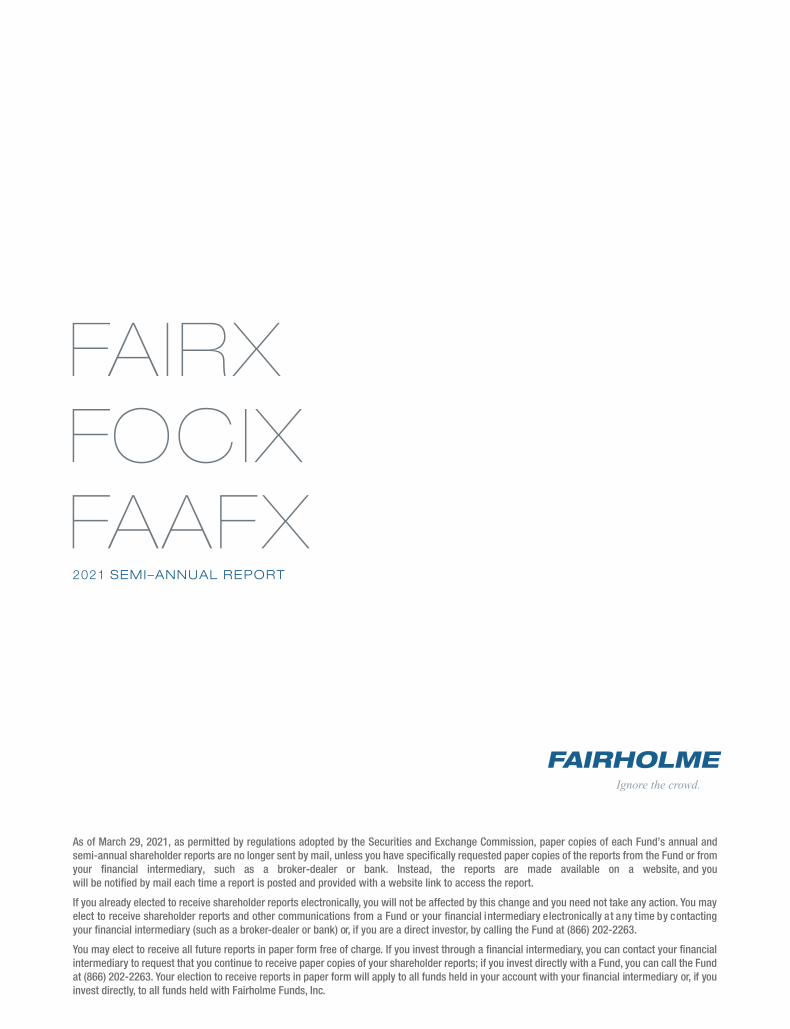
CumulativeThe Income Fund 14.35% 25.56% 75.64% 102.05%
Bloomberg Barclays Bond Index -0.33% 16.08% 39.62% 52.80%
AnnualizedThe Income Fund 14.35% 4.66% 5.79% 6.31%
Bloomberg Barclays Bond Index -0.33% 3.03% 3.39% 3.76%
THE INCOME FUNDTOTAL RETURN
$20,205
BLOOMBERG BARCLAYS BOND INDEXTOTAL RETURN
$15,280
THE INCOME FUND TOTAL RETURN BLOOMBERG BARCLAYS BOND INDEX TOTAL RETURN
The following graph and performance table compare The Income Fund’s unaudited performance (after expenses) with that of the BloombergBarclays Bond Index, with dividends and distributions reinvested, for various periods ended June 30, 2021. The value of a $10,000 investment inThe Income Fund at its inception was worth $20,205 (assumes reinvestment of distributions into additional Fund shares) compared to $15,280 forthe Bloomberg Barclays Bond Index at June 30, 2021. The Income Fund’s 30-Day SEC Yield at June 30, 2021, was 0.30% (unsubsidized) and0.50% (subsidized).*
The Fairholme Focused Income Fund
Mutual fund investing involves risks, including possible loss of principal. Unless otherwise specified, all information is shown as of June 30, 2021.Past performance information quoted below does not guarantee future results. The investment return and principal value of an investment in TheFairholme Focused Income Fund (“The Income Fund” or the “Fund”) will fluctuate so that the value of an investor’s shares, when redeemed, may beworth more or less than their original cost. Current performance may be lower or higher than quoted performance information quoted below.Performance figures reflect the deduction of expenses and assume of dividends and capital gains. Most recent month-end performance andanswers to any questions you may have can be obtained by calling Shareholder Services at (866) 202-2263. The Fund maintains a focused portfolioof investments in a limited number of issuers and does not seek to diversify its investments. This exposes the Fund to the risk of unanticipatedindustry conditions and risks particular to a single company or the securities of a single company within its portfolio. Current and future portfolioholdings are subject to change and risk. The Bloomberg Barclays U.S. Aggregate Bond Index (the “Bloomberg Barclays Bond Index”) is a broad-based flagship benchmark that measures the investment grade, U.S. dollar denominated, fixed-rate taxable bond market, and includes Treasuries,government-related and corporate securities, mortgage-backed securities (agency fixed rate and hybrid adjustable-rate mortgage pass-throughs),asset-backed securities and commercial mortgage backed securities (agency and non-agency). The Bloomberg Barclays Bond Index is used forcomparative purposes only, and is not meant to be indicative of the Fund’s performance, asset composition, or volatility. The Fund’s performancemay differ markedly from the performance of the Bloomberg Barclays Bond Index in either up or down market trends. Because an index cannot beinvested in directly, the index returns do not reflect a deduction for fees, expenses, or taxes. The expense ratio for the Fund reflected in the currentprospectus dated March 30, 2021, is 1.05%, and may differ from the actual expenses incurred by the Fund for the period covered by the Fund’sSemi-Annual Report. The expense ratio includes any acquired fund fees and expenses which are incurred indirectly by the Fund as a result ofinvestments in securities issued by one or more investment companies, including money market funds.
Effective January 1, 2018, the Manager agreed to waive, on a voluntary basis, a portion of the management fee of the Fund to the extent necessary to limit themanagement fee paid to the Manager by the Fund to an annual rate of 0.80% of the Fund’s daily average net asset value. This undertaking may be terminated by theManager upon 60 days’ written notice to the Fund.
The Portfolio Manager’s Report is not part of The Fairholme Funds, Inc. Semi-Annual Report due to forward-looking statements that, by their nature, cannot be attestedto, as required by regulation. The Portfolio Manager’s Report is based on calendar-year performance. A more formal Management Discussion and Analysis is included inthe Semi-Annual Report. Opinions of the Portfolio Manager are intended as such, and not as statements of fact requiring attestation.

Respectfully submitted,
Bruce R. BerkowitzChief Investment Officer
FAIRHOLME CAPITAL MANAGEMENT, L.L.C.PORTFOLIO MANAGER’S REPORT (continued)
For the Six Months Ended June 30, 2021
July 30, 2021
Dear Fellow Shareholders:
The Fund has invested 37% of its assets in energy and other infrastructure-related companies. Oil and natural gas are used in about 97% of allmanufactured products. It is not easy to name a product or service that doesn’t use a form of oil or natural gas. In fact, life as we know it could notexist without petrochemicals. Natural gas is essential for power generation, especially when the sun doesn’t shine or the wind doesn’t blow.Switching from dirty coal to cleaner natural gas alone would meaningfully reduce air pollution. Responsible transporters of oil, natural gas and theirmany derivatives are as critical as producers and not as sensitive to commodity price swings. Their securities pay significant distributions and havelong-term capital appreciation potential.
The U.S. Supreme Court’s unanimous ruling that federal law allows the government do whatever is in the best interests of the Federal Housing andFinance Agency (Fannie Mae and Freddie Mac’s conservator) was a significant defeat for the sanctity of contracts. Fannie and Freddie securitiesnow comprise 1.5% of the Fund and are priced at mere option values on possible pathways to freedom from or compensation for federal takings.We wait for a Biden administration plan for their re-privatization and further judicial decisions.
U.S. Treasury Bills and Treasury money market funds comprised 54% of the Fund’s net assets at June 30, 2021. We are investing more of thiscash in a basket of companies that generate yield, and believed essential for a greener world and growing middle class.
I and affiliates own 31% of the Fund.
This page is not part of the Fairholme Funds, Inc. 2021 Semi-Annual Report
ii

$0
$5,000
$10,000
$15,000
$20,000
$25,000
$30,000
$35,000
$40,000
2011 2012 2013 2014 2015 2016 2017 2018 2019 2020 2021
FAIRHOLME CAPITAL MANAGEMENT, L.L.C.PORTFOLIO MANAGER’S REPORT
For the Six Months Ended June 30, 2021
*The 30-Day SEC Yield represents net investment income earned by The Allocation Fund over the 30-Day period, expressed as an annual percentage rate based onThe Allocation Fund’s share price at the end of the 30-Day period. The 30-Day unsubsidized SEC Yield does not reflect any fee waivers/reimbursements/limits in effect.
This page is not part of the Fairholme Funds, Inc. 2021 Semi-Annual Report
i
THE ALLOCATION FUND TOTAL RETURN BLOOMBERG BARCLAYS BOND INDEX TOTAL RETURN S&P 500 TOTAL RETURN
Mutual fund investing involves risks, including possible loss of principal. Unless otherwise specified, all information is shown as of June 30, 2021.Past performance information quoted below does not guarantee future results. The investment return and principal value of an investment in TheAllocation Fund (“The Allocation Fund” or the “Fund”) will fluctuate so that the value of an investor’s shares, when redeemed, may be worth more orless than their original cost. Current performance may be lower or higher than the performance information quoted below. Performance figuresreflect the deduction of expenses and assume reinvestment of dividends and capital gains but do not reflect a 2.00% redemption fee imposed bythe Fund on shares redeemed or exchanged within 60 calendar days of their purchase. Most recent month-end performance and answers to anyquestions you may have can be obtained by calling Shareholder Services at (866) 202-2263. The Fund maintains a focused portfolio of investmentsin a limited number of issuers and does not seek to diversify its investments. This exposes the Fund to the risk of unanticipated industry conditionsand risks particular to a single company or the securities of a single company within its portfolio. Current and future portfolio holdings are subject tochange and risk. The S&P 500 Index (the “S&P 500”) is a widely recognized, unmanaged index of 500 of the largest companies in the United Statesas measured by market capitalization and the performance of the S&P 500 assumes the reinvestment of all dividends and distributions. TheBloomberg Barclays U.S. Aggregate Bond Index (the “Bloomberg Barclays Bond Index”) is a broad-based flagship benchmark that measures theinvestment grade, U.S. dollar denominated, fixed-rate taxable bond market, and includes Treasuries, government-related and corporate securities,mortgage-backed securities (agency fixed rate and hybrid adjustable-rate mortgage pass-throughs), asset-backed securities and commercialmortgage backed securities (agency and non-agency). The S&P 500 and the Bloomberg Barclays Bond Index are used for comparative purposesonly, and are not meant to be indicative of the Fund’s performance, asset composition, or volatility. The Fund’s performance may differ markedlyfrom the performance of the S&P 500 or the Bloomberg Barclays Bond Index in either up or down market trends. Because indices cannot beinvested in directly, these index returns do not reflect a deduction for fees, expenses, or taxes. The expense ratio for the Fund reflected in thecurrent prospectus dated March 30, 2021, is 1.05%, and may differ from the actual expenses incurred by the Fund for the period covered by theFund’s Semi-Annual Report. The expense ratio includes any acquired fund fees and expenses which are incurred indirectly by the Fund as a resultof investments in securities issued by one or more investment companies, including money market funds.
Effective January 1, 2018, the Manager agreed to waive, on a voluntary basis, a portion of the management fee of the Fund to the extent necessary to limit themanagement fee paid to the Manager by the Fund to an annual rate of 0.80% of the Fund’s daily average net asset value. This undertaking may be terminated by theManager upon 60 days’ written notice to the Fund.
The Portfolio Manager’s Report is not part of The Fairholme Funds, Inc. Semi-Annual Report due to forward-looking statements that, by their nature,cannot be attested to, as required by regulation. The Portfolio Manager’s Report is based on calendar-year performance. A more formalManagement Discussion and Analysis is included in the Semi-Annual Report. Opinions of the Portfolio Manager are intended as such, and not asstatements of fact requiring attestation.
The following graph and performance table compare The Allocation Fund’s unaudited performance (after expenses) with that of the BloombergBarclays Bond Index and the S&P 500, with dividends and distributions reinvested, for various periods ended June 30, 2021. The value of a$10,000 investment in The Allocation Fund at its inception was worth $12,907 (assumes reinvestment of distributions into additional Fund shares)compared to $14,342 and $42,297 for the Bloomberg Barclays Bond Index and the S&P 500, respectively, at June 30, 2021. U.S. Treasury Billsand Treasury money market funds comprised 18% of the Fund’s net assets at June 30, 2021. The Allocation Fund’s 30-Day SEC Yield at June 30,2021, was 0.03% (unsubsidized) and 0.24% (subsidized).*
The Fairholme Allocation Fund
ONE YEAR
FIVE YEARS
TENYEARS
SINCE INCEPTION (12/31/2010)
CumulativeThe Allocation Fund 36.57% 17.63% 42.31% 29.07%Bloomberg Barclays Bond Index -0.33% 16.08% 39.62% 43.42%S&P 500 40.79% 125.36% 298.94% 322.97%AnnualizedThe Allocation Fund 36.57% 3.30% 3.59% 2.46%Bloomberg Barclays Bond Index -0.33% 3.03% 3.39% 3.50%S&P 500 40.79% 17.65% 14.84% 14.73%
S&P 500TOTAL RETURN
$42,297
BLOOMBERG BARCLAYS BOND INDEXTOTAL RETURN
$14,342
THE ALLOCATION FUNDTOTAL RETURN
$12,907

Respectfully submitted,
Bruce R. BerkowitzChief Investment Officer
FAIRHOLME CAPITAL MANAGEMENT, L.L.C.PORTFOLIO MANAGER’S REPORT (continued)
For the Six Months Ended June 30, 2021July 30, 2021
Dear Fellow Shareholders:
St. Joe (JOE) comprises 27% of the Fund. JOE’s second quarter 2021 operating revenue increased by 100% to $72.2 million. Operating incomeincreased by 177% to $30.7 million. Net cash provided by operating activities increased by 298% to $37.4 million. Cash generated for distributionsto owners or for investments increased by 112% to $38.4 million. I believe JOE has the ability to distribute this cash. JOE is reaping today whatwas sowed over the past few years. Current developments should increase record performance. JOE is only scratching the surface of possibilities.But, I understand that seeing is believing.
Imperial Metals comprises 15% of Fund assets. Imperial owns 30% of Red Chris, a copper, silver, and gold open pit mining operation. NewcrestMining owns 70% of Red Chris. Newcrest reported Red Chris’ all-in gross margin of $1,129 per gold ounce – a quarterly record. Newcrest believesthat Red Chris will most-likely follow the path of its Cadia property, which produces multiples more at an all-in gross margin of $2,157 per goldounce. Block cave mining allows Cadia’s all-in margin to exceed the price of gold.
The Fund has invested in a basket of energy and other infrastructure-related companies totaling 36% of Fund assets. Oil and natural gas are usedin almost all manufactured products. It is not easy to name a product or service that doesn’t use hydrocarbons. In fact, life as we know it could notexist without petrochemicals. Natural gas is essential for instant power generation, especially when the sun doesn’t shine or the wind doesn’t blow.Transporters of oil, natural gas and their many derivatives are as critical as producers, but not as sensitive to commodity price swings, and payrather large distributions.
The U.S. Supreme Court unanimously ruled that federal law allows the government do whatever is in the best interests of the Federal HousingFinance Agency, Fannie Mae and Freddie Mac’s conservator. When dealing with the government, there appears to be no sanctity of contract.Fannie and Freddie preferred stocks now comprise 2% of the Fund with prices at mere option values on possible pathways to freedom from orcompensation for federal takings. We now wait for the Biden administration’s re-privatization plans and further judicial decisions.
I and affiliates own 67% of the Fund.
This page is not part of the Fairholme Funds, Inc. 2021 Semi-Annual Report
ii

FAIRHOLMEIgnore the crowd.
(866) 202-2263 • fairholmefunds.com
FAIRHOLME FUNDS, INC.
The Fairholme Fund (FAIRX)Seeking long-term growth of capital
The Fairholme Focused Income Fund (FOCIX)Seeking current income
The Fairholme Allocation Fund (FAAFX)Seeking long-term total return
Semi-Annual ReportMay 31, 2021
Managed by Fairholme Capital Management
2
TABLE OF CONTENTS May 31, 2021
Fairholme Funds, Inc.
PageMANAGEMENT DISCUSSION & ANALYSIS
FUND PERFORMANCE:THE FAIRHOLME FUND ���������������������������������������������������������������������������������������������������������������������������������������������������� 3THE FAIRHOLME FOCUSED INCOME FUND ���������������������������������������������������������������������������������������������������������������� 4THE FAIRHOLME ALLOCATION FUND�������������������������������������������������������������������������������������������������������������������������� 5
MANAGEMENT DISCUSSION & ANALYSIS REPORT ������������������������������������������������������������������������������������������������������ 6EXPENSE EXAMPLE ��������������������������������������������������������������������������������������������������������������������������������������������������������������� 11
THE FAIRHOLME FUND:SCHEDULE OF INVESTMENTS ��������������������������������������������������������������������������������������������������������������������������������������������� 12STATEMENT OF ASSETS & LIABILITIES ���������������������������������������������������������������������������������������������������������������������������� 14STATEMENT OF OPERATIONS ���������������������������������������������������������������������������������������������������������������������������������������������� 15STATEMENTS OF CHANGES IN NET ASSETS �������������������������������������������������������������������������������������������������������������������� 16FINANCIAL HIGHLIGHTS ������������������������������������������������������������������������������������������������������������������������������������������������������ 17
THE FAIRHOLME FOCUSED INCOME FUND:SCHEDULE OF INVESTMENTS ��������������������������������������������������������������������������������������������������������������������������������������������� 18STATEMENT OF ASSETS & LIABILITIES ���������������������������������������������������������������������������������������������������������������������������� 20STATEMENT OF OPERATIONS ���������������������������������������������������������������������������������������������������������������������������������������������� 21STATEMENTS OF CHANGES IN NET ASSETS �������������������������������������������������������������������������������������������������������������������� 22FINANCIAL HIGHLIGHTS ������������������������������������������������������������������������������������������������������������������������������������������������������ 23
THE FAIRHOLME ALLOCATION FUND:SCHEDULE OF INVESTMENTS ��������������������������������������������������������������������������������������������������������������������������������������������� 24STATEMENT OF ASSETS & LIABILITIES ���������������������������������������������������������������������������������������������������������������������������� 26STATEMENT OF OPERATIONS ���������������������������������������������������������������������������������������������������������������������������������������������� 27STATEMENTS OF CHANGES IN NET ASSETS �������������������������������������������������������������������������������������������������������������������� 28FINANCIAL HIGHLIGHTS ������������������������������������������������������������������������������������������������������������������������������������������������������ 29
NOTES TO FINANCIAL STATEMENTS ��������������������������������������������������������������������������������������������������������������������������������� 30ADDITIONAL INFORMATION ����������������������������������������������������������������������������������������������������������������������������������������������� 39

FUND PERFORMANCE (unaudited) May 31, 2011 — May 31, 2021
Fairholme Funds, Inc.
3
The Fairholme Fund vs. The s&P 500 index iniTial invesTmenT oF $10,000
$0
$10,000
$20,000
$30,000
$40,000
$50,000
$
5/31/2
011
5/31/2
012
5/31/20
13
5/31/2
014
5/31/2
015
5/31/2
016
5/31/2
017
5/31/20
18
5/31/20
19
5/31/2
020
5/31/2
021
$38,334
$21,223
The Fairholme Fund
S&P 500 Index
The Fairholme Fund (“The Fairholme Fund”) commenced operations on December 29, 1999� The chart above presents the performance of a $10,000 investment for up to ten years to the latest semi-annual period ending May 31, 2021�
The following notes pertain to the chart above as well as to the performance table included in the Management Discussion & Analysis Report� Performance information in this report represents past performance and is not a guarantee of future results. The investment return and principal value of an investment in The Fairholme Fund will fluctuate, so that an investor’s shares when redeemed may be worth more or less than their original cost. Current performance may be lower or higher than the performance quoted within. The performance information does not reflect the taxes an investor would pay on distributions from The Fairholme Fund or upon redemption of shares of The Fairholme Fund. Most recent month-end performance and answers to any questions you may have can be obtained by calling Shareholder Services at 1-866-202-2263.
Data for both the S&P 500 Index and The Fairholme Fund are presented assuming all dividends and distributions have been reinvested and do not reflect any taxes that might have been incurred by a shareholder as a result of The Fairholme Fund distributions� The S&P 500 Index is a widely recognized, unmanaged index of 500 of the largest companies in the United States as measured by market capitalization and does not reflect any investment management fees or transaction expenses, nor the effects of taxes, fees or other charges�

FUND PERFORMANCE (unaudited) May 31, 2011 — May 31, 2021
Fairholme Funds, Inc.
4
The income Fund vs. The BloomBerg Barclays u.s. aggregaTe Bond index
iniTial invesTmenT oF $10,000
$0
$10,000
$20,000
$30,000
$
5/31/2
011
5/31/2
012
5/31/20
13
5/31/2
014
5/31/2
015
5/31/2
016
5/31/2
017
5/31/20
18
5/31/20
19
5/31/2
020
5/31/2
021
$17,680
$13,824
The Income Fund
Bloomberg Barclays U.S. Aggregate Bond Index
The Fairholme Focused Income Fund (“The Income Fund”) commenced operations on December 31, 2009� The chart above presents the performance of a $10,000 investment for up to ten years to the latest semi-annual period ending May 31, 2021�
The following notes pertain to the chart above as well as to the performance table included in the Management Discussion & Analysis Report� Performance information in this report represents past performance and is not a guarantee of future results. The investment return and principal value of an investment in The Income Fund will fluctuate, so that an investor’s shares when redeemed may be worth more or less than their original cost. Current performance may be lower or higher than the performance quoted within. The performance information does not reflect the taxes an investor would pay on distributions from The Income Fund or upon redemption of shares of The Income Fund. Most recent month-end performance and answers to any questions you may have can be obtained by calling Shareholder Services at 1-866-202-2263.
Data for both the Bloomberg Barclays U�S� Aggregate Bond Index and The Income Fund are presented assuming all dividends and distributions have been reinvested and do not reflect any taxes that might have been incurred by a shareholder as a result of The Income Fund distributions� The Bloomberg Barclays U�S� Aggregate Bond Index is a broad-based flagship benchmark that measures the investment grade, U�S� dollar-denominated, fixed-rate taxable bond market, and includes Treasuries, government-related and corporate securities, mortgage-backed securities (agency fixed-rate and hybrid adjustable-rate mortgage pass-throughs), asset-backed securities and commercial mortgage-backed securities (agency and non-agency)� The Bloomberg Barclays U�S� Aggregate Bond Index does not reflect any investment management fees or transaction expenses, nor the effects of taxes, fees, or other charges�

FUND PERFORMANCE (unaudited) May 31, 2011 — May 31, 2021
Fairholme Funds, Inc.
5
The allocaTion Fund vs.The BloomBerg Barclays u.s. aggregaTe Bond index and The s&P 500 index
iniTial invesTmenT oF $10,000
$0
$10,000
$20,000
$30,000
$40,000
$50,000
$
5/31/2
011
5/31/2
012
5/31/20
13
5/31/2
014
5/31/2
015
5/31/2
016
5/31/2
017
5/31/20
18
5/31/20
19
5/31/2
020
5/31/2
021
$38,334
$15,270 $13,824
The Allocation Fund
Bloomberg Barclays U.S. Aggregate Bond Index
S&P 500 Index
The Fairholme Allocation Fund (“The Allocation Fund”) commenced operations on December 31, 2010� The chart above presents the performance of a $10,000 investment for up to ten years to the latest semi-annual period ending May 31, 2021�
The following notes pertain to the chart above as well as to the performance table included in the Management Discussion & Analysis Report� Performance information in this report represents past performance and is not a guarantee of future results. The investment return and principal value of an investment in The Allocation Fund will fluctuate, so that an investor’s shares when redeemed may be worth more or less than their original cost. Current performance may be lower or higher than the performance quoted within. The performance information does not reflect the taxes an investor would pay on distributions from The Allocation Fund or upon redemption of shares of The Allocation Fund. Most recent month-end performance and answers to any questions you may have can be obtained by calling Shareholder Services at 1-866-202-2263.
Data for the Bloomberg Barclays U�S� Aggregate Bond Index, the S&P 500 Index and The Allocation Fund are presented assuming all dividends and distributions have been reinvested and do not reflect any taxes that might have been incurred by a shareholder as a result of The Allocation Fund distributions� The Bloomberg Barclays U�S� Aggregate Bond Index is a broad-based flagship benchmark that measures the investment grade, U�S� dollar- denominated, fixed-rate taxable bond market, and includes Treasuries, government-related and corporate securities, mortgage-backed securities (agency fixed-rate and hybrid adjustable-rate mortgage pass-throughs), asset-backed securities and commercial mortgage-backed securities (agency and non-agency)� The S&P 500 Index is a widely recognized, unmanaged index of 500 of the largest companies in the United States as measured by market capitalization� These index returns do not reflect any investment management fees or transaction expenses, nor the effects of taxes, fees or other charges�
MANAGEMENT DISCUSSION & ANALYSIS For the six months ended May 31, 2021
Fairholme Funds, Inc.
6
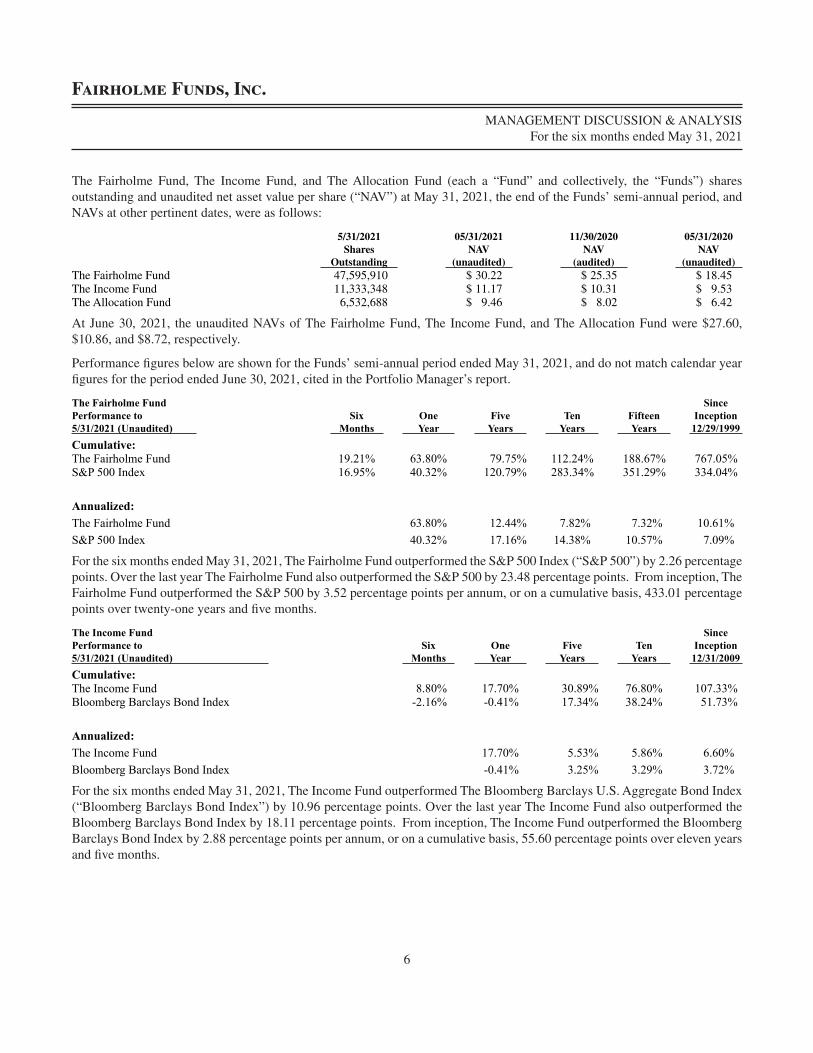
The Fairholme Fund, The Income Fund, and The Allocation Fund (each a “Fund” and collectively, the “Funds”) shares outstanding and unaudited net asset value per share (“NAV”) at May 31, 2021, the end of the Funds’ semi-annual period, and NAVs at other pertinent dates, were as follows:
5/31/2021 Shares
Outstanding
05/31/2021 NAV
(unaudited)
11/30/2020 NAV
(audited)
05/31/2020 NAV
(unaudited)The Fairholme Fund 47,595,910 $ 30�22 $ 25�35 $ 18�45The Income Fund 11,333,348 $ 11�17 $ 10�31 $ 9�53The Allocation Fund 6,532,688 $ 9�46 $ 8�02 $ 6�42
At June 30, 2021, the unaudited NAVs of The Fairholme Fund, The Income Fund, and The Allocation Fund were $27�60, $10�86, and $8�72, respectively�
Performance figures below are shown for the Funds’ semi-annual period ended May 31, 2021, and do not match calendar year figures for the period ended June 30, 2021, cited in the Portfolio Manager’s report�
The Fairholme Fund Performance to 5/31/2021 (Unaudited)
Six Months
One Year
Five Years
Ten Years
Fifteen Years
Since Inception 12/29/1999
Cumulative: The Fairholme Fund 19.21% 63.80% 79.75% 112.24% 188.67% 767.05%S&P 500 Index 16.95% 40.32% 120.79% 283.34% 351.29% 334.04%
Annualized:The Fairholme Fund 63.80% 12.44% 7.82% 7.32% 10.61%S&P 500 Index 40.32% 17.16% 14.38% 10.57% 7.09%
For the six months ended May 31, 2021, The Fairholme Fund outperformed the S&P 500 Index (“S&P 500”) by 2�26 percentage points� Over the last year The Fairholme Fund also outperformed the S&P 500 by 23�48 percentage points� From inception, The Fairholme Fund outperformed the S&P 500 by 3�52 percentage points per annum, or on a cumulative basis, 433�01 percentage points over twenty-one years and five months�
The Income Fund Performance to 5/31/2021 (Unaudited)
Six Months
One Year
Five Years
Ten Years
Since Inception 12/31/2009
Cumulative: The Income Fund 8.80% 17.70% 30.89% 76.80% 107.33%Bloomberg Barclays Bond Index -2.16% -0.41% 17.34% 38.24% 51.73%
Annualized:The Income Fund 17.70% 5.53% 5.86% 6.60%Bloomberg Barclays Bond Index -0.41% 3.25% 3.29% 3.72%
For the six months ended May 31, 2021, The Income Fund outperformed The Bloomberg Barclays U�S� Aggregate Bond Index (“Bloomberg Barclays Bond Index”) by 10�96 percentage points� Over the last year The Income Fund also outperformed the Bloomberg Barclays Bond Index by 18�11 percentage points� From inception, The Income Fund outperformed the Bloomberg Barclays Bond Index by 2�88 percentage points per annum, or on a cumulative basis, 55�60 percentage points over eleven years and five months�

MANAGEMENT DISCUSSION & ANALYSIS (continued) For the six months ended May 31, 2021
Fairholme Funds, Inc.
7
The Allocation Fund Performance to 5/31/2021 (Unaudited)
Six Months
One Year
Five Years
Ten Years
Since Inception 12/31/2010
Cumulative: The Allocation Fund 18.23% 47.69% 31.10% 52.70% 40.03%Bloomberg Barclays Bond Index -2.16% -0.41% 17.34% 38.24% 42.42%S&P 500 Index 16.95% 40.32% 120.79% 283.34% 313.32%
Annualized:The Allocation Fund 47.69% 5.57% 4.32% 3.29%Bloomberg Barclays Bond Index -0.41% 3.25% 3.29% 3.45%S&P 500 Index 40.32% 17.16% 14.38% 14.60%
For the six months ended May 31, 2021, The Allocation Fund outperformed the Bloomberg Barclays Bond Index and the S&P 500 by 20�39 and 1�28 percentage points, respectively� Over the last year The Allocation Fund also outperformed the Bloomberg Barclays Bond Index by 48�10 percentage points and outperformed the S&P 500 by 7�37 percentage points� From inception, The Allocation Fund was outperformed by the Bloomberg Barclays Bond Index and the S&P 500 by 0�16 and 11�31 percentage points per annum, respectively, or on a cumulative basis, 2�39 and 273�29 percentage points over ten years and five months�
Fairholme Capital Management, L�L�C� (the “Manager”) believes performance over shorter periods is likely to be less meaningful than performance over longer periods� Investors are cautioned not to rely on short-term results� The fact that securities increase or decline in value does not always indicate that the Manager believes these securities to be more or less attractive — in fact, the Manager believes that some price increases present selling opportunities and some price declines present buying opportunities� Further, shareholders should note that the S&P 500 and the Bloomberg Barclays Bond Index are unmanaged indices incurring no fees, expenses, or tax effects and are shown solely to compare the Funds’ performance to that of unmanaged and diversified indices of securities� As of the prospectus dated March 30, 2021, the gross expense ratios for The Fairholme Fund, The Income Fund, and The Allocation Fund are 1�03%, 1�05%, and 1�05%, respectively� Shareholders are also cautioned that it is possible that some securities mentioned in this discussion may no longer be held by a Fund subsequent to the end of the fiscal period, and that a Fund may have made new investments that are not yet required to be disclosed� It is the Funds’ general policy not to disclose portfolio holdings other than when required by relevant law or regulation� Portfolio holdings are subject to change without notice� Not all Fund portfolio dispositions or additions are material, and, while the Funds and the Manager have long-term objectives, it is possible that a security sold or purchased in one period will be purchased or sold in a subsequent period� Generally, the Manager determines to buy and sell based on its estimates of the, respectively, relative intrinsic values and the Manager’s assessment of certain attractive characteristics of a company, general market conditions and expected future returns of an investment� The Manager invests each Fund’s assets in securities to the extent the Manager finds reasonable investment opportunities in accordance with the Fund’s respective investment strategies, policies and restrictions, as stated in the Fund’s Prospectus and may invest a significant portion of each Fund’s assets in cash and cash equivalents� The Manager views liquidity as a strategic advantage� Due to the continued uncertainty caused by the spread of the respiratory disease caused by a novel coronavirus (known as COVID-19) and the corresponding market volatility and governmental responses to it, during the period ended May 31, 2021, the Manager has continued to hold U�S� Treasury Bills as part of each Fund’s investments� At May 31, 2021, cash and cash equivalents (consisting of cash, deposit accounts, U�S� Treasury Bills, and Treasury money-market funds) represented 20�3%, 58�0%, and 25�3% of The Fairholme Fund, The Income Fund, and The Allocation Fund total assets, respectively� Since inception, the Funds have held varying levels of cash and cash equivalents for periods without, in the Manager’s view, negatively influencing performance�

MANAGEMENT DISCUSSION & ANALYSIS (continued) For the six months ended May 31, 2021
Fairholme Funds, Inc.
8
Each Fund is considered to be “non-diversified” under the Investment Company Act of 1940� Accordingly, each Fund can invest a greater percentage of its assets in fewer securities than a diversified fund, and can invest a significant portion of cash and liquid assets held by the Fund in one or more higher-risk securities at any time, including periods when a market is weak or a particular security declines sharply� The Funds may also have a greater percentage of assets invested in a particular sector than a diversified fund, exposing the Funds to the risk of an unanticipated event or condition and risks affecting a single company, sector or security� The commentaries below provide details of each Fund’s portfolio holdings by issuer and sector, as well as reporting the most significant positive and negative performance by investment for the six months ended May 31, 2021�
The most significant gains in each of the Funds’ portfolios were related to positive developments in the Real Estate Management & Development, Metals & Mining, Oil & Gas Storage & Transportation, Insurance- Property & Casualty, and Healthcare sectors� Investments in the Mortgage Finance sector saw some losses during the six months ended May 31, 2021�
The Manager made no changes to the core investment strategies and techniques it employed during the six months ended May 31, 2021�
For the six months ended May 31, 2021, The Fairholme Fund investments that contributed to performance were The St� Joe Co� and Imperial Metals Corp� The detractors to performance during the period were Federal Home Loan Mortgage Corp� (“Freddie”) and Federal National Mortgage Association (“Fannie”)� The following charts show the top holdings by issuer and sector in descending order of percentage of net assets as of May 31, 2021�
The Fairholme FundTop Holdings by Issuer*
(% of Net Assets)
The St� Joe Co� 70�0%Federal National Mortgage Association 3�9%Federal Home Loan Mortgage Corp� 3�8%Imperial Metals Corp� 1�9%Sears Holdings Corp� 0�1%
79�7%
The Fairholme FundTop Sectors
(% of Net Assets)
Real Estate Management & Development 70�0%Cash and Cash Equivalents** 20�3%Mortgage Finance 7�7%Metals & Mining 1�9%Retail Department Stores 0�1%
100�0%
* Excludes cash, U�S� Treasury Bills and Treasury money market funds�** Includes cash, U�S� Treasury Bills and Treasury money market funds�

MANAGEMENT DISCUSSION & ANALYSIS (continued) For the six months ended May 31, 2021
Fairholme Funds, Inc.
9
For the six months ended May 31, 2021, The Income Fund investments that contributed to performance were Western Midstream Partners, LP, Energy Transfer, LP, Old Republic Intl Corp�, Kinder Morgan, Inc, CVS Health Corp�, and Enbridge, Inc� The detractors to performance during the period were Federal Home Loan Mortgage Corp� (“Freddie”) and Federal National Mortgage Association (“Fannie”)� The following charts show the top holdings by issuer and sector in descending order of percentage of net assets as of May 31, 2021�
The Income FundTop Holdings by Issuer*
(% of Net Assets)
Western Midstream Partners LP 6�2%Energy Transfer LP 5�4%Old Republic International Corp� 5�0%Enbridge, Inc� 4�6%Kinder Morgan, Inc� 4�5%Federal Home Loan Mortgage Corp� 3�9%Williams Cos, Inc� (The) 3�4%Vistra Corp� 2�7%Federal National Mortgage Association 1�8%TC Energy Corp� 1�0%
38�5%
The Income FundTop Sectors**
(% of Net Assets)
Cash and Cash Equivalents*** 58�0%Oil & Gas Storage & Transportation 25�2%Mortgage Finance 5�7%Insurance - Property & Casualty 5�0%Utilities - Electric 2�7%
96�6%
* Excludes cash, U�S� Treasury Bills, Treasury money market funds and miscellaneous investments�** Excludes miscellaneous investments�*** Includes cash, U�S� Treasury Bills and Treasury money market funds�
For the six months ended May 31, 2021, The Allocation Fund investments that contributed to performance were St� Joe Co�, Imperial Metals Corp�, Western Midstream Partners, LP, and Energy Transfer, LP� The detractors to performance during the period were Federal Home Loan Mortgage Corp� (“Freddie”) and Federal National Mortgage Association (“Fannie”)� The following charts show the top holdings by issuer and sector in descending order of percentage of net assets as of May 31, 2021�
The Allocation FundTop Holdings by Issuer*
(% of Net Assets)
The St� Joe Co� 25�7%Imperial Metals Corp� 14�7%Energy Transfer LP 5�3%Federal Home Loan Mortgage Corp� 4�7%Western Midstream Partners LP 4�7%Enbridge, Inc� 4�5%Federal National Mortgage Association 4�4%Kinder Morgan, Inc� 3�6%Vistra Corp� 3�1%TC Energy Corp� 1�0%
71�7%
The Allocation FundTop Sectors**
(% of Net Assets)
Real Estate Management & Development 25�7%Cash and Cash Equivalents*** 25�3%Oil & Gas Storage & Transportation 20�1%Metals & Mining 14�7%Mortgage Finance 9�1%Utilities - Electric 3�1%
98�0%
* Excludes cash, U�S� Treasury Bills, Treasury money market funds and miscellaneous investments�** Excludes miscellaneous investments�*** Includes cash, U�S� Treasury Bills and Treasury money market funds�
The Manager views the ability to focus on fewer investments than a diversified fund as a strategic advantage� However, such a

MANAGEMENT DISCUSSION & ANALYSIS (continued) For the six months ended May 31, 2021
Fairholme Funds, Inc.
10
strategy may negatively influence long-term performance� A more complete discussion and description of the principal risks of investing in the Funds can be found in the Funds’ Prospectus and Statement of Additional Information� Large cash inflows or outflows may adversely affect the Funds’ performance� Such flows are monitored and actions deemed appropriate by the Manager are contemplated for when such flows could negatively impact performance� Since inception, the Funds have been advised by the Manager� Bruce Berkowitz, both the Chief Investment Officer of the Manager and Chairman of the Funds’ Board of Directors (the “Board” or the “Directors”), and his affiliates beneficially own an aggregate 13,317,942, 3,534,818, and 4,387,159 shares of The Fairholme Fund, The Income Fund, and The Allocation Fund, respectively, at May 31, 2021� While there is no requirement that Mr� Berkowitz own shares of the Funds, such holdings are believed to help align the interests of the Manager with the interests of the shareholders� The Board, including the Independent Directors, continues to believe that it is in the best interests of the Funds to have Mr� Berkowitz serve as Chairman of the Board given: his long-term relative performance; his experience, commitment, and significant personal investment in the Funds; the present composition of the Board; and current rules and regulations� A Director and Officers of the Funds are also Officers of the Manager� Nevertheless, at May 31, 2021, a majority of Directors were independent of the Manager, no stock option or restricted stock plans exist, Officers received no direct compensation from the Funds, and the Director affiliated with the Manager received no compensation for being a Director�
For more complete information about the Funds, or to obtain a current Prospectus, please visit www�fairholmefunds�com or call Shareholder Services at (866) 202-2263�

EXPENSE EXAMPLE For the Six Month Period from December 1, 2020 through May 31, 2021 (unaudited)
Fairholme Funds, Inc.
11
As a shareholder of a Fund, you incur two types of costs: (1) transaction costs including, but not limited to, transaction fees at some broker-dealers, custodial fees for retirement accounts, redemption fees (on The Fairholme Fund and The Allocation Fund shares redeemed or exchanged within 60 days of purchase), and wire transfer fees; and (2) ongoing costs including, but not limited to, management fees paid to the Manager� The following examples are intended to help you understand your ongoing costs (in dollars) of investing in the Funds and to compare these costs with the ongoing costs of investing in other mutual funds�
These examples are based on an investment of $1,000 invested in the Funds at December 1, 2020, and held for the entire six month period ending May 31, 2021�
Actual Expenses
The first line of the tables below provides information about actual account values and actual expenses� You may use the information in this line, together with the amount you had invested at the beginning of the period, to estimate the expenses that you paid over the period� Simply divide your account value by $1,000 (for example, an $8,600 account value divided by $1,000 = 8�6), then multiply the result by the number in the first line under the heading “Expenses Paid During the Period” to estimate the expenses you paid on your account during this period�
Hypothetical Example for Comparison Purposes
The second line of the tables below provides information about hypothetical account values and hypothetical expenses based on each Fund’s actual expense ratio and an assumed rate of return of 5% per year before expenses, which is not the Fund’s actual return for the period presented� The hypothetical account values and expenses may not be used to estimate the actual ending account balance or expenses that you paid for the period presented� However, you may use this information to compare ongoing costs of investing in the Funds with the ongoing costs of investing in other funds� To do so, compare this 5% hypothetical example with the 5% hypothetical examples that appear in the shareholder reports of other funds�
Please note that the expenses shown in the table are meant to highlight your ongoing costs only and do not reflect any transactional costs, such as redemption fees (if any), or other direct costs� Therefore, the second line of the tables is useful in comparing ongoing costs only, and will not help you determine the relative total costs of owning different funds� In addition, if these transactional costs were included, your total costs would be higher�
Beginning Account Value
December 1, 2020
Ending Account Value May 31, 2021
Annualized Expense Ratio*
Expenses Paid During the Period December 1, 2020
Through May 31, 2021**
The Fairholme Fund – –Actual $1,000.00 $1,192.10 0.80% $4.37Hypothetical
(5% return before expenses) $1,000.00 $1,020.94 0.80% $4.03The Income Fund – –Actual $1,000.00 $1,088.00 0.80% $4.16Hypothetical
(5% return before expenses) $1,000.00 $1,020.94 0.80% $4.03The Allocation Fund – –Actual $1,000.00 $1,182.30 0.80% $4.35Hypothetical
(5% return before expenses) $1,000.00 $1,020.94 0.80% $4.03* Effective January 1, 2018, the Manager has agreed to waive, on a voluntary basis, a portion of the management fee of The Fairholme
Fund, The Income Fund and The Allocation Fund to the extent necessary to limit the management fee paid to the Manager by The Fairholme Fund, The Income Fund and The Allocation Fund, respectively, to an annual rate of 0�80% of that Fund’s daily average net asset value� This undertaking may be terminated by the Manager upon 60 days’ written notice to the applicable Fund�
** Expenses are equal to each Fund’s annualized expense ratio, multiplied by the average account value over the period, multiplied by 182 days/365 days (to reflect the one-half year period)�
SCHEDULE OF INVESTMENTS May 31, 2021 (unaudited)
The Fairholme Fund
12
The accompanying notes are an integral part of the financial statements.
Shares Value
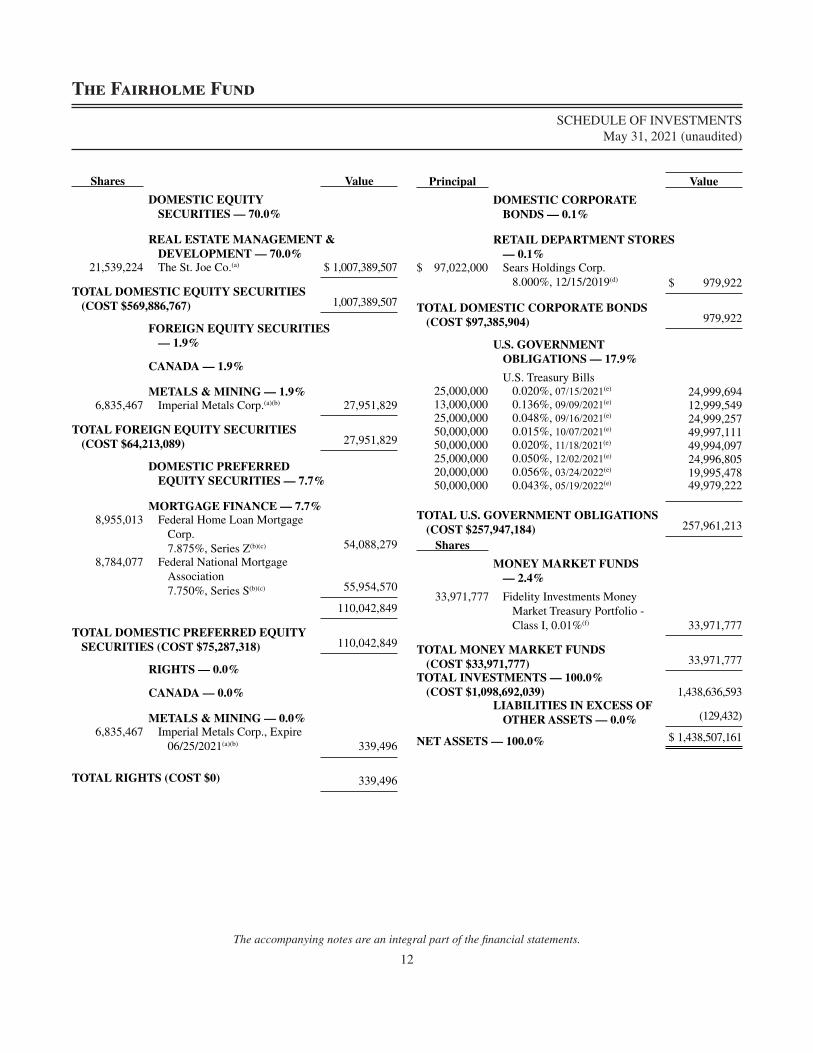
DOMESTIC EQUITY SECURITIES — 70.0%
REAL ESTATE MANAGEMENT & DEVELOPMENT — 70.0%
21,539,224 The St� Joe Co�(a) $ 1,007,389,507
TOTAL DOMESTIC EQUITY SECURITIES (COST $569,886,767) 1,007,389,507
FOREIGN EQUITY SECURITIES — 1.9%
CANADA — 1.9%
METALS & MINING — 1.9% 6,835,467 Imperial Metals Corp�(a)(b) 27,951,829
TOTAL FOREIGN EQUITY SECURITIES (COST $64,213,089) 27,951,829
DOMESTIC PREFERRED EQUITY SECURITIES — 7.7%
MORTGAGE FINANCE — 7.7% 8,955,013 Federal Home Loan Mortgage
Corp� 7�875%, Series Z(b)(c) 54,088,279
8,784,077 Federal National Mortgage Association 7�750%, Series S(b)(c) 55,954,570
110,042,849
TOTAL DOMESTIC PREFERRED EQUITY SECURITIES (COST $75,287,318) 110,042,849
RIGHTS — 0.0%
CANADA — 0.0%
METALS & MINING — 0.0% 6,835,467 Imperial Metals Corp�, Expire
06/25/2021(a)(b) 339,496
TOTAL RIGHTS (COST $0) 339,496
Principal Value
DOMESTIC CORPORATE BONDS — 0.1%
RETAIL DEPARTMENT STORES — 0.1%
$ 97,022,000 Sears Holdings Corp� 8�000%, 12/15/2019(d) $ 979,922
TOTAL DOMESTIC CORPORATE BONDS (COST $97,385,904) 979,922
U.S. GOVERNMENT OBLIGATIONS — 17.9%
U�S� Treasury Bills 25,000,000 0�020%, 07/15/2021(e) 24,999,694 13,000,000 0�136%, 09/09/2021(e) 12,999,549 25,000,000 0�048%, 09/16/2021(e) 24,999,257 50,000,000 0�015%, 10/07/2021(e) 49,997,111 50,000,000 0�020%, 11/18/2021(e) 49,994,097 25,000,000 0�050%, 12/02/2021(e) 24,996,805 20,000,000 0�056%, 03/24/2022(e) 19,995,478 50,000,000 0�043%, 05/19/2022(e) 49,979,222
TOTAL U.S. GOVERNMENT OBLIGATIONS (COST $257,947,184) 257,961,213
Shares
MONEY MARKET FUNDS — 2.4%
33,971,777 Fidelity Investments Money Market Treasury Portfolio - Class I, 0�01%(f) 33,971,777
TOTAL MONEY MARKET FUNDS (COST $33,971,777) 33,971,777
TOTAL INVESTMENTS — 100.0% (COST $1,098,692,039) 1,438,636,593
LIABILITIES IN EXCESS OF OTHER ASSETS — 0.0% (129,432 )
NET ASSETS — 100.0% $ 1,438,507,161

SCHEDULE OF INVESTMENTS (continued) May 31, 2021 (unaudited)
The Fairholme Fund
13
The accompanying notes are an integral part of the financial statements.
(a) Affiliated Company� See Note 7�(b) Non-income producing security�(c) Variable rate security� Rates shown are the effective rates as of May 31, 2021�(d) Security in default and no interest was accrued as of May 31, 2021�(e) Rates shown are the effective yields based on the purchase price� The calculation assumes the security is held to maturity� (f) Annualized based on the 1-day yield as of May 31, 2021�

STATEMENT OF ASSETS & LIABILITIES May 31, 2021 (unaudited)
The Fairholme Fund
14The accompanying notes are an integral part of the financial statements.
Assets
Investments, at Fair Value:
Unaffiliated Issuers (Cost – $464,592,183) $ 402,955,761
Affiliated Issuers (Cost – $634,099,856) 1,035,680,832
Dividends and Interest Receivable 1,731,414
Receivable for Capital Shares Sold 31,532
Total Assets 1,440,399,539
LiabilitiesAccrued Management Fees 955,693
Payable for Capital Shares Redeemed 936,685
Total Liabilities 1,892,378
NET ASSETS $ 1,438,507,161
Net Assets consist of:Paid-In Capital $ 1,838,163,522
Total Accumulated Losses (399,656,361 )
NET ASSETS $ 1,438,507,161
Shares of Common Stock Outstanding* ($0�0001 par value) 47,595,910
Net Asset Value, Offering and Redemption Price Per Share ($1,438,507,161 / 47,595,910 shares) $ 30�22
* 700,000,000 shares authorized in total�

STATEMENT OF OPERATIONS (unaudited)
The Fairholme Fund
15The accompanying notes are an integral part of the financial statements.
For the Six Months Ended
May 31, 2021Investment Income
Interest — Unaffiliated Issuers $ 91,996 Dividends — Unaffiliated Issuers 243,055 Dividends — Affiliated Issuers 3,462,668
Total Investment Income 3,797,719
Expenses
Management Fees 7,200,896
Total Expenses 7,200,896
Less: Voluntary Reduction of Management Fees (1,440,179 )
Net Expenses 5,760,717
Net Investment Loss (1,962,998 )
Realized and Unrealized Gain (Loss) on Investments and Foreign Currency Related Transactions –
Net Realized Gain on InvestmentsUnaffiliated Issuers 5,885,280 Affiliated Issuers 10,108,286
Net Change in Unrealized Appreciation (Depreciation) on Investments and Foreign Currency Related TranslationsUnaffiliated Investments (79,406,718 )Affiliated Investments 308,195,019
Net Realized and Unrealized Gain (Loss) on Investments and Foreign Currency Related Transactions 244,781,867
NET INCREASE IN NET ASSETS FROM OPERATIONS $ 242,818,869

STATEMENTS OF CHANGES IN NET ASSETS
The Fairholme Fund
16The accompanying notes are an integral part of the financial statements.
For the Six Months Ended
May 31, 2021 (Unaudited)
For the Fiscal Year Ended
November 30, 2020CHANGES IN NET ASSETSFrom Operations
Net Investment Loss $ (1,962,998 ) $ (4,188,289 )Net Realized Gain (Loss) on Investments 15,993,566 (788,218 )Net Change in Unrealized Appreciation (Depreciation)
on Investments and Foreign Currency Related Translations 228,788,301 323,118,083
Net Increase in Net Assets from Operations 242,818,869 318,141,576 From Dividends and Distributions to Shareholders
Net Decrease in Net Assets from Dividends and Distributions — (9,053,098 )
From Capital Share TransactionsProceeds from Sale of Shares 14,843,072 78,829,861 Shares Issued in Reinvestment of Dividends and
Distributions — 6,693,804 Redemption Fees 23,165 36,068 Cost of Shares Redeemed (88,388,892 ) (181,977,804 )Net Decrease in Net Assets from Shareholder Activity (73,522,655 ) (96,418,071 )
NET ASSETSNet Increase in Net Assets 169,296,214 212,670,407 Net Assets at Beginning of Period 1,269,210,947 1,056,540,540 Net Assets at End of Period $ 1,438,507,161 $ 1,269,210,947
SHARES TRANSACTIONSIssued 503,181 4,096,357 Reinvested — 333,357 Redeemed (2,967,914 ) (9,428,093 )Net Decrease in Shares (2,464,733 ) (4,998,379 )Shares Outstanding at Beginning of Period 50,060,643 55,059,022 Shares Outstanding at End of Period 47,595,910 50,060,643

FINANCIAL HIGHLIGHTS
The Fairholme Fund
17The accompanying notes are an integral part of the financial statements.
For the Six Months
Ended May 31, 2021 (Unaudited)
For the Fiscal Year Ended November 30,
2020 2019 2018 2017 2016
PER SHARE OPERATING PERFORMANCE
NET ASSET VALUE, BEGINNING OF PERIOD $25�35 $19�19 $16�05 $19�10 $24�26 $34�24
Investment OperationsNet Investment Income (Loss)(1) (0�04) (0�08) 0�16 0�29 0�23 0�33 Net Realized and Unrealized Gain (Loss) on Investments 4�91 6�41 3�32 (3�08) (3�81) 2�60
Total from Investment Operations 4�87 6�33 3�48 (2�79) (3�58) 2�93
Dividends and DistributionsFrom Net Investment Income — (0�17) (0�34) (0�26) (0�40) (0�60)From Realized Capital Gains — — — — (1�18) (12�31)
Total Dividends and Distributions — (0�17) (0�34) (0�26) (1�58) (12�91)
Redemption Fees(1) 0�00(2) 0�00(2) 0�00(2) 0�00(2) 0�00(2) 0�00(2)
NET ASSET VALUE, END OF PERIOD $30�22 $25�35 $19�19 $16�05 $19�10 $24�26
TOTAL RETURN 19�21%(3) 33�19% 22�20% (14�85)% (15�64)% 18�93%
Ratio/Supplemental DataNet Assets, End of Period (in 000’s) $1,438,507 $1,269,211 $1,056,541 $1,064,866 $1,871,480 $3,155,709
Ratio of Gross Expenses to Average Net Assets 1�00%(4) 1�01%(5) 1�00%(6) 1�00% 1�02%(7) 1�02%(7)
Ratio of Net Expenses to Average Net Assets 0�80%(4)(8) 0�81%(5)(8) 0�80%(6)(8) 0�82%(8) 1�02%(7) 1�02%(7)
Ratio of Net Investment Income (Loss) to Average Net Assets (0�27)%(4) (0�41)% 0�86% 1�57% 1�14% 1�79%Portfolio Turnover Rate 0�26%(3) 8�18% 8�05% 16�29% 6�57% 19�19%
(1) Based on average shares outstanding� (2) Redemption fees represent less than $0�01�(3) Not annualized�(4) Annualized�(5) 0�01% is attributable to legal expenses incurred outside of the 1�00% management fee�(6) Less than 0�01% is attributable to legal expenses incurred outside of the 1�00% management fee�(7) 0�02% is attributable to legal expenses incurred outside of the 1�00% management fee�(8) Effective January 1, 2018, the Manager has agreed to waive, on a voluntary basis, a portion of the management fee of The Fairholme Fund to the extent
necessary to limit the management fee paid to the Manager by The Fairholme Fund to an annual rate of 0�80% of the daily average net asset value of The Fairholme Fund�

SCHEDULE OF INVESTMENTS May 31, 2021 (unaudited)
The Fairholme Focused Income Fund
18
The accompanying notes are an integral part of the financial statements.
Shares Value
DOMESTIC EQUITY SECURITIES — 27.3%
INSURANCE - PROPERTY & CASUALTY — 5.0%
241,100 Old Republic International Corp� $ 6,331,286
OIL & GAS STORAGE & TRANSPORTATION — 19.6%
312,000 Kinder Morgan, Inc� 5,722,080 695,500 Energy Transfer LP 6,885,450 165,300 Williams Cos, Inc� (The) 4,354,002 392,400 Western Midstream Partners LP 7,840,152
24,801,684
UTILITIES - ELECTRIC — 2.7% 214,000 Vistra Corp� 3,460,380
TOTAL DOMESTIC EQUITY SECURITIES (COST $24,718,647) 34,593,350
FOREIGN EQUITY SECURITIES — 5.6%
CANADA — 5.6%
OIL & GAS STORAGE & TRANSPORTATION — 5.6%
151,700 Enbridge, Inc� 5,837,416 25,400 TC Energy Corp� 1,296,924
7,134,340
TOTAL FOREIGN EQUITY SECURITIES (COST $5,920,419) 7,134,340
DOMESTIC PREFERRED EQUITY SECURITIES — 5.7%
MORTGAGE FINANCE — 5.7%Federal Home Loan Mortgage
Corp� 302,300 5�100%, Series H(a) 3,010,908 260,924 6�550%, Series Y(a) 1,333,322 88,500 7�875%, Series Z(a)(b) 534,540
360,100 Federal National Mortgage Association 7�750%, Series S(a)(b) 2,293,837
7,172,607
TOTAL DOMESTIC PREFERRED EQUITY SECURITIES (COST $7,350,597) 7,172,607
Principal Value
U.S. GOVERNMENT OBLIGATIONS — 48.9%
U�S� Treasury Bills $ 4,000,000 0�136%, 09/09/2021(c) $ 3,999,861 10,000,000 0�020%, 11/18/2021(c) 9,998,819 23,000,000 0�068%, 03/24/2022(c) 22,994,799 10,000,000 0�058%, 04/21/2022(c) 9,997,045 15,000,000 0�043%, 05/19/2022(c) 14,993,767
TOTAL U.S. GOVERNMENT OBLIGATIONS (COST $61,973,276) 61,984,291
Shares
MONEY MARKET FUNDS — 9.1%
11,470,535 Fidelity Investments Money Market Treasury Portfolio - Class I, 0�01%(d) 11,470,535
TOTAL MONEY MARKET FUNDS (COST $11,470,535) 11,470,535
MISCELLANEOUS INVESTMENTS — 3.8%(e)
(COST $4,849,529) 4,793,833
TOTAL INVESTMENTS — 100.4% (COST $116,283,003) 127,148,956
LIABILITIES IN EXCESS OF OTHER ASSETS — (0.4)% (546,013 )
NET ASSETS — 100.0% $ 126,602,943

SCHEDULE OF INVESTMENTS (continued) May 31, 2021 (unaudited)
The Fairholme Focused Income Fund
19
The accompanying notes are an integral part of the financial statements.
(a) Non-income producing security�(b) Variable rate security� Rates shown are the effective rates as of May 31, 2021�(c) Rates shown are the effective yields based on the purchase price� The calculation assumes the security is held to maturity� (d) Annualized based on the 1-day yield as of May 31, 2021�(e) Represents previously undisclosed unrestricted securities, which the Fund has held for less than one year�

STATEMENT OF ASSETS & LIABILITIES May 31, 2021 (unaudited)
The Fairholme Focused Income Fund
20The accompanying notes are an integral part of the financial statements.
AssetsInvestments, at Fair Value (Cost — $116,283,003) $ 127,148,956
Dividends and Interest Receivable 120,323
Receivable for Capital Shares Sold 10,003
Total Assets 127,279,282
LiabilitiesAccrued Management Fees 85,797
Dividend withholding tax payable 15,424
Payable for securities purchased 575,118
Total Liabilities 676,339
NET ASSETS $ 126,602,943
Net Assets consist of:Paid-In Capital $ 146,156,325
Total Accumulated Losses (19,553,382 )
NET ASSETS $ 126,602,943
Shares of Common Stock Outstanding* ($0�0001 par value) 11,333,348
Net Asset Value, Offering and Redemption Price Per Share ($126,602,943 / 11,333,348 shares) $ 11�17
* 200,000,000 shares authorized in total�

STATEMENT OF OPERATIONS (unaudited)
The Fairholme Focused Income Fund
21The accompanying notes are an integral part of the financial statements.
For the Six Months Ended
May 31, 2021Investment Income
Interest $ 27,514 Dividends 1,087,785
Total Investment Income 1,115,299
Expenses
Management Fees 592,534
Total Expenses 592,534
Less: Voluntary Reduction of Management Fees (117,208 )
Net Expenses 475,326
Net Investment Income 639,973
Realized and Unrealized Gain (Loss) on Investments and Foreign Currency Related Transactions –Net Realized Loss on Investments and Foreign Currency Related
Transactions (18,550,462 )Net Change in Unrealized Appreciation (Depreciation) on
Investments 28,237,900 Net Realized and Unrealized Gain (Loss) on Investments and
Foreign Currency Related Transactions 9,687,438
NET INCREASE IN NET ASSETS FROM OPERATIONS $ 10,327,411

STATEMENTS OF CHANGES IN NET ASSETS
The Fairholme Focused Income Fund
22The accompanying notes are an integral part of the financial statements.
For the Six Months Ended
May 31, 2021 (Unaudited)
For the Fiscal Year Ended
November 30, 2020CHANGES IN NET ASSETSFrom Operations
Net Investment Income $ 639,973 $ 1,129,798 Net Realized Loss on Investments and Foreign Currency
Related Transactions (18,550,462 ) (6,039,814 )Net Change in Unrealized Appreciation (Depreciation)
on Investments 28,237,900 1,558,814 Net Increase (Decrease) in Net Assets from Operations 10,327,411 (3,351,202 )
From Dividends and Distributions to ShareholdersNet Decrease in Net Assets from Dividends and
Distributions (489,091 ) (1,722,888 )From Capital Share Transactions
Proceeds from Sale of Shares 14,609,547 28,283,233 Shares Issued in Reinvestment of Dividends and
Distributions 276,905 798,557 Cost of Shares Redeemed (5,230,574 ) (96,250,024 )Net Increase (Decrease) in Net Assets from Shareholder
Activity 9,655,878 (67,168,234 )NET ASSETS
Net Increase (Decrease) in Net Assets 19,494,198 (72,242,324 )Net Assets at Beginning of Period 107,108,745 179,351,069 Net Assets at End of Period $ 126,602,943 $ 107,108,745
SHARES TRANSACTIONSIssued 1,410,707 2,790,517 Reinvested 26,294 82,177 Redeemed (495,813 ) (10,010,500 )Net Increase (Decrease) in Shares 941,188 (7,137,806 )Shares Outstanding at Beginning of Period 10,392,160 17,529,966 Shares Outstanding at End of Period 11,333,348 10,392,160

FINANCIAL HIGHLIGHTS
The Fairholme Focused Income Fund
23The accompanying notes are an integral part of the financial statements.
For the Six Months
Ended May 31, 2021 (Unaudited)
For the Fiscal Year Ended November 30,
2020 2019 2018 2017 2016
PER SHARE OPERATING PERFORMANCE
NET ASSET VALUE, BEGINNING OF PERIOD $10�31 $10�23 $9�88 $11�33 $12�38 $10�72
Investment OperationsNet Investment Income(1) 0�06 0�07 0�30 0�49 0�60 0�57 Net Realized and Unrealized Gain (Loss) on Investments 0�84 0�11(2) 0�34 (0�91) (0�99) 1�72
Total from Investment Operations 0�90 0�18 0�64 (0�42) (0�39) 2�29
Dividends and DistributionsFrom Net Investment Income (0�04) (0�10) (0�29) (0�51) (0�61) (0�56)From Realized Capital Gains — — — (0�52) (0�05) (0�07)
Total Dividends and Distributions (0�04) (0�10) (0�29) (1�03) (0�66) (0�63)
NET ASSET VALUE, END OF PERIOD $11�17 $10�31 $10�23 $9�88 $11�33 $12�38
TOTAL RETURN 8�80%(3) 1�78% 6�49% (4�19)% (3�35)% 22�77%
Ratio/Supplemental DataNet Assets, End of Period (in 000’s) $126,603 $107,109 $179,351 $188,500 $223,432 $240,195 Ratio of Gross Expenses to Average Net Assets 1�00%(4) 1�02%(5) 1�02%(5) 1�00% 1�00% 1�00%Ratio of Net Expenses to Average Net Assets 0�80%(4)(6) 0�82%(5)(6) 0�82%(5)(6) 0�82%(6) 1�00% 1�00%Ratio of Net Investment Income to Average Net Assets 1�08%(4) 0�74% 2�94% 4�56% 5�02% 5�48%Portfolio Turnover Rate 61�21%(3) 100�67% 16�70% 45�78% 36�05% 28�81%
(1) Based on average shares outstanding� (2) The amount shown for a share outstanding does not correspond with the aggregate net gain (loss) on investments for the period due to the timing of sales
and redemptions of shares in relation to fluctuating market values of the investments of The Income Fund�(3) Not annualized�(4) Annualized�(5) 0�02% is attributable to legal expenses incurred outside the management fee�(6) Effective January 1, 2018, the Manager has agreed to waive, on a voluntary basis, a portion of the management fee of The Income Fund to the extent
necessary to limit the management fee paid to the Manager by The Income Fund to an annual rate of 0�80% of the daily average net asset value of The Income Fund�

SCHEDULE OF INVESTMENTS May 31, 2021 (unaudited)
The Fairholme Allocation Fund
24
The accompanying notes are an integral part of the financial statements.
Shares Value
DOMESTIC EQUITY SECURITIES — 43.4%
OIL & GAS STORAGE & TRANSPORTATION — 14.6%
121,600 Kinder Morgan, Inc� $ 2,230,144 333,700 Energy Transfer LP 3,303,630 144,200 Western Midstream Partners LP 2,881,116 25,000 Enterprise Products Partners LP 590,250
9,005,140
REAL ESTATE MANAGEMENT & DEVELOPMENT — 25.7%
348,267 The St� Joe Co�(a) 15,874,010
UTILITIES - ELECTRIC — 3.1% 119,100 Vistra Corp� 1,925,847
TOTAL DOMESTIC EQUITY SECURITIES (COST $14,218,107) 26,804,997
FOREIGN EQUITY SECURITIES — 20.0%
CANADA — 20.0%
METALS & MINING — 14.5% 2,192,841 Imperial Metals Corp�(b) 8,967,042
OIL & GAS STORAGE & TRANSPORTATION — 5.5%
73,300 Enbridge, Inc� 2,820,584 11,900 TC Energy Corp� 607,614
3,428,198
TOTAL FOREIGN EQUITY SECURITIES (COST $28,814,721) 12,395,240
DOMESTIC PREFERRED EQUITY SECURITIES — 9.1%
MORTGAGE FINANCE — 9.1% 479,295 Federal Home Loan Mortgage
Corp� 7�875%, Series Z(b)(c) 2,894,942
432,465 Federal National Mortgage Association 7�750%, Series S(b)(c) 2,754,802
5,649,744
TOTAL DOMESTIC PREFERRED EQUITY SECURITIES (COST $3,917,285) 5,649,744
Shares Value
RIGHTS — 0.2%
CANADA — 0.2%
METALS & MINING — 0.2% 2,192,841 Imperial Metals Corp�, Expire
06/25/2021(b) $ 108,911
TOTAL RIGHTS (COST $0) 108,911
Principal
U.S. GOVERNMENT OBLIGATIONS — 17.8%
U�S� Treasury Bills $ 1,000,000 0�136%, 09/09/2021(d) 999,965 2,000,000 0�020%, 11/18/2021(d) 1,999,764 3,000,000 0�058%, 04/21/2022(d) 2,999,114 5,000,000 0�043%, 05/19/2022(d) 4,997,922
TOTAL U.S. GOVERNMENT OBLIGATIONS (COST $10,995,803) 10,996,765
Shares
MONEY MARKET FUNDS — 7.5%
4,633,615 Fidelity Investments Money Market Treasury Portfolio - Class I, 0�01%(e) 4,633,615
TOTAL MONEY MARKET FUNDS (COST $4,633,615) 4,633,615
MISCELLANEOUS INVESTMENTS — 1.9%(f)
(COST $1,211,449) 1,158,006
TOTAL INVESTMENTS — 99.9% (COST $63,790,980) 61,747,278
OTHER ASSETS IN EXCESS OF LIABILITIES — 0.1% 32,995
NET ASSETS — 100.0% $ 61,780,273

SCHEDULE OF INVESTMENTS (continued) May 31, 2021 (unaudited)
The Fairholme Allocation Fund
25
The accompanying notes are an integral part of the financial statements.
(a) Restricted/controlled security� The value of this security totals $15,874,010, which represents 25�69% of The Allocation Fund’s net assets� Information
related to this security is as follows:
Shares IssuerAcquisition
Date(s)Acquisition
Cost
5/31/2021 Carrying Value
Per Unit 348,267 The St� Joe Co� 08/09/2017-09/01/2017 $6,615,792 $45�58
(b) Non-income producing security�(c) Variable rate security� Rates shown are the effective rates as of May 31, 2021�(d) Rates shown are the effective yields based on the purchase price� The calculation assumes the security is held to maturity� (e) Annualized based on the 1-day yield as of May 31, 2021�(f) Represents previously undisclosed unrestricted securities, which the Fund has held for less than one year�

STATEMENT OF ASSETS & LIABILITIES May 31, 2021 (unaudited)
The Fairholme Allocation Fund
26The accompanying notes are an integral part of the financial statements.
AssetsInvestments, at Fair Value (Cost — $63,790,980) $ 61,747,278
Dividends and Interest Receivable 82,285
Total Assets 61,829,563
LiabilitiesAccrued Management Fees 41,837
Dividend withholding tax payable 7,453
Total Liabilities 49,290
NET ASSETS $ 61,780,273
Net Assets consist of:Paid-In Capital $ 112,461,491
Total Accumulated Losses (50,681,218 )
NET ASSETS $ 61,780,273
Shares of Common Stock Outstanding* ($0�0001 par value) 6,532,688
Net Asset Value, Offering and Redemption Price Per Share ($61,780,273 / 6,532,688 shares) $ 9�46
* 200,000,000 shares authorized in total�

STATEMENT OF OPERATIONS (unaudited)
The Fairholme Allocation Fund
27The accompanying notes are an integral part of the financial statements.
For the Six Months Ended
May 31, 2021Investment Income
Interest $ 5,226 Dividends 459,537
Total Investment Income 464,763
Expenses
Management Fees 303,014
Total Expenses 303,014
Less: Voluntary Reduction of Management Fees (60,603 )
Net Expenses 242,411
Net Investment Income 222,352
Realized and Unrealized Gain (Loss) on Investments and Foreign Currency Related Transactions –
Net Realized Gain on Investments 603,030 Net Change in Unrealized Appreciation (Depreciation) on
Investments and Foreign Currency Related Translations 9,200,190 Net Realized and Unrealized Gain (Loss) on Investments and
Foreign Currency Related Transactions 9,803,220
NET INCREASE IN NET ASSETS FROM OPERATIONS $ 10,025,572

STATEMENTS OF CHANGES IN NET ASSETS
The Fairholme Allocation Fund
28The accompanying notes are an integral part of the financial statements.
For the Six Months Ended
May 31, 2021 (Unaudited)
For the Fiscal Year Ended
November 30, 2020CHANGES IN NET ASSETSFrom Operations
Net Investment Income $ 222,352 $ 130,228 Net Realized Gain (Loss) on Investments 603,030 (1,190,217 )Net Change in Unrealized Appreciation (Depreciation)
on Investments and Foreign Currency Related Translations 9,200,190 8,568,938
Net Increase in Net Assets from Operations 10,025,572 7,508,949 From Dividends and Distributions to Shareholders
Net Decrease in Net Assets from Dividends and Distributions (144,235 ) (820,275 )
From Capital Share TransactionsProceeds from Sale of Shares 407,269 699,999 Shares Issued in Reinvestment of Dividends and
Distributions 51,334 405,372 Redemption Fees 516 2,375 Cost of Shares Redeemed (4,821,301 ) (10,518,429 )Net Decrease in Net Assets from Shareholder Activity (4,362,182 ) (9,410,683 )
NET ASSETSNet Increase (Decrease) in Net Assets 5,519,155 (2,722,009 )Net Assets at Beginning of Period 56,261,118 58,983,127 Net Assets at End of Period $ 61,780,273 $ 56,261,118
SHARES TRANSACTIONSIssued 45,599 103,712 Reinvested 5,768 56,459 Redeemed (530,981 ) (1,571,345 )Net Decrease in Shares (479,614 ) (1,411,174 )Shares Outstanding at Beginning of Period 7,012,302 8,423,476 Shares Outstanding at End of Period 6,532,688 7,012,302

FINANCIAL HIGHLIGHTS
The Fairholme Allocation Fund
29The accompanying notes are an integral part of the financial statements.
For the Six Months
Ended May 31, 2021 (Unaudited)
For the Fiscal Year Ended November 30,
2020 2019 2018 2017 2016
PER SHARE OPERATING PERFORMANCE
NET ASSET VALUE, BEGINNING OF PERIOD $8�02 $7�00 $6�58 $7�44 $9�65 $10�40
Investment OperationsNet Investment Income(1) 0�03 0�02 0�09 0�09 0�10 0�14 Net Realized and Unrealized Gain (Loss) on Investments 1�43 1�10 0�40 (0�83) (1�71) 0�75
Total from Investment Operations 1�46 1�12 0�49 (0�74) (1�61) 0�89
Dividends and DistributionsFrom Net Investment Income (0�02) (0�10) (0�07) (0�12) (0�17) (0�31)From Realized Capital Gains — — — — (0�43) (1�33)
Total Dividends and Distributions (0�02) (0�10) (0�07) (0�12) (0�60) (1�64)
Redemption Fees(1) 0�00(2) 0�00(2) 0�00(2) 0�00(2) 0�00(2) 0�00(2)
NET ASSET VALUE, END OF PERIOD $9�46 $8�02 $7�00 $6�58 $7�44 $9�65
TOTAL RETURN 18�23%(3) 16�13% 7�61% (10�18)% (17�59)% 11�06%
Ratio/Supplemental DataNet Assets, End of Period (in 000’s) $61,780 $56,261 $58,983 $72,387 $114,190 $259,501 Ratio of Gross Expenses to Average Net Assets 1�00%(4) 1�02%(5) 1�02%(5) 1�00% 1�00% 1�00%Ratio of Net Expenses to Average Net Assets 0�80%(4)(6) 0�82%(5)(6) 0�82%(5)(6) 0�82%(6) 1�00% 1�00%Ratio of Net Investment Income to Average Net Assets 0�73%(4) 0�24% 1�21% 1�32% 1�19% 1�81%Portfolio Turnover Rate 18�65%(3) 32�15% 15�58% 23�52% 31�01% 13�65%
(1) Based on average shares outstanding� (2) Redemption fees represent less than $0�01�(3) Not annualized�(4) Annualized�(5) 0�02% is attributable to legal expenses incurred outside the management fee�(6) Effective January 1, 2018, the Manager has agreed to waive, on a voluntary basis, a portion of the management fee of The Allocation Fund to the extent
necessary to limit the management fee paid to the Manager by The Allocation Fund to an annual rate of 0�80% of the daily average net asset value of The Allocation Fund�

NOTES TO FINANCIAL STATEMENTS May 31, 2021 (unaudited)
Fairholme Funds, Inc.
30
Note 1. Organization
Fairholme Funds, Inc� (the “Company”), a Maryland corporation, is registered under the Investment Company Act of 1940, as amended (the “1940 Act”), as an open-end management investment company� The Company’s Articles of Incorporation permit the Board of Directors of the Company (the “Board” or the “Directors”) to issue 1,100,000,000 shares of common stock at $�0001 par value� 700,000,000 shares have been allocated to The Fairholme Fund (“The Fairholme Fund”), 200,000,000 shares have been allocated to The Fairholme Focused Income Fund (“The Income Fund”), and 200,000,000 shares have been allocated to The Fairholme Allocation Fund (“The Allocation Fund”)� The Fairholme Fund, The Income Fund, and The Allocation Fund (each a “Fund” and collectively the “Funds”) are non-diversified funds� The Funds may have a greater percentage of their assets invested in particular securities than a diversified fund, exposing the Funds to the risk of unanticipated industry conditions as well as risks specific to a single company or the securities of a single company� Each Fund has different objectives, capitalizations, and considerations that may or may not lead to differing compositions of issuers, securities within an issuer, and cash levels within each Fund� The Board has the power to designate one or more separate and distinct series and/or classes of shares of common stock and to classify or reclassify any unissued shares with respect to such series�
The Fairholme Fund’s investment objective is to provide long-term growth of capital� Under normal circumstances, The Fairholme Fund seeks to achieve its investment objective by investing in a focused portfolio of equity and fixed-income securities� The proportion of The Fairholme Fund’s assets invested in each type of asset class will vary from time to time based upon Fairholme Capital Management, L�L�C�’s (the “Manager”) assessment of general market and economic conditions� The Fairholme Fund may invest in, and may shift frequently among, the asset classes and market sectors� The equity securities in which The Fairholme Fund may invest include common and preferred stock (including convertible preferred stock), partnership interests, business trust shares, interests in real estate investment trusts (“REITs”), rights and warrants to subscribe for the purchase of equity securities, and depository receipts� The Fairholme Fund may invest in equity securities without regard to the jurisdictions in which the issuers of the securities are organized or situated and without regard to the market capitalizations or sectors of such issuers� The fixed-income securities in which The Fairholme Fund may invest include U�S� corporate debt securities, non-U�S� corporate debt securities, bank debt (including bank loans and participations), U�S� government and agency debt securities (including U�S� Treasury bills), short-term debt obligations of foreign governments, and foreign money market instruments� Except for its investments in short-term debt obligations of foreign governments, The Fairholme Fund may invest in fixed-income securities regardless of maturity or the rating of the issuer of the security� The Fairholme Fund may also invest in “special situations” to achieve its objective� “Special situation” investments may include equity securities or fixed-income securities, such as corporate debt, which may be in a distressed position as a result of economic or company specific developments� Although The Fairholme Fund normally holds a focused portfolio of equity and fixed-income securities, The Fairholme Fund is not required to be fully invested in such securities and may maintain a significant portion of its total assets in cash and securities generally considered to be cash equivalents� The Manager serves as investment adviser to The Fairholme Fund�
The Income Fund’s investment objective is to seek current income� Under normal circumstances, The Income Fund seeks to achieve its investment objective by investing in a focused portfolio of cash distributing securities� To maintain maximum flexibility, the securities in which The Income Fund may invest include corporate bonds and other corporate debt securities of issuers in the U�S� and foreign countries, bank debt (including bank loans and loan participations), government and agency debt securities of the U�S� and foreign countries (including U�S� Treasury bills), convertible bonds and other convertible securities, and equity securities, including preferred and common stock and interests in REITs� Although The Income Fund normally holds a focused portfolio of securities, The Income Fund is not required to be fully invested in such securities and may maintain a significant portion of its total assets in cash and securities generally considered to be cash equivalents� The Manager serves as investment adviser to The Income Fund�
The Allocation Fund’s investment objective is to seek long-term total return� Under normal circumstances, The Allocation Fund seeks to achieve its investment objective by investing opportunistically in a focused portfolio of investments in the equity, fixed-income and cash, and cash-equivalent asset classes� The proportion of The Allocation Fund’s portfolio invested in each asset class will vary from time to time based on the Manager’s assessment of relative fundamental values of securities and

NOTES TO FINANCIAL STATEMENTS (continued) May 31, 2021 (unaudited)
Fairholme Funds, Inc.
31
other investments in the asset class, the attractiveness of investment opportunities within each asset class, general market and economic conditions, and expected future returns of other investment opportunities� The Allocation Fund seeks to capitalize on anticipated fluctuations in the financial markets by changing the mix of its holdings in the targeted asset classes� The Allocation Fund may maintain a significant portion of its assets in cash and cash-equivalent securities and investments� The Manager serves as investment adviser to The Allocation Fund�
There is no guarantee that the Funds will meet their respective objectives�
Note 2. Significant Accounting Policies
As investment companies, the Funds follow the investment company accounting and reporting guidance, which is part of U�S� generally accepted accounting principles (“U�S� GAAP”)� The Funds’ investments are reported at fair value as defined by U�S� GAAP� The Funds calculate their net asset values as soon as practicable following the close of regular trading on the New York Stock Exchange (currently 4:00 p�m� Eastern Time) on each day the New York Stock Exchange is open�
A description of the valuation techniques applied to the Funds’ securities measured at fair value on a recurring basis follows:
Security Valuation: Equity securities (common and preferred stocks): Securities traded on a national securities exchange or reported on the NASDAQ national market are generally valued at the official closing price, or at the last reported sale price on the exchange or market on which the securities are traded, as of the close of business on the day the securities are being valued or, lacking any sales, at the last available bid price� To the extent these securities are actively traded and valuation adjustments are not applied, they are classified in Level 1 of the fair value hierarchy� If these securities are not actively traded, they are classified in Level 2� Subject to the oversight of the Board, the Manager may determine the fair valuation of a security when market quotations are insufficient or not readily available, when securities are determined to be illiquid or restricted, or when in the judgment of the Manager the prices or values available do not represent the fair value of the instrument� In these situations, if the inputs are observable, the valuation will be classified in Level 2 of the fair value hierarchy, otherwise they would be classified in Level 3�
Fixed-income securities (U�S� government obligations, corporate bonds, convertible bonds, and asset backed securities): The fair value of fixed-income securities is determined using market quotations when readily available, but may also be estimated by various methods when no such market quotations exist and when the Manager believes these other methods reflect the fair value of such securities� These methods may consider recently executed transactions in securities of the issuer or comparable issuers and market price valuations from independent pricing services and/or brokers (where observable)� Where the Manager deems it appropriate to do so (such as when independent prices are unavailable or not deemed to be representative of fair value) fixed income securities will be fair valued in good faith following consideration by, and conclusion of, the Manager’s Valuation and Liquidity Risk Management Committee� As of May 31, 2021, fixed-income securities are valued by the Manager utilizing observable market prices on the day of valuation or the average bid of independent broker/dealer quotes and/or the average of valuations from independent pricing services� Although fixed-income securities are classified in Level 2 of the fair value hierarchy at May 31, 2021, in instances where significant unobservable inputs are used, they would be classified in Level 3�
Open-end mutual funds: Investments in open-end mutual funds including money market funds are valued at their closing net asset value each business day and are classified in Level 1 of the fair value hierarchy�
Short-term securities: Investments in securities with maturities of less than sixty days when acquired, or which subsequently are within sixty days of maturity, shall be valued at prices supplied by an independent pricing source or by one of the Funds’ pricing agents based on broker or dealer supplied valuations or matrix pricing� To the extent the inputs are observable and timely, the values would be classified in Level 2 of the fair value hierarchy�
Restricted securities: The Manager is deemed to be an affiliate of The St� Joe Co� (“Joe”) for purposes of the Securities Act of 1933 and Rule 144� This determination was made based on a number of factors, including the collective ownership of Joe by certain of the Funds and other advisory clients advised by the Manager� Shares of Joe owned by The Allocation Fund are considered control securities under Rule 144 and are treated as restricted securities for purposes of The Allocation Fund’s valuation procedures� Due to the restrictions on resale, the securities are generally valued at a discount to similar publicly traded
NOTES TO FINANCIAL STATEMENTS (continued) May 31, 2021 (unaudited)
Fairholme Funds, Inc.
32
securities� Depending on the relative significance of valuation inputs, these instruments may be classified in either Level 2 or Level 3 of the fair value hierarchy� Joe was classified as Level 2 at May 31, 2021�
Warrants: The Funds may invest in warrants, which may be acquired either through a direct purchase, included as part of a private placement, or pursuant to corporate actions� Warrants entitle, but do not obligate, the holder to buy equity securities at a specific price for a specific period of time� Warrants may be considered more speculative than certain other types of investments in that they do not entitle a holder to dividends or voting rights with respect to the underlying securities that may be purchased nor do they represent any rights in the assets of the issuing company� Also, the value of a warrant does not necessarily change with the value of the underlying securities and a warrant ceases to have value if it is not exercised prior to its expiration date� Warrants traded on a security exchange are valued at the official closing price on the valuation date and are classified as Level 1 of the fair value hierarchy� Over the counter (OTC) warrants are valued using simulation models utilizing market value of the underlying security, expiration date of the warrants, volatility of the underlying security, strike price of the warrants, risk-free interest rate at the valuation date, and are classified as Level 2 or Level 3 of the fair value hierarchy depending on the observability of the inputs used�
The Funds use several recognized industry third-party pricing services (TPPS) -approved by the Board and unaffiliated with the Manager -to provide prices for some of the Funds’ securities� The Funds also use other independent market trade data sources (such as TRACE, the FINRA developed mandatory reporting of over-the-counter secondary market transactions), as well as broker quotes provided by market makers� The data within these feeds is ultimately sourced from major stock exchanges and trading systems where these securities trade� If a price obtained from the pricing source is deemed unreliable, it may be discarded and/or challenged� In these cases the pricing decision is made by reference to the reliable market data from the other market data sources�
Subject to the oversight of the Board, the Manager may determine the fair valuation of a security when market quotations are insufficient or not readily available, when securities are determined to be illiquid or restricted, or when in the judgment of the Manager the prices or values available do not represent the fair value of the instrument� Factors which may cause the Manager to make such a judgment include the following: (a) only a bid price or an asked price is available; (b) the spread between bid and asked prices is substantial; (c) the liquidity of the securities; (d) the frequency of sales; (e) the thinness of the market; (f) the size of reported trades; (g) actions of the securities markets, such as the suspension or limitation of trading; and (h) local market closures� Among the factors to be considered to fair value a security are recent prices of comparable securities that are publicly traded, reliable prices of securities not publicly traded, the use of valuation models, current analyst reports, valuing the income or cash flow of the issuer, or cost if the preceding factors do not apply� The circumstances of fair valued securities are frequently monitored to determine if fair valuation measures continue to apply�
The Manager reports quarterly to the Board the results of the application of fair valuation policies and procedures�
The inputs and valuation techniques used to measure fair value of the Funds’ investments are summarized into three levels as described in the hierarchy below:
• Level 1 — quoted prices in active markets for identical securities;
• Level 2 — other significant observable inputs (including quoted prices for similar securities, quoted prices in inactive markets for identical securities, interest rates, prepayment speeds, credit risk, etc�); and
• Level 3 — significant unobservable inputs (including the Manager’s determination as to the fair value of investments)�

NOTES TO FINANCIAL STATEMENTS (continued) May 31, 2021 (unaudited)
Fairholme Funds, Inc.
33
The inputs or methodology used for valuing investments are not necessarily an indication of the level of risk associated with investing in those investments� The summary of the Funds’ investments by inputs used to value the Funds’ investments as of May 31, 2021, is as follows:
Valuation Inputs
Level 1 - Quoted Prices
Level 2 - Other Significant Observable
Inputs
Level 3 - Significant Observable
Inputs
Total Fair Value at 05/31/21
THE FAIRHOLME FUND ASSETS:INVESTMENTS (Fair Value):Domestic Equity Securities* $ 1,007,389,507 $ — $ — $ 1,007,389,507 Foreign Equity Securities* 27,951,829 — — 27,951,829 Domestic Preferred Equity Securities* 110,042,849 — — 110,042,849 Rights* 339,496 — — 339,496 Domestic Corporate Bonds* — 979,922 — 979,922 U�S� Government Obligations — 257,961,213 — 257,961,213 Money Market Funds 33,971,777 — — 33,971,777
TOTAL INVESTMENTS $ 1,179,695,458 $ 258,941,135 $ — $ 1,438,636,593
* Industry classification for these categories are detailed in the Schedule of Investments�
Valuation Inputs
Level 1 - Quoted Prices
Level 2 - Other Significant Observable
Inputs
Level 3 - Significant Observable
Inputs
Total Fair Value at 05/31/21
THE INCOME FUND ASSETS:INVESTMENTS (Fair Value):Domestic Equity Securities* $ 34,593,350 $ — $ — $ 34,593,350 Foreign Equity Securities* 7,134,340 — — 7,134,340 Domestic Preferred Equity Securities* 7,172,607 — — 7,172,607 U�S� Government Obligations — 61,984,291 — 61,984,291 Money Market Funds 11,470,535 — — 11,470,535 Miscellaneous Investments 4,793,833 — — 4,793,833
TOTAL INVESTMENTS $ 65,164,665 $ 61,984,291 $ — $ 127,148,956
* Industry classification for these categories are detailed in the Schedule of Investments�
Valuation Inputs
Level 1 - Quoted Prices
Level 2 - Other Significant Observable
Inputs
Level 3 - Significant Observable
Inputs
Total Fair Value at 05/31/21
THE ALLOCATION FUND ASSETS:INVESTMENTS (Fair Value):Domestic Equity Securities
Real Estate Management & Development $ — $ 15,874,010 $ — $ 15,874,010 Other Industries* 10,930,987 — — 10,930,987
Foreign Equity Securities* 12,395,240 — — 12,395,240
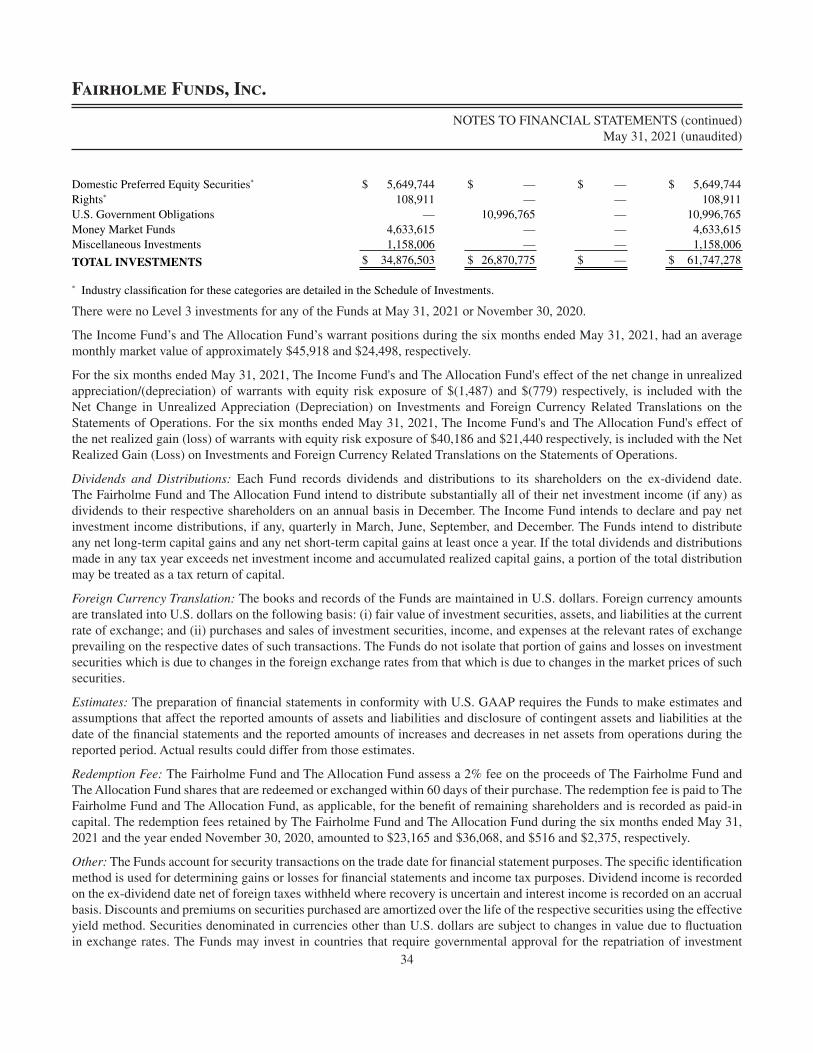
NOTES TO FINANCIAL STATEMENTS (continued) May 31, 2021 (unaudited)
Fairholme Funds, Inc.
34
Domestic Preferred Equity Securities* $ 5,649,744 $ — $ — $ 5,649,744 Rights* 108,911 — — 108,911 U�S� Government Obligations — 10,996,765 — 10,996,765 Money Market Funds 4,633,615 — — 4,633,615 Miscellaneous Investments 1,158,006 — — 1,158,006
TOTAL INVESTMENTS $ 34,876,503 $ 26,870,775 $ — $ 61,747,278
* Industry classification for these categories are detailed in the Schedule of Investments�
There were no Level 3 investments for any of the Funds at May 31, 2021 or November 30, 2020�
The Income Fund’s and The Allocation Fund’s warrant positions during the six months ended May 31, 2021, had an average monthly market value of approximately $45,918 and $24,498, respectively�
For the six months ended May 31, 2021, The Income Fund's and The Allocation Fund's effect of the net change in unrealized appreciation/(depreciation) of warrants with equity risk exposure of $(1,487) and $(779) respectively, is included with the Net Change in Unrealized Appreciation (Depreciation) on Investments and Foreign Currency Related Translations on the Statements of Operations� For the six months ended May 31, 2021, The Income Fund's and The Allocation Fund's effect of the net realized gain (loss) of warrants with equity risk exposure of $40,186 and $21,440 respectively, is included with the Net Realized Gain (Loss) on Investments and Foreign Currency Related Translations on the Statements of Operations�
Dividends and Distributions: Each Fund records dividends and distributions to its shareholders on the ex-dividend date� The Fairholme Fund and The Allocation Fund intend to distribute substantially all of their net investment income (if any) as dividends to their respective shareholders on an annual basis in December� The Income Fund intends to declare and pay net investment income distributions, if any, quarterly in March, June, September, and December� The Funds intend to distribute any net long-term capital gains and any net short-term capital gains at least once a year� If the total dividends and distributions made in any tax year exceeds net investment income and accumulated realized capital gains, a portion of the total distribution may be treated as a tax return of capital�
Foreign Currency Translation: The books and records of the Funds are maintained in U�S� dollars� Foreign currency amounts are translated into U�S� dollars on the following basis: (i) fair value of investment securities, assets, and liabilities at the current rate of exchange; and (ii) purchases and sales of investment securities, income, and expenses at the relevant rates of exchange prevailing on the respective dates of such transactions� The Funds do not isolate that portion of gains and losses on investment securities which is due to changes in the foreign exchange rates from that which is due to changes in the market prices of such securities�
Estimates: The preparation of financial statements in conformity with U�S� GAAP requires the Funds to make estimates and assumptions that affect the reported amounts of assets and liabilities and disclosure of contingent assets and liabilities at the date of the financial statements and the reported amounts of increases and decreases in net assets from operations during the reported period� Actual results could differ from those estimates�
Redemption Fee: The Fairholme Fund and The Allocation Fund assess a 2% fee on the proceeds of The Fairholme Fund and The Allocation Fund shares that are redeemed or exchanged within 60 days of their purchase� The redemption fee is paid to The Fairholme Fund and The Allocation Fund, as applicable, for the benefit of remaining shareholders and is recorded as paid-in capital� The redemption fees retained by The Fairholme Fund and The Allocation Fund during the six months ended May 31, 2021 and the year ended November 30, 2020, amounted to $23,165 and $36,068, and $516 and $2,375, respectively�
Other: The Funds account for security transactions on the trade date for financial statement purposes� The specific identification method is used for determining gains or losses for financial statements and income tax purposes� Dividend income is recorded on the ex-dividend date net of foreign taxes withheld where recovery is uncertain and interest income is recorded on an accrual basis� Discounts and premiums on securities purchased are amortized over the life of the respective securities using the effective yield method� Securities denominated in currencies other than U�S� dollars are subject to changes in value due to fluctuation in exchange rates� The Funds may invest in countries that require governmental approval for the repatriation of investment

NOTES TO FINANCIAL STATEMENTS (continued) May 31, 2021 (unaudited)
Fairholme Funds, Inc.
35
income, capital, or the proceeds of sales of securities by foreign investors� In addition, if there is deterioration in a country’s balance of payments or for other reasons, a country may impose temporary restrictions on foreign capital remittances abroad�
The Funds paid commissions and other brokerage fees during the period� The Funds also paid legal expenses in connection with certain of their investments�
Note 3. Related Party Transactions
The Manager is a Delaware limited liability company and is registered with the SEC as an investment adviser� The Manager’s principal business is to provide investment management and advisory services to individuals, corporations, and other institutions throughout the world� Pursuant to an Investment Management Agreement, each Fund pays a management fee to the Manager for its provision of investment advisory and operating services to the Fund� Subject to applicable waivers or limitations, the management fee is paid at an annual rate equal to 1�00% of the daily average net assets of each Fund� Effective January 1, 2018, the Manager has agreed to waive, on a voluntary basis, a portion of the management fees of The Fairholme Fund, The Income Fund, and The Allocation Fund to the extent necessary to limit the management fee of each Fund to the annual rate of 0�80% of that Fund’s daily average net asset value (“Undertaking”)� This Undertaking may be terminated by the Manager upon 60 days’ written notice to the applicable Fund� The Manager is responsible pursuant to the Investment Management Agreement for paying each Fund’s expenses for the following services: transfer agency, fund accounting, fund administration, custody, legal, audit, compliance, directors’ fees, call center, fulfillment, travel, insurance, rent, printing, postage and other office supplies� The Manager is not responsible for paying for the following costs and expenses of each Fund: commissions, brokerage fees, issue and transfer taxes, and other costs chargeable to the Fund in connection with securities transactions or in connection with securities owned by each Fund, taxes, interest, acquired fund fees and related expenses, expenses in connection with litigation by or against each Fund, and any other extraordinary expenses�
The Manager earned, after the voluntary reduction of the management fees, $5,760,717, $475,326, and $242,411, from The Fairholme Fund, The Income Fund, and The Allocation Fund, respectively, for its services during the six months ended May 31, 2021�
Bruce Berkowitz, both the Chief Investment Officer of the Manager and Chairman of the Funds’ Board, and his affiliates beneficially own an aggregate 13,317,942 shares, 3,534,818 shares, and 4,387,159 shares of The Fairholme Fund, The Income Fund, and The Allocation Fund, respectively, at May 31, 2021�
A Director and Officers of the Funds are also Officers of the Manager or its affiliates�
Note 4. Investments
For the six months ended May 31, 2021, aggregated purchases and sales of investment securities other than short-term investments and U�S� government obligations were as follows:
Purchases SalesThe Fairholme Fund $ 2,909,400 $ 75,255,380 The Income Fund 32,847,637 47,576,162 The Allocation Fund 8,649,345 19,871,719
Note 5. Tax Matters
Federal Income Taxes: Each Fund intends to qualify each year as a “regulated investment company” under Subchapter M of the Internal Revenue Code of 1986, as amended� By so qualifying, each Fund will not be subject to federal income taxes to the extent that it distributes all of its net investment income and any realized capital gains�

NOTES TO FINANCIAL STATEMENTS (continued) May 31, 2021 (unaudited)
Fairholme Funds, Inc.
36
For U�S� federal income tax purposes, the cost of securities owned, gross unrealized appreciation, gross unrealized depreciation, and net unrealized appreciation/(depreciation) of investments at May 31, 2021, were as follows:
Cost
Gross Unrealized
Appreciation
Gross Unrealized
Depreciation
Net Unrealized Appreciation/(Depreciation)
The Fairholme Fund $1,100,335,808 $472,613,199 $(134,312,414) $1,438,636,593
The Income Fund 116,292,028 12,636,661 (1,779,733) 127,148,956
The Allocation Fund 68,812,147 15,157,285 (17,222,154) 61,747,278
The difference between book basis and tax basis for The Fairholme Fund’s net unrealized depreciation is attributable to the tax deferral of losses on wash sales and capitalized cost� The difference between book basis and tax basis for The Income Fund’s and The Allocation Fund’s net unrealized depreciation is attributable to capitalized cost�
The Funds’ tax basis capital gains are determined only at the end of each fiscal year� Therefore the components of distributable earnings will be included in the Annual report for the fiscal year ended November 30, 2021�
The Funds are permitted to carry forward for an unlimited period capital losses incurred to reduce future required distributions of net capital gains to shareholders� Capital losses that are carried forward will retain their character as either short-term or long-term capital losses� As of November 30, 2020, net short-term and long-term capital loss carryforwards were as follows:
The Fairholme Fund
The Income Fund
The Allocation Fund
Short-term capital loss carryforward $1,018,777 $6,039,587 $1,477,623
Long-term capital loss carryforward 746,810,368 5,997,328 47,926,139
Total $747,829,145 $12,036,915 $49,403,762
The Manager has analyzed the Funds’ tax positions taken on tax returns for all open tax years (current and prior three tax years) and has concluded that there are no uncertain tax positions that require recognition of a tax liability� The Funds’ federal and state income and federal excise tax returns for tax years for which the applicable statutes of limitations have not expired (the current year and prior three years) are subject to examination by the Internal Revenue Service and state departments of revenue� Additionally, the Funds are not aware of any tax position for which it is reasonably possible that the total amounts of unrecognized tax benefits will change materially in the next twelve months�
Note 6. Dividends and Distributions to Shareholders
Ordinary income and capital gain distributions are determined in accordance with federal income tax regulations, which may differ from U�S� GAAP�
The tax character of dividends and distributions paid by each Fund were as follows:
The Fairholme Fund
For the Six Months
Ended May 31, 2021
For the Fiscal Year
Ended November 30,
2020Dividends and Distributions paid from:
Ordinary Income — $ 9,053,098
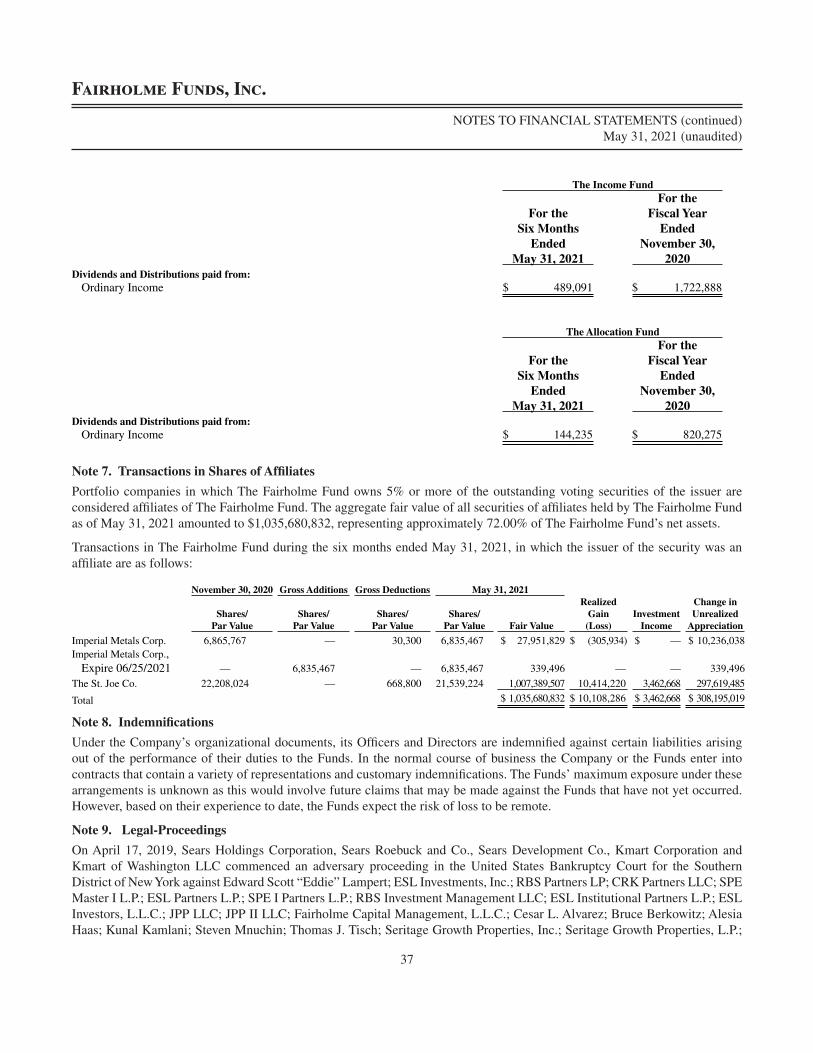
NOTES TO FINANCIAL STATEMENTS (continued) May 31, 2021 (unaudited)
Fairholme Funds, Inc.
37
The Income Fund
For the Six Months
Ended May 31, 2021
For the Fiscal Year
Ended November 30,
2020Dividends and Distributions paid from:
Ordinary Income $ 489,091 $ 1,722,888
The Allocation Fund
For the Six Months
Ended May 31, 2021
For the Fiscal Year
Ended November 30,
2020Dividends and Distributions paid from:
Ordinary Income $ 144,235 $ 820,275
Note 7. Transactions in Shares of Affiliates
Portfolio companies in which The Fairholme Fund owns 5% or more of the outstanding voting securities of the issuer are considered affiliates of The Fairholme Fund� The aggregate fair value of all securities of affiliates held by The Fairholme Fund as of May 31, 2021 amounted to $1,035,680,832, representing approximately 72�00% of The Fairholme Fund’s net assets�
Transactions in The Fairholme Fund during the six months ended May 31, 2021, in which the issuer of the security was an affiliate are as follows:
November 30, 2020 Gross Additions Gross Deductions May 31, 2021
Shares/ Par Value
Shares/ Par Value
Shares/ Par Value
Shares/ Par Value Fair Value
Realized Gain (Loss)
Investment Income
Change in Unrealized
Appreciation
Imperial Metals Corp� 6,865,767 — 30,300 6,835,467 $ 27,951,829 $ (305,934 ) $ — $ 10,236,038 Imperial Metals Corp�,
Expire 06/25/2021 — 6,835,467 — 6,835,467 339,496 — — 339,496
The St� Joe Co� 22,208,024 — 668,800 21,539,224 1,007,389,507 10,414,220 3,462,668 297,619,485
Total $ 1,035,680,832 $ 10,108,286 $ 3,462,668 $ 308,195,019
Note 8. Indemnifications
Under the Company’s organizational documents, its Officers and Directors are indemnified against certain liabilities arising out of the performance of their duties to the Funds� In the normal course of business the Company or the Funds enter into contracts that contain a variety of representations and customary indemnifications� The Funds’ maximum exposure under these arrangements is unknown as this would involve future claims that may be made against the Funds that have not yet occurred� However, based on their experience to date, the Funds expect the risk of loss to be remote�
Note 9. Legal-Proceedings
On April 17, 2019, Sears Holdings Corporation, Sears Roebuck and Co�, Sears Development Co�, Kmart Corporation and Kmart of Washington LLC commenced an adversary proceeding in the United States Bankruptcy Court for the Southern District of New York against Edward Scott “Eddie” Lampert; ESL Investments, Inc�; RBS Partners LP; CRK Partners LLC; SPE Master I L�P�; ESL Partners L�P�; SPE I Partners L�P�; RBS Investment Management LLC; ESL Institutional Partners L�P�; ESL Investors, L�L�C�; JPP LLC; JPP II LLC; Fairholme Capital Management, L�L�C�; Cesar L� Alvarez; Bruce Berkowitz; Alesia Haas; Kunal Kamlani; Steven Mnuchin; Thomas J� Tisch; Seritage Growth Properties, Inc�; Seritage Growth Properties, L�P�;

NOTES TO FINANCIAL STATEMENTS (continued) May 31, 2021 (unaudited)
Fairholme Funds, Inc.
38
Seritage KMT Mezzanine Finance LLC; Seritage SRC Mezzanine Finance LLC; Seritage KMT Finance LLC; Seritage SRC Finance LLC; Seritage GS Holdings LLC; Seritage SPS Holdings LLC; and Seritage MS Holdings LLC (the “First Action”)� On November 25, 2019, the plaintiffs filed an amended complaint, adding the Company and other parties not affiliated with the Manager or the Company as additional defendants and asserting new causes of action against the defendants�
Plaintiffs assert avoidance and other claims against certain defendants, including the Manager, for participation in two Sears corporate transactions: (i) the Lands’ End spinoff; and (ii) the Seritage rights offering� The avoidance claims against the Manager include claims for the avoidance of consideration received by The Fairholme Fund and The Allocation Fund from Sears Holdings Corp� in connection with the Lands’ End spinoff and Seritage rights offering that were allegedly actual and/or constructive fraudulent transfers� In the amended complaint, plaintiffs also assert avoidance and other claims seeking to recover amounts allegedly received by the Company from alleged related-party transactions with Sears and seek to avoid the release received by certain of the defendants, including the Manager and the Company, in connection with the Seritage derivative action� Plaintiffs also assert claims for breach of fiduciary duty and aiding and abetting breach of fiduciary duty arising out of certain related-party transactions against certain defendants, including the Manager and Bruce Berkowitz, and seek to subordinate the bankruptcy claims of the Company, the Manager and Bruce Berkowitz�
On February 21, 2020, the Company moved to dismiss all of the claims against it, and all other defendants, including the Manager and Bruce Berkowitz, moved to dismiss all or parts of the compliant against them� The Court held extensive oral argument on the motions to dismiss, which are currently pending before the Court�
On October 15, 2020, Sears Holdings Corp�, Sears, Roebuck and Co�, and The Official Committee of Unsecured Creditors of Sears Holdings Corporation, et al commenced a second adversary proceeding in the United States Bankruptcy Court for the Southern District of New York against certain former shareholders of Sears Holdings Corporation that were not named in the First Action (the “Second Action”)� In the Second Action, the plaintiffs assert claims for the avoidance of alleged consideration received in connection with the Lands’ End spinoff and the Seritage rights offering� Certain defendants in the Second Action have moved to dismiss all claims against them, and the motions to dismiss are currently pending before the Court� On March 15, 2021, the Court consolidated the Second Action into the First Action�
Although the Manager and the Company believe that they have strong defenses to the foregoing complaint and intend to defend themselves vigorously against the allegations in the complaint, neither the Manager nor the Company is in a position to express an opinion about the ultimate outcome of the litigation or the range of potential loss, if any�
Note 10. Subsequent Events
Management has evaluated the impact on the Funds of all subsequent events occurring through the date the financial statements were issued and has determined that there were no subsequent events requiring recognition or disclosure in the financial statements�

ADDITIONAL INFORMATION May 31, 2021 (unaudited)
Fairholme Funds, Inc.
39
Operation and Effectiveness of the Funds’ Liquidity Risk Management Program (unaudited)
Pursuant to Rule 22e-4 under the Investment Company Act of 1940, each of the Funds has adopted and implemented a liquidity risk management program (the “Program”) designed to assess and manage the risk that the Fund could not meet requests to redeem Fund shares without significant dilution of remaining investors’ interests in the Fund� In assessing, managing and reviewing liquidity risk under the Program, the Funds consider a variety of factors, including their investment strategies, portfolio investments, portfolio concentration, cash flow projections, redemption policy and redemption history� In addition, the Program requires each Fund to, among other things, classify its investments into specific liquidity categories and monitor compliance with its limit on illiquid investments� During the one-year period ended November 30, 2020 (the “Covered Period”), each Fund maintained a high level of liquidity and primarily held assets that were “highly liquid investments” (defined as cash and any investment reasonably expected to be convertible to cash in current market conditions in three business days or less without the conversion to cash significantly changing the market value of the investment)� During the Covered Period, there were no liquidity events that materially affected a Fund’s performance or ability to timely meet redemptions without dilution to remaining investors’ interests in the Fund� The Manager, which the Board has designated to administer the Program, prepared a written report that addressed the operation of the Program and assessed the Program’s adequacy and effectiveness of implementation during the Covered Period (the “Report”)� The Board reviewed and accepted the Report, which determined that the Program operated adequately and effectively in managing the liquidity risk of each Fund during the Covered Period� Proxy Voting Policies, Procedures and Records (unaudited)
The Company has adopted policies and procedures that provide guidance and set forth parameters for the voting of proxies relating to securities held in each Fund’s portfolio� A description of these policies and procedures, and records of how each Fund voted proxies relating to its portfolio securities during the most recent twelve month period ended June 30, 2020, are available to you upon request and free of charge by writing to the Fairholme Funds, Inc�, c/o BNY Mellon Investment Servicing (US) Inc�, P�O� Box 9692, Providence, RI, 02940 or by calling Shareholder Services at (866) 202-2263� They may also be obtained by visiting the SEC website at www�sec�gov� The Company shall respond to all shareholder requests for records within three business days of its receipt of such request by first-class mail or other means designed to ensure prompt delivery�
Quarterly Filing (unaudited)
The Company files a complete schedule of the Funds’ portfolio holdings on Form N-PORT for the fiscal quarters ending February 28 (February 29 during leap year) and August 31� The Forms N-PORT are available on the SEC’s website at www�sec�gov�

This page is not part of the Fairholme Funds, Inc. 20 Semi-Annual Report

This page is not part of the Fairholme Funds, Inc. 20 Semi-Annual Report

FAIRHOLME FUNDS
Officers of Fairholme Funds, Inc.BRUCE R. BERKOWITZPresident
FERNANDO M. FONTVice President
WAYNE KELLNERTreasurer
ERICA K. KAPAHIChief Compliance Officer & Secretary
Board of Directors of Fairholme Funds, Inc.TERRY L. BAXTER
BRUCE R. BERKOWITZ
STEVEN J. GILBERT, Esq.
LEIGH WALTERS, Esq.
Investment ManagerFAIRHOLME CAPITAL MANAGEMENT, L.L.C.2601 NE 2nd Avenue, Miami, FL 33137
Transfer AgentBNY MELLON INVESTMENT SERVICING (US) INC.4400 Computer Drive, Westborough, MA 01581-1722
Fund Accountant & AdministratorTHE BANK OF NEW YORK MELLON103 Bellevue Parkway, Wilmington, DE 19809
CustodianTHE BANK OF NEW YORK MELLON240 Greenwich Street, New York, NY 10286
Independent Registered Public Accounting FirmDELOITTE & TOUCHE LLP200 Berkeley Street, Boston, MA 02116
Legal CounselSEWARD & KISSEL LLP901 K Street NW, Washington, DC 20001
THIS REPORT IS PROVIDED FOR THE GENERAL INFORMATION OF THE SHAREHOLDERS OF FAIRHOLME FUNDS, INC. IT IS NOT INTENDED FOR DISTRIBUTION TO PROSPECTIVE INVESTORS IN THE FUNDS UNLESS PRECEDED OR ACCOMPANIED BY AN EFFECTIVE PROSPECTUS, WHICH CONTAINS MORE INFORMATION ON FEES, CHARGES AND OTHER EXPENSES AND SHOULD BE READ CAREFULLY BEFORE INVESTING OR SENDING MONEY. PAST PERFORMANCE IS NOT A GUARANTEE OF FUTURE RESULTS. SHARES OF THE FUNDS ARE DISTRIBUTED BY FORESIDE FUNDS DISTRIBUTORS LLC.