Embed Size (px)
Citation preview
FAKULTAT FUR INFORMATIKDER TECHNISCHEN UNIVERSITAT MUNCHEN
Master’s Thesis in Informatik
User Distraction through interaction with awall-sized display
Alexander Plopski
FAKULTAT FUR INFORMATIKDER TECHNISCHEN UNIVERSITAT MUNCHEN
Master’s Thesis in Informatik
User Distraction through interaction with a wall-sizeddisplay
Ablenkung des Benutzers durch Interaktion mit einemWand-grossem Display
Author: Alexander PlopskiSupervisor: Prof. Dr. Gudrun KlinkerAdvisor: M.Sc.-Inf Frieder Pankratz
Dr. Kiyoshi KiyokawaDate: May 14, 2012

I assure the single handed composition of this master’s thesis only supported by declaredresources.
Munchen, den 14. Mai 2012 Alexander Plopski
Acknowledgments
I would like to thank Prof. Haruo Takemura and Dr. Kiyoshi Kiyokawa for their sup-port before my arrial in Japan and during the whole course of this thesis. I am gratefulas well for the opportunity to conduct my research at their lab at the Osaka University.I am indebted to M.Sc.-Inf. Frieder Pankratz for his moral support during my prepara-tion and project development. He always supported my progress and I would not haveachieved these results without his suggestions and criticism. I am as well grateful to M.Sc.-Inf. Nicholas Katkazis for criticizing my ideas and goals, constantly pushing me towardshigher aims and goals while pointing out weaknesses in my thought process. Last but notleast I would like to thank Dr. Christian Nitschke for being my anchor in Japan, motivatingme whenever I felt low and never letting me lose my spirit.
iv
Abstract
Wall-sized displays are conquering their place in the everyday applications in officesand command and control centers. They benefit from the capability to display more infor-mation and promote collaboration and exploration better than common single and doublemonitor setups. The development of suitable interaction techniques is lagging behind, be-cause standards, e.g. mouse and keyboard for a desktop PC, are yet to be defined. Withadvancement in spatial recognition and reconstruction the research is shifting from simplepointing to spatial interaction. Researchers try to determine the best suitable interactiontechniques for different tasks on such a screen. A technique must not only perform fast,but allow the user to perform tasks efficient by not requiring the user to focus completelyand solely on the interaction. In this thesis we observe the applicability of different tech-niques for the drag and scale interaction on a huge display under the aspects of speed andattention requirements. We designed a test which allowed us to observe such application.Through a test series with ten participants we determined which techniques are best suitedfor this task. We discuss the emerging errors under the aspect of the repetition and missingand offer an explanation of possible causes of these.
v
Zusammenfassung
Wand-große Bildschirme erobern ihren Platz an den Arbeitsplatzen und Kontrollzentrenin aller Welt. Im Gegensatz zu normalen ein und zwei Monitor Systemen ermoglichendiese eine deutlich großerere Menge an Daten gleichzeitig darzustellen und fordern dieZusammenarbeit und Erkundung des Datensatzes. Die Entwicklung erfolgreicher Inter-aktionstechniken hinkt dieser Entwicklung hinterher, insofern dass noch kein Standart,wie die Maus und Tastatur an gewohnlichen Systemen, festgelegt worden ist. DurchFortschritt der dreidimensionalen Erkennungs- und Rekonstrukstionssysteme konzentri-ert sich die Forschung zusehendst vom Zeigen auf dreidimensionale Interaktion mit demMonitor. Forscher versuchen die am besten geeigneten Techniken fur die einzelnen Auf-gaben zu entwickeln. Diese mussen nicht nur schnell ausfuhrbar sein, sondern es demAnwender auch erlauben die Aufgaben effizient auszufuhren, indem sie nicht die gesamteAufmerksamkeit auf sich ziehen. In dieser Arbeit untersuchen wir die Anwendbarkeitvon funf verschiedenen Techniken zum Skallieren und Verschieben von Objekten. Dabeiachten wir nicht nur auf die Geschwindigkeit sondern auch die Ablenkung des Benutzers.Wir entwickelten einen Test der es uns erlaubte dies zu beobachten. Eine Testserie mit zehnProbanten erlaubte es uns die am besten geeigneten Techniken herauszufinden. Desweit-eren werden die auftretenden Fehler unter dem Gesichtspunkt der Wiederholungs- undVersaumungsfehler sowie die moglichen Ursachen diskutiert.
vi
Contents
Acknowledgements iv
Abstract v
I. Introduction and Theory 1
1. Introduction 21.1. Chapter Outline . . . . . . . . . . . . . . . . . . . . . . . . . . . . . . . . . . . 3
2. Related Work 42.1. Large Displays . . . . . . . . . . . . . . . . . . . . . . . . . . . . . . . . . . . . 42.2. Spatial Input . . . . . . . . . . . . . . . . . . . . . . . . . . . . . . . . . . . . . 52.3. Attention Distribution . . . . . . . . . . . . . . . . . . . . . . . . . . . . . . . 6
3. Experiment Design 73.1. Tracking Volume and Interaction tracking . . . . . . . . . . . . . . . . . . . . 73.2. User Interaction Techniques . . . . . . . . . . . . . . . . . . . . . . . . . . . . 8
3.2.1. 2D Interaction . . . . . . . . . . . . . . . . . . . . . . . . . . . . . . . . 83.2.2. Device Interaction . . . . . . . . . . . . . . . . . . . . . . . . . . . . . 93.2.3. Posture Interaction . . . . . . . . . . . . . . . . . . . . . . . . . . . . . 93.2.4. Two-Hand Interaction . . . . . . . . . . . . . . . . . . . . . . . . . . . 103.2.5. Head Interaction . . . . . . . . . . . . . . . . . . . . . . . . . . . . . . 10
3.3. Mathematical Calculations . . . . . . . . . . . . . . . . . . . . . . . . . . . . . 113.3.1. Pointing Location . . . . . . . . . . . . . . . . . . . . . . . . . . . . . . 113.3.2. Posture Detection . . . . . . . . . . . . . . . . . . . . . . . . . . . . . . 123.3.3. Homography . . . . . . . . . . . . . . . . . . . . . . . . . . . . . . . . 123.3.4. Singular Value Decomposition . . . . . . . . . . . . . . . . . . . . . . 14
3.4. User Interface . . . . . . . . . . . . . . . . . . . . . . . . . . . . . . . . . . . . 15
II. Experiment Setup and Evaluation 18
4. Implementation 194.1. Location and desired interaction processing . . . . . . . . . . . . . . . . . . . 194.2. User Interface . . . . . . . . . . . . . . . . . . . . . . . . . . . . . . . . . . . . 20
5. Experiments 215.1. Preparation . . . . . . . . . . . . . . . . . . . . . . . . . . . . . . . . . . . . . 21
vii

Contents
5.2. Evaluation . . . . . . . . . . . . . . . . . . . . . . . . . . . . . . . . . . . . . . 225.2.1. Execution Time . . . . . . . . . . . . . . . . . . . . . . . . . . . . . . . 235.2.2. Game Performance . . . . . . . . . . . . . . . . . . . . . . . . . . . . . 26
5.3. User Questionary . . . . . . . . . . . . . . . . . . . . . . . . . . . . . . . . . . 30
6. Summary and Outlook 34
Appendix 36
Bibliography 37
viii
Part I.
Introduction and Theory
1
1. Introduction
When computers were first developed the only communication method were punch cardsand users had to learn to interpret the output as well as the code to input the calcula-tions. With the introduction of displays and the development of personal computers thisinteraction turned into typing the tasks and reading the system response from the display.Further development led to new input devices which reduced the stress of input and out-put. These new devices, such as mouse or the recent development of touchdisplays, led tonew interaction techniques (such as click and drag) and user interfaces. This developmentwent along with the development of new display devices. These include previously men-tioned touchdisplays, high quality - low cost projector displays and high quality - highcost multidisplay wall-sized displays. All of these have their justification and applicationsat the beginning of the 22nd century. Current research in Computer Vision and more easilyaccessable high-quality reconstruction[19] and segmentation techniques[14] allow furtherdevelopment of interaction techniques and ubiquitous computing. The combination ofsuch tracking and wall-sized displays allows for better cooperative surroundings and theuse of natural motion to interact with the display. A multitude of interaction techniquesbased on Computer Vision recognition was developed (e.g. [38]). Other techniques focuson transfering interaction with well-known objets onto the screen (e.g. [36]). It has yet tobe shown which interaction technique is favorable in general or wether or not multiple in-teraction techniques will be feasible, but some may perform better for specific tasks. Thisdevelopment aims to remove the consciousness of computers from our workplace.
Given the ease of access and the constantly reducing cost of pixels paired with the ben-efits of wall-sized monitors we believe that these will become more and more used in oureveryday life. An experiment of an outdoor application was conducted by Yahoo in SanFrancisco. In movies and futuristic advertisements is the use of this technology everydaypresent. But to be viable the interaction with the display must be fast, easy to learn, allowinteraction over a long period of time and we must be able to focus on other things andnot only on the interaction itself. On a small display for example we can focus on readinga text but still comprehend and interact with other programs through fast glimses due toshort distance. On a bigger display on the other hand we most likely will have to turn ourhead or walk a wide distance with our eyes to observe the results of our interaction.
In this thesis we observe the attention requirements of multiple techniques for interac-tion with 2D objects on a wall-sized display. This interaction will involve dragging andscaling of these objects. The goal of this research is to provide developers with a com-parison of different currently developed and used techniques based on their distractionfrom a time consuming task. This research was conducted at Prof.Takemura’s laboratoryat the Osaka University and was part of the exchange between the TU Munich and OsakaUniversity.
2

1. Introduction
1.1. Chapter Outline
Our research contributes to multiple areas of Human-Computer-Interaction. In chapter 2we will outline current research in these areas, namely large displays, spatial input andattention distribution. We will focus on the theoretical design of our research in chapter 3.This chapter will explain our spatial tracking setup, the mathematical calculations neces-sary to compute the interaction location and the interaction task. Finally it will include thedesign of the user interface. The implementation will be described in chapter 4.1. We willexplain the execution of our experiment in section 5.1 and evaluate the results in section5.2. In the evaluation we will focus on the execution time, the error rates and the user ques-tionary. Finally we will summarize our results and give an outlook on further research inchapter 6.
3
2. Related Work
In this thesis we focus on a subject which conjugates with multiple research areas of Hu-man Computer Interaction (HCI), primarily large displays, spatial input and attention dis-tribution.
2.1. Large Displays
Over the past years multiple approaches to create large-scale displays through combina-tion and alignment of smaller displays have been introduced and observed. This researchwas strongly supported by the industry as well as the military. Multiple qualitative andquantitative experiments were conducted and have shown that the productivity and per-formance changes based on change in the visual effects. Ni et. al. [23] performed anin-depth studies of current development of large-scale display setups and outlined threebasic devices which could be used to create such setups. Most people currently use multi-ple monitor setups, mostly double-monitor setups, at home and at work. This basic setupof two monitors can be extended to create a wall or a room of screens. Similarly LCDpanels can be used to create such a wall. These are easy to setup designs but they sufferfrom bezel issues and are more expensive then the other approach. That is an alignmentof projectors which benefit from having no bezel issues to cover and the disproportion-ality of device and screen size. A small projector can create a big screen. On the otherhand projector alignment requires additional calibration algorithms to align the illumina-tion and projection location of the devices, for example such as described in [25, 18]. Suchsetups allow furthermore not just the use of a standart wall-type displays but allow cre-ation of immersive rooms, such as the CAVE or rounded displays. This requires a lot ofcomputational power especially if the interaction is coupled with spatial input techniques.Therefore the usual approach is to use computer clusters to manage the computationalworkload.
With the continuous development of the aforementioned technologies the number ofpixels achievable in such a wall is steadily increasing and the biggest wall up to todaycontains more than 200 million pixels. In the past studies on applicability of such mon-itors were conducted and Baudish et. al [8] found that they were better for informationextraction from huge data sets compared to overview and zooming on a common dis-play. In another study [10] Bi and Balakrishnan compared wall-sized screens to single anddual-monitor setups. They found out that the users prefered the huge display over theircommon workspace. They furthermore observed that users divided the screen into a cen-tral area, which acted as the area of focus and the surrounding peripheral region. Overallthe users were more inclined to drag and rescale windows on a wall-sized screen whilethey would rather minimize and maximize windows on smaller configurations. Of courseresearch does not focus only on comparisons with other display devices. While at first a
4
2. Related Work
lot of focus was devoted to the task of pointing to the screen recently the focus shifted to-wards improvement of certain interactions and general usability of large-scale dispalys. In[7] Badusch et.al. observed the effects of a dense mouse pointer rather than a normal one.They found out that the dense mouse enabled the users to better track their current loca-tion thus reducing the time required to travel the screen. In [6] Badush et.al. introducedanother method for drag-and-drop interaction which they expected to perform better onlarge screens.
The ability of these displays to promote and enhance cooperative work and the abilityto display and process huge amounts of information at a single screen has been recog-nized by military and industry. Now they are used in military, airspace or communicationCommand and Control Centers all over the world. Two examples of such application arethe Interactive DataWall in the US Air Force Research Facility and Command and ControlCenter of AT&T.
2.2. Spatial Input
The bigger size of a wall-sized display inclines that standart interaction techniques, such asmouse and keyboard, are hard to transfer and sometimes not applicable at all. Increaseduse of touch displays for notebooks, personal computers, touch tables and for the latestgeneration of mobile phones, commonly known as smartphones, got the users accostu-mated to touching objects for selection and use of natural movements for interaction. Thisapproach is rarely applicable when used with a wall-sized display. The disadvantage isevident. Due to the large size of the display the user would have to traverse a great dis-tance to move an object on the screen and would be unable to observe the scene as a whole.Thus in this study we focused on techniques which enable interaction with a screen from adistance. Furthermore to enhace collaboration and reduce restrictions as much as possiblewe focused on techniques which could be used from different locations. Over the pastyears multiple techniques for the desired interaction have been developed and evaluated.
Jota et. al. [17] observed three different interaction metaphors with a screen from adistance. Whilst they expected that the different metaphors (grab, point, mouse) wouldperform best at a distance best suited for the respective metaphor they surprisingly foundout that the pointing metaphor performed best in all tests.
As was stated before, classic interaction methods with big screens are often hardly, ifat all, applicable to wall-sized screen interaction. Current research ranges from using alllimbs for interaction, for example foot control by Scott et.al. [29] or Augsten et.al. [5],detecting muscle contractions to triger interaction, Saponas et.al. [27], multidimensionalinput devices, e.g. soap [9], all the way to use of light sources to enable interaction throughshadows and touch, Shoemaker et.al. [30]. Other techniques use a device to emulate thescreen and let the user interact with it. Examples of that are the HIPerPaper by Weibelet.al. [36] or the table-screen interaction by Malik et.al. [20].
Currently most applications use raycasting to determine the location of interaction. Thesource of these rays may be the eyes, hands or pointing devices. Eyetriggered interactionhas been studied for years, for example by Zhai in [39], Turner in [32] and Stellmach in[31]. But it suffers from being not very precise and requiring additional interaction devices.Attempts to apply purely gaze based interaction require the user to either use a delay as
5
2. Related Work
an interaction trigger or blink. Both approaches are hardly usable in an actual application.
2.3. Attention Distribution
It is general consensus that users have to devote their focus to interaction and lose focusof whatever task they were working on at that moment. This loss of attention can lead totwo types of mistakes, a repetition mistake, where the user performs a recently finishedtask once again, and a miss mistake. The second type of possible mistakes can lead tograve results. In the past several accidents occured because workers were disturbed duringa safety check and skipped a test. In most cases researchers do not evaluate the focusrequired for the interaction. We suspect that it is assumed that the time required for aninteraction is proportional to the focus required to perform it, but that must not necessarilybe the case. A technnique which performs slower may allow the user to multitask while afast technique requires the user to fully focus to perform it.
Rogers et.al. [26] and Valk [33] have shown that a mismatched input device will re-duce the performance. Other researchers [37, 28] have suggested that this mismatch doesincrease the attention requirements. McLaughlin et.al. [21] observed that the amount of at-tention did increase whenever a device was used for the input and it increased even furtherif the input device was mismatched to the task. Other studies [12, 35] have suggested thatindirect input methods will require more attention than direct input. Indirect input meansin this context that the user uses a device, for example a mouse. This method involvescognitive conversion of a small traversed distance with the device to a large traversion onthe screen. Direct input does not require such conversion and could be touch screens, lightpens or speech. These studies have shown that the amount of attention required for aninteraction does scale with the age of the participants.
In another study Bragdon et. al. [11] evaluated the users ability to interact with a mobiledevice while performing different real-world tasks. Their goal was to determine the bestway to interact with a mobile device. They found out that the performance speed of someinteraction techniques did not wary significantly, even when a user had to perform anattention-saturating task. On the other hand the performance of the attention-saturatingtask dropped when the user performed concurrent tasks.
6
3. Experiment Design
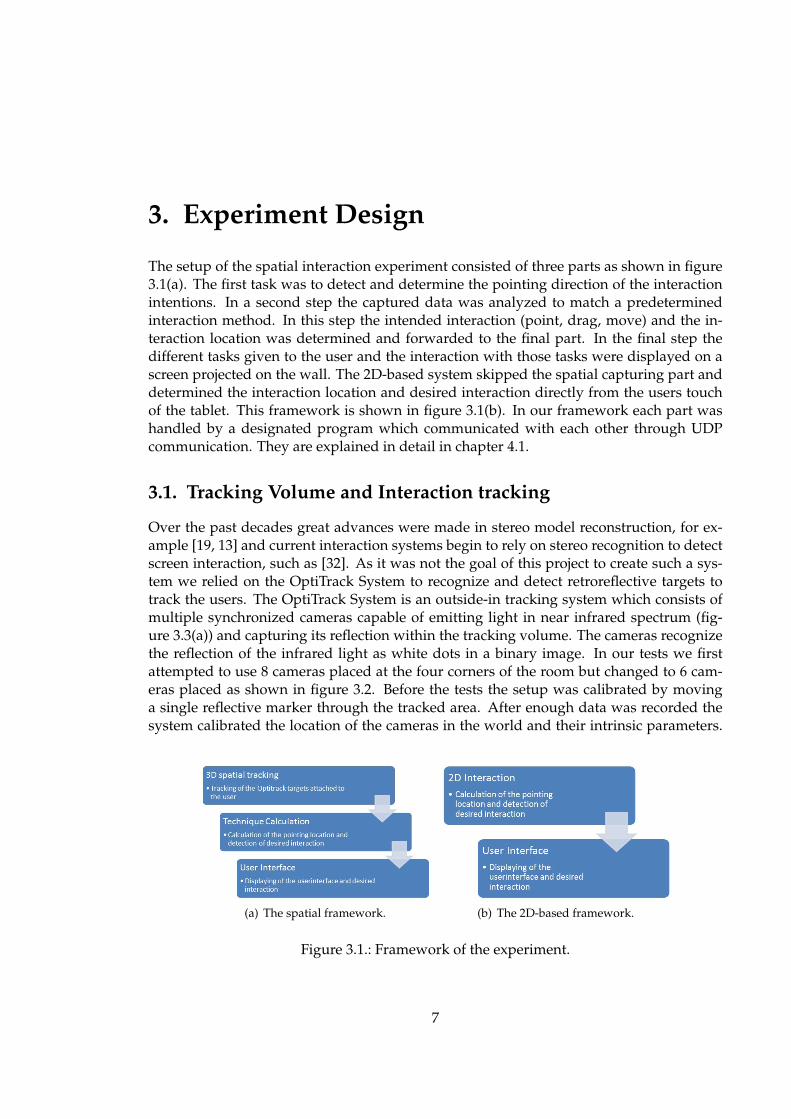
The setup of the spatial interaction experiment consisted of three parts as shown in figure3.1(a). The first task was to detect and determine the pointing direction of the interactionintentions. In a second step the captured data was analyzed to match a predeterminedinteraction method. In this step the intended interaction (point, drag, move) and the in-teraction location was determined and forwarded to the final part. In the final step thedifferent tasks given to the user and the interaction with those tasks were displayed on ascreen projected on the wall. The 2D-based system skipped the spatial capturing part anddetermined the interaction location and desired interaction directly from the users touchof the tablet. This framework is shown in figure 3.1(b). In our framework each part washandled by a designated program which communicated with each other through UDPcommunication. They are explained in detail in chapter 4.1.
3.1. Tracking Volume and Interaction tracking
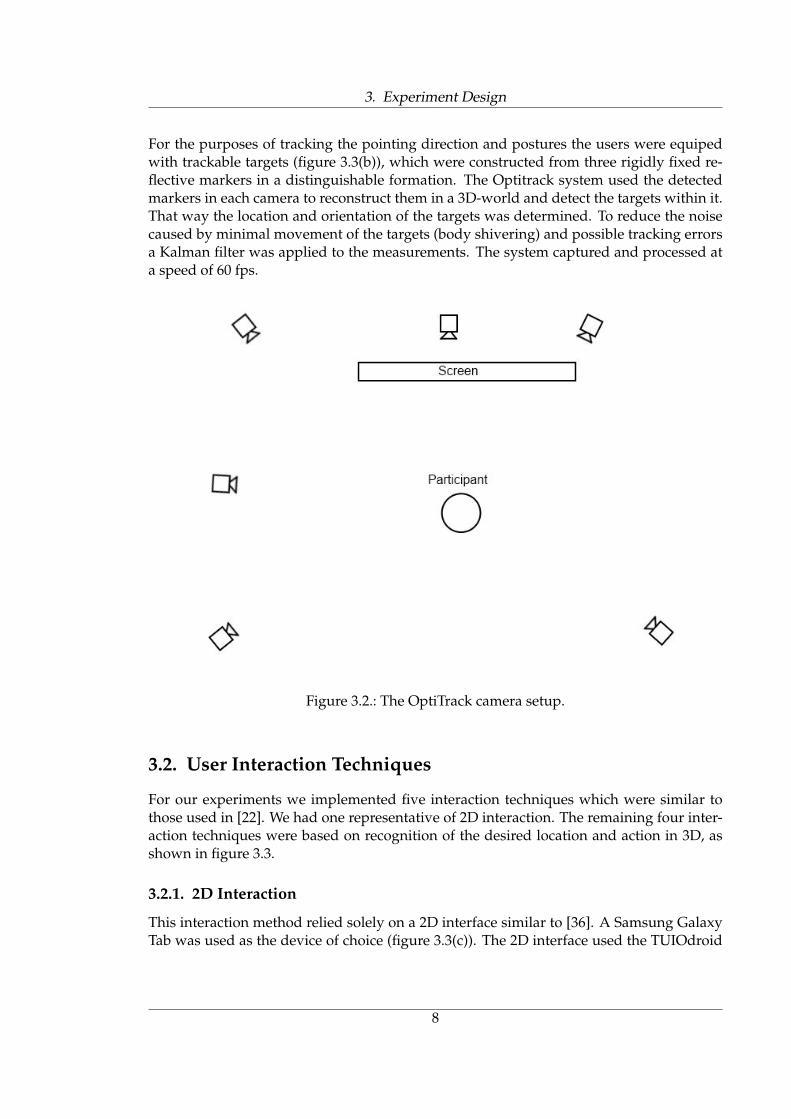
Over the past decades great advances were made in stereo model reconstruction, for ex-ample [19, 13] and current interaction systems begin to rely on stereo recognition to detectscreen interaction, such as [32]. As it was not the goal of this project to create such a sys-tem we relied on the OptiTrack System to recognize and detect retroreflective targets totrack the users. The OptiTrack System is an outside-in tracking system which consists ofmultiple synchronized cameras capable of emitting light in near infrared spectrum (fig-ure 3.3(a)) and capturing its reflection within the tracking volume. The cameras recognizethe reflection of the infrared light as white dots in a binary image. In our tests we firstattempted to use 8 cameras placed at the four corners of the room but changed to 6 cam-eras placed as shown in figure 3.2. Before the tests the setup was calibrated by movinga single reflective marker through the tracked area. After enough data was recorded thesystem calibrated the location of the cameras in the world and their intrinsic parameters.
(a) The spatial framework. (b) The 2D-based framework.
Figure 3.1.: Framework of the experiment.
7
3. Experiment Design
For the purposes of tracking the pointing direction and postures the users were equipedwith trackable targets (figure 3.3(b)), which were constructed from three rigidly fixed re-flective markers in a distinguishable formation. The Optitrack system used the detectedmarkers in each camera to reconstruct them in a 3D-world and detect the targets within it.That way the location and orientation of the targets was determined. To reduce the noisecaused by minimal movement of the targets (body shivering) and possible tracking errorsa Kalman filter was applied to the measurements. The system captured and processed ata speed of 60 fps.
Figure 3.2.: The OptiTrack camera setup.
3.2. User Interaction Techniques
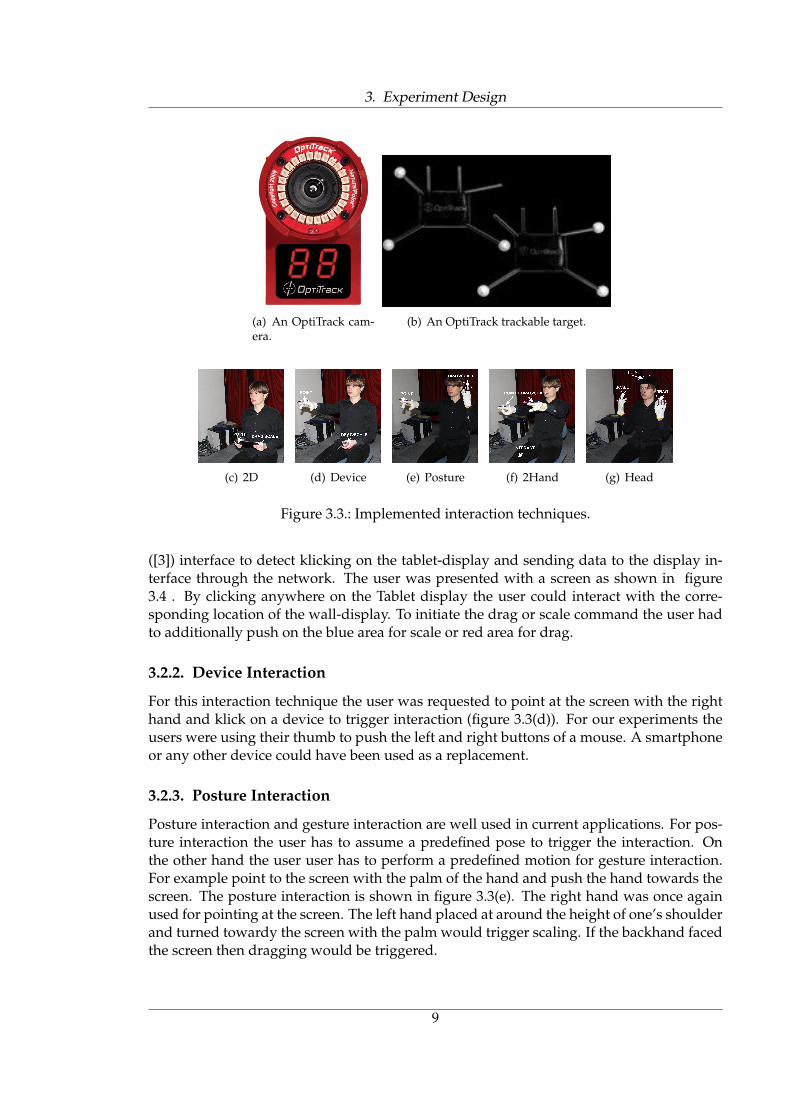
For our experiments we implemented five interaction techniques which were similar tothose used in [22]. We had one representative of 2D interaction. The remaining four inter-action techniques were based on recognition of the desired location and action in 3D, asshown in figure 3.3.
3.2.1. 2D Interaction
This interaction method relied solely on a 2D interface similar to [36]. A Samsung GalaxyTab was used as the device of choice (figure 3.3(c)). The 2D interface used the TUIOdroid
8
3. Experiment Design
(a) An OptiTrack cam-era.
(b) An OptiTrack trackable target.
(c) 2D (d) Device (e) Posture (f) 2Hand (g) Head
Figure 3.3.: Implemented interaction techniques.
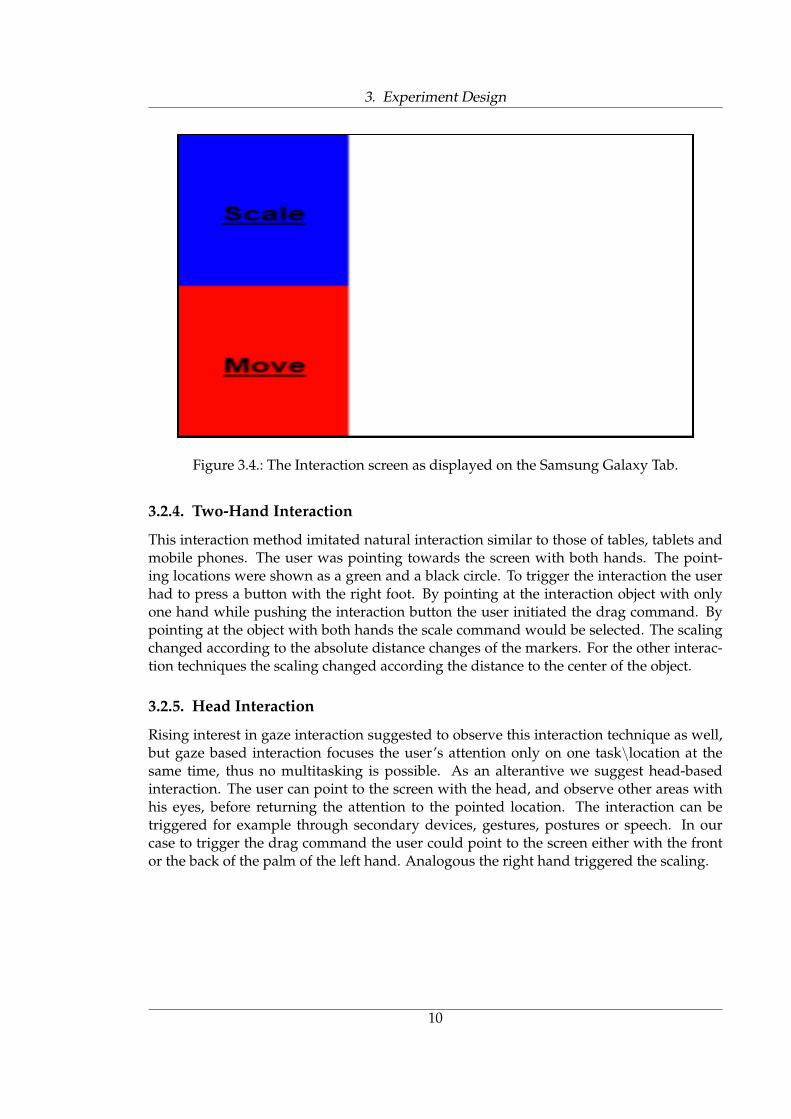
([3]) interface to detect klicking on the tablet-display and sending data to the display in-terface through the network. The user was presented with a screen as shown in figure3.4 . By clicking anywhere on the Tablet display the user could interact with the corre-sponding location of the wall-display. To initiate the drag or scale command the user hadto additionally push on the blue area for scale or red area for drag.
3.2.2. Device Interaction
For this interaction technique the user was requested to point at the screen with the righthand and klick on a device to trigger interaction (figure 3.3(d)). For our experiments theusers were using their thumb to push the left and right buttons of a mouse. A smartphoneor any other device could have been used as a replacement.
3.2.3. Posture Interaction
Posture interaction and gesture interaction are well used in current applications. For pos-ture interaction the user has to assume a predefined pose to trigger the interaction. Onthe other hand the user user has to perform a predefined motion for gesture interaction.For example point to the screen with the palm of the hand and push the hand towards thescreen. The posture interaction is shown in figure 3.3(e). The right hand was once againused for pointing at the screen. The left hand placed at around the height of one’s shoulderand turned towardy the screen with the palm would trigger scaling. If the backhand facedthe screen then dragging would be triggered.
9
3. Experiment Design
Figure 3.4.: The Interaction screen as displayed on the Samsung Galaxy Tab.
3.2.4. Two-Hand Interaction
This interaction method imitated natural interaction similar to those of tables, tablets andmobile phones. The user was pointing towards the screen with both hands. The point-ing locations were shown as a green and a black circle. To trigger the interaction the userhad to press a button with the right foot. By pointing at the interaction object with onlyone hand while pushing the interaction button the user initiated the drag command. Bypointing at the object with both hands the scale command would be selected. The scalingchanged according to the absolute distance changes of the markers. For the other interac-tion techniques the scaling changed according the distance to the center of the object.
3.2.5. Head Interaction
Rising interest in gaze interaction suggested to observe this interaction technique as well,but gaze based interaction focuses the user’s attention only on one task\location at thesame time, thus no multitasking is possible. As an alterantive we suggest head-basedinteraction. The user can point to the screen with the head, and observe other areas withhis eyes, before returning the attention to the pointed location. The interaction can betriggered for example through secondary devices, gestures, postures or speech. In ourcase to trigger the drag command the user could point to the screen either with the frontor the back of the palm of the left hand. Analogous the right hand triggered the scaling.
10
3. Experiment Design
3.3. Mathematical Calculations
To simplify the calculations we set up the world in such a way that the screen was orthog-onal to the Z-Axis. Before the users interactes with the screen the location of the corers wascalcuated by pointing at them from a three meter distance. The location and orientationdata received from the optitrack system was averaged. the location was given as a point
Pr =
�pxpypz
�
where pi represents the translation along the axis i.The orientation data was given as a quartenion.Given a quaternion qi with
qi = qx, qy, qz, qw,
qx,qy,qz) represents the axis around which the object will be rotated and qw representsthe angle α , with α = 2 ∗ cos−1(qw).
This angle reresentation can be transformed into a matrix form M where
M =
�q2x − q2y − q2z + q2w 2 ∗ (qx ∗ qy − qz ∗ qw) 2 ∗ (qx ∗ qz + qy ∗ qw)
2 ∗ (qx ∗ qy + qz ∗ qw) q2y − q2x − q2z + q2w 2 ∗ (qy ∗ qz − qx ∗ qw)2 ∗ (qy ∗ qz + qx ∗ qw) 2 ∗ (qx ∗ qz − qy ∗ qw) q2z − q2x − q2y + q2w
�.
3.3.1. Pointing Location
The pointing rays were casted along the Z-axis. Given the normalization factor
N =ÈM2
13 +M223 +M2
33
where Mij represents the entry of the matrix M in row i and column j this ray can beformulated as
Rz =
�M13N
M23N
M33N
�.
The screen plane was represented by the normal vector
V =
�001
�(3.1)
and a point
Pw =
�003
�
11
3. Experiment Design
which was located in the same plane as the wall.The interaction point PI of the ray Rz with the wall can be calculated through equation
3.2.
t =V (Pw − Pr)
V Rz
PI = Pr + tRz (3.2)
After the corners of the screen were calculated the homography H, which transformedtheir location to match the pixel coordinates of the display, was determined as explainedin chapter 3.3.3. During the tests the point PI , the intersection of the pointing ray and thescreen, was multiplied by H, as shown in equation 3.3. P2D represents the pixel coordinatesof the pointing location.
P2D = HPI (3.3)
3.3.2. Posture Detection
The desired postures were detected whenever the user was holding the hand above a pre-defined threshold. In this case the user had to point to the screen with the palm, thus theobserved ray was along the Y-axis of the tracking target.
Given the normalization factor
N =ÈM2
12 +M222 +M2
33
the observed ray Ry was described as
Ry =
�M12N
M22N
M32N
�.
To determine wether the user triggered an interaction or not the angle α between V(equation 3.1), the normal of the screen, and Ry was calculated by equation 3.4.
α = arccos(Ry ∗ V ). (3.4)
After transforming α into degree space we observed whether it fits within the definedthresholds. The desired interaction (drag, scale, point) was sent to the interface if the userwas pointing within the screen.
3.3.3. Homography
The following calculations are explained in detail in [16].
Direct Linear Transformation
The Direct Linear Transformation(DLT) algorithm allows to calculate the homography oftwo given point clouds P1 and P2, which contain at least four corresponding point p1,i ↔
12
3. Experiment Design
p2,i. The points are given in homogeneous coordinates, that means that a point (x,y) isdisplayed as
p =
�xy1
�.
The relationship of p1,i ↔ p2,i can be expressed by equation 3.3. But H ∗ p1,i must notnecessarily be equal to p2,i, the result may be scaled. This means that both vectors, p2,i andHp1,i point in the same direction. To better denote this relation the equation can be writtenas
p2,i ×Hp1,i = 0. (3.5)
The homography matrix is a 3 × 3 matrix. Given that hjT denotes the j-th row of Hequation 3.3 can be written as
HPI =
�h1TPI
h2TPI
h3TPI
�. (3.6)
Through equation 3.6, equation 3.5 can be transformed into
p2,i ×Hp1,i =
�y2,ih
3T p1,i − h2T p1,ih1T p1,i − x2,ih3p1,i
y1,ih2T p1,i − y2,ih1T p1,i
�= 0. (3.7)
Since hjT p1,i = pT1,ihj one can extract hj to create a single matrix multiplication 3.9,
where
0 =
�000
�(3.8)
and ‖h‖ = 1.
Aih =
�0T −pT1,i y2,ip
T1,i
pT1,i 0T −x2,ipT1,i−y2,ipT1,i x2,ip
T1,i 0T
��h1
h2
h3
�= 0 (3.9)
The matrix A is a 3 x 9 matrix and h is a 9-vector which can be trasformed into the matrixH. The third row of the matrix Ai can be omitted because it can be obtained up to a scalefrom a sum of x2,i times the first row and y2,i times the second row of Ai. As the matrix Hhas 8 degrees of freedom (it is up to a scale of H3,3) at least 8 equations are needed in thematrix A. This is achieved by combining the matrices Ai, i = 1,...,n, into a single 2n x 9 (3nx 9, if the third row is kept) matrix A. Thus at least four points are necessary. The resultingequation can be solved through a SVD-Decomposition (chapter 3.3.4) of the matrix A, with
UDV T = A. (3.10)
U and D are orthogonal and V a diagonal matrix. The last column of the matrix V equalsthe vector h. After transforming h into H and rescaling it, so that H3,3 = 1, H could be usedin equation 3.3. But this calculation of H suffers from the quadratic pixel coordinates in
13
3. Experiment Design
the matrix A, thus the values have different weights onto the calculation. To solve this, anadditional step is necessary.
Normalized Direct Linear Transformation
The normalized DLT algorithm extends the previously explained DLT algorithm by defin-ing
H = T ′−1HT. (3.11)
T’ is a transformation of the points P2 and T a transformation of the points P1 where
P ′2 = T ′P2 (3.12)P ′1 = TP1, (3.13)
thusP2 = T ′−1HTP1. (3.14)
The matrices T’ and T will remove random scaling and improve the final results. Inthe following the calculation of matrix T will be explained, the matrix T’ is calculatedanalogous.
The matrix T is a 3× 3 matrix which can be decomposed into a scaling component S andtranslation component t, as shown in equation 3.15.
T =
�S t
0 0 1
�(3.15)
t is the negative centroid of all points within P1. After translating all points by t thecentroid is (0,0,1) thus the center of the X-Y coordinate system. To account for scaling the xand y coordinates of the translated points are scaled uniformly by the factor s so that theiraverage distance from the center is
√2, therefor the average point would be (1,1,1)T . This
results in the matrix
T =
�s 0 tx0 s ty0 0 1
�(3.16)
After the matrices T and T’ have been determined the basic DLT algorithm is used tocalculate the matrix H. Finally the matrx H can be abtained through the equation 3.11.
3.3.4. Singular Value Decomposition
The Sibgle Value Decomposition (SVD) is used primarily to derive the solution of over-determined systems of equations. The SVD decomposes a given matrix A into three ma-trices U, D and V so that UDV T = A holds. The matrices U and V are orthogonal andthe matrix D is a diagonal matrix with non-negative values. This decomposition can beachieved so that the entries of D are in descending order. This version of the decomposi-tion is mainly used.
14
3. Experiment Design
Given a m × n matrix A, where m ≥ n, then U will be an m × n matrix withorthogonalcolumns, D is an n× n diagonal matrix and V is an n× n orthogonal matrix. The matrix Uhas the following properties
• UTU = In×n,
• ‖Ux‖ = ‖x‖,
• UUT 6= I , unless m = n.
The matrix D contains the singular values of the matrix A. These are the square rootsof the eigenalues of ATA while the columns of the matrix V are the eigenvectors of ATA.From the definition A = UDV T and the fact that V is orthogonal and therefor V T =V −1 follows that ATA = V DUTUDV T = V D2V T = V D2V −1. This is the definitionof the eigenvalues. Therefor D2 contains the eigenalues and the columns of V are theeigenvectors.
The exact calculations required to compute the SVD are explained in detail in [15] andan implementation can be found in [24]. The code for the implementation is available at[1].
3.4. User Interface
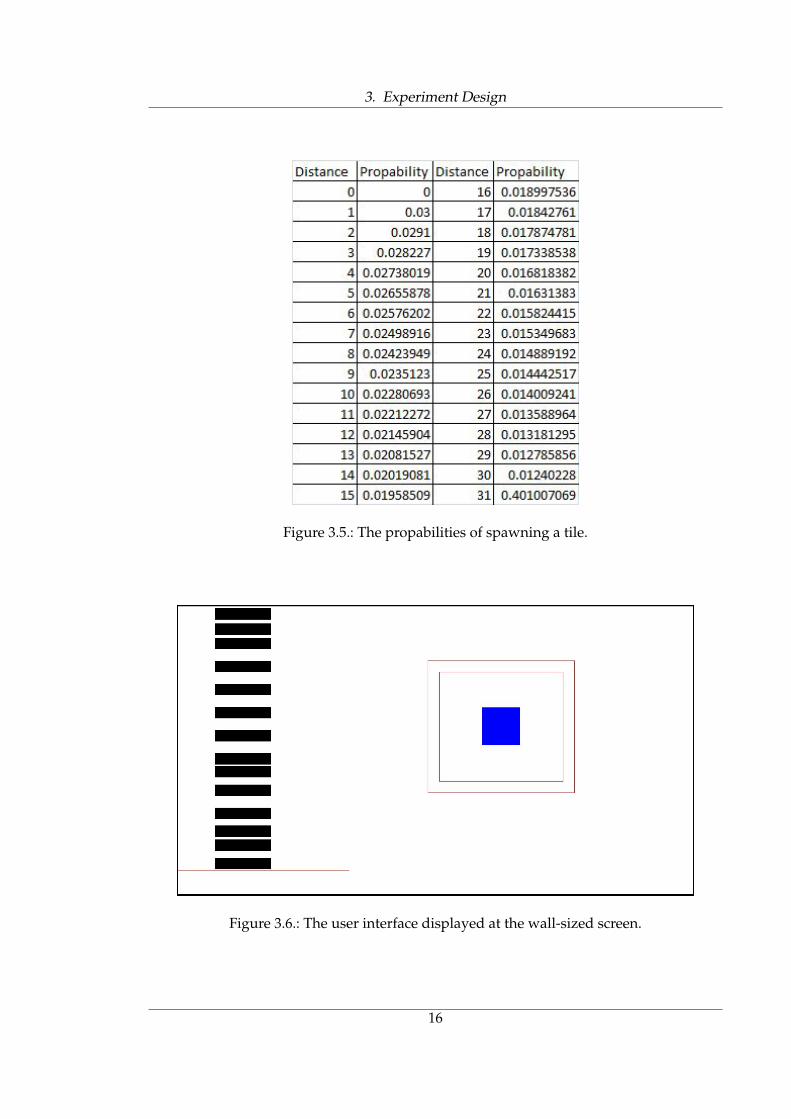
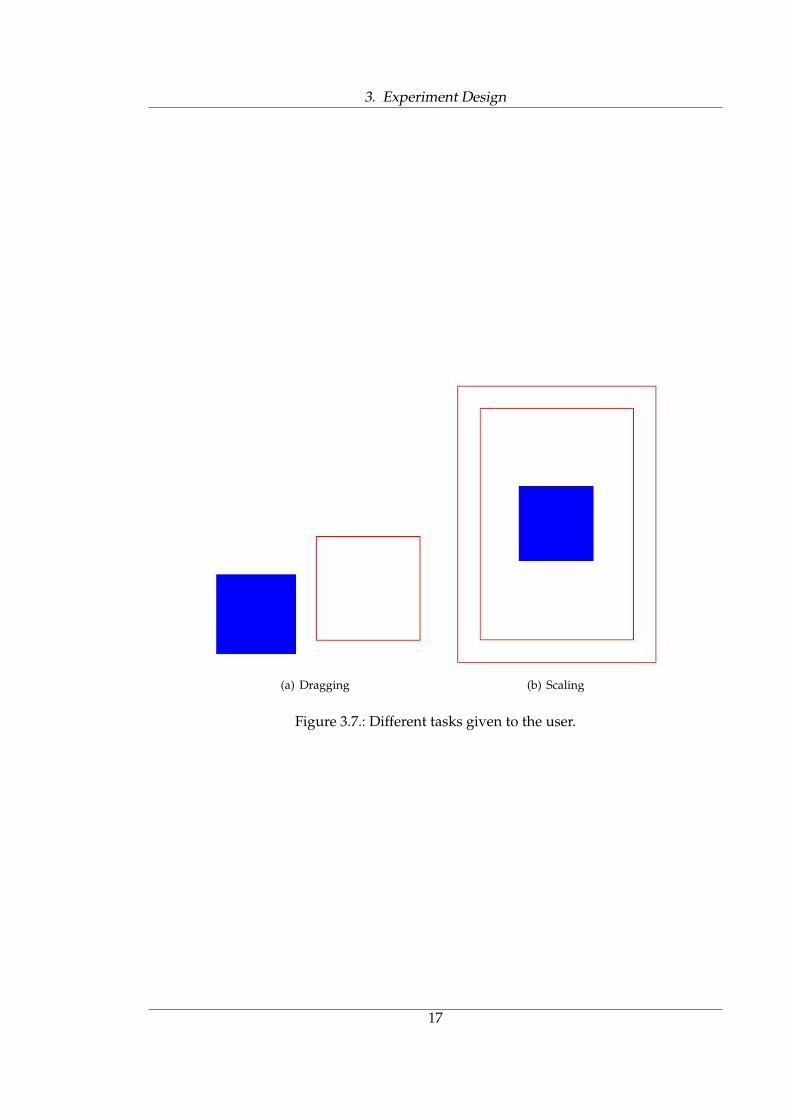
The user-interface was designed in Java and is shown in figure 3.6. The screen was dividedinto a game and a task area. The game area is displayed on the left side of the screen.The users were asked to participate in a game resembling GuitarHero and devote all theirattention to it. The tiles could spawn at a uniform or a random distance. Given randomspawning of tiles the propability to spawn a new tile was constantly at 3% for each screenupdate cycle. The distance ranged between 1 and 31 pixels (the system would defenitelyspawn a new tile at 31 pixels distance). The propabilities to spawn a tile for each distanceare shown in figure3.5. Thus the expected distance between two tiles is 20,367 pixels. Wehad three levels of delays between each update cycle (20ms, 15ms and 10ms), thus threedifferent speeds for the tiles (slow, intermediate and fast). By pressing the ”Ctrl”-buttonwith the left foot the user could remove a tile when it reached the red line.
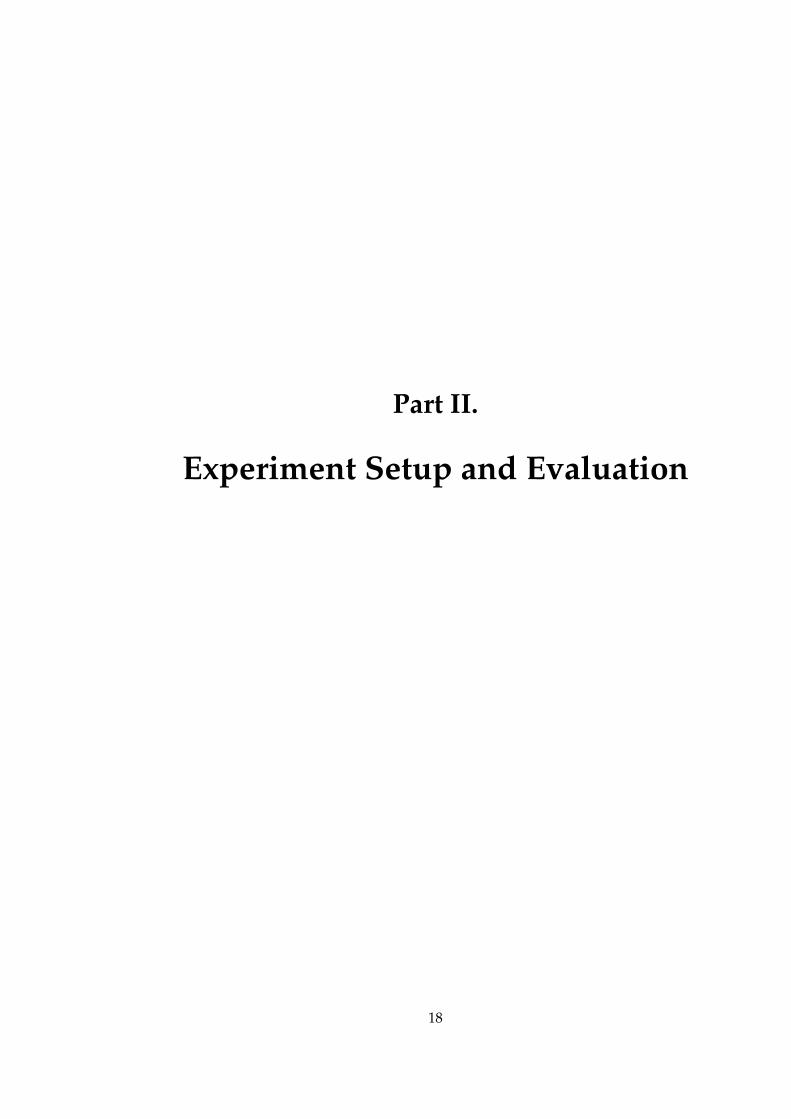
On the right hand side the user was asked to complete several tasks. In the task-areathe user was given two different types of tasks. In figure 3.7 the possible tasks are shownas they were seen by the user. A drag-task given to the user is displayed in figure 3.7(a).During the drag task it was not required to scale the target. If the users accidentiallyscaled the target they had to rescale it to a similar size. The second task, as displayed infigure 3.7(b), requested the user to scale the target and fit it inbetween of the displayed redrectangles. During this task it was not required to drag the target. For the dragging taskthe starting location and the goal location were randomly assigned within the right 2
3rd ofthe screen. On the other hand the starting location was fixed to be at a random locationaround the center of the screen for the scaling task. The scaling task required the user toscale the target to a random size of at most 1
3rd of the screen. To ensure that the user faced asimilar amount of scaling and dragging tasks the first task was selected with a propabilityof 50%. After that the propability shifted by 10% towards the other task and so on.
15
3. Experiment Design
Figure 3.5.: The propabilities of spawning a tile.
Figure 3.6.: The user interface displayed at the wall-sized screen.
16
3. Experiment Design
(a) Dragging (b) Scaling
Figure 3.7.: Different tasks given to the user.
17
Part II.
Experiment Setup and Evaluation
18
4. Implementation
4.1. Location and desired interaction processing
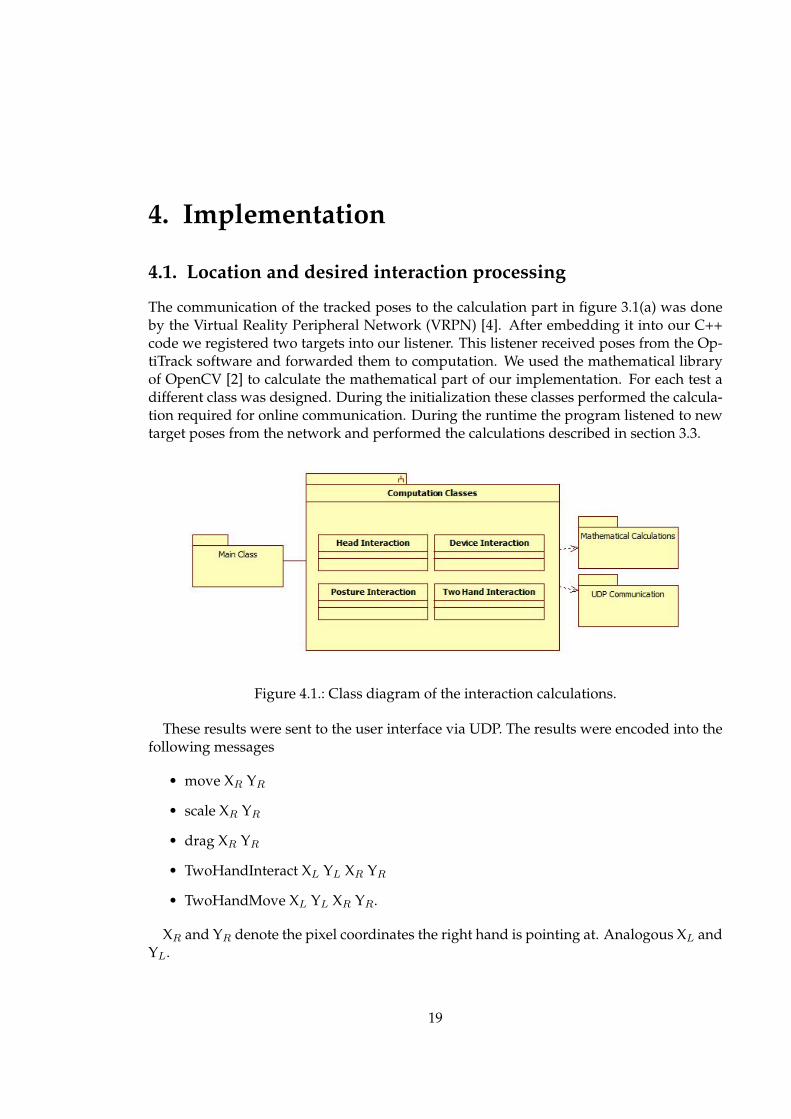
The communication of the tracked poses to the calculation part in figure 3.1(a) was doneby the Virtual Reality Peripheral Network (VRPN) [4]. After embedding it into our C++code we registered two targets into our listener. This listener received poses from the Op-tiTrack software and forwarded them to computation. We used the mathematical libraryof OpenCV [2] to calculate the mathematical part of our implementation. For each test adifferent class was designed. During the initialization these classes performed the calcula-tion required for online communication. During the runtime the program listened to newtarget poses from the network and performed the calculations described in section 3.3.
Figure 4.1.: Class diagram of the interaction calculations.
These results were sent to the user interface via UDP. The results were encoded into thefollowing messages
• move XR YR
• scale XR YR
• drag XR YR
• TwoHandInteract XL YL XR YR
• TwoHandMove XL YL XR YR.
XR and YR denote the pixel coordinates the right hand is pointing at. Analogous XL andYL.
19
4. Implementation
4.2. User Interface
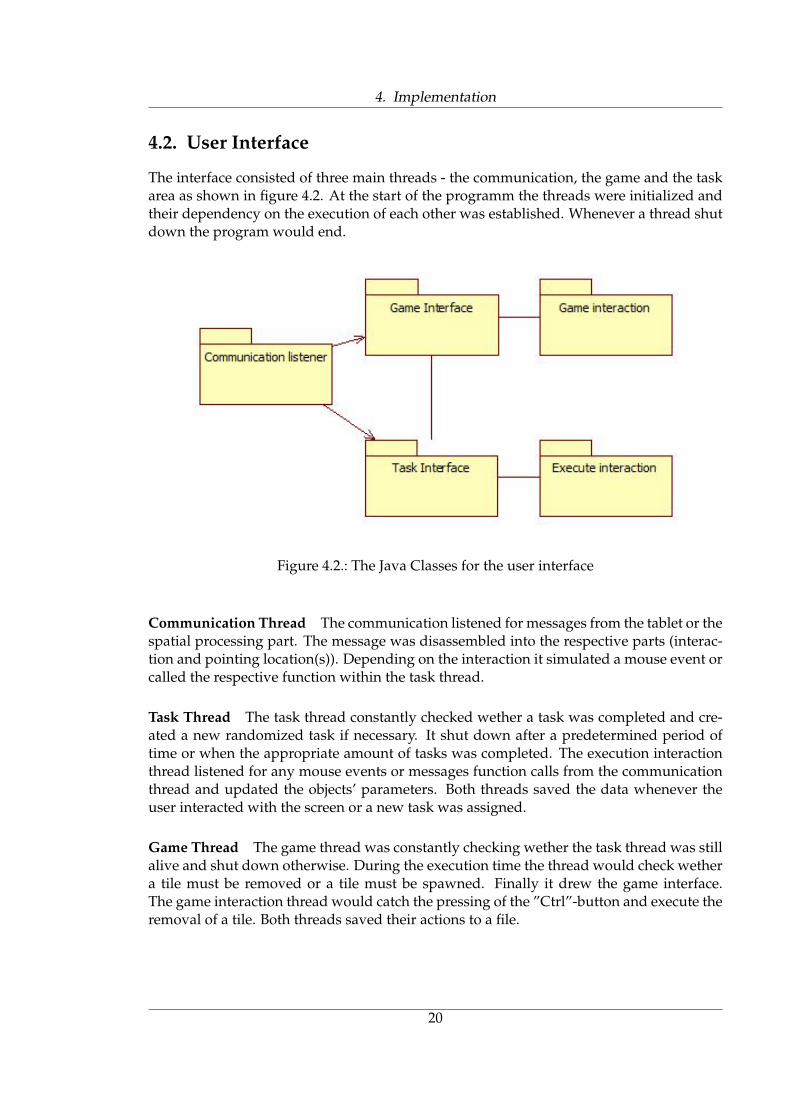
The interface consisted of three main threads - the communication, the game and the taskarea as shown in figure 4.2. At the start of the programm the threads were initialized andtheir dependency on the execution of each other was established. Whenever a thread shutdown the program would end.
Figure 4.2.: The Java Classes for the user interface
Communication Thread The communication listened for messages from the tablet or thespatial processing part. The message was disassembled into the respective parts (interac-tion and pointing location(s)). Depending on the interaction it simulated a mouse event orcalled the respective function within the task thread.
Task Thread The task thread constantly checked wether a task was completed and cre-ated a new randomized task if necessary. It shut down after a predetermined period oftime or when the appropriate amount of tasks was completed. The execution interactionthread listened for any mouse events or messages function calls from the communicationthread and updated the objects’ parameters. Both threads saved the data whenever theuser interacted with the screen or a new task was assigned.
Game Thread The game thread was constantly checking wether the task thread was stillalive and shut down otherwise. During the execution time the thread would check wethera tile must be removed or a tile must be spawned. Finally it drew the game interface.The game interaction thread would catch the pressing of the ”Ctrl”-button and execute theremoval of a tile. Both threads saved their actions to a file.
20

5. Experiments
5.1. Preparation
Ten males between 23 and 32 took part in our tests. The mean age was 25.8 with a standartdeviation of 2.638 years. The median age was 25. All users were well used to computerwork and computer games. One user was wearing glasses. One user was left-handed, butwas using his right hand for pointing tasks in our tests. During everyday work he wasusing the same setups as other users, e.g. right-handed mouse control. Four participantswere westerners, five were Japanese and one was Vietnamese.
During the tests the users were seated approximately three meters away from the screenas shown in figure 5.1. In front of the participant was a 2 x 3 meter screen, which wasprojected by a Sanyo PDG-DWL2500 projector, and a keyboard was placed at his feet tofunction as buttons. The keyboard had all buttons but the ”Ctrl”-button, to interact withthe game, and the Num-block’s ”Enter”-button, for the two-handed interaction, removedso to not obstruct the interaction.
Figure 5.1.: A participant taking the test.
All tests were performed in a single session with a short break of approximately fiveminutes whenever the user finished the tests for one interaction technique. For each in-teraction technique the tests were precided by a five minute practice session. The testexecution was as follows:
1. Comparison test - slow
21
5. Experiments
2. 1st interaction technique
3. 2nd interaction technique
4. 3rd interaction technique
5. Comparison test - intermediate
6. 4th interaction technique
7. 5th interaction technique
8. Comparison test - fast.
During a comparison test the user had to participate in the game for two minutes but nodrag or scale tasks had to be done. The order of the interaction techniques and tests foreach technique was randomized for each participant. After the participants completed alltests they were asked to answer a questionary.
To evaluate the amount of attention devoted to the interaction and execution speed weperformed four tests for each interaction technique. Three tests required the users to per-form six different scale\drag tasks. During these tests the tiles moved at a random distanceand the speed was set to fast, intermediate or slow. The final test required the user to per-form the tasks for a period of five minutes, which was much longer than the expectedexecution time of the other tests. During this test the speed of the tiles was set to ”slow”and their distance was uniform.
Based on previous research we formulated four hypothesises for our experiment
H1 Within the free-pointing interaction techniques the amount of degrees of freedom usedfor the interaction will determine the speed of performance.
H2 The head-based interaction will perform slower than the other techniques but theerror-rate will not be higher than for other techniques.
H3 The 2-Hand interaction will perform worse than the posture interaction.
H4 The purely 2D-based interaction technique will put additional cognitive mental loadon the user thus scoring lower than the device based interaction.
5.2. Evaluation
During the evaluation of the experiment we observed two types of performances, thespeed of the execution and the performance of the game. We observed two types of pos-sible errors during the game, the repetition error, when a user attempts to remove a tilewhenever no tile reached the goal, and the miss error, when the user missed a tile.
Two groups of observations will often look different but the results will be close enoughthat no significant statistical difference exists. To calculate the difference of our obser-vations an Analysis Of variance (ANOVA)test was performed. A common type of theANOVA test is the F-test. The F-value is given as
22
5. Experiments
F =variation among sample means
variability within samples
where our observation are divided into samples by interaction techniques and the per-formed test. Therefor we had a two-way ANOVA. If the F-value is low the observations aresimilar, otherwise they are statistically diffirent. The resulting F-value van be transformedinto a percentage value which gives the propability that the observations are actually thesame. This is the case if the propability is above 0.05 (5%).
5.2.1. Execution Time
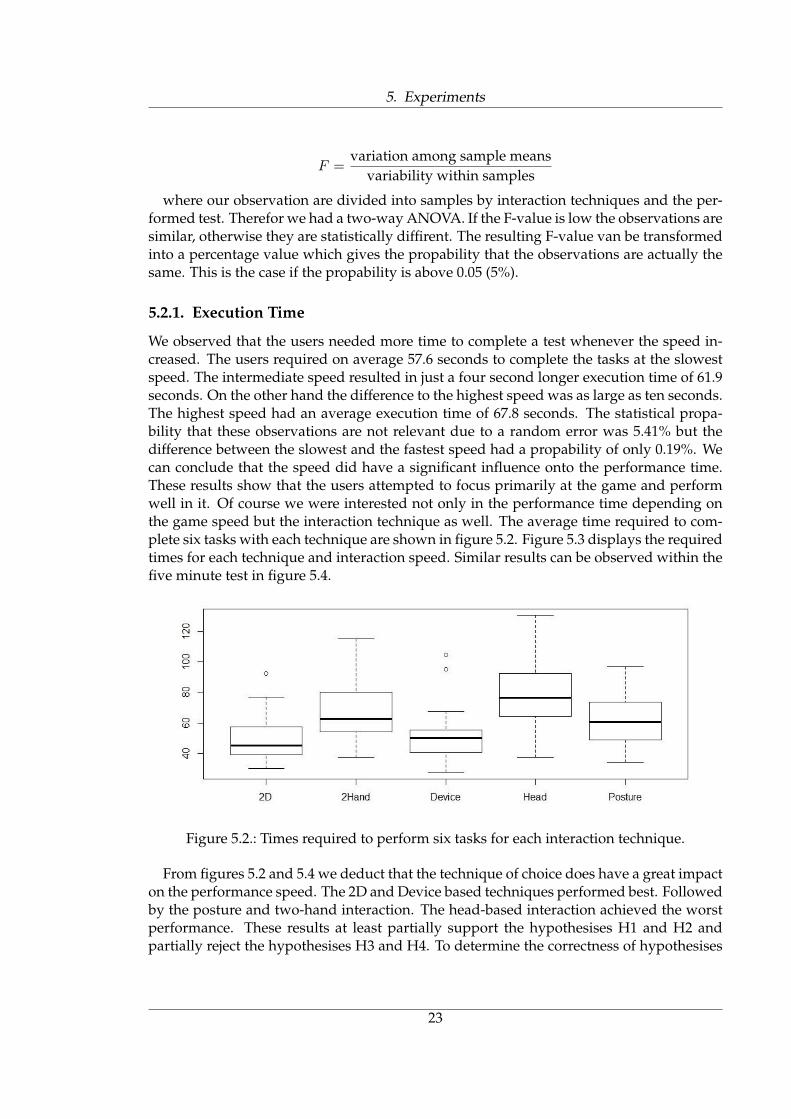
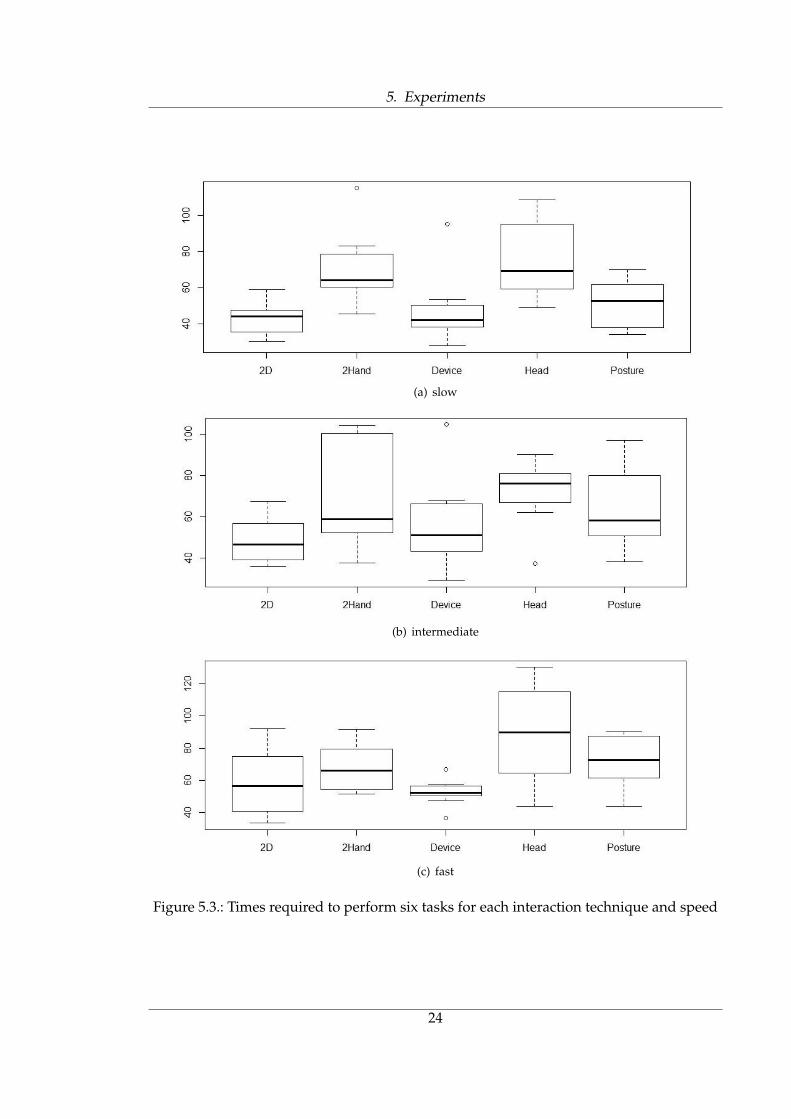
We observed that the users needed more time to complete a test whenever the speed in-creased. The users required on average 57.6 seconds to complete the tasks at the slowestspeed. The intermediate speed resulted in just a four second longer execution time of 61.9seconds. On the other hand the difference to the highest speed was as large as ten seconds.The highest speed had an average execution time of 67.8 seconds. The statistical propa-bility that these observations are not relevant due to a random error was 5.41% but thedifference between the slowest and the fastest speed had a propability of only 0.19%. Wecan conclude that the speed did have a significant influence onto the performance time.These results show that the users attempted to focus primarily at the game and performwell in it. Of course we were interested not only in the performance time depending onthe game speed but the interaction technique as well. The average time required to com-plete six tasks with each technique are shown in figure 5.2. Figure 5.3 displays the requiredtimes for each technique and interaction speed. Similar results can be observed within thefive minute test in figure 5.4.
Figure 5.2.: Times required to perform six tasks for each interaction technique.
From figures 5.2 and 5.4 we deduct that the technique of choice does have a great impacton the performance speed. The 2D and Device based techniques performed best. Followedby the posture and two-hand interaction. The head-based interaction achieved the worstperformance. These results at least partially support the hypothesises H1 and H2 andpartially reject the hypothesises H3 and H4. To determine the correctness of hypothesises
23
5. Experiments
(a) slow
(b) intermediate
(c) fast
Figure 5.3.: Times required to perform six tasks for each interaction technique and speed
24
5. Experiments
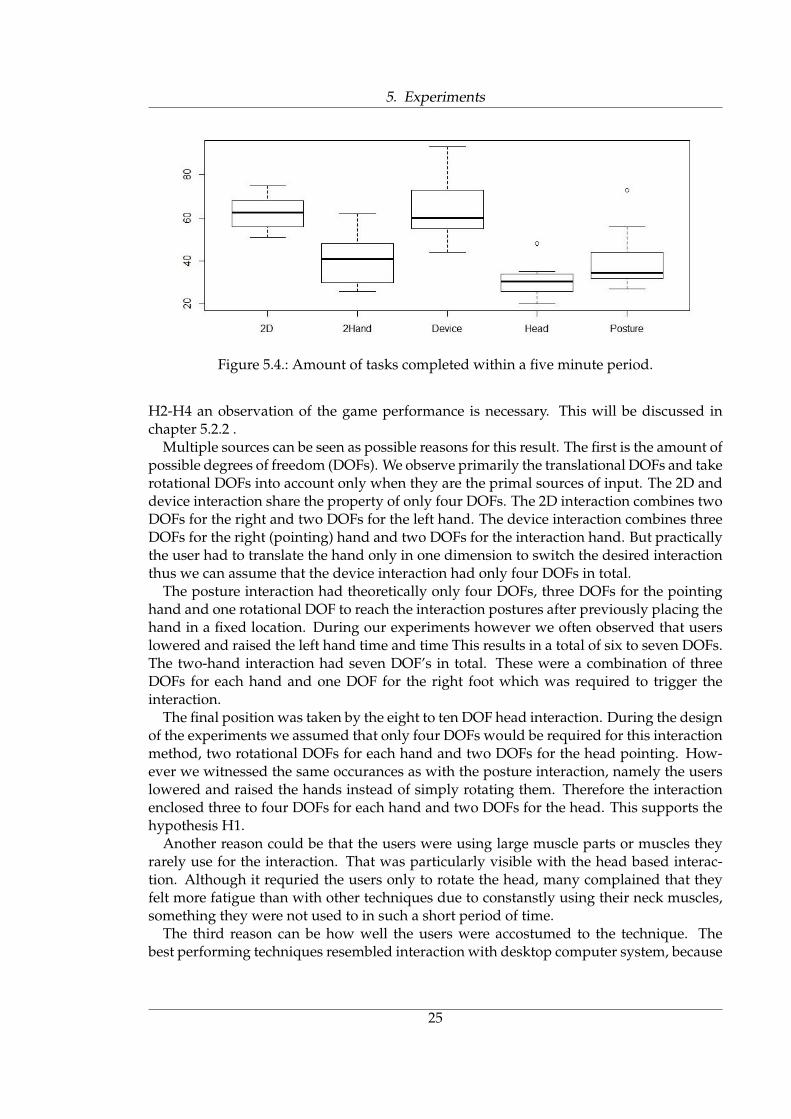
Figure 5.4.: Amount of tasks completed within a five minute period.
H2-H4 an observation of the game performance is necessary. This will be discussed inchapter 5.2.2 .
Multiple sources can be seen as possible reasons for this result. The first is the amount ofpossible degrees of freedom (DOFs). We observe primarily the translational DOFs and takerotational DOFs into account only when they are the primal sources of input. The 2D anddevice interaction share the property of only four DOFs. The 2D interaction combines twoDOFs for the right and two DOFs for the left hand. The device interaction combines threeDOFs for the right (pointing) hand and two DOFs for the interaction hand. But practicallythe user had to translate the hand only in one dimension to switch the desired interactionthus we can assume that the device interaction had only four DOFs in total.
The posture interaction had theoretically only four DOFs, three DOFs for the pointinghand and one rotational DOF to reach the interaction postures after previously placing thehand in a fixed location. During our experiments however we often observed that userslowered and raised the left hand time and time This results in a total of six to seven DOFs.The two-hand interaction had seven DOF’s in total. These were a combination of threeDOFs for each hand and one DOF for the right foot which was required to trigger theinteraction.
The final position was taken by the eight to ten DOF head interaction. During the designof the experiments we assumed that only four DOFs would be required for this interactionmethod, two rotational DOFs for each hand and two DOFs for the head pointing. How-ever we witnessed the same occurances as with the posture interaction, namely the userslowered and raised the hands instead of simply rotating them. Therefore the interactionenclosed three to four DOFs for each hand and two DOFs for the head. This supports thehypothesis H1.
Another reason could be that the users were using large muscle parts or muscles theyrarely use for the interaction. That was particularly visible with the head based interac-tion. Although it requried the users only to rotate the head, many complained that theyfelt more fatigue than with other techniques due to constanstly using their neck muscles,something they were not used to in such a short period of time.
The third reason can be how well the users were accostumed to the technique. Thebest performing techniques resembled interaction with desktop computer system, because
25
5. Experiments
they use familiar elements. On the other hand head interaction was absolutely new for allparticipants.
A final possible explanation could be the difficulties users faced for fine adjustmentswith the head interaction. Only small head movements resulted in large movements onthe screen. Furthermore the users could not control the head direction as precise as theirfinger locations on the tablets, which resulted in an increased execution time and probablyattention demands as well.
5.2.2. Game Performance
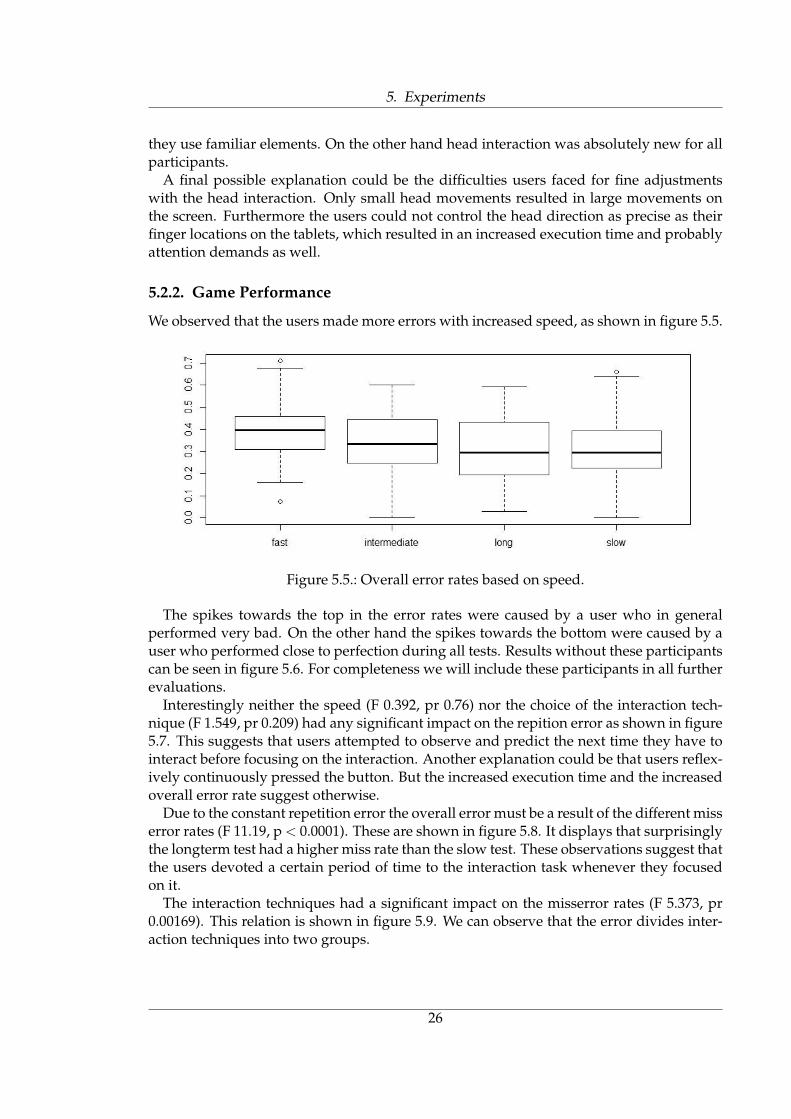
We observed that the users made more errors with increased speed, as shown in figure 5.5.
Figure 5.5.: Overall error rates based on speed.
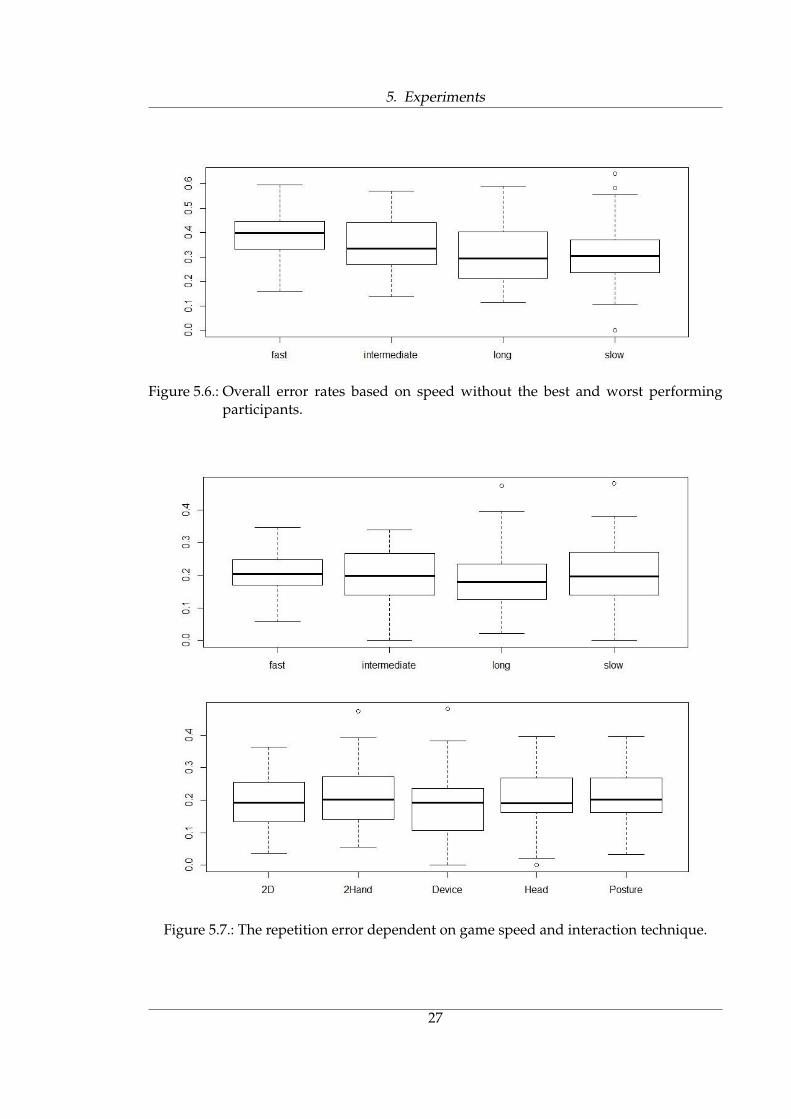
The spikes towards the top in the error rates were caused by a user who in generalperformed very bad. On the other hand the spikes towards the bottom were caused by auser who performed close to perfection during all tests. Results without these participantscan be seen in figure 5.6. For completeness we will include these participants in all furtherevaluations.
Interestingly neither the speed (F 0.392, pr 0.76) nor the choice of the interaction tech-nique (F 1.549, pr 0.209) had any significant impact on the repition error as shown in figure5.7. This suggests that users attempted to observe and predict the next time they have tointeract before focusing on the interaction. Another explanation could be that users reflex-ively continuously pressed the button. But the increased execution time and the increasedoverall error rate suggest otherwise.
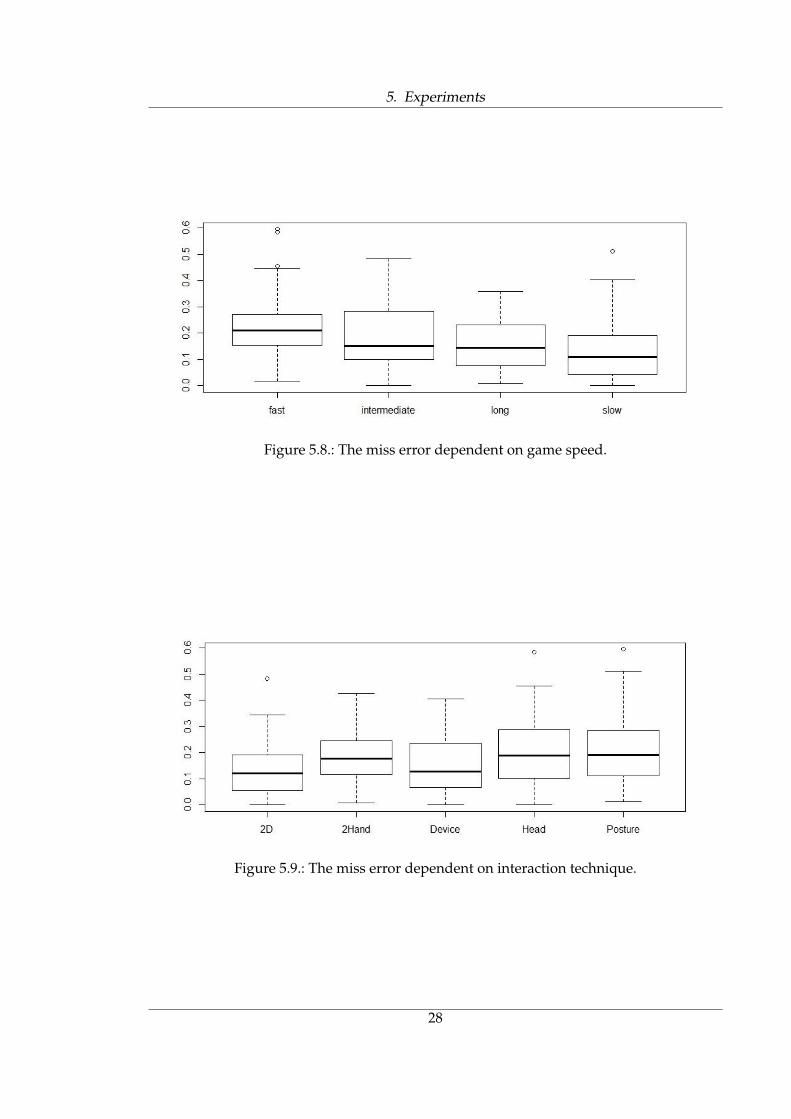
Due to the constant repetition error the overall error must be a result of the different misserror rates (F 11.19, p< 0.0001). These are shown in figure 5.8. It displays that surprisinglythe longterm test had a higher miss rate than the slow test. These observations suggest thatthe users devoted a certain period of time to the interaction task whenever they focusedon it.
The interaction techniques had a significant impact on the misserror rates (F 5.373, pr0.00169). This relation is shown in figure 5.9. We can observe that the error divides inter-action techniques into two groups.
26
5. Experiments
Figure 5.6.: Overall error rates based on speed without the best and worst performingparticipants.
Figure 5.7.: The repetition error dependent on game speed and interaction technique.
27
5. Experiments
Figure 5.8.: The miss error dependent on game speed.
Figure 5.9.: The miss error dependent on interaction technique.
28

5. Experiments
The first group consisted of the 2D and device interaction. This result is equal to theperformance time. But the second group included all other methods of spatial interaction.This result supports our hypothesis H4. One would expect that the users who requiredmore time to solve a task made less errors, but our observations show that mostly this isnot the case. Figure 5.10 shows an example of the observed distributions. Weighing theerror rate by the time made the results more prone to random errors (F 3.34, pr 0.02) butdid not change the overall results significantly, as shown in figure 5.11.
As the pointing of the device and posture interaction was the same, the different errorrates must be a result of the differences in the way to choose the desired interaction. Wesuspect that the additional local information of the left hand, which had to be processedduring the posture interaction, was the reason for the difference.
Figure 5.10.: The miss error rates for the 2-Hand interaction during the slow speed test.
Figure 5.11.: The miss error weighted by performance time.
Interestingly we observed that for some users the error rates were very similar for allinteraction techniques. But for others we could clearly distinguish efficient and inefficienttechniques.
Another unexpected result was the error rate for particular tests. We observed that the
29
5. Experiments
(a) slow (b) intermediate
(c) fast (d) longterm
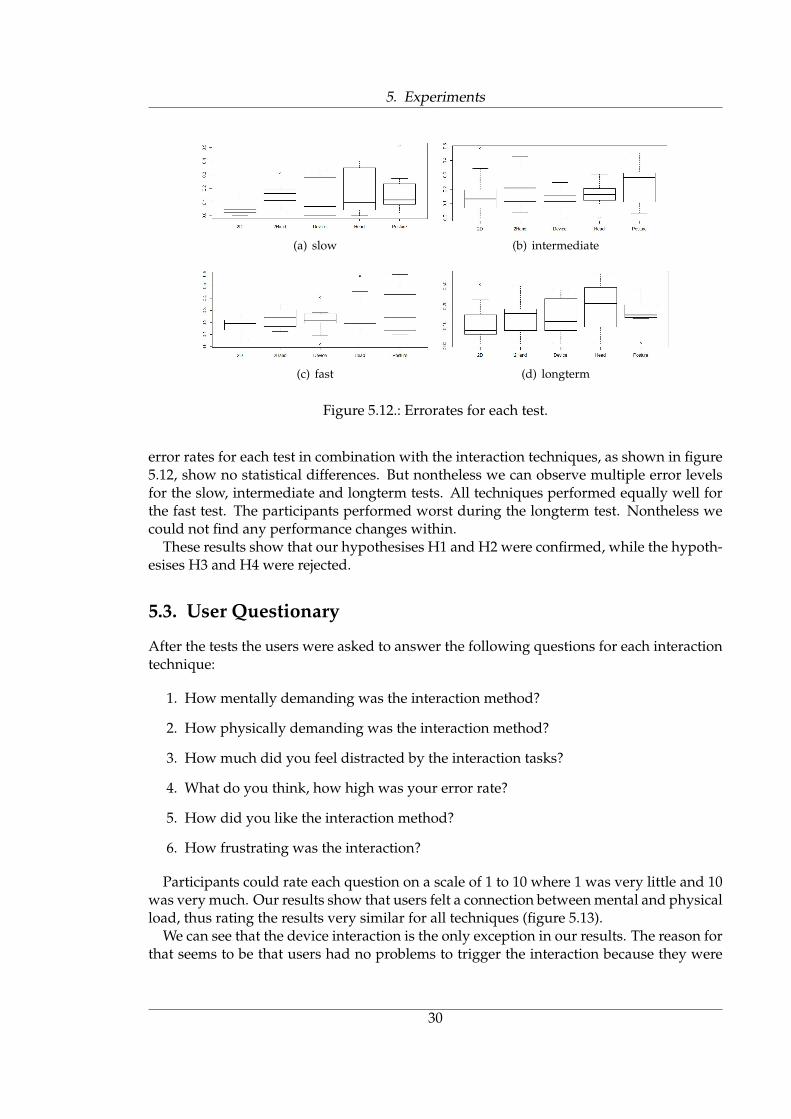
Figure 5.12.: Errorates for each test.
error rates for each test in combination with the interaction techniques, as shown in figure5.12, show no statistical differences. But nontheless we can observe multiple error levelsfor the slow, intermediate and longterm tests. All techniques performed equally well forthe fast test. The participants performed worst during the longterm test. Nontheless wecould not find any performance changes within.
These results show that our hypothesises H1 and H2 were confirmed, while the hypoth-esises H3 and H4 were rejected.
5.3. User Questionary
After the tests the users were asked to answer the following questions for each interactiontechnique:
1. How mentally demanding was the interaction method?
2. How physically demanding was the interaction method?
3. How much did you feel distracted by the interaction tasks?
4. What do you think, how high was your error rate?
5. How did you like the interaction method?
6. How frustrating was the interaction?
Participants could rate each question on a scale of 1 to 10 where 1 was very little and 10was very much. Our results show that users felt a connection between mental and physicalload, thus rating the results very similar for all techniques (figure 5.13).
We can see that the device interaction is the only exception in our results. The reason forthat seems to be that users had no problems to trigger the interaction because they were
30

5. Experiments
(a) Q1: How mentally demanding was the interaction method?
(b) Q2: How physically demanding was the interaction method?
Figure 5.13.: Similar results for the mental and physical demands.
31
5. Experiments
familiar with the use of devices for computer interaction, thus only very little mental loadwas necessary. On the other hand the pointing task required to use the whole arm, thustiring the users. However some users noted that placing the arm in a fixed location, thusreducing the amount of movement required for pointing, would greatly reduce the fatigueand improve the performance.
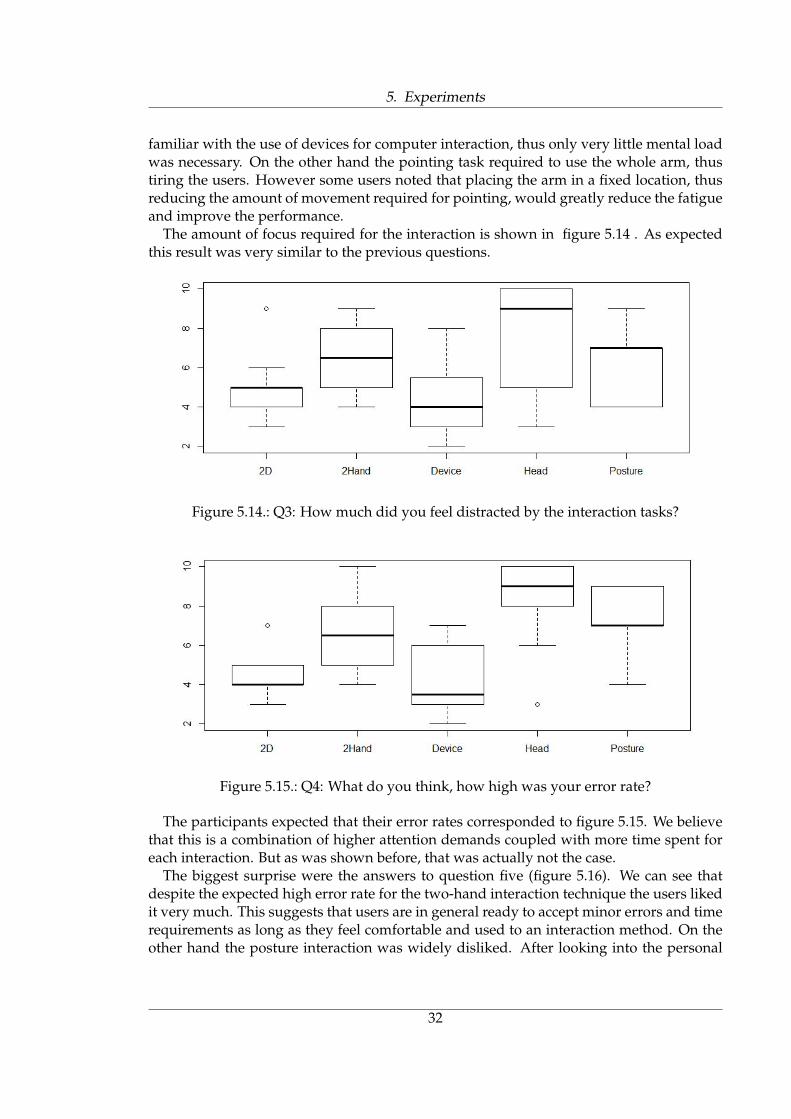
The amount of focus required for the interaction is shown in figure 5.14 . As expectedthis result was very similar to the previous questions.
Figure 5.14.: Q3: How much did you feel distracted by the interaction tasks?
Figure 5.15.: Q4: What do you think, how high was your error rate?
The participants expected that their error rates corresponded to figure 5.15. We believethat this is a combination of higher attention demands coupled with more time spent foreach interaction. But as was shown before, that was actually not the case.
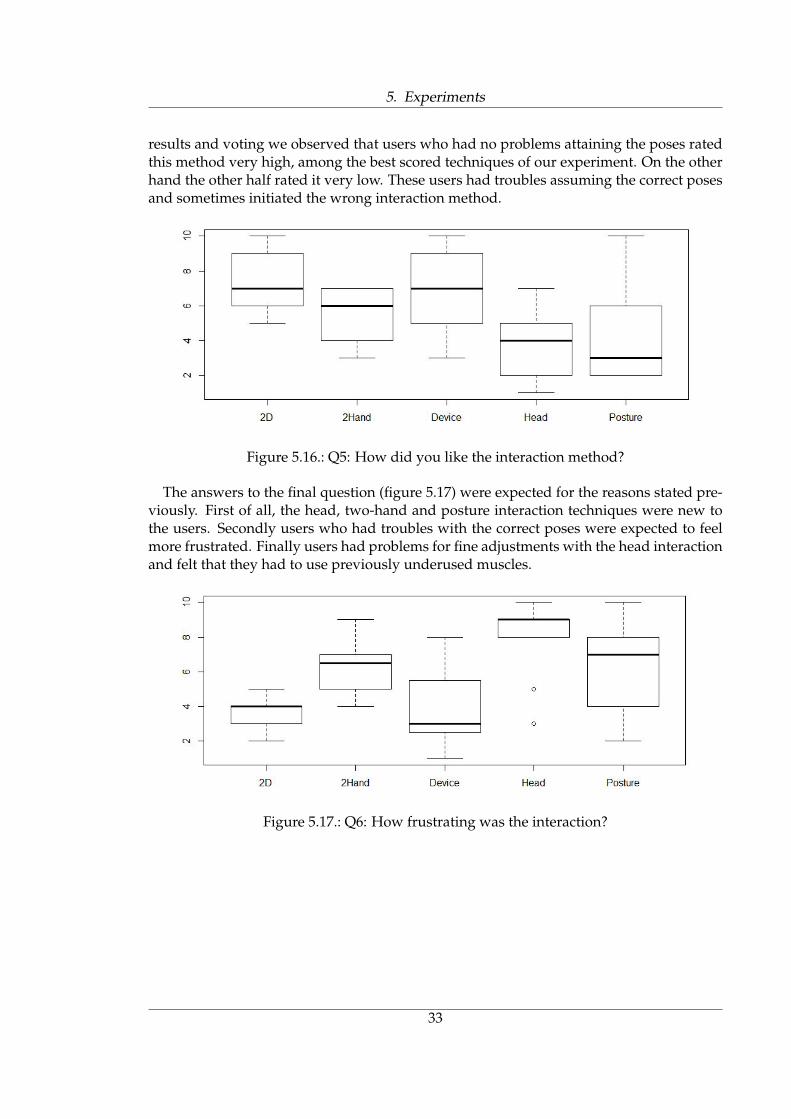
The biggest surprise were the answers to question five (figure 5.16). We can see thatdespite the expected high error rate for the two-hand interaction technique the users likedit very much. This suggests that users are in general ready to accept minor errors and timerequirements as long as they feel comfortable and used to an interaction method. On theother hand the posture interaction was widely disliked. After looking into the personal
32
5. Experiments
results and voting we observed that users who had no problems attaining the poses ratedthis method very high, among the best scored techniques of our experiment. On the otherhand the other half rated it very low. These users had troubles assuming the correct posesand sometimes initiated the wrong interaction method.
Figure 5.16.: Q5: How did you like the interaction method?
The answers to the final question (figure 5.17) were expected for the reasons stated pre-viously. First of all, the head, two-hand and posture interaction techniques were new tothe users. Secondly users who had troubles with the correct poses were expected to feelmore frustrated. Finally users had problems for fine adjustments with the head interactionand felt that they had to use previously underused muscles.
Figure 5.17.: Q6: How frustrating was the interaction?
33
6. Summary and Outlook
During our research we have implemented multiple techniques for wall-sized screen in-teraction. Our goal was to observe the user’s ability to multitask at a wall-sized screen andthe impact the interaction techniques had on the performance in regard of execution timeand error rates. All techniques resulted in higher user error rates than when they had tofocus only on one task. We were surprised that the secondary error was not influenced byany factors of our experiment, thus we conclude that this error is the result of multitasking.
In regard to the more relevant miss error we found out that interaction techniques whichinvolve a device and the motion of only a small portion of our muscles resulted in lesserrors than techniques based on spatial interaction. These techniques performed fasteras well. Among the purely spatial interaction based techniques we observed that theyachieved similar error rates, as was expected.
In terms of speed we see three groups, where the familiarity and amount of degrees offreedom are the main dividing factors. The device and 2D interaction techniques scoredbest, followed by the posture and two-hand interaction and finally the head interaction.
Despite these results we believe that further testing of the posture technique is requireddue to the different impressions the users had of this technique. For further testing wemust define new postures, which are easier to acquire and thus reduce the mental load onthe users. The high ratings it achieved among the users who had no problems with thepredefined postures suggest that it may perform far superior than in our experiment witha different set of postures.
The close results of the device and 2D interaction suggest that both are equally usefuland should be prefered over other techniques. One must not forget that users complainedthat all techniques which involved spatial pointing were tiring and lead to faster exhaus-tion. On the other hand the tablet device required the users to use both hands for the hold-ing task and put additional stress through its increased weight. Therefor we suggest thatdevice interaction should be chosen over the 2D interaction. It requires the user to carry aby far lighter device and requires only one hand for the holding task. The other hand canbe used for other tasks, thus promoting collaboration and interhuman communication.
We believe that further research in computer vision reconstruction algorithms will allowus to detect even small pose changes thus enable the reproduction of interaction techniquesresembling our current device techniques and make these obsolete, similar to the clickingtechnique of Vogel and Balakrishnan [34]. A question in this aspect could be: How muchinfluence did the haptic feedback of the devices have on the performance results? Sameimprovements which enable the detection of fine pose changes will allow to reduce thefatigue of the users, as the pointing task will involve less muscles and as a side-productincrease the performance speed as well.
34

Appendix
35
List of Figures
3.1. Framework of the experiment. . . . . . . . . . . . . . . . . . . . . . . . . . . . 73.2. The OptiTrack camera setup. . . . . . . . . . . . . . . . . . . . . . . . . . . . 83.3. Implemented interaction techniques. . . . . . . . . . . . . . . . . . . . . . . . 93.4. The Interaction screen as displayed on the Samsung Galaxy Tab. . . . . . . . 103.5. The propabilities of spawning a tile. . . . . . . . . . . . . . . . . . . . . . . . 163.6. The user interface displayed at the wall-sized screen. . . . . . . . . . . . . . 163.7. Different tasks given to the user. . . . . . . . . . . . . . . . . . . . . . . . . . 17
4.1. Class diagram of the interaction calculations. . . . . . . . . . . . . . . . . . . 194.2. The Java Classes for the user interface . . . . . . . . . . . . . . . . . . . . . . 20
5.1. A participant taking the test. . . . . . . . . . . . . . . . . . . . . . . . . . . . . 215.2. Times required to perform six tasks for each interaction technique. . . . . . 235.3. Times required to perform six tasks for each interaction technique and speed 245.4. Amount of tasks completed within a five minute period. . . . . . . . . . . . 255.5. Overall error rates based on speed. . . . . . . . . . . . . . . . . . . . . . . . . 265.6. Overall error rates based on speed without the best and worst performing
participants. . . . . . . . . . . . . . . . . . . . . . . . . . . . . . . . . . . . . . 275.7. The repetition error dependent on game speed and interaction technique. . 275.8. The miss error dependent on game speed. . . . . . . . . . . . . . . . . . . . . 285.9. The miss error dependent on interaction technique. . . . . . . . . . . . . . . 285.10. The miss error rates for the 2-Hand interaction during the slow speed test. . 295.11. The miss error weighted by performance time. . . . . . . . . . . . . . . . . . 295.12. Errorates for each test. . . . . . . . . . . . . . . . . . . . . . . . . . . . . . . . 305.13. Similar results for the mental and physical demands. . . . . . . . . . . . . . 315.14. Q3: How much did you feel distracted by the interaction tasks? . . . . . . . 325.15. Q4: What do you think, how high was your error rate? . . . . . . . . . . . . 325.16. Q5: How did you like the interaction method? . . . . . . . . . . . . . . . . . 335.17. Q6: How frustrating was the interaction? . . . . . . . . . . . . . . . . . . . . 33
36
Bibliography
[1] Implementation of the svd algorithm. Available online at http://www.nr.com/webnotes/nr3web2.pdf.
[2] Open source computer vision (opencv). Available online at http://opencv.willowgarage.com/wiki/.
[3] tuiodroid - open source tuio app for android. Available online at http://code.google.com/p/tuiodroid/.
[4] Virtual reality peripheral network. Available online at http://www.cs.unc.edu/Research/vrpn/.
[5] Thomas Augsten, Konstantin Kaefer, Rene Meusel, Caroline Fetzer, Dorian Kanitz,Thomas Stoff, Torsten Becker, Christian Holz, and Patrick Baudisch. Multitoe: high-precision interaction with back-projected floors based on high-resolution multi-touchinput. In Proceedings of the 23nd annual ACM symposium on User interface software andtechnology, UIST ’10, pages 209–218, New York, NY, USA, 2010. ACM.
[6] Patrick Baudisch, Ben Bederson, and Alexander Zierlinger. Drag-and-pop: Acceler-ating drag-and-drop on large screens, 2002.
[7] Patrick Baudisch, Edward Cutrell, George Robertson, and Pravin Santiago. High-density cursor: An improved mouse cursor that accelerates target acquisition, 2003.
[8] Patrick Baudisch, Nathaniel Good, Victoria Bellotti, and Pamela Schraedley. Keepingthings in context: a comparative evaluation of focus plus context screens, overviews,and zooming. In Proceedings of the SIGCHI conference on Human factors in computingsystems: Changing our world, changing ourselves, CHI ’02, pages 259–266, New York,NY, USA, 2002. ACM.
[9] Patrick Baudisch, Mike Sinclair, and Andrew Wilson. Soap: a pointing device thatworks in mid-air. In Proceedings of the 19th annual ACM symposium on User interfacesoftware and technology, UIST ’06, pages 43–46, New York, NY, USA, 2006. ACM.
[10] Xiaojun Bi and Ravin Balakrishnan. Comparing usage of a large high-resolution dis-play to single or dual desktop displays for daily work. In Proceedings of the 27th in-ternational conference on Human factors in computing systems, CHI ’09, pages 1005–1014,New York, NY, USA, 2009. ACM.
[11] Andrew Bragdon, Eugene Nelson, Yang Li, and Ken Hinckley. Experimental analysisof touch-screen gesture designs in mobile environments. In Proceedings of the 2011annual conference on Human factors in computing systems, CHI ’11, pages 403–412, NewYork, NY, USA, 2011. ACM.
37

Bibliography
[12] N. Charness, P. Holley, J. Feddon, and T. Jastrzembski. Light pen use and practice mini-mize age and hand performance differences in pointing tasks, pages 373–384. Human Fac-tors 46.
[13] Edilson de Aguiar, Carsten Stoll, Christian Theobalt, Naveed Ahmed, Hans-Peter Sei-del, and Sebastian Thrun. Performance capture from sparse multi-view video. ACMTrans. Graph., 27(3):98:1–98:10, August 2008.
[14] P.F. Felzenszwalb, R.B. Girshick, D. McAllester, and D. Ramanan. Object detectionwith discriminatively trained part-based models. Pattern Analysis and Machine Intelli-gence, IEEE Transactions on, 32(9):1627 –1645, sept. 2010.
[15] Gene H. Golub and Charles F. van Van Loan. Matrix Computations (Johns HopkinsStudies in Mathematical Sciences)(3rd Edition). The Johns Hopkins University Press, 3rdedition, 1996.
[16] R. I. Hartley and A. Zisserman. Multiple View Geometry in Computer Vision. CambridgeUniversity Press, ISBN: 0521540518, second edition, 2004.
[17] Ricardo Jota, Joao M. Pereira, and Joaquim A. Jorge. A comparative study of in-teraction metaphors for large-scale displays. In Proceedings of the 27th internationalconference extended abstracts on Human factors in computing systems, CHI EA ’09, pages4135–4140, New York, NY, USA, 2009. ACM.
[18] Alessandro Lai, Alessandro Soro, and Riccardo Scateni. Interactive calibration of amulti-projector system in a video-wall multi-touch environment. In Adjunct proceed-ings of the 23nd annual ACM symposium on User interface software and technology, UIST’10, pages 437–438, New York, NY, USA, 2010. ACM.
[19] Yebin Liu, C. Stoll, J. Gall, H.-P. Seidel, and C. Theobalt. Markerless motion capture ofinteracting characters using multi-view image segmentation. In Computer Vision andPattern Recognition (CVPR), 2011 IEEE Conference on, pages 1249 –1256, june 2011.
[20] Shahzad Malik, Abhishek Ranjan, and Ravin Balakrishnan. Interacting with largedisplays from a distance with vision-tracked multi-finger gestural input. In ACMSIGGRAPH 2006 Sketches, SIGGRAPH ’06, New York, NY, USA, 2006. ACM.
[21] Anne Collins McLaughlin, Wendy A. Rogers, and Arthur D. Fisk. Using direct andindirect input devices: Attention demands and age-related differences. ACM Trans.Comput.-Hum. Interact., 16(1):2:1–2:15, April 2009.
[22] Mathieu Nancel, Julie Wagner, Emmanuel Pietriga, Olivier Chapuis, and WendyMackay. Mid-air pan-and-zoom on wall-sized displays. In Proceedings of the 2011annual conference on Human factors in computing systems, CHI ’11, pages 177–186, NewYork, NY, USA, 2011. ACM.
[23] Tao Ni, Greg S. Schmidt, Oliver G. Staadt, Mark A. Livingston, Robert Ball, andRichard May. A survey of large high-resolution display technologies, techniques,and applications. In Proceedings of the IEEE conference on Virtual Reality, VR ’06, pages223–236, Washington, DC, USA, 2006. IEEE Computer Society.
38
Bibliography
[24] William H. Press, Saul A. Teukolsky, William T. Vetterling, and Brian P. Flannery.Numerical Recipes 3rd Edition: The Art of Scientific Computing. Cambridge UniversityPress, 3 edition, 2007.
[25] R. Raskar, M.S. Brown, Ruigang Yang, Wei-Chao Chen, G. Welch, H. Towles, B. Scales,and H. Fuchs. Multi-projector displays using camera-based registration. In Visualiza-tion ’99. Proceedings, pages 161 –522, oct. 1999.
[26] W. A. Rogers, A. D. Fisk, A. C. McLaughlin, and R. Pak. Touch a screen or turn a knob:Choosing the best device for the job, pages 271–288. Human Factors 47. 2005.
[27] T. Scott Saponas, Desney S. Tan, Dan Morris, Ravin Balakrishnan, Jim Turner, andJames A. Landay. Enabling always-available input with muscle-computer interfaces.In Proceedings of the 22nd annual ACM symposium on User interface software and technol-ogy, UIST ’09, pages 167–176, New York, NY, USA, 2009. ACM.
[28] W. Schneider and A. D. Fisk. Degree of consistent training: improvements in search per-formance and automatic process development, pages 160–168. Perception Psychophysics31. 1982.
[29] Jeremy Scott, David Dearman, Koji Yatani, and Khai N. Truong. Sensing foot gesturesfrom the pocket. In Proceedings of the 23nd annual ACM symposium on User interfacesoftware and technology, UIST ’10, pages 199–208, New York, NY, USA, 2010. ACM.
[30] Garth Shoemaker, Anthony Tang, and Kellogg S. Booth. Shadow reaching: a newperspective on interaction for large displays. In Proceedings of the 20th annual ACMsymposium on User interface software and technology, UIST ’07, pages 53–56, New York,NY, USA, 2007. ACM.
[31] Sophie Stellmach, Sebastian Stober, Andreas Nurnberger, and Raimund Dachselt. De-signing gaze-supported multimodal interactions for the exploration of large imagecollections. In Proceedings of the 1st Conference on Novel Gaze-Controlled Applications,NGCA ’11, pages 1:1–1:8, New York, NY, USA, 2011. ACM.
[32] Jayson Turner, Andreas Bulling, and Hans Gellersen. Combining gaze with manualinteraction to extend physical reach. In Proceedings of the 1st international workshop onpervasive eye tracking & mobile eye-based interaction, PETMEI ’11, pages 33–36, NewYork, NY, USA, 2011. ACM.
[33] A. M. Valk. An experiment to study touch screen ”button” design, pages 127–131. Proc.Hum. Factors Ergonomics Soc. 29.
[34] Daniel Vogel and Ravin Balakrishnan. Distant freehand pointing and clicking onvery large, high resolution displays. In Proceedings of the 18th annual ACM symposiumon User interface software and technology, UIST ’05, pages 33–42, New York, NY, USA,2005. ACM.
[35] N. Walker, D. A. Philbin, and A. D. Fisk. Age-related differences in movement control:Adjusting sub-movement structure to optimize performance, pages 40–52. J. Gerontology:Psych. Sciences 52. 1997.
39
Bibliography
[36] Nadir Weibel, Anne Marie Piper, and James D. Hollan. Exploring pen and paperinteraction with high-resolution wall displays. In Adjunct proceedings of the 23nd an-nual ACM symposium on User interface software and technology, UIST ’10, pages 455–456,New York, NY, USA, 2010. ACM.
[37] C. D. Wickens. Processing resources in attention, pages 63–98. Varieties of Attention, R.Parasuraman and D. R. Davies Eds. Academic Press, New York, 1984.
[38] ByungIn Yoo, Jae-Joon Han, Changkyu Choi, Kwonju Yi, Sungjoo Suh, Dusik Park,and Changyeong Kim. 3d user interface combining gaze and hand gestures for large-scale display. In Proceedings of the 28th of the international conference extended abstractson Human factors in computing systems, CHI EA ’10, pages 3709–3714, New York, NY,USA, 2010. ACM.
[39] Shumin Zhai, Carlos Morimoto, and Steven Ihde. Manual and gaze input cascaded(magic) pointing. In Proceedings of the SIGCHI conference on Human factors in computingsystems: the CHI is the limit, CHI ’99, pages 246–253, New York, NY, USA, 1999. ACM.
40