Embed Size (px)
Citation preview
Table of Contents
Total University (Excluding Temple Japan1,2
)
Tyler School of Art
Fox School of Business and Management
Maurice H. Kornberg School of Dentistry
College of Education
College of Engineering
Beasley School of Law
College of Liberal Arts
Media & Communication, School of
Lewis Katz School of Medicine
Center for the Performing and Cinematic Arts
Esther Boyer College of Music and Dance
School of Theater, Film and Media Arts
School of Pharmacy
School of Podiatric Medicine
College of Public Health
College of Public Health
School of Social Work
College of Science and Technology
School of Tourism and Hospitality Management
University College
University Studies
1. Enrollment from Temple Japan only included on page 2, Total University Enrollment count.
2. Programs offered and degrees awarded also include Temple Japan.
Note:
(a) Temple University Japan excluded from this report, except where indicated.
Fall 2015 Student Profile
Temple UniversityInstitutional Research & Assessment
Page
2
38
5
8
11
14
17
20
23
26
29
32
35
53
56
59
(b) On October 13th 2015, the Board of Trustees established the School of Theater, Film and Media Arts which is in the Center for the
Performing and Cinematic Arts. On December 8th 2015, the Board of Trustees eliminated the School of Environmental Design. The departments
previously located in the School of Environmental Design are now in the Tyler School of Art.
41
44
47
50

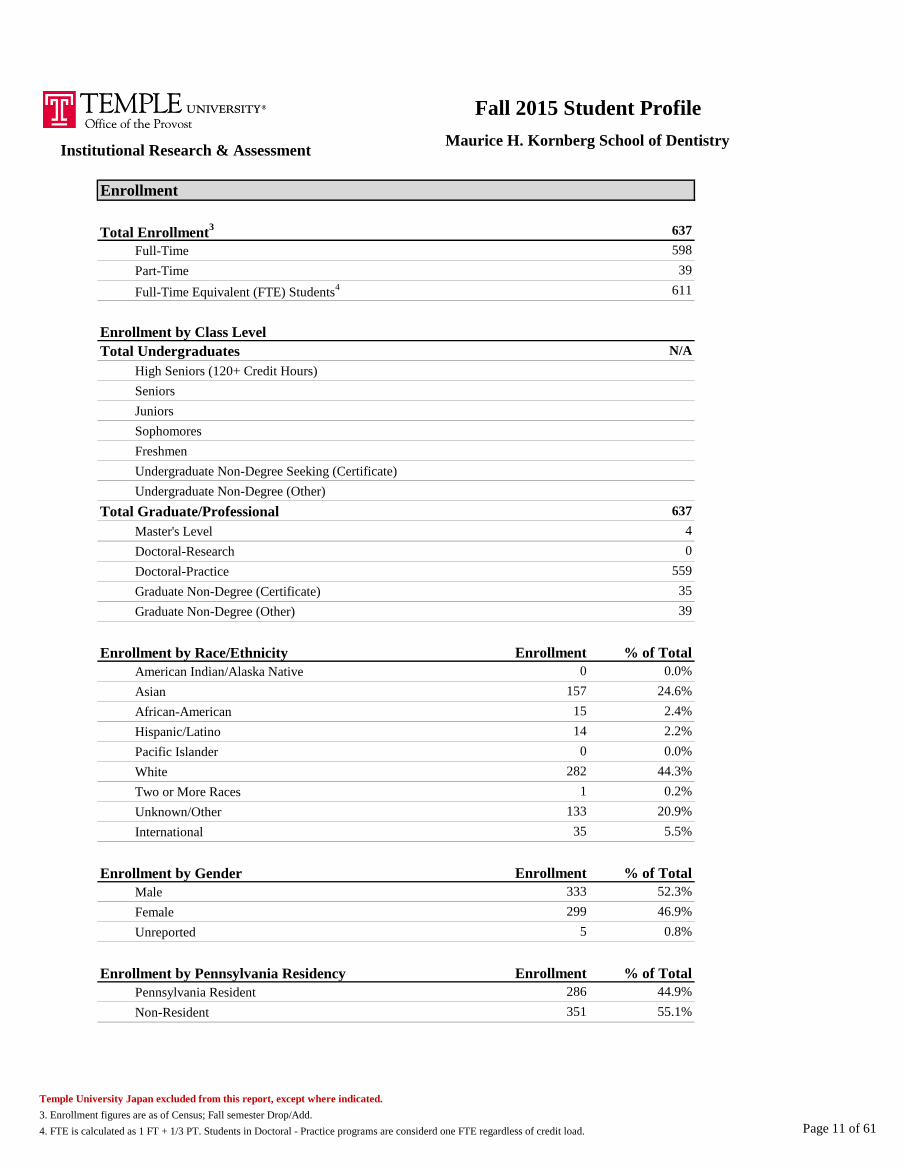
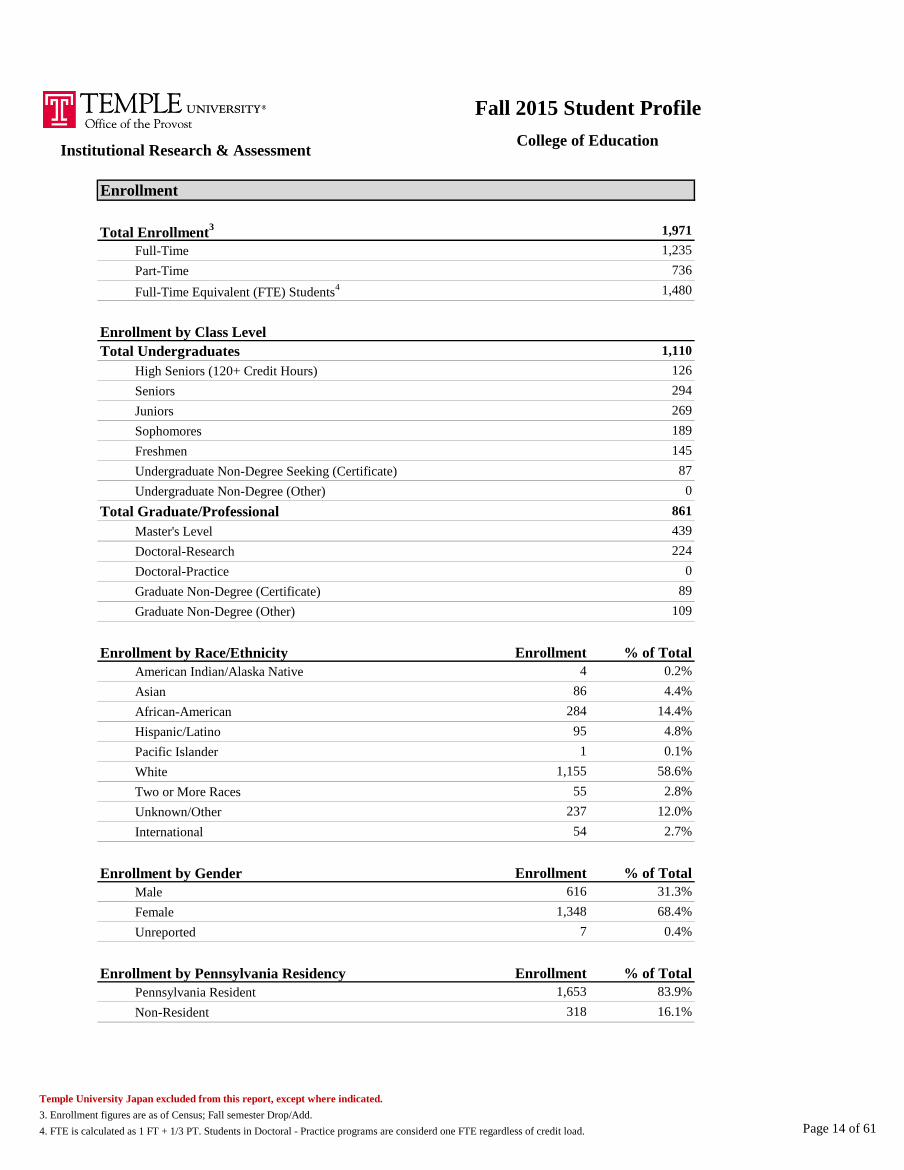
Enrollment
Total Enrollment Including Temple University Japan
Total Enrollment3
Full-Time
Part-Time
Full-Time Equivalent (FTE) Students
Enrollment by Class Level
Total Undergraduates
High Seniors (120+ Credit Hours)
Seniors
Juniors
Sophomores
Freshmen
Undergraduate Non-Degree Seeking (Certificate)
Undergraduate Non-Degree (Other)
Total Graduate/Professional
Master's Level
Doctoral-Research
Doctoral-Practice
Graduate Non-Degree (Certificate)
Graduate Non-Degree (Other)
Enrollment by Race/Ethnicity
American Indian/Alaska Native
Asian
African-American
Hispanic/Latino
Pacific Islander
White
Two or More Races
Unknown/Other
International
Enrollment by Gender
Male
Female
Unreported
Enrollment by Pennsylvania Residency
Pennsylvania Resident
Non-Resident
3. Enrollment figures are as of Census; Fall semester Drop/Add.
4. FTE is calculated as 1 FT + 1/3 PT. Students in Doctoral - Practice programs are considerd one FTE regardless of credit load.
Note: Temple University Japan excluded from this report, except where indicated.
32,361
5,936
34,450
28,754
1,766
Fall 2015 Student Profile
Temple UniversityInstitutional Research & Assessment
39,515
38,297
9,543
3,693
1,638
3,435
209
568
6,470
6,940
6,434
6,394
97
653
3,015 977 3,992
3,730 781 4,511
Undergraduate
Graduate/
Professional
Total
Enrollment
40 10 50
15,906 4,710 20,616
854 181 1,035
1,728 429 2,157
29 7 36
14,013 4,276 18,289
14,717 5,221 19,938
1,519 1,152 2,671
1,933 1,296 3,229
6,693 4,104 10,797
24 46 70
22,061 5,439 27,500
Page 2 of 61

Fall 2015 Student Profile
Temple UniversityInstitutional Research & Assessment
Enrollment by School/College
Tyler School of Art5
Fox School of Business and Management
Maurice H. Kornberg School of Dentistry
College of Education
College of Engineering
Beasley School of Law
College of Liberal Arts
Media & Communication, School of
Lewis Katz School of Medicine
Center for the Performing and Cinematic Arts6
Esther Boyer College of Music and Dance
School of Theater, Film and Media Arts
School of Pharmacy
School of Podiatric Medicine
College of Public Health
College of Public Health (w/o Social Work)
School of Social Work
College of Science and Technology
School of Tourism and Hospitality Management
University College
University Studies
Enrollment by Location7
Ambler/Ft Washington Campus, Ambler PA
Beijing China
Center City, Philadelphia PA
Harrisburg Center, Harrisburg PA
Health Sciences Campus, Philadelphia PA
Main Campus, Philadelphia PA
Off Campus, Various Other Locations
Rome Italy
Most Popular Undergraduate Majors
Biology
Psychology
Kinesiology
Accounting
Finance
Marketing
Media Studies and Production
Business Management
5. On October 13th 2015, the Board of Trustees established the School of Theater, Film and Media Arts which is in the Center for the Performing
and Cinematic Arts.
6. On December 8th 2015, the Board of Trustees eliminated the School of Environmental Design. The departments previously located in the
School of Environmental Design are now in the Tyler School of Art.
7. Campus location is calculated based on where student takes the majority of classes
Total
Enrollment
1,571
2,895
1,053
1,650
756
894
925
8,040
637
1,971
1,985
926
5,065
18
1,515
Total
Enrollment
694
92
366
4,544
3,673
871
4,219
917
Undergraduate
Enrollment
Percent of
Enrollment
1,442 5.0%
1,327 4.6%
865
181
2,954
32,746
649
116
906 3.2%
804 2.8%
742 2.6%
1,235 4.3%
1,103 3.8%
1,072 3.7%
Page 3 of 61

Fall 2015 Student Profile
Temple UniversityInstitutional Research & Assessment
Admissions
Admissions Statistics
Incoming Students by Classifications
Freshmen
Transfers
Master's Level
Doctoral Level
Professional Schools
Academic Measures8
Incoming Freshmem
Average SAT Verbal/Reading Score
Average SAT Math Score
Average Combined SAT Score
Average ACT Composite Score
Incoming Transfers
Average GPA of Transfer Students (4.00 scale)
Degrees Awarded & Academic Programs
Academic Degree Programs by Degree Level
Including Temple University Japan (TUJ)
Post-secondary Certificate
Associates
Bachelors
Master's
Graduate Certificate
Doctoral-Practice
Doctoral-Scholarship/Research
Temple University Total
Faculty (excluding Temple University Japan)
Full-Time Faculty by Appointment
Tenured
Tenure Track
Non-Tenure Track
Temple University Total
8. Academic Measures calculated based on students newly admitted and enrolled for Fall 2015
9. TU Policy 02.60.01: Establishing, Restructuring and Terminating Academic Programs - last amended May 12, 2015
10. Degrees awarded between July 1, 2014 and June 30, 2015
584
1156
26
3.11
Academic
Programs Offered
2015-20169
Degrees Awarded
2014-201510
4,906
2,429
1,424
343
805
572
148 1,652
76 90
14 923
24 107
2 6
149 6,152
2,149 100%
746 34.7%
238 11.1%
1,165 54.2%
51 206
464 9,136
Total % of Total
Page 4 of 61

Enrollment
Total Enrollment3
Full-Time
Part-Time
Full-Time Equivalent (FTE) Students4
Enrollment by Class Level
Total Undergraduates
High Seniors (120+ Credit Hours)
Seniors
Juniors
Sophomores
Freshmen
Undergraduate Non-Degree Seeking (Certificate)
Undergraduate Non-Degree (Other)
Total Graduate/Professional
Master's Level
Doctoral-Research
Doctoral-Practice
Graduate Non-Degree (Certificate)
Graduate Non-Degree (Other)
Enrollment by Race/Ethnicity
American Indian/Alaska Native
Asian
African-American
Hispanic/Latino
Pacific Islander
White
Two or More Races
Unknown/Other
International
Enrollment by Gender
Male
Female
Unreported
Enrollment by Pennsylvania Residency
Pennsylvania Resident
Non-Resident
Temple University Japan excluded from this report, except where indicated.
3. Enrollment figures are as of Census; Fall semester Drop/Add.
4. FTE is calculated as 1 FT + 1/3 PT. Students in Doctoral - Practice programs are considerd one FTE regardless of credit load.
On December 8th 2015, the Board of Trustees eliminated the School of Environmental Design. The departments previously located in the School of Environmental
Design are now in the Tyler School of Art.
1,144 72.8%
427 27.2%
1,041 66.3%
0 0.0%
Enrollment % of Total
Enrollment % of Total
530 33.7%
77 4.9%
103 6.6%
1,084 69.0%
46 2.9%
90 5.7%
2 0.1%
83 5.3%
86 5.5%
12
Enrollment % of Total
0 0.0%
218
172
34
0
0
355
309
269
0
0
1,466
1,353
111
309
Fall 2015 Student Profile
Tyler School of ArtInstitutional Research & Assessment
1,571
1,413
158
Page 5 of 61

Fall 2015 Student Profile
Tyler School of ArtInstitutional Research & Assessment
Admissions
Admissions Statistics
Incoming Students by Classifications
Freshmen
Transfers
Master's Level
Doctoral Level
Professional Schools
Academic Measures5
Incoming Freshmem
Average SAT Verbal/Reading Score
Average SAT Math Score
Average Combined SAT Score
Average ACT Composite Score
Incoming Transfers
Average GPA of Transfer Students (4.00 scale)
Degrees Awarded & Academic Programs
Academic Degree Programs by Degree Level
Including Temple University Japan (TUJ)
Post-secondary Certificate
Associates
Bachelors
Master's
Graduate Certificate
Doctoral-Practice
Doctoral-Scholarship/Research
Temple University Total
Faculty (excluding Temple University Japan)
Full-Time Faculty by Appointment
Tenured
Tenure Track
Non-Tenure Track
Temple University Total
5. Academic Measures calculated based on students newly admitted and enrolled for Fall 2015
6. TU Policy 02.60.01: Establishing, Restructuring and Terminating Academic Programs - last amended May 12, 2015
7. Degrees awarded between July 1, 2014 and June 30, 2015
68 100%
43 63.2%
10 14.7%
15 22.1%
0 3
0 391
Total % of Total
0 68
0 2
0 0
0 14
0 1
0 303
562
565
1127
26
3.24
Academic
Programs Offered
2015-20166
Degrees Awarded
2014-20157
231
104
65
4
0
Page 6 of 61
Fall 2015 Student Profile
Tyler School of ArtInstitutional Research & Assessment
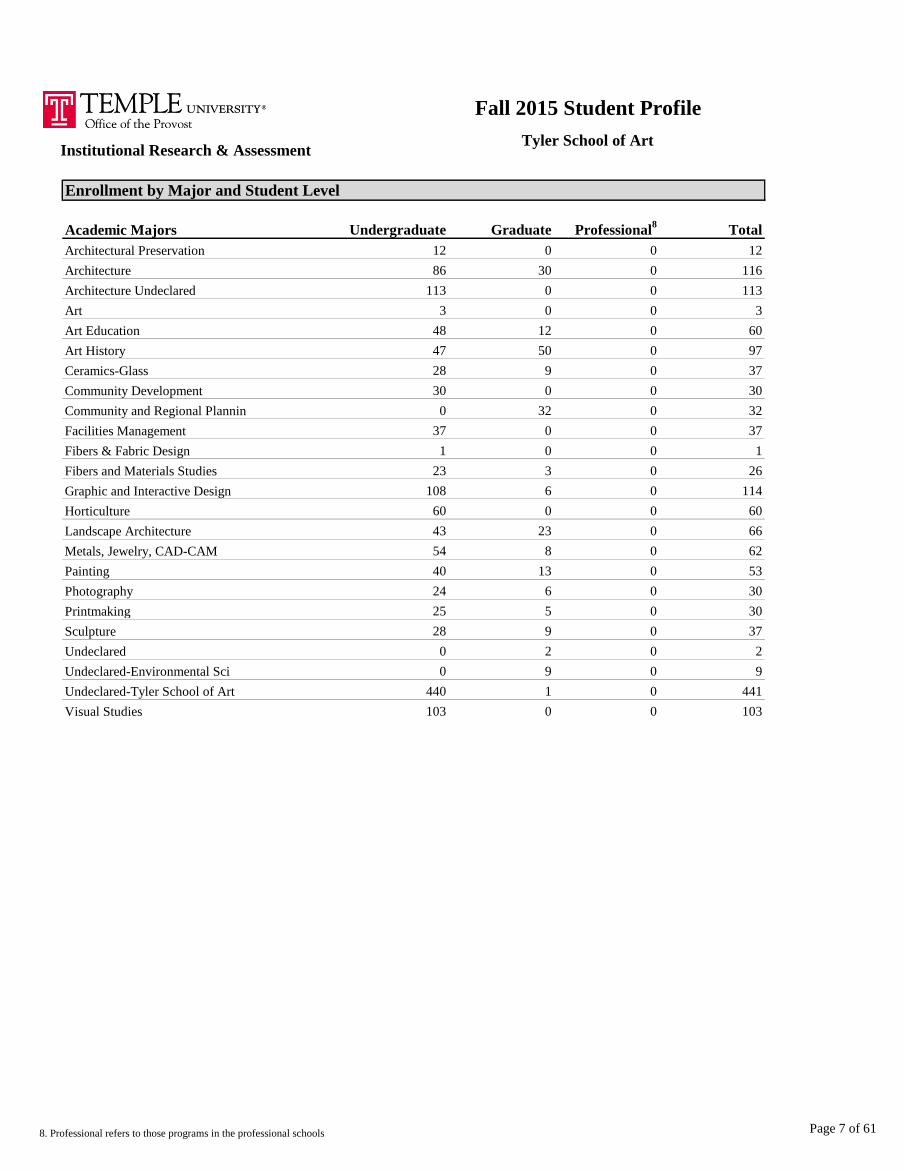
Enrollment by Major and Student Level
Academic Majors
Architectural Preservation
Architecture
Architecture Undeclared
Art
Art Education
Art History
Ceramics-Glass
Community Development
Community and Regional Plannin
Facilities Management
Fibers & Fabric Design
Fibers and Materials Studies
Graphic and Interactive Design
Horticulture
Landscape Architecture
Metals, Jewelry, CAD-CAM
Painting
Photography
Printmaking
Sculpture
Undeclared
Undeclared-Environmental Sci
Undeclared-Tyler School of Art
Visual Studies
8. Professional refers to those programs in the professional schools
0 0 0 0
0 0 0 0
0 0 0 0
0 0 0 0
0 0 0 0
0 0 0 0
0 0 0 0
0 0 0 0
0 0 0 0
0 0 0 0
0 0 0 0
0 0 0 0
0 0 0 0
0 0 0 0
0 0 0 0
0 0 0 0
0 0 0 0
440 1 0 441
103 0 0 103
0 2 0 2
0 9 0 9
25 5 0 30
28 9 0 37
40 13 0 53
24 6 0 30
43 23 0 66
54 8 0 62
108 6 0 114
60 0 0 60
1 0 0 1
23 3 0 26
0 32 0 32
37 0 0 37
28 9 0 37
30 0 0 30
48 12 0 60
47 50 0 97
113 0 0 113
3 0 0 3
12 0 0 12
86 30 0 116
Undergraduate Graduate Professional8
Total
Page 7 of 61

Enrollment
Total Enrollment3
Full-Time
Part-Time
Full-Time Equivalent (FTE) Students4
Enrollment by Class Level
Total Undergraduates
High Seniors (120+ Credit Hours)
Seniors
Juniors
Sophomores
Freshmen
Undergraduate Non-Degree Seeking (Certificate)
Undergraduate Non-Degree (Other)
Total Graduate/Professional
Master's Level
Doctoral-Research
Doctoral-Practice
Graduate Non-Degree (Certificate)
Graduate Non-Degree (Other)
Enrollment by Race/Ethnicity
American Indian/Alaska Native
Asian
African-American
Hispanic/Latino
Pacific Islander
White
Two or More Races
Unknown/Other
International
Enrollment by Gender
Male
Female
Unreported
Enrollment by Pennsylvania Residency
Pennsylvania Resident
Non-Resident
Temple University Japan excluded from this report, except where indicated.
3. Enrollment figures are as of Census; Fall semester Drop/Add.
4. FTE is calculated as 1 FT + 1/3 PT. Students in Doctoral - Practice programs are considerd one FTE regardless of credit load.
5,743 71.4%
2,297 28.6%
3,074 38.2%
4 0.0%
Enrollment % of Total
Enrollment % of Total
4,962 61.7%
618 7.7%
1,141 14.2%
4,140 51.5%
176 2.2%
343 4.3%
8 0.1%
861 10.7%
737 9.2%
12
Enrollment % of Total
16 0.2%
1,379
1,160
139
49
19
1,819
1,480
1,199
0
0
7,097
6,661
478
1,685
Fall 2015 Student Profile
Fox School of Business and ManagementInstitutional Research & Assessment
8,040
6,626
1,414
Page 8 of 61

Fall 2015 Student Profile
Fox School of Business and ManagementInstitutional Research & Assessment
Admissions
Admissions Statistics
Incoming Students by Classifications
Freshmen
Transfers
Master's Level
Doctoral Level
Professional Schools
Academic Measures5
Incoming Freshmem
Average SAT Verbal/Reading Score
Average SAT Math Score
Average Combined SAT Score
Average ACT Composite Score
Incoming Transfers
Average GPA of Transfer Students (4.00 scale)
Degrees Awarded & Academic Programs
Academic Degree Programs by Degree Level
Including Temple University Japan (TUJ)
Post-secondary Certificate
Associates
Bachelors
Master's
Graduate Certificate
Doctoral-Practice
Doctoral-Scholarship/Research
Temple University Total
Faculty (excluding Temple University Japan)
Full-Time Faculty by Appointment
Tenured
Tenure Track
Non-Tenure Track
Temple University Total
5. Academic Measures calculated based on students newly admitted and enrolled for Fall 2015
6. TU Policy 02.60.01: Establishing, Restructuring and Terminating Academic Programs - last amended May 12, 2015
7. Degrees awarded between July 1, 2014 and June 30, 2015
186 100%
67 36.0%
31 16.7%
88 47.3%
3 13
65 1,732
Total % of Total
23 390
20 0
1 0
3 13
0 0
15 1,316
570
605
1175
26
3.06
Academic
Programs Offered
2015-20166
Degrees Awarded
2014-20157
881
651
566
59
0
Page 9 of 61

Fall 2015 Student Profile
Fox School of Business and ManagementInstitutional Research & Assessment
Enrollment by Major and Student Level
Academic Majors
Accountancy
Accounting
Actuarial Science
Business Administration
Business Management
Digital Innovation Marketing
Economics
Entrepreneurship
Entrprnrship & Innovation Mgt
Executive Program
Finance
Financial Analysis & Risk Mgmt
Financial Engineering
Financial Planning
Health Administration
Healthcare Innovation Mngt
Human Resource Management
IT Auditing & Cyber Security
Innovation Mgt & Entreprnrship
Innovation Strategy
International Business
Investment Management
Legal Studies
Management Information Systems
Marketing
Real Estate
Risk Management and Insurance
Statistics
Supply Chain Management
Undeclared-Business & Mngt
8. Professional refers to those programs in the professional schools
0 0 0 0
0 0 0 0
0 0 0 0
0 0 0 0
0 0 0 0
0 0 0 0
0 0 0 0
0 0 0 0
0 0 0 0
0 0 0 0
0 0 0 0
10 0 0 10
454 12 0 466
353 0 0 353
0 65 0 65
906 23 0 929
44 0 0 44
160 0 0 160
373 0 0 373
456 0 0 456
0 76 0 76
0 28 0 28
0 1 0 1
267 53 0 320
0 67 0 67
0 6 0 6
0 2 0 2
0 19 0 19
4 0 0 4
1072 0 0 1072
0 33 0 33
138 0 0 138
0 82 0 82
157 0 0 157
67 0 0 67
742 0 0 742
0 34 0 34
355 33 0 388
0 776 0 776
0 48 0 48
1103 21 0 1124
Undergraduate Graduate Professional8
Total
Page 10 of 61
Enrollment
Total Enrollment3
Full-Time
Part-Time
Full-Time Equivalent (FTE) Students4
Enrollment by Class Level
Total Undergraduates
High Seniors (120+ Credit Hours)
Seniors
Juniors
Sophomores
Freshmen
Undergraduate Non-Degree Seeking (Certificate)
Undergraduate Non-Degree (Other)
Total Graduate/Professional
Master's Level
Doctoral-Research
Doctoral-Practice
Graduate Non-Degree (Certificate)
Graduate Non-Degree (Other)
Enrollment by Race/Ethnicity
American Indian/Alaska Native
Asian
African-American
Hispanic/Latino
Pacific Islander
White
Two or More Races
Unknown/Other
International
Enrollment by Gender
Male
Female
Unreported
Enrollment by Pennsylvania Residency
Pennsylvania Resident
Non-Resident
Temple University Japan excluded from this report, except where indicated.
3. Enrollment figures are as of Census; Fall semester Drop/Add.
4. FTE is calculated as 1 FT + 1/3 PT. Students in Doctoral - Practice programs are considerd one FTE regardless of credit load.
286 44.9%
351 55.1%
299 46.9%
5 0.8%
Enrollment % of Total
Enrollment % of Total
333 52.3%
133 20.9%
35 5.5%
282 44.3%
1 0.2%
14 2.2%
0 0.0%
157 24.6%
15 2.4%
39
Enrollment % of Total
0 0.0%
637
4
0
559
35
0
0
0
0
0
611
N/A
0
0
Fall 2015 Student Profile
Maurice H. Kornberg School of DentistryInstitutional Research & Assessment
637
598
39
Page 11 of 61

Fall 2015 Student Profile
Maurice H. Kornberg School of DentistryInstitutional Research & Assessment
Admissions
Admissions Statistics
Incoming Students by Classifications
Freshmen
Transfers
Master's Level
Doctoral Level
Professional Schools
Academic Measures5
Incoming Freshmem
Average SAT Verbal/Reading Score
Average SAT Math Score
Average Combined SAT Score
Average ACT Composite Score
Incoming Transfers
Average GPA of Transfer Students (4.00 scale)
Degrees Awarded & Academic Programs
Academic Degree Programs by Degree Level
Including Temple University Japan (TUJ)
Post-secondary Certificate
Associates
Bachelors
Master's
Graduate Certificate
Doctoral-Practice
Doctoral-Scholarship/Research
Temple University Total
Faculty (excluding Temple University Japan)
Full-Time Faculty by Appointment
Tenured
Tenure Track
Non-Tenure Track
Temple University Total
5. Academic Measures calculated based on students newly admitted and enrolled for Fall 2015
6. TU Policy 02.60.01: Establishing, Restructuring and Terminating Academic Programs - last amended May 12, 2015
7. Degrees awarded between July 1, 2014 and June 30, 2015
64 100%
20 31.3%
2 3.1%
42 65.6%
0 0
9 179
Total % of Total
1 18
5 15
3 146
0 0
0 0
0 0
0
0
0
0
0.00
Academic
Programs Offered
2015-20166
Degrees Awarded
2014-20157
0
0
10
0
129
Page 12 of 61

Fall 2015 Student Profile
Maurice H. Kornberg School of DentistryInstitutional Research & Assessment
Enrollment by Major and Student Level
Academic Majors
Dental Public Health
Dentistry
Dentistry-Adv Faculty Program
Dentistry-Advanced Standing
Endodontics
Oral Biology
Orthodontics
Periodontics
Undeclared-Dentistry
8. Professional refers to those programs in the professional schools
0 0 0 0
0 0 0 0
0 0 0 0
0 0 0 0
0 0 0 0
0 0 0 0
0 0 0 0
0 0 0 0
0 0 0 0
0 0 0 0
0 0 0 0
0 0 0 0
0 0 0 0
0 0 0 0
0 0 0 0
0 0 0 0
0 0 0 0
0 0 0 0
0 0 0 0
0 0 0 0
0 0 0 0
0 0 0 0
0 0 0 0
0 0 0 0
0 0 0 0
0 0 0 0
0 0 0 0
0 0 0 0
0 0 0 0
0 0 0 0
0 0 0 0
0 39 0 39
0 0 0 0
0 12 0 12
0 12 0 12
0 10 0 10
0 4 0 4
0 0 1 1
0 0 25 25
0 1 0 1
0 0 533 533
Undergraduate Graduate Professional8
Total
Page 13 of 61
Enrollment
Total Enrollment3
Full-Time
Part-Time
Full-Time Equivalent (FTE) Students4
Enrollment by Class Level
Total Undergraduates
High Seniors (120+ Credit Hours)
Seniors
Juniors
Sophomores
Freshmen
Undergraduate Non-Degree Seeking (Certificate)
Undergraduate Non-Degree (Other)
Total Graduate/Professional
Master's Level
Doctoral-Research
Doctoral-Practice
Graduate Non-Degree (Certificate)
Graduate Non-Degree (Other)
Enrollment by Race/Ethnicity
American Indian/Alaska Native
Asian
African-American
Hispanic/Latino
Pacific Islander
White
Two or More Races
Unknown/Other
International
Enrollment by Gender
Male
Female
Unreported
Enrollment by Pennsylvania Residency
Pennsylvania Resident
Non-Resident
Temple University Japan excluded from this report, except where indicated.
3. Enrollment figures are as of Census; Fall semester Drop/Add.
4. FTE is calculated as 1 FT + 1/3 PT. Students in Doctoral - Practice programs are considerd one FTE regardless of credit load.
1,653 83.9%
318 16.1%
1,348 68.4%
7 0.4%
Enrollment % of Total
Enrollment % of Total
616 31.3%
237 12.0%
54 2.7%
1,155 58.6%
55 2.8%
95 4.8%
1 0.1%
86 4.4%
284 14.4%
109
Enrollment % of Total
4 0.2%
861
439
224
0
89
269
189
145
87
0
1,480
1,110
126
294
Fall 2015 Student Profile
College of EducationInstitutional Research & Assessment
1,971
1,235
736
Page 14 of 61

Fall 2015 Student Profile
College of EducationInstitutional Research & Assessment
Admissions
Admissions Statistics
Incoming Students by Classifications
Freshmen
Transfers
Master's Level
Doctoral Level
Professional Schools
Academic Measures5
Incoming Freshmem
Average SAT Verbal/Reading Score
Average SAT Math Score
Average Combined SAT Score
Average ACT Composite Score
Incoming Transfers
Average GPA of Transfer Students (4.00 scale)
Degrees Awarded & Academic Programs
Academic Degree Programs by Degree Level
Including Temple University Japan (TUJ)
Post-secondary Certificate
Associates
Bachelors
Master's
Graduate Certificate
Doctoral-Practice
Doctoral-Scholarship/Research
Temple University Total
Faculty (excluding Temple University Japan)
Full-Time Faculty by Appointment
Tenured
Tenure Track
Non-Tenure Track
Temple University Total
5. Academic Measures calculated based on students newly admitted and enrolled for Fall 2015
6. TU Policy 02.60.01: Establishing, Restructuring and Terminating Academic Programs - last amended May 12, 2015
7. Degrees awarded between July 1, 2014 and June 30, 2015
60 100%
30 50.0%
9 15.0%
21 35.0%
4 41
46 666
Total % of Total
19 248
12 50
0 0
1 1
0 0
10 326
561
559
1120
26
3.19
Academic
Programs Offered
2015-20166
Degrees Awarded
2014-20157
111
103
217
28
0
Page 15 of 61

Fall 2015 Student Profile
College of EducationInstitutional Research & Assessment
Enrollment by Major and Student Level
Academic Majors
Accomplished Teaching
Adult & Organizational Develop
Applied Behavioral Analysis
Applied Communications
Autism Endorsement
Career and Technical Education
Conflict Process
Counseling Psychology
Curr, Instruct and Tech in Edu
Early Childhood Education
Early Childhood and Spec Ed
Educ Admin--Jamaica
Education
Educational Administration
Educational Leadership
Educational Psychology
Elementary Education
English as a Second Language
Human Develop Commnty Engagemn
Instructional Learning Technlg
Leading & Learning Urban Schls
Middle Grades Education
School Psychology
Sec Ed-English Ed
Sec Ed-Math Ed
Sec Ed-Science Ed
Sec Ed-Social Studies
Sec Ed-World Langs Ed
Secondary Education
Special Education
Teaching in Higher Education
Training & Organizl Developmt
Undeclared
Undeclared-Education
Urban Education
8. Professional refers to those programs in the professional schools
0 0 0 0
0 0 0 0
0 0 0 0
0 0 0 0
0 0 0 0
0 39 0 39
0 0 0 0
0 2 0 2
0 106 0 106
0 2 0 2
0 7 0 7
0 41 0 41
0 29 0 29
125 0 0 125
29 0 0 29
23 0 0 23
3 0 0 3
0 51 0 51
112 0 0 112
0 1 0 1
50 13 0 63
57 0 0 57
0 7 0 7
1 0 0 1
0 1 0 1
0 108 0 108
0 47 0 47
0 146 0 146
0 34 0 34
0 7 0 7
0 18 0 18
0 3 0 3
480 3 0 483
0 2 0 2
0 64 0 64
0 1 0 1
99 70 0 169
0 14 0 14
1 0 0 1
0 1 0 1
130 44 0 174
Undergraduate Graduate Professional8
Total
Page 16 of 61

Enrollment
Total Enrollment3
Full-Time
Part-Time
Full-Time Equivalent (FTE) Students4
Enrollment by Class Level
Total Undergraduates
High Seniors (120+ Credit Hours)
Seniors
Juniors
Sophomores
Freshmen
Undergraduate Non-Degree Seeking (Certificate)
Undergraduate Non-Degree (Other)
Total Graduate/Professional
Master's Level
Doctoral-Research
Doctoral-Practice
Graduate Non-Degree (Certificate)
Graduate Non-Degree (Other)
Enrollment by Race/Ethnicity
American Indian/Alaska Native
Asian
African-American
Hispanic/Latino
Pacific Islander
White
Two or More Races
Unknown/Other
International
Enrollment by Gender
Male
Female
Unreported
Enrollment by Pennsylvania Residency
Pennsylvania Resident
Non-Resident
Temple University Japan excluded from this report, except where indicated.
3. Enrollment figures are as of Census; Fall semester Drop/Add.
4. FTE is calculated as 1 FT + 1/3 PT. Students in Doctoral - Practice programs are considerd one FTE regardless of credit load.
1,385 69.8%
600 30.2%
374 18.8%
8 0.4%
Enrollment % of Total
Enrollment % of Total
1,603 80.8%
130 6.5%
298 15.0%
993 50.0%
50 2.5%
92 4.6%
3 0.2%
210 10.6%
208 10.5%
7
Enrollment % of Total
1 0.1%
209
100
81
0
21
335
392
489
0
0
1,799
1,776
203
357
Fall 2015 Student Profile
College of EngineeringInstitutional Research & Assessment
1,985
1,706
279
Page 17 of 61

Fall 2015 Student Profile
College of EngineeringInstitutional Research & Assessment
Admissions
Admissions Statistics
Incoming Students by Classifications
Freshmen
Transfers
Master's Level
Doctoral Level
Professional Schools
Academic Measures5
Incoming Freshmem
Average SAT Verbal/Reading Score
Average SAT Math Score
Average Combined SAT Score
Average ACT Composite Score
Incoming Transfers
Average GPA of Transfer Students (4.00 scale)
Degrees Awarded & Academic Programs
Academic Degree Programs by Degree Level
Including Temple University Japan (TUJ)
Post-secondary Certificate
Associates
Bachelors
Master's
Graduate Certificate
Doctoral-Practice
Doctoral-Scholarship/Research
Temple University Total
Faculty (excluding Temple University Japan)
Full-Time Faculty by Appointment
Tenured
Tenure Track
Non-Tenure Track
Temple University Total
5. Academic Measures calculated based on students newly admitted and enrolled for Fall 2015
6. TU Policy 02.60.01: Establishing, Restructuring and Terminating Academic Programs - last amended May 12, 2015
7. Degrees awarded between July 1, 2014 and June 30, 2015
68 100%
27 39.7%
17 25.0%
24 35.3%
6 7
22 270
Total % of Total
6 25
2 0
0 0
0 0
0 0
8 238
575
624
1200
27
2.99
Academic
Programs Offered
2015-20166
Degrees Awarded
2014-20157
374
139
34
19
0
Page 18 of 61

Fall 2015 Student Profile
College of EngineeringInstitutional Research & Assessment
Enrollment by Major and Student Level
Academic Majors
Bioengineering
Civil Engineering
Construction Mgt Tech
Electrical Engineering
Engineering
Engineering Mangement
Engineering Technology
Environmental Enginrng
Mechanical Engineering
Undeclared-Engineering
8. Professional refers to those programs in the professional schools
0 0 0 0
0 0 0 0
0 0 0 0
0 0 0 0
0 0 0 0
0 0 0 0
0 0 0 0
0 0 0 0
0 0 0 0
0 0 0 0
0 0 0 0
0 0 0 0
0 0 0 0
0 0 0 0
0 0 0 0
0 0 0 0
0 0 0 0
0 0 0 0
0 0 0 0
0 0 0 0
0 0 0 0
0 0 0 0
0 0 0 0
0 0 0 0
0 0 0 0
0 0 0 0
0 0 0 0
0 0 0 0
0 0 0 0
0 0 0 0
0 0 0 0
535 20 0 555
67 7 0 74
95 0 0 95
3 18 0 21
141 47 0 188
0 31 0 31
104 0 0 104
291 45 0 336
197 23 0 220
343 18 0 361
Undergraduate Graduate Professional8
Total
Page 19 of 61

Enrollment
Total Enrollment3
Full-Time
Part-Time
Full-Time Equivalent (FTE) Students4
Enrollment by Class Level
Total Undergraduates
High Seniors (120+ Credit Hours)
Seniors
Juniors
Sophomores
Freshmen
Undergraduate Non-Degree Seeking (Certificate)
Undergraduate Non-Degree (Other)
Total Graduate/Professional
Master's Level
Doctoral-Research
Doctoral-Practice
Graduate Non-Degree (Certificate)
Graduate Non-Degree (Other)
Enrollment by Race/Ethnicity
American Indian/Alaska Native
Asian
African-American
Hispanic/Latino
Pacific Islander
White
Two or More Races
Unknown/Other
International
Enrollment by Gender
Male
Female
Unreported
Enrollment by Pennsylvania Residency
Pennsylvania Resident
Non-Resident
Temple University Japan excluded from this report, except where indicated.
3. Enrollment figures are as of Census; Fall semester Drop/Add.
4. FTE is calculated as 1 FT + 1/3 PT. Students in Doctoral - Practice programs are considerd one FTE regardless of credit load.
888
N/A
0
0
Fall 2015 Student Profile
Beasley School of LawInstitutional Research & Assessment
926
799
127
926
188
9
696
3
0
0
0
0
0
68 7.3%
77 8.3%
30
Enrollment % of Total
2 0.2%
551 59.5%
6 0.6%
52 5.6%
0 0.0%
Enrollment % of Total
470 50.8%
15 1.6%
155 16.7%
575 62.1%
351 37.9%
448 48.4%
8 0.9%
Enrollment % of Total
Page 20 of 61

Fall 2015 Student Profile
Beasley School of LawInstitutional Research & Assessment
Admissions
Admissions Statistics
Incoming Students by Classifications
Freshmen
Transfers
Master's Level
Doctoral Level
Professional Schools
Academic Measures5
Incoming Freshmem
Average SAT Verbal/Reading Score
Average SAT Math Score
Average Combined SAT Score
Average ACT Composite Score
Incoming Transfers
Average GPA of Transfer Students (4.00 scale)
Degrees Awarded & Academic Programs
Academic Degree Programs by Degree Level
Including Temple University Japan (TUJ)
Post-secondary Certificate
Associates
Bachelors
Master's
Graduate Certificate
Doctoral-Practice
Doctoral-Scholarship/Research
Temple University Total
Faculty (excluding Temple University Japan)
Full-Time Faculty by Appointment
Tenured
Tenure Track
Non-Tenure Track
Temple University Total
5. Academic Measures calculated based on students newly admitted and enrolled for Fall 2015
6. TU Policy 02.60.01: Establishing, Restructuring and Terminating Academic Programs - last amended May 12, 2015
7. Degrees awarded between July 1, 2014 and June 30, 2015
0
0
0
0
0.00
Academic
Programs Offered
2015-20166
Degrees Awarded
2014-20157
0
0
0
0
217
8 142
6 2
1 245
0 0
0 0
0 0
39 61.9%
2 3.2%
22 34.9%
1 2
16 391
Total % of Total
63 100%
Page 21 of 61

Fall 2015 Student Profile
Beasley School of LawInstitutional Research & Assessment
Enrollment by Major and Student Level
Academic Majors
American-Internl Law--China
American-Internl law
American-Intl Law--Transnation
Employee Benefits Law
Estate Planning
Graduate Tax
Law
Law--Cross Registration
Law--Full Time
Law--Part Time
Master of Laws Legal Education
Trial Advocacy
8. Professional refers to those programs in the professional schools
0 92 0 92
0 37 0 37
Undergraduate Graduate Professional8
Total
0 5 0 5
0 36 0 36
0 2 0 2
0 3 0 3
0 0 535 535
0 0 142 142
0 9 14 23
0 22 5 27
0 0 0 0
0 0 0 0
0 2 0 2
0 22 0 22
0 0 0 0
0 0 0 0
0 0 0 0
0 0 0 0
0 0 0 0
0 0 0 0
0 0 0 0
0 0 0 0
0 0 0 0
0 0 0 0
0 0 0 0
0 0 0 0
0 0 0 0
0 0 0 0
0 0 0 0
0 0 0 0
0 0 0 0
0 0 0 0
0 0 0 0
0 0 0 0
0 0 0 0
0 0 0 0
0 0 0 0
0 0 0 0
0 0 0 0
0 0 0 0
0 0 0 0
Page 22 of 61

Enrollment
Total Enrollment3
Full-Time
Part-Time
Full-Time Equivalent (FTE) Students4
Enrollment by Class Level
Total Undergraduates
High Seniors (120+ Credit Hours)
Seniors
Juniors
Sophomores
Freshmen
Undergraduate Non-Degree Seeking (Certificate)
Undergraduate Non-Degree (Other)
Total Graduate/Professional
Master's Level
Doctoral-Research
Doctoral-Practice
Graduate Non-Degree (Certificate)
Graduate Non-Degree (Other)
Enrollment by Race/Ethnicity
American Indian/Alaska Native
Asian
African-American
Hispanic/Latino
Pacific Islander
White
Two or More Races
Unknown/Other
International
Enrollment by Gender
Male
Female
Unreported
Enrollment by Pennsylvania Residency
Pennsylvania Resident
Non-Resident
Temple University Japan excluded from this report, except where indicated.
3. Enrollment figures are as of Census; Fall semester Drop/Add.
4. FTE is calculated as 1 FT + 1/3 PT. Students in Doctoral - Practice programs are considerd one FTE regardless of credit load.
3,812 75.3%
1,253 24.7%
3,009 59.4%
6 0.1%
Enrollment % of Total
Enrollment % of Total
2,050 40.5%
253 5.0%
161 3.2%
2,870 56.7%
180 3.6%
429 8.5%
6 0.1%
305 6.0%
855 16.9%
17
Enrollment % of Total
6 0.1%
712
139
556
0
0
1,226
1,006
838
0
0
4,695
4,353
173
1,110
Fall 2015 Student Profile
College of Liberal ArtsInstitutional Research & Assessment
5,065
4,510
555
Page 23 of 61

Fall 2015 Student Profile
College of Liberal ArtsInstitutional Research & Assessment
Admissions
Admissions Statistics
Incoming Students by Classifications
Freshmen
Transfers
Master's Level
Doctoral Level
Professional Schools
Academic Measures5
Incoming Freshmem
Average SAT Verbal/Reading Score
Average SAT Math Score
Average Combined SAT Score
Average ACT Composite Score
Incoming Transfers
Average GPA of Transfer Students (4.00 scale)
Degrees Awarded & Academic Programs
Academic Degree Programs by Degree Level
Including Temple University Japan (TUJ)
Post-secondary Certificate
Associates
Bachelors
Master's
Graduate Certificate
Doctoral-Practice
Doctoral-Scholarship/Research
Temple University Total
Faculty (excluding Temple University Japan)
Full-Time Faculty by Appointment
Tenured
Tenure Track
Non-Tenure Track
Temple University Total
5. Academic Measures calculated based on students newly admitted and enrolled for Fall 2015
6. TU Policy 02.60.01: Establishing, Restructuring and Terminating Academic Programs - last amended May 12, 2015
7. Degrees awarded between July 1, 2014 and June 30, 2015
400 100%
183 45.8%
52 13.0%
165 41.3%
14 65
71 1,600
Total % of Total
16 84
3 3
0 0
4 73
1 5
33 1,370
587
564
1151
26
3.10
Academic
Programs Offered
2015-20166
Degrees Awarded
2014-20157
667
437
57
76
0
Page 24 of 61

Fall 2015 Student Profile
College of Liberal ArtsInstitutional Research & Assessment
Enrollment by Major and Student Level
Academic Majors
African American Studies
American Studies
Anthropology
Asian Studies
Classics
Creative Writing
Criminal Justice
Economics
English
Environmental Studies
French
General Program
Geographic Information Systems
Geography/Urban Studies
German
Global Studies
Greek and Roman Classics
History
Interdisplinary--CLA
International Affairs
Italian
Jewish Studies
Latin American Studies
Liberal Arts
Liberal Studies
Mathematical Economics
Neuroscience
Philosophy
Political Science
Psychological Studies
Psychology
Psychology Neuroscience
Religion
Russian
Sociology
Spanish
Undeclared-Liberal Arts
Urban Studies
Womens Studies
8. Professional refers to those programs in the professional schools
0 0 0 0
28 0 0 28
0 0 0 0
241 17 0 258
0 1 0 1
119 39 0 158
62 38 0 100
17 54 0 71
1 0 0 1
1327 97 0 1424
0 5 0 5
412 45 0 457
2 0 0 2
246 0 0 246
69 43 0 112
13 0 0 13
9 0 0 9
6 0 0 6
0 20 0 20
4 0 0 4
3 0 0 3
1 0 0 1
3 0 0 3
2 0 0 2
176 82 0 258
6 0 0 6
40 0 0 40
0 8 0 8
66 29 0 95
12 0 0 12
1 0 0 1
357 56 0 413
98 0 0 98
708 35 0 743
113 55 0 168
10 0 0 10
0 23 0 23
136 37 0 173
32 0 0 32
28 28 0 56
5 0 0 5
Undergraduate Graduate Professional8
Total
Page 25 of 61

Enrollment
Total Enrollment3
Full-Time
Part-Time
Full-Time Equivalent (FTE) Students4
Enrollment by Class Level
Total Undergraduates
High Seniors (120+ Credit Hours)
Seniors
Juniors
Sophomores
Freshmen
Undergraduate Non-Degree Seeking (Certificate)
Undergraduate Non-Degree (Other)
Total Graduate/Professional
Master's Level
Doctoral-Research
Doctoral-Practice
Graduate Non-Degree (Certificate)
Graduate Non-Degree (Other)
Enrollment by Race/Ethnicity
American Indian/Alaska Native
Asian
African-American
Hispanic/Latino
Pacific Islander
White
Two or More Races
Unknown/Other
International
Enrollment by Gender
Male
Female
Unreported
Enrollment by Pennsylvania Residency
Pennsylvania Resident
Non-Resident
Temple University Japan excluded from this report, except where indicated.
3. Enrollment figures are as of Census; Fall semester Drop/Add.
4. FTE is calculated as 1 FT + 1/3 PT. Students in Doctoral - Practice programs are considerd one FTE regardless of credit load.
2,182 75.4%
713 24.6%
1,737 60.0%
1 0.0%
Enrollment % of Total
Enrollment % of Total
1,157 40.0%
132 4.6%
104 3.6%
1,811 62.6%
96 3.3%
189 6.5%
2 0.1%
97 3.4%
464 16.0%
15
Enrollment % of Total
0 0.0%
136
68
53
0
0
738
635
495
0
0
2,732
2,759
105
786
Fall 2015 Student Profile
School of Media and CommunicationInstitutional Research & Assessment
2,895
2,650
245
Page 26 of 61

Fall 2015 Student Profile
School of Media and CommunicationInstitutional Research & Assessment
Admissions
Admissions Statistics
Incoming Students by Classifications
Freshmen
Transfers
Master's Level
Doctoral Level
Professional Schools
Academic Measures5
Incoming Freshmem
Average SAT Verbal/Reading Score
Average SAT Math Score
Average Combined SAT Score
Average ACT Composite Score
Incoming Transfers
Average GPA of Transfer Students (4.00 scale)
Degrees Awarded & Academic Programs
Academic Degree Programs by Degree Level
Including Temple University Japan (TUJ)
Post-secondary Certificate
Associates
Bachelors
Master's
Graduate Certificate
Doctoral-Practice
Doctoral-Scholarship/Research
Temple University Total
Faculty (excluding Temple University Japan)
Full-Time Faculty by Appointment
Tenured
Tenure Track
Non-Tenure Track
Temple University Total
5. Academic Measures calculated based on students newly admitted and enrolled for Fall 2015
6. TU Policy 02.60.01: Establishing, Restructuring and Terminating Academic Programs - last amended May 12, 2015
7. Degrees awarded between July 1, 2014 and June 30, 2015
66 100%
20 30.3%
14 21.2%
32 48.5%
1 3
11 873
Total % of Total
4 26
1 0
0 0
0 0
0 0
5 844
578
556
1134
25
3.13
Academic
Programs Offered
2015-20166
Degrees Awarded
2014-20157
359
242
30
9
0
Page 27 of 61

Fall 2015 Student Profile
School of Media and CommunicationInstitutional Research & Assessment
Enrollment by Major and Student Level
Academic Majors
Advertising
Broadcasting/Telecom/Mass Medi
Communication Management
Communication Studies
Communications
Globaliztn & Dev Communication
Journalism
Mass Media and Communication
Media & Communication
Media Studies and Production
Strategic Communication
Strategic-Organizational Comm
Theater
Undeclared
Undeclared-Media and Comm
8. Professional refers to those programs in the professional schools
0 0 0 0
0 0 0 0
0 0 0 0
0 0 0 0
0 0 0 0
0 0 0 0
0 0 0 0
0 0 0 0
0 0 0 0
0 0 0 0
0 0 0 0
0 0 0 0
0 0 0 0
0 0 0 0
0 0 0 0
0 0 0 0
0 0 0 0
0 0 0 0
0 0 0 0
0 0 0 0
0 0 0 0
0 0 0 0
0 0 0 0
0 0 0 0
0 0 0 0
48 6 0 54
0 0 0 0
2 0 0 2
0 9 0 9
450 0 0 450
4 0 0 4
0 16 0 16
804 19 0 823
537 14 0 551
0 37 0 37
3 0 0 3
0 8 0 8
0 27 0 27
363 0 0 363
472 0 0 472
76 0 0 76
Undergraduate Graduate Professional8
Total
Page 28 of 61

Enrollment
Total Enrollment3
Full-Time
Part-Time
Full-Time Equivalent (FTE) Students4
Enrollment by Class Level
Total Undergraduates
High Seniors (120+ Credit Hours)
Seniors
Juniors
Sophomores
Freshmen
Undergraduate Non-Degree Seeking (Certificate)
Undergraduate Non-Degree (Other)
Total Graduate/Professional
Master's Level
Doctoral-Research
Doctoral-Practice
Graduate Non-Degree (Certificate)
Graduate Non-Degree (Other)
Enrollment by Race/Ethnicity
American Indian/Alaska Native
Asian
African-American
Hispanic/Latino
Pacific Islander
White
Two or More Races
Unknown/Other
International
Enrollment by Gender
Male
Female
Unreported
Enrollment by Pennsylvania Residency
Pennsylvania Resident
Non-Resident
Temple University Japan excluded from this report, except where indicated.
3. Enrollment figures are as of Census; Fall semester Drop/Add.
4. FTE is calculated as 1 FT + 1/3 PT. Students in Doctoral - Practice programs are considerd one FTE regardless of credit load.
591 56.1%
462 43.9%
505 48.0%
1 0.1%
Enrollment % of Total
Enrollment % of Total
547 51.9%
60 5.7%
36 3.4%
598 56.8%
31 2.9%
87 8.3%
2 0.2%
192 18.2%
47 4.5%
42
Enrollment % of Total
0 0.0%
1,053
15
116
869
11
0
0
0
0
0
1,047
N/A
0
0
Fall 2015 Student Profile
Lewis Katz School of MedicineInstitutional Research & Assessment
1,053
1,032
21
Page 29 of 61

Fall 2015 Student Profile
Lewis Katz School of MedicineInstitutional Research & Assessment
Admissions
Admissions Statistics
Incoming Students by Classifications
Freshmen
Transfers
Master's Level
Doctoral Level
Professional Schools
Academic Measures5
Incoming Freshmem
Average SAT Verbal/Reading Score
Average SAT Math Score
Average Combined SAT Score
Average ACT Composite Score
Incoming Transfers
Average GPA of Transfer Students (4.00 scale)
Degrees Awarded & Academic Programs
Academic Degree Programs by Degree Level
Including Temple University Japan (TUJ)
Post-secondary Certificate
Associates
Bachelors
Master's
Graduate Certificate
Doctoral-Practice
Doctoral-Scholarship/Research
Temple University Total
Faculty (excluding Temple University Japan)
Full-Time Faculty by Appointment
Tenured
Tenure Track
Non-Tenure Track
Temple University Total
5. Academic Measures calculated based on students newly admitted and enrolled for Fall 2015
6. TU Policy 02.60.01: Establishing, Restructuring and Terminating Academic Programs - last amended May 12, 2015
7. Degrees awarded between July 1, 2014 and June 30, 2015
0 0%
0 0.0%
0 0.0%
0 0.0%
2 0
7 0
Total % of Total
3 0
1 0
1 0
0 0
0 0
0 0
0
0
0
0
0.00
Academic
Programs Offered
2015-20166
Degrees Awarded
2014-20157
0
0
0
0
210
Page 30 of 61

Fall 2015 Student Profile
Lewis Katz School of MedicineInstitutional Research & Assessment
Enrollment by Major and Student Level
Academic Majors
Advanced Core Medical Science
Basic Core Medical Science
Biochemistry
Biomedical Neuroscience
Biomedical Sciences
Cell Biology
Medicine
Medicine Combination
Microbiology-Immunology
Molecular Biology-Genetics
Molecular and Cellular Phys
Pathology
Pharmacology
Undeclared
Undeclared-Medicine
Urban Bioethics
8. Professional refers to those programs in the professional schools
0 0 0 0
0 0 0 0
0 0 0 0
0 0 0 0
0 0 0 0
0 0 0 0
0 0 0 0
0 0 0 0
0 0 0 0
0 0 0 0
0 0 0 0
0 0 0 0
0 0 0 0
0 0 0 0
0 0 0 0
0 0 0 0
0 0 0 0
0 0 0 0
0 0 0 0
0 0 0 0
0 0 0 0
0 0 0 0
0 0 0 0
0 0 0 0
0 0 0 0
0 3 0 3
0 18 0 18
0 4 0 4
0 6 0 6
0 2 0 2
0 1 0 1
0 7 0 7
0 5 0 5
0 0 856 856
0 0 13 13
0 97 0 97
0 1 0 1
0 5 0 5
0 2 0 2
0 28 0 28
0 5 0 5
Undergraduate Graduate Professional8
Total
Page 31 of 61

Enrollment
Total Enrollment3
Full-Time
Part-Time
Full-Time Equivalent (FTE) Students4
Enrollment by Class Level
Total Undergraduates
High Seniors (120+ Credit Hours)
Seniors
Juniors
Sophomores
Freshmen
Undergraduate Non-Degree Seeking (Certificate)
Undergraduate Non-Degree (Other)
Total Graduate/Professional
Master's Level
Doctoral-Research
Doctoral-Practice
Graduate Non-Degree (Certificate)
Graduate Non-Degree (Other)
Enrollment by Race/Ethnicity
American Indian/Alaska Native
Asian
African-American
Hispanic/Latino
Pacific Islander
White
Two or More Races
Unknown/Other
International
Enrollment by Gender
Male
Female
Unreported
Enrollment by Pennsylvania Residency
Pennsylvania Resident
Non-Resident
Temple University Japan excluded from this report, except where indicated.
3. Enrollment figures are as of Census; Fall semester Drop/Add.
4. FTE is calculated as 1 FT + 1/3 PT. Students in Doctoral - Practice programs are considerd one FTE regardless of credit load.
364 48.1%
392 51.9%
434 57.4%
0 0.0%
Enrollment % of Total
Enrollment % of Total
322 42.6%
43 5.7%
99 13.1%
441 58.3%
22 2.9%
45 6.0%
0 0.0%
41 5.4%
65 8.6%
10
Enrollment % of Total
0 0.0%
264
173
48
29
4
101
125
116
7
1
717
492
48
94
Fall 2015 Student Profile
Esther Boyer College of Music and DanceInstitutional Research & Assessment
756
697
59
Page 32 of 61

Fall 2015 Student Profile
Esther Boyer College of Music and DanceInstitutional Research & Assessment
Admissions
Admissions Statistics
Incoming Students by Classifications
Freshmen
Transfers
Master's Level
Doctoral Level
Professional Schools
Academic Measures5
Incoming Freshmem
Average SAT Verbal/Reading Score
Average SAT Math Score
Average Combined SAT Score
Average ACT Composite Score
Incoming Transfers
Average GPA of Transfer Students (4.00 scale)
Degrees Awarded & Academic Programs
Academic Degree Programs by Degree Level
Including Temple University Japan (TUJ)
Post-secondary Certificate
Associates
Bachelors
Master's
Graduate Certificate
Doctoral-Practice
Doctoral-Scholarship/Research
Temple University Total
Faculty (excluding Temple University Japan)
Full-Time Faculty by Appointment
Tenured
Tenure Track
Non-Tenure Track
Temple University Total
5. Academic Measures calculated based on students newly admitted and enrolled for Fall 2015
6. TU Policy 02.60.01: Establishing, Restructuring and Terminating Academic Programs - last amended May 12, 2015
7. Degrees awarded between July 1, 2014 and June 30, 2015
55 100%
33 60.0%
11 20.0%
11 20.0%
4 5
36 188
Total % of Total
16 76
1 0
1 5
1 0
0 0
13 102
601
601
1202
27
3.57
Academic
Programs Offered
2015-20166
Degrees Awarded
2014-20157
103
22
78
20
0
Page 33 of 61
Fall 2015 Student Profile
Esther Boyer College of Music and DanceInstitutional Research & Assessment
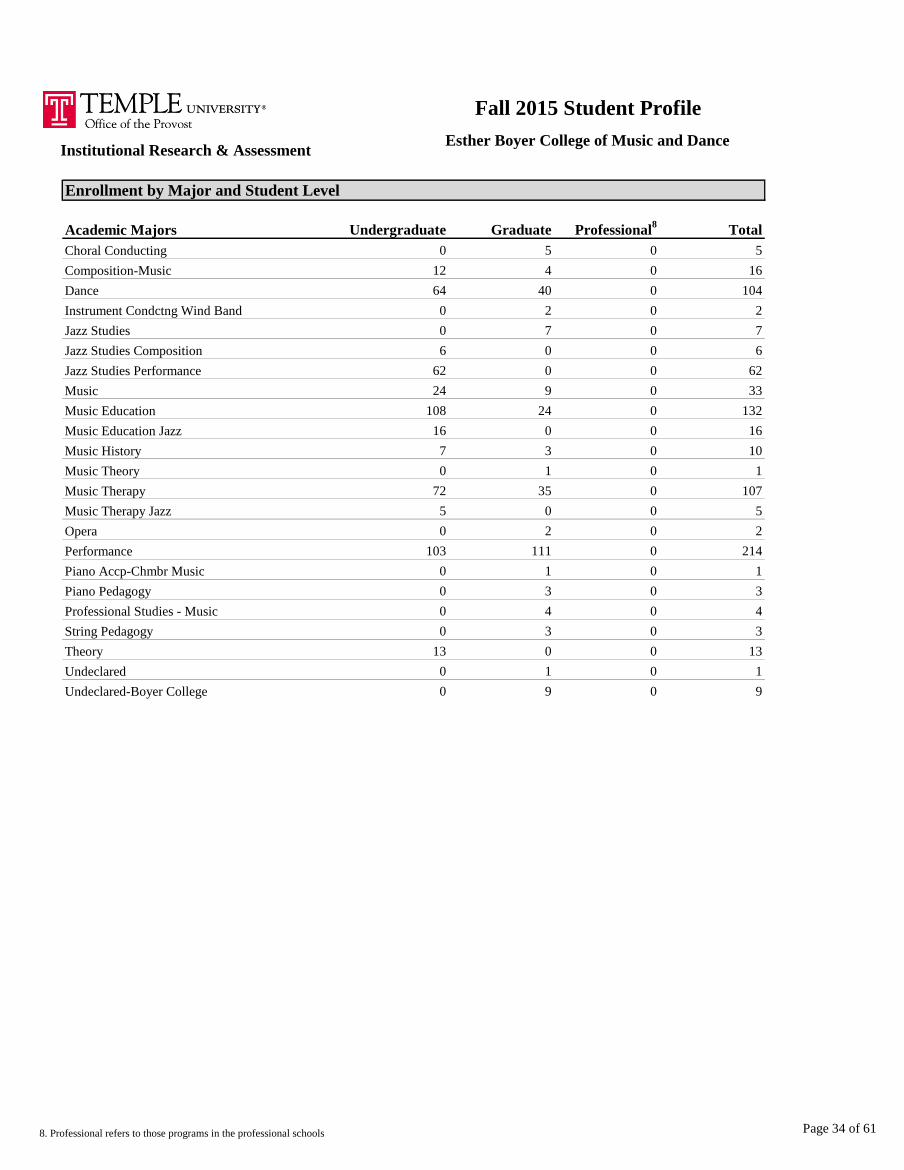
Enrollment by Major and Student Level
Academic Majors
Choral Conducting
Composition-Music
Dance
Instrument Condctng Wind Band
Jazz Studies
Jazz Studies Composition
Jazz Studies Performance
Music
Music Education
Music Education Jazz
Music History
Music Theory
Music Therapy
Music Therapy Jazz
Opera
Performance
Piano Accp-Chmbr Music
Piano Pedagogy
Professional Studies - Music
String Pedagogy
Theory
Undeclared
Undeclared-Boyer College
8. Professional refers to those programs in the professional schools
0 0 0 0
0 0 0 0
0 0 0 0
0 0 0 0
0 0 0 0
0 0 0 0
0 0 0 0
0 0 0 0
0 0 0 0
0 0 0 0
0 0 0 0
0 0 0 0
0 0 0 0
0 0 0 0
0 0 0 0
0 0 0 0
0 0 0 0
0 9 0 9
0 0 0 0
13 0 0 13
0 1 0 1
0 4 0 4
0 3 0 3
0 1 0 1
0 3 0 3
0 2 0 2
103 111 0 214
72 35 0 107
5 0 0 5
7 3 0 10
0 1 0 1
108 24 0 132
16 0 0 16
62 0 0 62
24 9 0 33
0 7 0 7
6 0 0 6
64 40 0 104
0 2 0 2
0 5 0 5
12 4 0 16
Undergraduate Graduate Professional8
Total
Page 34 of 61

Enrollment
Total Enrollment3
Full-Time
Part-Time
Full-Time Equivalent (FTE) Students4
Enrollment by Class Level
Total Undergraduates
High Seniors (120+ Credit Hours)
Seniors
Juniors
Sophomores
Freshmen
Undergraduate Non-Degree Seeking (Certificate)
Undergraduate Non-Degree (Other)
Total Graduate/Professional
Master's Level
Doctoral-Research
Doctoral-Practice
Graduate Non-Degree (Certificate)
Graduate Non-Degree (Other)
Enrollment by Race/Ethnicity
American Indian/Alaska Native
Asian
African-American
Hispanic/Latino
Pacific Islander
White
Two or More Races
Unknown/Other
International
Enrollment by Gender
Male
Female
Unreported
Enrollment by Pennsylvania Residency
Pennsylvania Resident
Non-Resident
Temple University Japan excluded from this report, except where indicated.
3. Enrollment figures are as of Census; Fall semester Drop/Add.
4. FTE is calculated as 1 FT + 1/3 PT. Students in Doctoral - Practice programs are considerd one FTE regardless of credit load.
598 66.9%
296 33.1%
396 44.3%
0 0.0%
Enrollment % of Total
Enrollment % of Total
498 55.7%
36 4.0%
64 7.2%
563 63.0%
39 4.4%
59 6.6%
0 0.0%
26 2.9%
105 11.7%
0
Enrollment % of Total
2 0.2%
59
59
0
0
0
193
200
209
0
0
859
835
30
203
Fall 2015 Student Profile
School of Theater, Film and Media ArtsInstitutional Research & Assessment
894
841
53
Page 35 of 61

Fall 2015 Student Profile
School of Theater, Film and Media ArtsInstitutional Research & Assessment
Admissions
Admissions Statistics
Incoming Students by Classifications
Freshmen
Transfers
Master's Level
Doctoral Level
Professional Schools
Academic Measures5
Incoming Freshmem
Average SAT Verbal/Reading Score
Average SAT Math Score
Average Combined SAT Score
Average ACT Composite Score
Incoming Transfers
Average GPA of Transfer Students (4.00 scale)
Degrees Awarded & Academic Programs
Academic Degree Programs by Degree Level
Including Temple University Japan (TUJ)
Post-secondary Certificate
Associates
Bachelors
Master's
Graduate Certificate
Doctoral-Practice
Doctoral-Scholarship/Research
Temple University Total
Faculty (excluding Temple University Japan)
Full-Time Faculty by Appointment
Tenured
Tenure Track
Non-Tenure Track
Temple University Total
5. Academic Measures calculated based on students newly admitted and enrolled for Fall 2015
6. TU Policy 02.60.01: Establishing, Restructuring and Terminating Academic Programs - last amended May 12, 2015
7. Degrees awarded between July 1, 2014 and June 30, 2015
37 100%
20 54.1%
4 10.8%
13 35.1%
0 0
10 241
Total % of Total
6 22
1 2
0 0
0 0
0 0
3 217
594
576
1170
26
3.13
Academic
Programs Offered
2015-20166
Degrees Awarded
2014-20157
163
73
21
0
0
Page 36 of 61

Fall 2015 Student Profile
School of Theater, Film and Media ArtsInstitutional Research & Assessment
Enrollment by Major and Student Level
Academic Majors
Film and Media Arts
Theater
Theater-Acting
Theater-Design
Theater-Directing
Theater-Playwriting
8. Professional refers to those programs in the professional schools
0 0 0 0
0 0 0 0
0 0 0 0
0 0 0 0
0 0 0 0
0 0 0 0
0 0 0 0
0 0 0 0
0 0 0 0
0 0 0 0
0 0 0 0
0 0 0 0
0 0 0 0
0 0 0 0
0 0 0 0
0 0 0 0
0 0 0 0
0 0 0 0
0 0 0 0
0 0 0 0
0 0 0 0
0 0 0 0
0 0 0 0
0 0 0 0
0 0 0 0
0 0 0 0
0 0 0 0
0 0 0 0
0 0 0 0
0 0 0 0
0 0 0 0
0 0 0 0
0 0 0 0
0 0 0 0
0 0 0 0
0 2 0 2
0 5 0 5
0 6 0 6
0 8 0 8
561 38 0 599
274 0 0 274
Undergraduate Graduate Professional8
Total
Page 37 of 61

Enrollment
Total Enrollment3
Full-Time
Part-Time
Full-Time Equivalent (FTE) Students4
Enrollment by Class Level
Total Undergraduates
High Seniors (120+ Credit Hours)
Seniors
Juniors
Sophomores
Freshmen
Undergraduate Non-Degree Seeking (Certificate)
Undergraduate Non-Degree (Other)
Total Graduate/Professional
Master's Level
Doctoral-Research
Doctoral-Practice
Graduate Non-Degree (Certificate)
Graduate Non-Degree (Other)
Enrollment by Race/Ethnicity
American Indian/Alaska Native
Asian
African-American
Hispanic/Latino
Pacific Islander
White
Two or More Races
Unknown/Other
International
Enrollment by Gender
Male
Female
Unreported
Enrollment by Pennsylvania Residency
Pennsylvania Resident
Non-Resident
Temple University Japan excluded from this report, except where indicated.
3. Enrollment figures are as of Census; Fall semester Drop/Add.
4. FTE is calculated as 1 FT + 1/3 PT. Students in Doctoral - Practice programs are considerd one FTE regardless of credit load.
528 57.1%
397 42.9%
540 58.4%
3 0.3%
Enrollment % of Total
Enrollment % of Total
382 41.3%
253 27.4%
159 17.2%
237 25.6%
45 4.9%
19 2.1%
0 0.0%
170 18.4%
41 4.4%
72
Enrollment % of Total
1 0.1%
925
211
27
588
27
0
0
0
0
0
740
N/A
0
0
Fall 2015 Student Profile
School of PharmacyInstitutional Research & Assessment
925
648
277
Page 38 of 61

Fall 2015 Student Profile
School of PharmacyInstitutional Research & Assessment
Admissions
Admissions Statistics
Incoming Students by Classifications
Freshmen
Transfers
Master's Level
Doctoral Level
Professional Schools
Academic Measures5
Incoming Freshmem
Average SAT Verbal/Reading Score
Average SAT Math Score
Average Combined SAT Score
Average ACT Composite Score
Incoming Transfers
Average GPA of Transfer Students (4.00 scale)
Degrees Awarded & Academic Programs
Academic Degree Programs by Degree Level
Including Temple University Japan (TUJ)
Post-secondary Certificate
Associates
Bachelors
Master's
Graduate Certificate
Doctoral-Practice
Doctoral-Scholarship/Research
Temple University Total
Faculty (excluding Temple University Japan)
Full-Time Faculty by Appointment
Tenured
Tenure Track
Non-Tenure Track
Temple University Total
5. Academic Measures calculated based on students newly admitted and enrolled for Fall 2015
6. TU Policy 02.60.01: Establishing, Restructuring and Terminating Academic Programs - last amended May 12, 2015
7. Degrees awarded between July 1, 2014 and June 30, 2015
43 100%
11 25.6%
4 9.3%
28 65.1%
1 1
16 229
Total % of Total
4 91
10 1
1 136
0 0
0 0
0 0
0
0
0
0
0.00
Academic
Programs Offered
2015-20166
Degrees Awarded
2014-20157
0
0
53
2
149
Page 39 of 61

Fall 2015 Student Profile
School of PharmacyInstitutional Research & Assessment
Enrollment by Major and Student Level
Academic Majors
Pharmaceutical Science
Pharmaceutics
Pharmacy
Qual Assur / Reg Affrs
Reg Affrs and Qual Assurance
Undeclared-Pharmacy
8. Professional refers to those programs in the professional schools
0 0 0 0
0 0 0 0
0 0 0 0
0 0 0 0
0 0 0 0
0 0 0 0
0 0 0 0
0 0 0 0
0 0 0 0
0 0 0 0
0 0 0 0
0 0 0 0
0 0 0 0
0 0 0 0
0 0 0 0
0 0 0 0
0 0 0 0
0 0 0 0
0 0 0 0
0 0 0 0
0 0 0 0
0 0 0 0
0 0 0 0
0 0 0 0
0 0 0 0
0 0 0 0
0 0 0 0
0 0 0 0
0 0 0 0
0 0 0 0
0 0 0 0
0 0 0 0
0 0 0 0
0 0 0 0
0 0 0 0
0 40 0 40
0 70 0 70
0 0 588 588
0 168 0 168
0 58 0 58
0 1 0 1
Undergraduate Graduate Professional8
Total
Page 40 of 61

Enrollment
Total Enrollment3
Full-Time
Part-Time
Full-Time Equivalent (FTE) Students4
Enrollment by Class Level
Total Undergraduates
High Seniors (120+ Credit Hours)
Seniors
Juniors
Sophomores
Freshmen
Undergraduate Non-Degree Seeking (Certificate)
Undergraduate Non-Degree (Other)
Total Graduate/Professional
Master's Level
Doctoral-Research
Doctoral-Practice
Graduate Non-Degree (Certificate)
Graduate Non-Degree (Other)
Enrollment by Race/Ethnicity
American Indian/Alaska Native
Asian
African-American
Hispanic/Latino
Pacific Islander
White
Two or More Races
Unknown/Other
International
Enrollment by Gender
Male
Female
Unreported
Enrollment by Pennsylvania Residency
Pennsylvania Resident
Non-Resident
Temple University Japan excluded from this report, except where indicated.
3. Enrollment figures are as of Census; Fall semester Drop/Add.
4. FTE is calculated as 1 FT + 1/3 PT. Students in Doctoral - Practice programs are considerd one FTE regardless of credit load.
67 18.3%
299 81.7%
151 41.3%
1 0.3%
Enrollment % of Total
Enrollment % of Total
214 58.5%
24 6.6%
7 1.9%
194 53.0%
1 0.3%
3 0.8%
1 0.3%
106 29.0%
29 7.9%
0
Enrollment % of Total
1 0.3%
366
0
0
366
0
0
0
0
0
0
366
N/A
0
0
Fall 2015 Student Profile
School of Podiatric MedicineInstitutional Research & Assessment
366
366
0
Page 41 of 61
Fall 2015 Student Profile
School of Podiatric MedicineInstitutional Research & Assessment
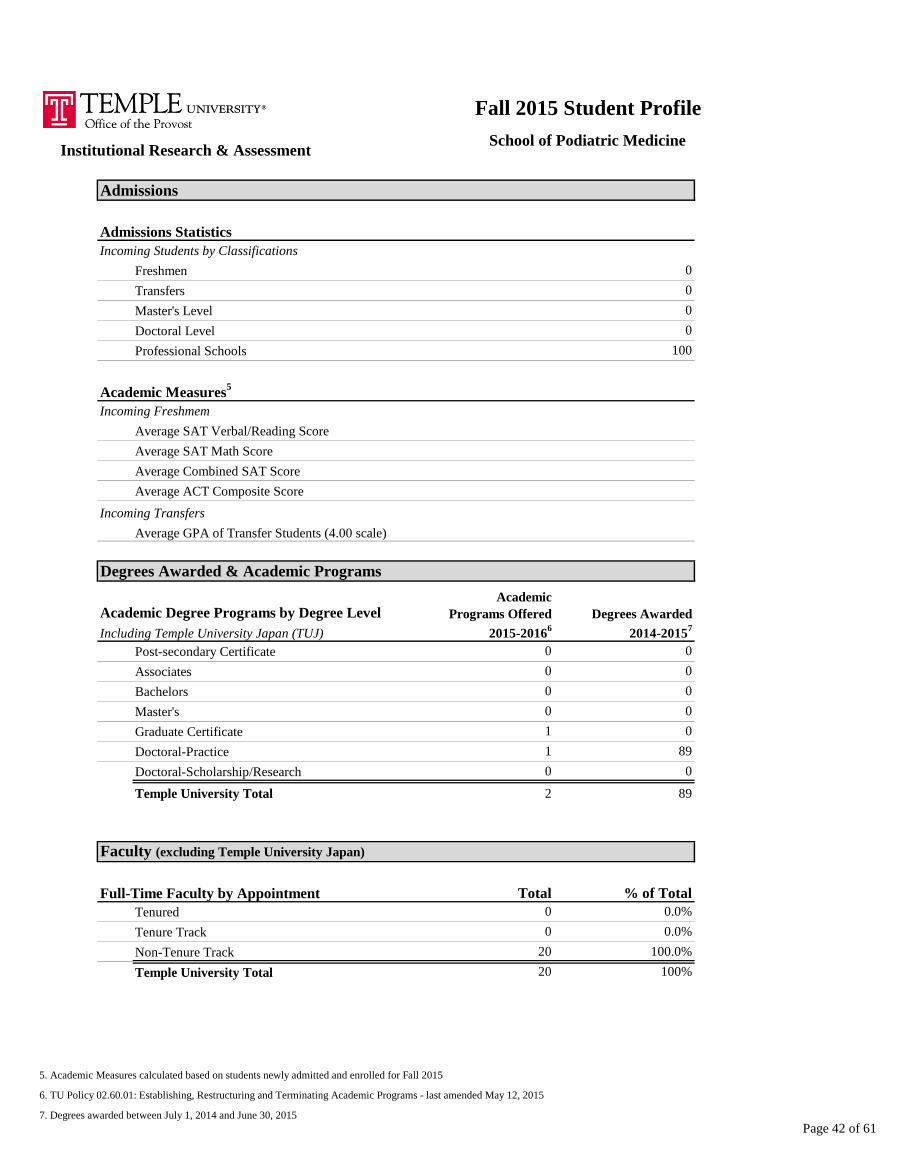
Admissions
Admissions Statistics
Incoming Students by Classifications
Freshmen
Transfers
Master's Level
Doctoral Level
Professional Schools
Academic Measures5
Incoming Freshmem
Average SAT Verbal/Reading Score
Average SAT Math Score
Average Combined SAT Score
Average ACT Composite Score
Incoming Transfers
Average GPA of Transfer Students (4.00 scale)
Degrees Awarded & Academic Programs
Academic Degree Programs by Degree Level
Including Temple University Japan (TUJ)
Post-secondary Certificate
Associates
Bachelors
Master's
Graduate Certificate
Doctoral-Practice
Doctoral-Scholarship/Research
Temple University Total
Faculty (excluding Temple University Japan)
Full-Time Faculty by Appointment
Tenured
Tenure Track
Non-Tenure Track
Temple University Total
5. Academic Measures calculated based on students newly admitted and enrolled for Fall 2015
6. TU Policy 02.60.01: Establishing, Restructuring and Terminating Academic Programs - last amended May 12, 2015
7. Degrees awarded between July 1, 2014 and June 30, 2015
20 100%
0 0.0%
0 0.0%
20 100.0%
0 0
2 89
Total % of Total
0 0
1 0
1 89
0 0
0 0
0 0
0
0
0
0
0.00
Academic
Programs Offered
2015-20166
Degrees Awarded
2014-20157
0
0
0
0
100
Page 42 of 61

Fall 2015 Student Profile
School of Podiatric MedicineInstitutional Research & Assessment
Enrollment by Major and Student Level
Academic Majors
Podiatric Medicine
8. Professional refers to those programs in the professional schools
0 0 0 0
0 0 0 0
0 0 0 0
0 0 0 0
0 0 0 0
0 0 0 0
0 0 0 0
0 0 0 0
0 0 0 0
0 0 0 0
0 0 0 0
0 0 0 0
0 0 0 0
0 0 0 0
0 0 0 0
0 0 0 0
0 0 0 0
0 0 0 0
0 0 0 0
0 0 0 0
0 0 0 0
0 0 0 0
0 0 0 0
0 0 0 0
0 0 0 0
0 0 0 0
0 0 0 0
0 0 0 0
0 0 0 0
0 0 0 0
0 0 0 0
0 0 0 0
0 0 0 0
0 0 0 0
0 0 0 0
0 0 0 0
0 0 0 0
0 0 0 0
0 0 0 0
0 0 366 366
0 0 0 0
Undergraduate Graduate Professional8
Total
Page 43 of 61

Enrollment
Total Enrollment3
Full-Time
Part-Time
Full-Time Equivalent (FTE) Students4
Enrollment by Class Level
Total Undergraduates
High Seniors (120+ Credit Hours)
Seniors
Juniors
Sophomores
Freshmen
Undergraduate Non-Degree Seeking (Certificate)
Undergraduate Non-Degree (Other)
Total Graduate/Professional
Master's Level
Doctoral-Research
Doctoral-Practice
Graduate Non-Degree (Certificate)
Graduate Non-Degree (Other)
Enrollment by Race/Ethnicity
American Indian/Alaska Native
Asian
African-American
Hispanic/Latino
Pacific Islander
White
Two or More Races
Unknown/Other
International
Enrollment by Gender
Male
Female
Unreported
Enrollment by Pennsylvania Residency
Pennsylvania Resident
Non-Resident
Temple University Japan excluded from this report, except where indicated.
3. Enrollment figures are as of Census; Fall semester Drop/Add.
4. FTE is calculated as 1 FT + 1/3 PT. Students in Doctoral - Practice programs are considerd one FTE regardless of credit load.
2,895 78.8%
778 21.2%
2,660 72.4%
8 0.2%
Enrollment % of Total
Enrollment % of Total
1,005 27.4%
172 4.7%
53 1.4%
2,173 59.2%
112 3.0%
207 5.6%
4 0.1%
445 12.1%
501 13.6%
82
Enrollment % of Total
6 0.2%
727
321
45
279
0
779
681
614
0
0
3,318
2,946
190
682
Fall 2015 Student Profile
College of Public Health (w/o Social Work)Institutional Research & Assessment
3,673
3,140
533
Page 44 of 61

Fall 2015 Student Profile
College of Public Health (w/o Social Work)Institutional Research & Assessment
Admissions
Admissions Statistics
Incoming Students by Classifications
Freshmen
Transfers
Master's Level
Doctoral Level
Professional Schools
Academic Measures5
Incoming Freshmem
Average SAT Verbal/Reading Score
Average SAT Math Score
Average Combined SAT Score
Average ACT Composite Score
Incoming Transfers
Average GPA of Transfer Students (4.00 scale)
Degrees Awarded & Academic Programs
Academic Degree Programs by Degree Level
Including Temple University Japan (TUJ)
Post-secondary Certificate
Associates
Bachelors
Master's
Graduate Certificate
Doctoral-Practice
Doctoral-Scholarship/Research
Temple University Total
Faculty (excluding Temple University Japan)
Full-Time Faculty by Appointment
Tenured
Tenure Track
Non-Tenure Track
Temple University Total
5. Academic Measures calculated based on students newly admitted and enrolled for Fall 2015
6. TU Policy 02.60.01: Establishing, Restructuring and Terminating Academic Programs - last amended May 12, 2015
7. Degrees awarded between July 1, 2014 and June 30, 2015
112 100%
24 21.4%
7 6.3%
81 72.3%
7 9
40 921
Total % of Total
13 146
6 10
5 100
1 0
0 0
8 656
558
568
1126
24
3.12
Academic
Programs Offered
2015-20166
Degrees Awarded
2014-20157
478
195
86
42
0
Page 45 of 61

Fall 2015 Student Profile
College of Public Health (w/o Social Work)Institutional Research & Assessment
Enrollment by Major and Student Level
Academic Majors
Athletic Training
Clinical Research Trans Medici
Communication Sciences
Epidemiology
Health Informatics
Health Information Management
Kinesiology
Linguistics
Neuromotor Science
Nursing
Nursing 4 Year
Occupational Therapy
Physical Therapy
Pre-Health Info Mgt
Public Health
Recreation Therapy
School Health Educ
Spch Lang Hearing Science
Therapeutic Recreation
Undeclared-Health Professions
8. Professional refers to those programs in the professional schools
0 0 0 0
0 0 0 0
0 0 0 0
0 0 0 0
0 0 0 0
0 0 0 0
0 0 0 0
0 0 0 0
0 0 0 0
0 0 0 0
0 0 0 0
0 0 0 0
0 0 0 0
0 0 0 0
0 0 0 0
0 0 0 0
0 0 0 0
0 0 0 0
0 0 0 0
0 0 0 0
0 0 0 0
209 0 0 209
96 82 0 178
0 1 0 1
292 67 0 359
385 57 0 442
0 22 0 22
0 205 0 205
59 0 0 59
381 0 0 381
0 96 0 96
0 7 0 7
0 68 0 68
1235 55 0 1290
56 0 0 56
0 45 0 45
83 0 0 83
0 5 0 5
0 12 0 12
150 0 0 150
0 5 0 5
Undergraduate Graduate Professional8
Total
Page 46 of 61

Enrollment
Total Enrollment3
Full-Time
Part-Time
Full-Time Equivalent (FTE) Students4
Enrollment by Class Level
Total Undergraduates
High Seniors (120+ Credit Hours)
Seniors
Juniors
Sophomores
Freshmen
Undergraduate Non-Degree Seeking (Certificate)
Undergraduate Non-Degree (Other)
Total Graduate/Professional
Master's Level
Doctoral-Research
Doctoral-Practice
Graduate Non-Degree (Certificate)
Graduate Non-Degree (Other)
Enrollment by Race/Ethnicity
American Indian/Alaska Native
Asian
African-American
Hispanic/Latino
Pacific Islander
White
Two or More Races
Unknown/Other
International
Enrollment by Gender
Male
Female
Unreported
Enrollment by Pennsylvania Residency
Pennsylvania Resident
Non-Resident
Temple University Japan excluded from this report, except where indicated.
3. Enrollment figures are as of Census; Fall semester Drop/Add.
4. FTE is calculated as 1 FT + 1/3 PT. Students in Doctoral - Practice programs are considerd one FTE regardless of credit load.
770 88.4%
101 11.6%
724 83.1%
1 0.1%
Enrollment % of Total
Enrollment % of Total
146 16.8%
30 3.4%
5 0.6%
467 53.6%
15 1.7%
80 9.2%
2 0.2%
17 2.0%
254 29.2%
43
Enrollment % of Total
1 0.1%
506
463
0
0
0
120
57
46
0
0
691
365
25
117
Fall 2015 Student Profile
School of Social WorkInstitutional Research & Assessment
871
601
270
Page 47 of 61

Fall 2015 Student Profile
School of Social WorkInstitutional Research & Assessment
Admissions
Admissions Statistics
Incoming Students by Classifications
Freshmen
Transfers
Master's Level
Doctoral Level
Professional Schools
Academic Measures5
Incoming Freshmem
Average SAT Verbal/Reading Score
Average SAT Math Score
Average Combined SAT Score
Average ACT Composite Score
Incoming Transfers
Average GPA of Transfer Students (4.00 scale)
Degrees Awarded & Academic Programs
Academic Degree Programs by Degree Level
Including Temple University Japan (TUJ)
Post-secondary Certificate
Associates
Bachelors
Master's
Graduate Certificate
Doctoral-Practice
Doctoral-Scholarship/Research
Temple University Total
Faculty (excluding Temple University Japan)
Full-Time Faculty by Appointment
Tenured
Tenure Track
Non-Tenure Track
Temple University Total
5. Academic Measures calculated based on students newly admitted and enrolled for Fall 2015
6. TU Policy 02.60.01: Establishing, Restructuring and Terminating Academic Programs - last amended May 12, 2015
7. Degrees awarded between July 1, 2014 and June 30, 2015
42 100%
15 35.7%
6 14.3%
21 50.0%
0 0
3 342
Total % of Total
1 219
1 5
0 0
0 0
0 0
1 118
581
564
1146
29
3.07
Academic
Programs Offered
2015-20166
Degrees Awarded
2014-20157
42
53
109
0
0
Page 48 of 61

Fall 2015 Student Profile
School of Social WorkInstitutional Research & Assessment
Enrollment by Major and Student Level
Academic Majors
Social Work
Social Work - Graduate
Social Work - Undergraduate
Undeclared-Social Work
8. Professional refers to those programs in the professional schools
0 0 0 0
0 0 0 0
0 0 0 0
0 0 0 0
0 0 0 0
0 0 0 0
0 0 0 0
0 0 0 0
0 0 0 0
0 0 0 0
0 0 0 0
0 0 0 0
0 0 0 0
0 0 0 0
0 0 0 0
0 0 0 0
0 0 0 0
0 0 0 0
0 0 0 0
0 0 0 0
0 0 0 0
0 0 0 0
0 0 0 0
0 0 0 0
0 0 0 0
0 0 0 0
0 0 0 0
0 0 0 0
0 0 0 0
0 0 0 0
0 0 0 0
0 0 0 0
0 0 0 0
0 0 0 0
0 0 0 0
0 0 0 0
0 0 0 0
363 0 0 363
0 43 0 43
2 10 0 12
0 453 0 453
Undergraduate Graduate Professional8
Total
Page 49 of 61

Enrollment
Total Enrollment3
Full-Time
Part-Time
Full-Time Equivalent (FTE) Students4
Enrollment by Class Level
Total Undergraduates
High Seniors (120+ Credit Hours)
Seniors
Juniors
Sophomores
Freshmen
Undergraduate Non-Degree Seeking (Certificate)
Undergraduate Non-Degree (Other)
Total Graduate/Professional
Master's Level
Doctoral-Research
Doctoral-Practice
Graduate Non-Degree (Certificate)
Graduate Non-Degree (Other)
Enrollment by Race/Ethnicity
American Indian/Alaska Native
Asian
African-American
Hispanic/Latino
Pacific Islander
White
Two or More Races
Unknown/Other
International
Enrollment by Gender
Male
Female
Unreported
Enrollment by Pennsylvania Residency
Pennsylvania Resident
Non-Resident
Temple University Japan excluded from this report, except where indicated.
3. Enrollment figures are as of Census; Fall semester Drop/Add.
4. FTE is calculated as 1 FT + 1/3 PT. Students in Doctoral - Practice programs are considerd one FTE regardless of credit load.
3,207 76.0%
1,012 24.0%
1,936 45.9%
2 0.0%
Enrollment % of Total
Enrollment % of Total
2,281 54.1%
212 5.0%
389 9.2%
1,849 43.8%
102 2.4%
231 5.5%
4 0.1%
973 23.1%
452 10.7%
0
Enrollment % of Total
7 0.2%
412
106
306
0
0
784
918
1,243
0
0
3,947
3,807
239
623
Fall 2015 Student Profile
College of Science and TechnologyInstitutional Research & Assessment
4,219
3,811
408
Page 50 of 61

Fall 2015 Student Profile
College of Science and TechnologyInstitutional Research & Assessment
Admissions
Admissions Statistics
Incoming Students by Classifications
Freshmen
Transfers
Master's Level
Doctoral Level
Professional Schools
Academic Measures5
Incoming Freshmem
Average SAT Verbal/Reading Score
Average SAT Math Score
Average Combined SAT Score
Average ACT Composite Score
Incoming Transfers
Average GPA of Transfer Students (4.00 scale)
Degrees Awarded & Academic Programs
Academic Degree Programs by Degree Level
Including Temple University Japan (TUJ)
Post-secondary Certificate
Associates
Bachelors
Master's
Graduate Certificate
Doctoral-Practice
Doctoral-Scholarship/Research
Temple University Total
Faculty (excluding Temple University Japan)
Full-Time Faculty by Appointment
Tenured
Tenure Track
Non-Tenure Track
Temple University Total
5. Academic Measures calculated based on students newly admitted and enrolled for Fall 2015
6. TU Policy 02.60.01: Establishing, Restructuring and Terminating Academic Programs - last amended May 12, 2015
7. Degrees awarded between July 1, 2014 and June 30, 2015
261 100%
97 37.2%
26 10.0%
138 52.9%
7 32
54 521
Total % of Total
11 49
2 0
0 0
2 0
0 0
32 440
576
602
1178
27
3.17
Academic
Programs Offered
2015-20166
Degrees Awarded
2014-20157
1,017
298
51
67
0
Page 51 of 61

Fall 2015 Student Profile
College of Science and TechnologyInstitutional Research & Assessment
Enrollment by Major and Student Level
Academic Majors
Applied Mathematics
Biochemistry
Bioinformatics
Bioinnovation
Biology
Biology with Teaching
Biophysics
Biotechnology
Chemistry
Chemistry with Teaching
Computer & Information Science
Computer Science
Earth & Space Sci with Teachin
Environmental Science
Forensic Chemistry
General Science with Teaching
Geology
Geoscience
Information Science & Technolo
Mathematical Economics
Mathematics
Mathematics & Comp Sci w/Teach
Mathematics with Teaching
Mathematics/Computer Science
Mathematics/Physics
Natural Sciences
Neuroscience
Neuroscience:Cell & Molecular
Pharmaceutical Science
Physics
Physics with Teaching
Pre-Pharmacy
Undeclared-Science and Technol
8. Professional refers to those programs in the professional schools
0 0 0 0
0 0 0 0
0 0 0 0
0 0 0 0
0 0 0 0
0 0 0 0
0 0 0 0
107 0 0 107
0 0 0 0
9 0 0 9
160 0 0 160
14 0 0 14
63 62 0 125
1 0 0 1
144 0 0 144
10 0 0 10
32 0 0 32
24 0 0 24
34 0 0 34
85 37 0 122
5 0 0 5
287 14 0 301
11 0 0 11
54 9 0 63
0 3 0 3
0 2 0 2
18 0 0 18
4 0 0 4
83 0 0 83
2 57 0 59
493 26 0 519
324 125 0 449
15 0 0 15
26 0 0 26
0 28 0 28
1442 31 0 1473
35 0 0 35
0 9 0 9
0 9 0 9
12 0 0 12
313 0 0 313
Undergraduate Graduate Professional8
Total
Page 52 of 61

Enrollment
Total Enrollment3
Full-Time
Part-Time
Full-Time Equivalent (FTE) Students4
Enrollment by Class Level
Total Undergraduates
High Seniors (120+ Credit Hours)
Seniors
Juniors
Sophomores
Freshmen
Undergraduate Non-Degree Seeking (Certificate)
Undergraduate Non-Degree (Other)
Total Graduate/Professional
Master's Level
Doctoral-Research
Doctoral-Practice
Graduate Non-Degree (Certificate)
Graduate Non-Degree (Other)
Enrollment by Race/Ethnicity
American Indian/Alaska Native
Asian
African-American
Hispanic/Latino
Pacific Islander
White
Two or More Races
Unknown/Other
International
Enrollment by Gender
Male
Female
Unreported
Enrollment by Pennsylvania Residency
Pennsylvania Resident
Non-Resident
Temple University Japan excluded from this report, except where indicated.
3. Enrollment figures are as of Census; Fall semester Drop/Add.
4. FTE is calculated as 1 FT + 1/3 PT. Students in Doctoral - Practice programs are considerd one FTE regardless of credit load.
680 74.2%
237 25.8%
423 46.1%
2 0.2%
Enrollment % of Total
Enrollment % of Total
492 53.7%
27 2.9%
50 5.5%
576 62.8%
22 2.4%
57 6.2%
1 0.1%
51 5.6%
133 14.5%
12
Enrollment % of Total
0 0.0%
87
75
0
0
0
195
175
220
0
0
868
830
35
205
Fall 2015 Student Profile
School of Tourism and Hospitality ManagementInstitutional Research & Assessment
917
844
73
Page 53 of 61

Fall 2015 Student Profile
School of Tourism and Hospitality ManagementInstitutional Research & Assessment
Admissions
Admissions Statistics
Incoming Students by Classifications
Freshmen
Transfers
Master's Level
Doctoral Level
Professional Schools
Academic Measures5
Incoming Freshmem
Average SAT Verbal/Reading Score
Average SAT Math Score
Average Combined SAT Score
Average ACT Composite Score
Incoming Transfers
Average GPA of Transfer Students (4.00 scale)
Degrees Awarded & Academic Programs
Academic Degree Programs by Degree Level
Including Temple University Japan (TUJ)
Post-secondary Certificate
Associates
Bachelors
Master's
Graduate Certificate
Doctoral-Practice
Doctoral-Scholarship/Research
Temple University Total
Faculty (excluding Temple University Japan)
Full-Time Faculty by Appointment
Tenured
Tenure Track
Non-Tenure Track
Temple University Total
5. Academic Measures calculated based on students newly admitted and enrolled for Fall 2015
6. TU Policy 02.60.01: Establishing, Restructuring and Terminating Academic Programs - last amended May 12, 2015
7. Degrees awarded between July 1, 2014 and June 30, 2015
21 100%
7 33.3%
7 33.3%
7 33.3%
0 0
9 234
Total % of Total
3 30
0 0
0 0
3 0
0 0
3 204
521
540
1061
23
3.00
Academic
Programs Offered
2015-20166
Degrees Awarded
2014-20157
171
77
32
0
0
Page 54 of 61

Fall 2015 Student Profile
School of Tourism and Hospitality ManagementInstitutional Research & Assessment
Enrollment by Major and Student Level
Academic Majors
Pre Business
Sport & Recreation Management
Sport Business
Tourism and Hospitality Mgmt
Undeclared-Tourism and Hospit
8. Professional refers to those programs in the professional schools
0 0 0 0
0 0 0 0
0 0 0 0
0 0 0 0
0 0 0 0
0 0 0 0
0 0 0 0
0 0 0 0
0 0 0 0
0 0 0 0
0 0 0 0
0 0 0 0
0 0 0 0
0 0 0 0
0 0 0 0
0 0 0 0
0 0 0 0
0 0 0 0
0 0 0 0
0 0 0 0
0 0 0 0
0 0 0 0
0 0 0 0
0 0 0 0
0 0 0 0
0 0 0 0
0 0 0 0
0 0 0 0
0 0 0 0
0 0 0 0
0 0 0 0
0 0 0 0
0 0 0 0
0 0 0 0
0 0 0 0
0 12 0 12
0 0 0 0
0 48 0 48
365 27 0 392
82 0 0 82
383 0 0 383
Undergraduate Graduate Professional8
Total
Page 55 of 61

Enrollment
Total Enrollment3
Full-Time
Part-Time
Full-Time Equivalent (FTE) Students4
Enrollment by Class Level
Total Undergraduates
High Seniors (120+ Credit Hours)
Seniors
Juniors
Sophomores
Freshmen
Undergraduate Non-Degree Seeking (Certificate)
Undergraduate Non-Degree (Other)
Total Graduate/Professional
Master's Level
Doctoral-Research
Doctoral-Practice
Graduate Non-Degree (Certificate)
Graduate Non-Degree (Other)
Enrollment by Race/Ethnicity
American Indian/Alaska Native
Asian
African-American
Hispanic/Latino
Pacific Islander
White
Two or More Races
Unknown/Other
International
Enrollment by Gender
Male
Female
Unreported
Enrollment by Pennsylvania Residency
Pennsylvania Resident
Non-Resident
Temple University Japan excluded from this report, except where indicated.
3. Enrollment figures are as of Census; Fall semester Drop/Add.
4. FTE is calculated as 1 FT + 1/3 PT. Students in Doctoral - Practice programs are considerd one FTE regardless of credit load.
16 88.9%
2 11.1%
12 66.7%
0 0.0%
Enrollment % of Total
Enrollment % of Total
6 33.3%
0 0.0%
0 0.0%
7 38.9%
3 16.7%
3 16.7%
0 0.0%
1 5.6%
4 22.2%
0
Enrollment % of Total
0 0.0%
N/A
0
0
0
0
0
1
14
3
0
16
18
0
0
Fall 2015 Student Profile
University CollegeInstitutional Research & Assessment
18
15
3
Page 56 of 61

Fall 2015 Student Profile
University CollegeInstitutional Research & Assessment
Admissions
Admissions Statistics
Incoming Students by Classifications
Freshmen
Transfers
Master's Level
Doctoral Level
Professional Schools
Academic Measures5
Incoming Freshmem
Average SAT Verbal/Reading Score
Average SAT Math Score
Average Combined SAT Score
Average ACT Composite Score
Incoming Transfers
Average GPA of Transfer Students (4.00 scale)
Degrees Awarded & Academic Programs
Academic Degree Programs by Degree Level
Including Temple University Japan (TUJ)
Post-secondary Certificate
Associates
Bachelors
Master's
Graduate Certificate
Doctoral-Practice
Doctoral-Scholarship/Research
Temple University Total
Faculty (excluding Temple University Japan)
Full-Time Faculty by Appointment
Tenured
Tenure Track
Non-Tenure Track
Temple University Total
5. Academic Measures calculated based on students newly admitted and enrolled for Fall 2015
6. TU Policy 02.60.01: Establishing, Restructuring and Terminating Academic Programs - last amended May 12, 2015
7. Degrees awarded between July 1, 2014 and June 30, 2015
0 0%
0 0.0%
0 0.0%
0 0.0%
0 0
4 6
Total % of Total
0 0
1 0
0 0
3 6
0 0
0 0
524
513
1036
18
0.00
Academic
Programs Offered
2015-20166
Degrees Awarded
2014-20157
13
0
0
0
0
Page 57 of 61

Fall 2015 Student Profile
University CollegeInstitutional Research & Assessment
Enrollment by Major and Student Level
Academic Majors
ProRanger
Undeclared-University College
8. Professional refers to those programs in the professional schools
0 0 0 0
0 0 0 0
0 0 0 0
0 0 0 0
0 0 0 0
0 0 0 0
0 0 0 0
0 0 0 0
0 0 0 0
0 0 0 0
0 0 0 0
0 0 0 0
0 0 0 0
0 0 0 0
0 0 0 0
0 0 0 0
0 0 0 0
0 0 0 0
0 0 0 0
0 0 0 0
0 0 0 0
0 0 0 0
0 0 0 0
0 0 0 0
0 0 0 0
0 0 0 0
0 0 0 0
0 0 0 0
0 0 0 0
0 0 0 0
0 0 0 0
0 0 0 0
0 0 0 0
0 0 0 0
0 0 0 0
0 0 0 0
0 0 0 0
0 0 0 0
0 0 0 0
3 0 0 3
15 0 0 15
Undergraduate Graduate Professional8
Total
Page 58 of 61

Enrollment
Total Enrollment3
Full-Time
Part-Time
Full-Time Equivalent (FTE) Students4
Enrollment by Class Level
Total Undergraduates
High Seniors (120+ Credit Hours)
Seniors
Juniors
Sophomores
Freshmen
Undergraduate Non-Degree Seeking (Certificate)
Undergraduate Non-Degree (Other)
Total Graduate/Professional
Master's Level
Doctoral-Research
Doctoral-Practice
Graduate Non-Degree (Certificate)
Graduate Non-Degree (Other)
Enrollment by Race/Ethnicity
American Indian/Alaska Native
Asian
African-American
Hispanic/Latino
Pacific Islander
White
Two or More Races
Unknown/Other
International
Enrollment by Gender
Male
Female
Unreported
Enrollment by Pennsylvania Residency
Pennsylvania Resident
Non-Resident
Temple University Japan excluded from this report, except where indicated.
3. Enrollment figures are as of Census; Fall semester Drop/Add.
4. FTE is calculated as 1 FT + 1/3 PT. Students in Doctoral - Practice programs are considerd one FTE regardless of credit load.
1,004 66.3%
511 33.7%
827 54.6%
13 0.9%
Enrollment % of Total
Enrollment % of Total
675 44.6%
219 14.5%
316 20.9%
625 41.3%
33 2.2%
62 4.1%
0 0.0%
103 6.8%
154 10.2%
66
Enrollment % of Total
3 0.2%
66
0
0
0
0
26
266
497
0
652
1,168
1,449
3
5
Fall 2015 Student Profile
University StudiesInstitutional Research & Assessment
1,515
995
520
Page 59 of 61

Fall 2015 Student Profile
University StudiesInstitutional Research & Assessment
Admissions
Admissions Statistics
Incoming Students by Classifications
Freshmen
Transfers
Master's Level
Doctoral Level
Professional Schools
Academic Measures5
Incoming Freshmem
Average SAT Verbal/Reading Score
Average SAT Math Score
Average Combined SAT Score
Average ACT Composite Score
Incoming Transfers
Average GPA of Transfer Students (4.00 scale)
Degrees Awarded & Academic Programs
Academic Degree Programs by Degree Level
Including Temple University Japan (TUJ)
Post-secondary Certificate
Associates
Bachelors
Master's
Graduate Certificate
Doctoral-Practice
Doctoral-Scholarship/Research
Temple University Total
Faculty (excluding Temple University Japan)
Full-Time Faculty by Appointment
Tenured
Tenure Track
Non-Tenure Track
Temple University Total
5. Academic Measures calculated based on students newly admitted and enrolled for Fall 2015
6. TU Policy 02.60.01: Establishing, Restructuring and Terminating Academic Programs - last amended May 12, 2015
7. Degrees awarded between July 1, 2014 and June 30, 2015
0 0%
0 0.0%
0 0.0%
0 0.0%
0 0
0 0
Total % of Total
0 0
0 0
0 0
0 0
0 0
0 0
550
553
1103
24
3.12
Academic
Programs Offered
2015-20166
Degrees Awarded
2014-20157
296
35
0
0
0
Page 60 of 61
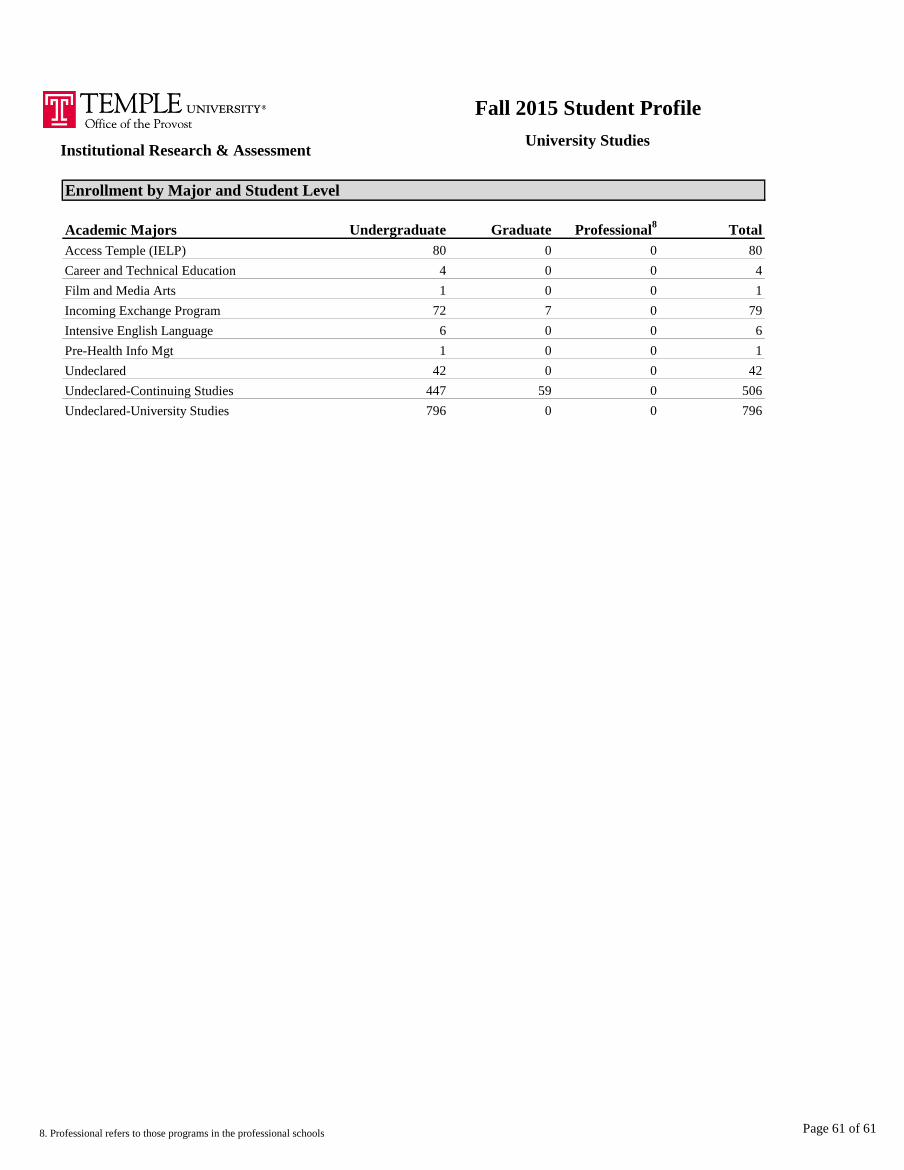
Fall 2015 Student Profile
University StudiesInstitutional Research & Assessment
Enrollment by Major and Student Level
Academic Majors
Access Temple (IELP)
Career and Technical Education
Film and Media Arts
Incoming Exchange Program
Intensive English Language
Pre-Health Info Mgt
Undeclared
Undeclared-Continuing Studies
Undeclared-University Studies
8. Professional refers to those programs in the professional schools
0 0 0 0
0 0 0 0
0 0 0 0
0 0 0 0
0 0 0 0
0 0 0 0
0 0 0 0
0 0 0 0
0 0 0 0
0 0 0 0
0 0 0 0
0 0 0 0
0 0 0 0
0 0 0 0
0 0 0 0
0 0 0 0
0 0 0 0
0 0 0 0
0 0 0 0
0 0 0 0
0 0 0 0
0 0 0 0
0 0 0 0
0 0 0 0
0 0 0 0
0 0 0 0
0 0 0 0
0 0 0 0
0 0 0 0
0 0 0 0
0 0 0 0
796 0 0 796
0 0 0 0
42 0 0 42
447 59 0 506
6 0 0 6
1 0 0 1
1 0 0 1
72 7 0 79
80 0 0 80
4 0 0 4
Undergraduate Graduate Professional8
Total
Page 61 of 61