Embed Size (px)
Citation preview
Fall/Winter Migration Monitoring at the Tuolumne River Weir
2009/10 Annual Report
Prepared For: Turlock Irrigation District Modesto Irrigation District
Prepared By: Ryan Cuthbert, Andrea Fuller, and Sunny Snider
FISHBIO Environmental, LLC 599 Hi Tech Pkwy
Oakdale, Ca. 95361
March 2010

Fall‐run Chinook Salmon Migration Monitoring – 2009/10 Annual Report
i
Table of Contents
Introduction .......................................................................................................................................... 1 Study Area ............................................................................................................................................. 1 Methods ................................................................................................................................................. 2 Results.................................................................................................................................................... 7
Chinook salmon abundance and migration timing ............................................................................. 7 Chinook salmon gender and size ........................................................................................................ 9 Origin of Chinook salmon production .............................................................................................. 10 O. mykiss .......................................................................................................................................... 11 Non-salmonids ................................................................................................................................. 11 Environmental Conditions ............................................................................................................... 12
Discussion ............................................................................................................................................ 14 References ........................................................................................................................................... 15

Fall‐run Chinook Salmon Migration Monitoring – 2009/10 Annual Report
ii
List of Figures
Figure 1. Map of the Tuolumne River displaying the location of the Tuolumne River Weir and other key points of interest. ........................................................................................... 2 Figure 2. Photographs of the Vaki Riverwatcher components ........................................................... 3 Figure 3. Photographs of the camera viewing lane and upstream livebox ......................................... 4 Figure 4. Silhouette image examples ................................................................................................. 4 Figure 5. Typical salmonid silhouette and video screen capture ....................................................... 5 Figure 6. Example silhouettes of Chinook downstream passages ..................................................... 6 Figure 7. Photograph of floatation barrels underneath the resistance weir panels ............................ 7 Figure 8. Daily upstream Chinook passage and flow, 2009/10 ......................................................... 8 Figure 9. Cumulative Chinook passage, 2009/10 .............................................................................. 8 Figure 10. Diel Chinook passage counts ........................................................................................... 9 Figure 11. Chinook male and female size class distributions .......................................................... 10 Figure 12. Percent of passage for incidental species and Chinook .................................................. 12 Figure 13. Daily upstream Chinook passage and water temperature, 2009/10 ................................ 13 Figure 14. Daily upstream Chinook passage and turbidity, 2009/10................................................ 13 Figure 15. Daily upstream Chinook passage and dissolved oxygen, 2009/10 ................................. 14

Fall‐run Chinook Salmon Migration Monitoring – 2009/10 Annual Report
iii
List of Tables
Table 1. Post-spawn and pre-spawn carcass data ............................................................................... 9 Table 2. Chinook length and passage data ....................................................................................... 10 Table 3. Incidental species passage data ......................................................................................... 11

Fall‐run Chinook Salmon Migration Monitoring – 2009/10 Annual Report
1
Introduction The California Department of Fish and Game (CDFG) has reported salmon escapement estimates on the Tuolumne River since 1940 (Fry 1961). Estimates of adult fall-run Chinook salmon varied from about 100 to 130,000 from 1940 to 1997 (mean: 18,300; median: 7,100) (Ford and Brown 2001). Over the last decade, estimates of adult fall-run Chinook declined from a high of 17,873 in 2000 (Vasques 2001) to a low of 211 in 2007 (Blakeman 2008). During most of the past 40 years estimates of fall-run population size were obtained using carcass surveys (some weir counts were made at Modesto in the 1940’s) and mark recapture models began to be used in the early 1970’s. While carcass surveys provide essential data to document the timing and distribution of spawning, population estimates from mark-recapture models are prone to bias if rigid assumptions are not met. Alternatively, resistance board weirs provide direct counts that are not subject to the same biases. Weirs also provide precise migration timing information, while carcass surveys provide essential data to document the timing and distribution of spawning. Resistance board weirs have been widely used in Alaska to estimate salmonid escapement since the early 1990’s (Tobin 1994), and a weir has been operated successfully on the nearby Stanislaus River since 2003. Weir monitoring was initiated on the Tuolumne River during fall 2009, and this effort was jointly supported by the Turlock Irrigation District (TID), Modesto Irrigation District (MID), and the City and County of San Francisco. The objectives of the Tuolumne River Weir Project include:
Determine escapement of fall-run Chinook salmon and steelhead to the Tuolumne River through direct counts.
Document migration timing of adult fall-run Chinook salmon and steelhead in the Tuolumne River and evaluate potential relationships with environmental factors.
Determine size and gender composition of returning adult salmon population. Estimate hatchery contribution to spawning population Document passage of non-salmonids
Study Area The Tuolumne River is the largest tributary to the San Joaquin River, draining a 1,900 square-mile watershed that includes the northern half of Yosemite National Park (McBain and Trush 2000). The Tuolumne River originates in the central Sierra Nevada Mountains and flows west between the Merced River to the south and the Stanislaus River to the north (Figure 1). The San Joaquin River flows north and joins the Sacramento River in the Sacramento-San Joaquin Delta within California’s Central Valley. The Tuolumne River is dammed at several locations for power generation, water supply, and flood control – the largest impoundment is Don Pedro Reservoir. The lower Tuolumne River corridor extends from its confluence with the San Joaquin River to La Grange Dam at river mile (RM) 52.2. The La Grange Dam site has been the upstream limit for anadromous migration since 1871. The spawning reach of the Tuolumne River has been defined as extending 28.1 miles downstream of La Grange Dam to RM 24.1 (O’Brien 2009).
Fall‐run Chinook Salmon Migration Monitoring – 2009/10 Annual Report
2
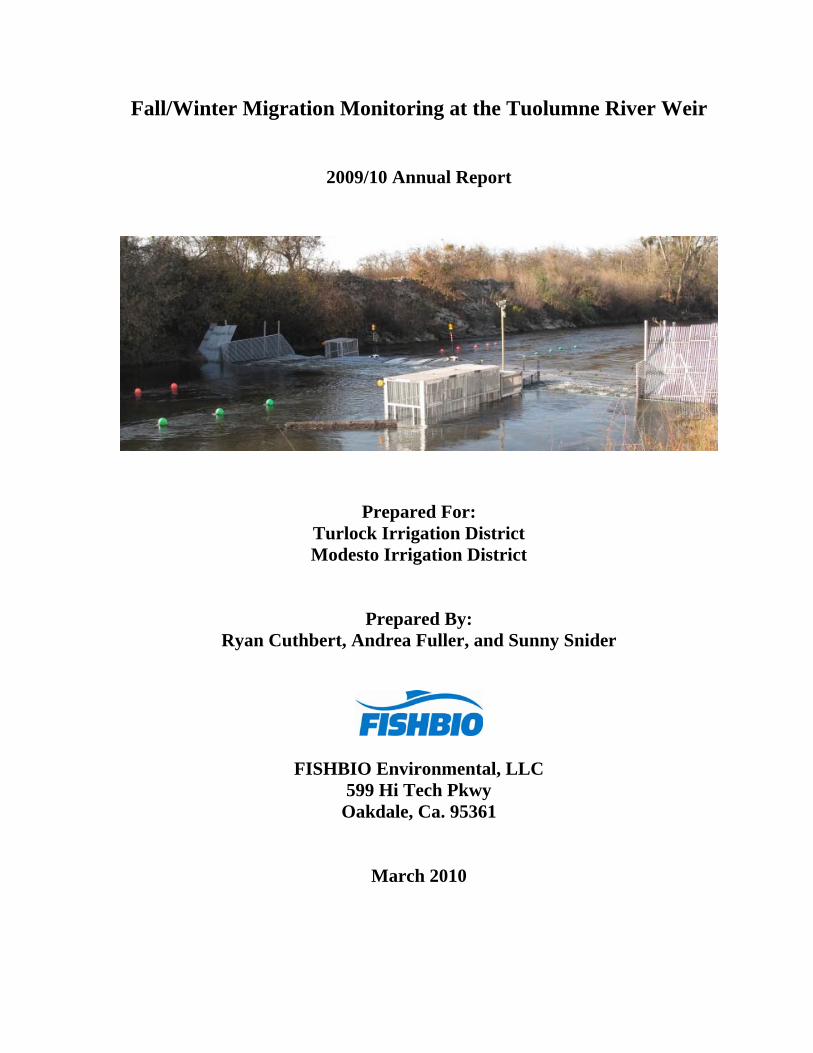
The weir is located at RM 24.5 (Figure 1), and this site was selected for weir operation because it is located below the typical downstream boundary of the CDFG spawning surveys. Site selection was also based on operational criteria that include water velocity, channel width, bank slope, channel gradient, channel uniformity, and substrate type.
Figure 1. Map of the Tuolumne River displaying the location of the Tuolumne River Weir and other key points of interest. Methods A resistance board weir (Tobin 1994; Stewart 2002, 2003) and Vaki Riverwatcher fish counting system (Vaki system) were installed in the Tuolumne River at RM 24.5 on September 22, 2009. This report provides monitoring results through January 31, 2010 although monitoring continued after this date. Weir and Vaki components were inspected and cleaned daily or more frequently when debris loads were heavy. In particular, the weir was inspected and cleaned every two to four hours between September 30, 2009 and October 25, 2009 due to large quantities of water hyacinth accumulation. The weir was briefly over-topped (submerged) on 10 occasions due to debris. Maintenance procedures generally followed guidelines found in Tobin (1994) and Stewart (2002, 2003), although slight adjustments were made to accommodate site-specific attributes

Fall‐run Chinook Salmon Migration Monitoring – 2009/10 Annual Report
3
of the Tuolumne River Weir. For example, sealed plastic barrels were used for additional floatation during periods of high flows (Figure 7). In conjunction with the weir, a Vaki Riverwatcher fish counting system (Vaki system) was used during the majority of the study period to monitor fish passage without the need to capture or handle fish. The Vaki system is comprised of three main components: an infrared scanner, a digital video camera with lights, and a computer system (Figure 2). The Vaki infrared scanner was attached to a fyke at an opening in the weir (Figure 3), and data was relayed to a computer system that generated infrared silhouettes of passing objects (Figure 4). The system also recorded the time, speed, and direction of passage, as well as the depth of the passing object. Measurement of depth allows estimation of total length based on a body depth to length ratio. Each upstream passage recorded by the computer also triggered an underwater digital camera to record a video clip or series of photos. Underwater lights were strategically placed next to the camera viewing lane for proper illumination of nighttime videos and photos. Data from the Vaki computer was downloaded and reviewed daily during the peak migration periods. Infrared silhouettes were used in conjunction with digital video or photos to identify passing objects (Figure 5). Video and photos aid in the determination of gender, total length, presence/absence of adipose fin, distinguishing salmonids to species, and provides the only evidence of the condition of the fish.
Figure 2. Left: Photograph of the Vaki Riverwatcher infrared scanner looking from upstream to downstream at the upstream side of the scanner plates. Center: Example of the RiverWatcher camera and lights. Right: Tuolumne Weir Vaki Riverwatcher computer system and job box.

Fall‐run Chinook Salmon Migration Monitoring – 2009/10 Annual Report
4
Figure 3. Left: Photograph of the fyke at the opening of the passing chute/trap. Note the fyke opens up into the viewing lane as pictured. Right: Livebox just upstream of the camera viewing lane.
Figure 4. Example of silhouette images produced from both sets of scanner diodes (one image from one set of diodes is displayed in blue and the other is displayed in red). The left set of images is an example of a typical salmonid silhouette and the right set of images is an example of a poor salmonid silhouette.
Fall‐run Chinook Salmon Migration Monitoring – 2009/10 Annual Report
5
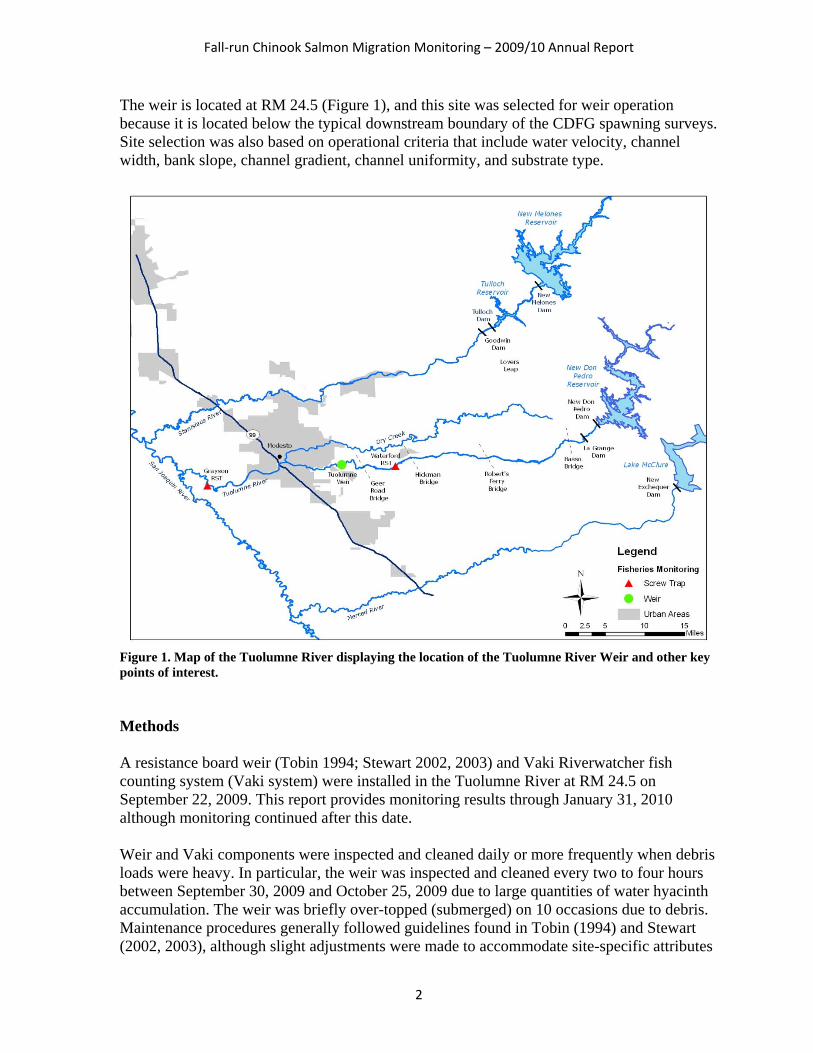
Figure 5. Top image is an example of a typical salmonid silhouette and the bottom image is a screen capture from a video clip of the same fish that is displayed in the top image. Note: Video clips are a higher quality image than the screen capture. After each passage was identified to species, data were exported into an excel spreadsheet. The daily passage counts consisted of net upstream passages (upstream passages – downstream passages). Other anecdotal evidence that was used to quantify the accuracy of our identification was also recorded in the spreadsheet. For example, the digital photographs provide visual evidence for determining if a fish is of hatchery origin (ad-clipped; Figure 6). Video and photos provide the only means by which Chinook salmon and O. mykiss may be distinguished, and the identity of many species is uncertain based on infrared silhouettes alone. The quality of video and photos is reduced when turbidity increases and can preclude identification of fish to species. Given the importance of distinguishing Chinook salmon from O. mykiss, an upstream migratory fish trap was used to collect biological data when turbidity exceeded 3.0 NTU on January 21-27. Trapping was also conducted October 4-5 when the Vaki malfunctioned.

Fall‐run Chinook Salmon Migration Monitoring – 2009/10 Annual Report
6
Figure 6. Example of a silhouette image and screen capture from a video clip of the same Chinook salmon that has a clipped adipose fin (ad-clip). Note: Video clips are a higher quality image than the screen capture. Physical data collected during each weir check included water temperature (°F), dissolved oxygen (mg/L), turbidity (NTU), weather conditions (RAN = rain, CLD = cloudy, CLR = clear, FOG = fog), and water velocity (ft/s) measurements at the opening of the livebox. Instantaneous water temperature and dissolved oxygen were recorded using an Exstick II model DO600 Dissolved Oxygen Meter (Extech Intruments Corporation). Hourly water temperature data was logged using an iBCod type G submersible data logger (Alpha Mach, Inc.). Turbidity was recorded using a model 2020e Turbidimeter (LaMotte Co.), and water velocity was measured using a digital Flow Probe model FP-101 (Global Water Instrumentation, Inc.). Tuolumne River flow, temperature, and dissolved oxygen were also downloaded from the California Data Exchange Center (CDEC).

Fall‐run Chinook Salmon Migration Monitoring – 2009/10 Annual Report
7
Figure 7. Photograph of the flotation barrels lining the underneath of the resistance weir. Visual assessments in the vicinity of the weir were conducted to monitor potential migration delay or digging activity about 0.5 miles upstream and downstream of the weir. This stacking ratio was intended to serve as a measure of potential migration delay. Boat surveys were conducted on Monday, Wednesday and Friday of each week during September; daily from October 1 through December 15; and on Monday, Wednesday and Friday from December 16 through December 31. Boat surveys were reduced to once per week after December 31. A “stacking ratio” was calculated using the number of salmon observed downstream of the weir and the number of salmon recorded by the RiverWatcher passing the weir. Results Chinook salmon abundance and migration timing Between September 22, 2009 and January 31, 2010 282 adult fall-run Chinook salmon were detected by the Riverwatcher as they passed upstream of the weir (Figure 8). No salmonids were captured during trapping events. Daily passage ranged between zero and 19 Chinook, and the median cumulative passage occurred on November 17, 2009. Only 16% of the cumulative total passage (n = 46) occurred by November 1; however, 78% of the cumulative total passage (n = 218) occurred by December 1 (Figure 9). Diel Chinook salmon passage appeared to decrease during dawn (0400 hours – 0959 hours) though changes in diel passage timing were not significant (ANOVA: F = 1.50, P = 0.23) (Figure 10).

Fall‐run Chinook Salmon Migration Monitoring – 2009/10 Annual Report
8
Figure 8. Daily upstream Chinook passage recorded at the Tuolumne River Weir in relation to daily average flows (cfs) recorded in the Tuolumne River at La Grange (LGN) and Modesto (MOD) between September 22, 2009 and January 31, 2010 [Data source: CDEC – http://cdec.water.ca.gov].
Figure 9. Cumulative adult fall-run Chinook salmon passage from September 22, 2009 through January 31, 2010.

Fall‐run Chinook Salmon Migration Monitoring – 2009/10 Annual Report
9
Figure 10. Chinook salmon passage in 6-hour time blocks. Diel Chinook salmon passage was not significant among the different time periods (ANOVA: F = 1.50, P = 0.23). Three post-spawn fall-run Chinook salmon carcasses were recovered from the top of the weir. One ripe female Chinook carcass was impinged between the resistance weir and the substrate early in the monitoring season during low flow on October 2, 2009 (Table 1). Table 1. Post-spawn and pre-spawn (ripe) fall-run Chinook salmon carcasses recovered from the Tuolumne River Weir between September 22, 2009 and January 31, 2010.
Species Date TL (mm) Adipose Fin Clip Sex Post-spawn
Chinook salmon 10/2/09 950 No Female No Chinook salmon 12/11/09 550 Yes Male Yes Chinook salmon 12/30/09 805 Yes Male Yes Chinook salmon 1/23/10 716 No Male Yes Chinook salmon gender and size Total fall-run Chinook salmon passage was composed of 63% male (n = 177), 31% female (n = 87), and 6% unknown (n = 18). Mean total length for Chinook upstream passages were: 601 mm (n = 184) for male, 593 mm (n = 87) for female, 539 mm (n = 3) for unknown; and 598 mm for all Chinook combined (Table 2). Although male and female length frequency

Fall‐run Chinook Salmon Migration Monitoring – 2009/10 Annual Report
10
distributions were significantly different, (ANOVA: F = 6.10, P = 0.03) both sexes were dominated by the 600 mm to 649 mm size class (Figure 11). Origin of Chinook salmon production Adipose fin clips suggesting hatchery origin were observed in 15% of Chinook counted at the Tuolumne River weir during 2009. Although releases of hatchery origin Chinook have not been made in the Tuolumne River in recent years, straying from other basins is common as evidenced by the recovery of coded wire tags during annual carcass surveys. Table 2. Fall-run Chinook upstream passage data from September 22, 2009 through January 31, 2010 (upstream passage counts only, data are not directly comparable to net passage). Parenthesis indicate range.
Sex – Adipose fin clip Mean TL (mm) 95% CI (mm) n Male – No 607 (380 – 1,055) 607 ± 9 147 Male – Yes 587 (384 – 831) 587 ± 19 36
Male – Unknown 317 - 1 Female – No 626 (443 – 916) 626 ± 14 65 Female – Yes 495 (317 – 840) 495 ± 31 21
Female – Unknown 565 - 1 Unknown – No 561 - 1 Unknown – Yes - - 0
Unknown – Unknown 528 (464 – 591) 528 ± 63 2 Combined 598 (317 – 1,055) 597 ± 7 274
Figure 11. Length frequency of male and female fall-run Chinook salmon passage (upstream passage counts only, data are not directly comparable to net passage). Male and female size class distributions were significantly different (ANOVA: F = 6.10, P = 0.03).

Fall‐run Chinook Salmon Migration Monitoring – 2009/10 Annual Report
11
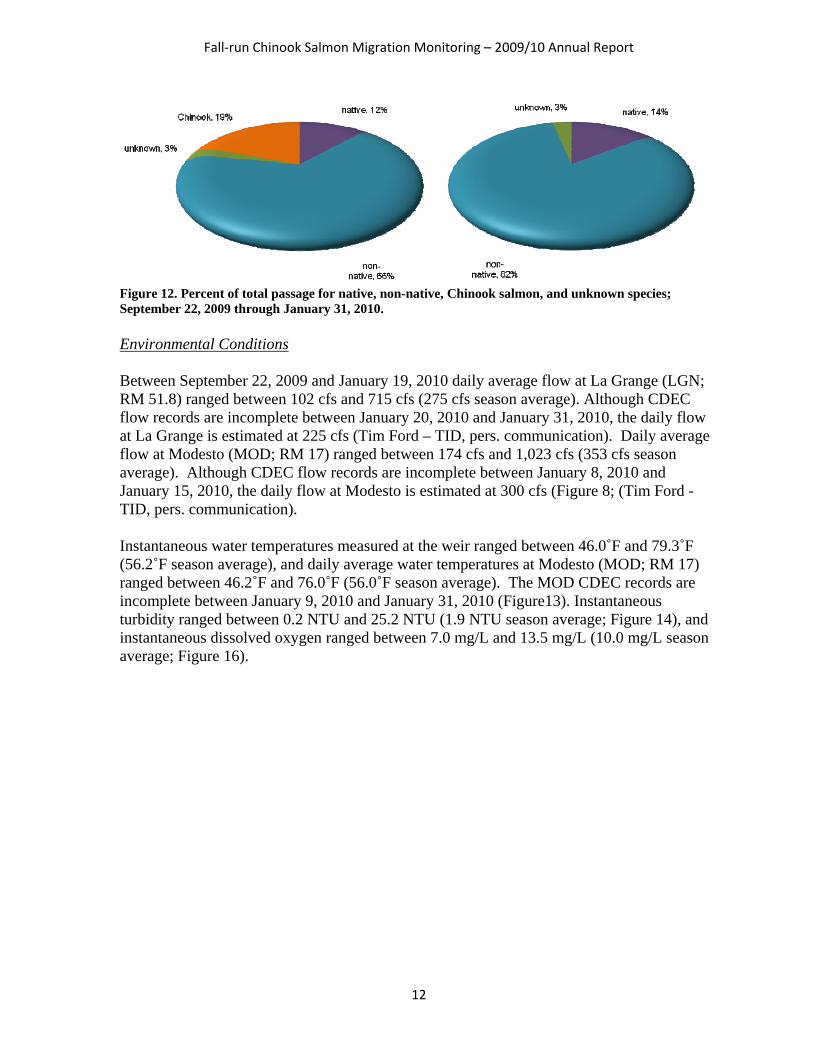
O. mykiss One O. mykiss was recorded passing the weir on November 7, 2009. Estimated length was 276 mm. Non-salmonids There were 11 other incidental species were identified passing the weir including bluegill sunfish (Lepomis macrochirus), common carp (Cyprinus carpio), channel catfish (Ictalurus punctatus), goldfish (Carassius auratus), largemouth bass (Micropterus salmoides), redear sunfish (Lepomis microlophus), Sacramento pikeminnow (Ptychocheilus grandis), Sacramento sucker (Catostomus occidentalis), smallmouth bass (Micropterus dolomieu), striped bass (Morone saxatilis), white catfish (Ictalurus catus); as well as unknown species of black bass (Micropterus spp.), catfish (Ameiurus spp. and Ictalurus spp.), and sunfish (Lepomis spp.) (Table 3). Non-native species accounted for 92% of the total passage of incidental species (Figure 12). There were 36 passages that were identified as fish, but were not identified to species due to insufficient evidence. Table 3. Incidental species passage data from September 22, 2009 through January 31, 2010 (upstream passage counts only, data are not directly comparable to net passage). Parenthesis indicates range.
Native Species Mean TL (mm) Date Range Total Passage Sacramento pikeminnow
282 (215 – 377) 11/12/09 – 1/3/10 10
Sacramento sucker 390 (233 – 778) 9/25/09 – 1/31/10 161 Non-native Species Mean TL (mm) Date Range Total Passage Bluegill sunfish - 10/5/09 – 10/9/09 7 Bommon carp 490 (162 – 884) 9/25/09 – 1/7/10 518 Bhannel catfish 272 (203 – 353) 10/3/09 – 12/18/09 4 Goldfish 366 (198 – 486) 10/18/09 – 1/19/10 4 Largemouth bass 235 (146 – 473) 10/5/09 – 12/29/09 248 Smallmouth bass 271 (230 – 330) 10/18/09 – 11/4/09 4 Striped bass 344 (180 – 704) 10/24/09 – 11/17/09 5 White catfish 333 (172 – 440) 10/6/09 – 10/28/09 5 Unknown – black bass 276 (171 – 606) 9/27/09 – 1/4/10 12 Unknown – catfish 279 (172 – 582) 9/26/09 – 12/5/09 166 Unknown Species Mean TL (mm) Date Range Total Passage Unknown – sunfish 240 (80 – 280) 10/2/09 – 1/31/10 7 Unknown 436 (244 – 1,061) 9/24/09 – 1/31/10 32
Fall‐run Chinook Salmon Migration Monitoring – 2009/10 Annual Report
12
Figure 12. Percent of total passage for native, non-native, Chinook salmon, and unknown species; September 22, 2009 through January 31, 2010. Environmental Conditions Between September 22, 2009 and January 19, 2010 daily average flow at La Grange (LGN; RM 51.8) ranged between 102 cfs and 715 cfs (275 cfs season average). Although CDEC flow records are incomplete between January 20, 2010 and January 31, 2010, the daily flow at La Grange is estimated at 225 cfs (Tim Ford – TID, pers. communication). Daily average flow at Modesto (MOD; RM 17) ranged between 174 cfs and 1,023 cfs (353 cfs season average). Although CDEC flow records are incomplete between January 8, 2010 and January 15, 2010, the daily flow at Modesto is estimated at 300 cfs (Figure 8; (Tim Ford - TID, pers. communication). Instantaneous water temperatures measured at the weir ranged between 46.0˚F and 79.3˚F (56.2˚F season average), and daily average water temperatures at Modesto (MOD; RM 17) ranged between 46.2˚F and 76.0˚F (56.0˚F season average). The MOD CDEC records are incomplete between January 9, 2010 and January 31, 2010 (Figure13). Instantaneous turbidity ranged between 0.2 NTU and 25.2 NTU (1.9 NTU season average; Figure 14), and instantaneous dissolved oxygen ranged between 7.0 mg/L and 13.5 mg/L (10.0 mg/L season average; Figure 16).

Fall‐run Chinook Salmon Migration Monitoring – 2009/10 Annual Report
13
Figure 13. Daily upstream Chinook passage recorded at the Tuolumne River Weir in relation to instantaneous water temperature (°F) at the weir and daily average water temperature (°F) at Modesto (MOD) between September 22, 2009 and January 31, 2010 [Data source: CDEC – http://cdec.water.ca.gov].
Figure 14. Daily upstream Chinook passage recorded at the Tuolumne River Weir in relation to instantaneous turbidity (NTU) between September 22, 2009 and January 31, 2010.

Fall‐run Chinook Salmon Migration Monitoring – 2009/10 Annual Report
14
Figure 15. Daily upstream Chinook passage recorded at the Tuolumne River Weir in relation to instantaneous dissolved oxygen (mg/L) between September 22, 2009 and January 31, 2010. Discussion The Vaki Riverwatcher counted 282 Chinook salmon and one O. mykiss during this sampling season. There were no apparent relationships between migration timing and flow, water temperature, or dissolved oxygen during 2009. Approximately 61% of the Chinook salmon observed at the Tuolumne River weir were two year old fish and the majority of these were males. Two year old males are commonly known as jacks and these fish may contribute up to 67% of the run in some years (Moyle 2002). Jacks are widely used in escapement prediction models (Beer et. al. 2006) where a large return of jacks suggests an increase in escapement for the following year. Escapement estimates from weir counts and carcass survey differed greatly during 2009, demonstrating the importance of weir monitoring in this system. At the Tuolumne weir, 282 fall-run Chinook salmon were counted while the preliminary adjusted Petersen estimate based on carcass survey data was only 124 fall-run Chinook salmon (CDFG GrandTab). Similarly, carcass surveys also underestimated Chinook salmon escapement to the Stanislaus River during the September 2009 to January 2010 period. In addition to providing information on migrating adult fall run Chinook salmon, the weir also provided information on the movement and sizes of 11 non-salmonid species observed

Fall‐run Chinook Salmon Migration Monitoring – 2009/10 Annual Report
15
passing the weir, and 92% of those species were non-native. Many of the non-native species recorded passing through the weir are known to prey on juvenile Chinook salmon (e.g. largemouth bass, smallmouth, and catfish) (Tabor et. al. 2007).Year-round monitoring could provide more insight into Chinook salmon run dynamics on the Tuolumne River as well as abundance indicators for predatory fishes.
References Beer, W. N., D. Salinger, S. Iltis, J. J. Anderson 2006. Evaluation of the 2004 Predictions of
Run-size and Passage Distributions of Adult Chinook Salmon (Oncorhynchus tschawytscha) Returning to the Columbia and Snake Rivers. Prepared by Columbia Basin Research School of Aquatic and Fishery Sciences, University of Washington. Seattle, WA, for the United States Department of Energy Bonneville Power Administration Division of Fish and Wildlife, Portland, OR. Annual Report January 2004 – December 2004 Project # 1989-108-00, 17 pp.
Blakeman, D. 2008. Tuolumne River Fall Chinook Salmon Escapement Survey. Federal Energy Regulatory Commission Annual Report FERC Project #2299, Report 2007-1.
Ford, T. and L. R. Brown, 2001. Distribution and Abundance of Chinook Salmon and Resident Fishes of the Lower Tuolumne River, California. In R.L. Brown (ed.) Fish Bulletin 179 Contributions to the Biology of Central Valley Salmonids Vol. 2:253-304. California Department of Fish and Game, Sacramento, California.
Fry, D. H., Jr. 1961. King Salmon Spawning Stocks of the California Central Valley, 1940-1959.24 California Fish and Game 47(1): 55-71.
McBain and Trush 2000.Habitat Restoration Plan for the Lower Tuolumne River Corridor.Arcata, CA, Prepared for the Tuolumne River Technical Advisory Committee. 240 pp.
Moyle, P. B. 2002. Inland fishes of California, revised and expanded. University of California Press, California. 502 pp.
O’Brien, J. 2009. 2008 Tuolumne River Fall Chinook Salmon Escapement Survey. California Department of Fish and Game, Tuolumne River Restoration Center, La Grange Field Office.
Reynolds, F. L., T. J. Mills, R. Benthin, and A. Low. 1993. Restoring Central Valley streams: a plan for action. California Department of Fish and Game.
Ricker, W. E. 1975.Computation and interpretation of biological statistics of fish populations.Dept. of the Env. Fisheries and Marine Service, Bull.,191, 382pp.
Seber, G. A. F., 1973, Estimation of animal abundance and related parameters, Griffin, London, 506 pp.
Schaefer, M. B. 1951.Estimation of the size of animal populations by marking experiments.U.S. Fish and Wildlife Service Bull.,52:189-203.
Fall‐run Chinook Salmon Migration Monitoring – 2009/10 Annual Report
16
Stewart, R. 2002.Resistance board weir panel construction manual. Alaska Department of Fish and Game, Division of Commercial Fisheries, Artic-Yukon-Kuskokwim Region, Regional Information Report No. 3A02-21, Fairbanks, Alaska.
Stewart, R. 2003.Techniques for installing a resistance board fish weir. Alaska Department of Fish and Game, Division of Commercial Fisheries, Artic-Yukon-Kuskokwim Region, Regional Information Report No. 3A02-21, Fairbanks, Alaska.
Tabor, R. A., B. A. Footen, K. L. Fresh, M. T. Celedonia, F. Mejia, D. L. Low, and L. Park 2007. Smallmouth bass and largemouth bass predation on juvenile Chinook salmon and other salmonids in the Lake Washington Basin. North American Journal of Fisheries Management 27: 1174-1188.
Tobin, J. H. 1994.Construction and performance of a portable resistance board weir for counting migrating adult salmon in rivers.U. S. Fish and Wildlife Service, Kenai Fishery Resource Office, Alaska Fisheries Technical Report Number 22, Kenai, Alaska.
Vasques, J. 2001. 2000 Tuolumne River Chinook Salmon Spawning Escapement Survey. Federal Energy Regulatory Commission Annual Report FERC Project #2299, Report 2002-2.
Yoshiyama, R. M., E. R. Gerstrung, F. W. Fisher, and P. B. Moyle. 2001. Historical and present distribution of Chinook salmon in the Central Valley drainage of California. Pages 71-176 in R. L. Brown, editor.Contributions to the Biology of Central Valley Salmonids, Fish Bulleting 179. California Department of Fish and Game, Sacramento.