Embed Size (px)
Citation preview
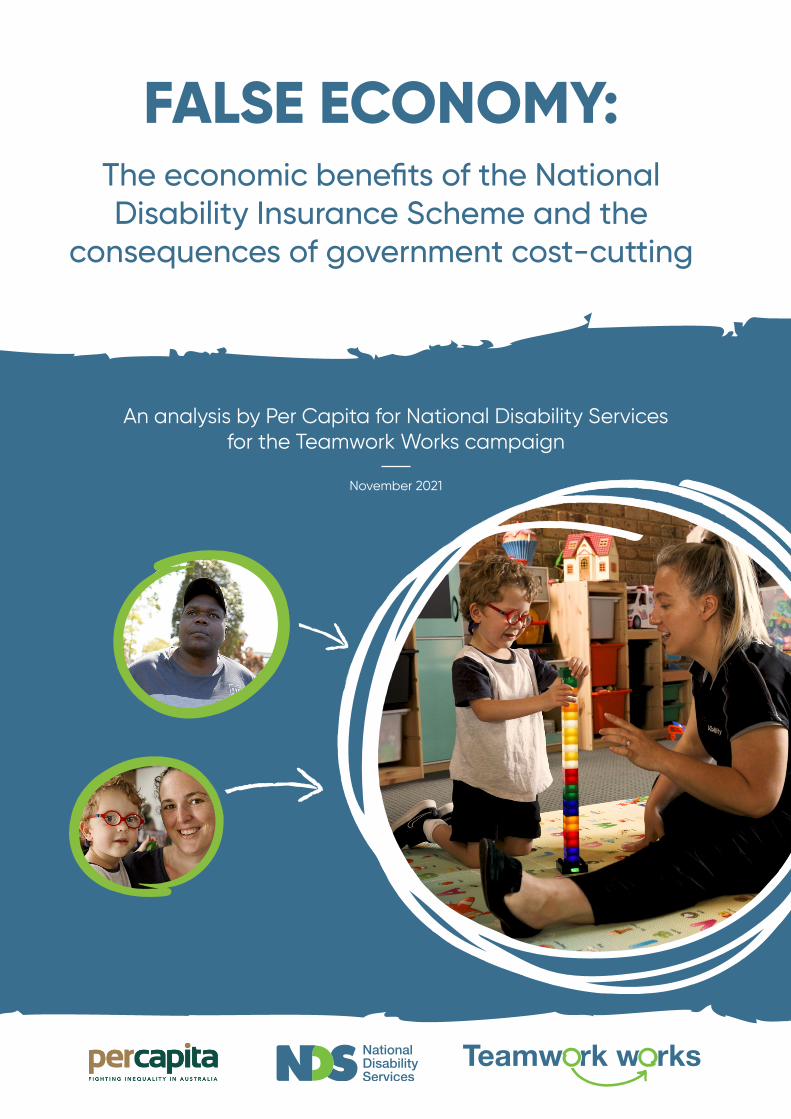
An analysis by Per Capita for National Disability Services for the Teamwork Works campaign
November 2021
FALSE ECONOMY:The economic benefits of the National Disability Insurance Scheme and the
consequences of government cost-cutting
2
About Per Capita ....................................................................................................................................... 3
About the Authors ...................................................................................................................................................................3
Executive Summary .................................................................................................................................. 4
Introduction .................................................................................................................................................. 6
Section 1 – NDS modelling, trends and cost forecasts .......................................................... 9
Number of participants ........................................................................................................................................................9
Exit rates ......................................................................................................................................................................................9
Incidence of participation ................................................................................................................................................10
Average Payments to participants .............................................................................................................................. 12
Section 2 – Economic impacts of the NDIS scheme ...............................................................13
Reduced spending in other budget areas ............................................................................................................... 13
Employment and income .................................................................................................................................................. 13
Overall economic impact - estimating a fiscal multiplier ................................................................................. 19
Section 3 – Economic implications of NDIS funding reductions and cost cutting ..............................................................................................21
The cost of underinvesting ............................................................................................................................................... 21
Workforce participation should be the emphasis of government efforts, not NDIS funding cuts ......................................................................................................... 21
NDIS providers ....................................................................................................................................................................... 23
Conclusion ..................................................................................................................................................24
Bibliography ...............................................................................................................................................25
Appendix 1 ..................................................................................................................................................28
3
About the AuthorsMichael D’Rosario, Research Economist
Michael is an economist and strategy advisor, with experience working with NFP, university and
corporate organisations in Australia and abroad. Most recently, Michael served as chair of Financial
Markets at Deakin University, the ESG Advisor to CPA Australia, and as Research, Policy and
Communications Advisor to the Victorian Aboriginal Legal Service and the National Aboriginal and
Torres Strait Islander Legal service.
Prior to these roles, Michael worked with PwC, KordaMentha, AusAid, Victoria University and the
University of Melbourne. Michael has served on a number of university boards as a Non-Executive
Director and Deputy Chair. Michael is passionate about social justice and presently works on projects
in ensemble forecasting methods, ethical/explainable A.I. and the role of technology in addressing
social inequality.
Michael’s doctoral and postdoctoral work in econometrics has focused on the role of innovation in
driving job creation, economic development and services access.
Matt Lloyd-Cape, Director of Policy and Research
Following a brief career as a carpenter, Matt has worked on issues of poverty, economic inequality
and social justice in a range of fields. Over the past 20 years he has worked in trade unions,
international development NGOs and with universities.
This work includes managing disaster relief and social development projects, industrial relations
research in Eastern Europe, Russia and Central America, and livelihoods research in East Africa, Papua
New Guinea and South Asia. Prior to joining Per Capita he worked on international and social policy
issues at the Australian Council of Trade Unions as an International Officer.
Matt holds an MSc in International Relations and Development from the School of Oriental and African
Studies (SOAS), University of London, where he wrote on the role of corporate social responsibility in
industrial relations. He also has an MPhil in Political Economy from Central European University, where
he researched cross-border trade union action in global supply chains.
About Per CapitaPer Capita is an independent progressive think tank, dedicated to fighting
inequality in Australia. We work to build a new vision for Australia based on
fairness, shared prosperity, community and social justice.
Our research is rigorous, evidence-based and long-term in its outlook. We consider the national challenges
of the next decade rather than the next election cycle. We ask original questions and offer fresh solutions,
drawing on new thinking in social science, economics and public policy.
Our audience is the interested public, not just experts and policy makers. We engage all Australians who want
to see rigorous thinking and evidence-based analysis applied to the issues facing our country’s future.
4
Executive SummaryThe NDIA’s Annual Financial Sustainability Report of December 2020 (AFSRDec20) made waves in the disability
support community when it was released earlier this year. It contains modelling stating that over the coming
five years the participant costs of the NDIS will be $50 billion more than previously assumed. By 2029-30, the
AFSRDec20 modelling suggests an annual overshoot as high as $22 billion; a 54% increase in costs.
Given that the NDIA’s 2019-2020 Annual Report found that NDIS costs were largely in line with previous
modelling, many stakeholders question how such a sharp change in forecasts could have come about. There
is also widespread concern in the disability community that political desires to cut back on NDIS funding may
be influencing some of these figures.
Unfortunately, the situation is compounded by a lack of access to details about the modelling, with the
Minister for the NDIS, Linda Reynolds, unwilling to provide to the public the underlying data or modelling
assumptions. Following an FOI by Kevin Andrews MP, partial access to the underlying data has been provided.
However, without full access to the modelling used to reach such shocking figures, an independent assessment
of the NDIA’s claims cannot be made.
Could the blowout be as high as the new modelling suggests? In theory, yes. Novel large-scale projects are
notoriously difficult to cost. History is replete with examples in both the public and private sector. Take for
example, Chevron’s Gorgon LNP project ended up US$17 billion more than the original US$37 billion, while the
Department of Defence has seen their 26 largest projects increase in cost by 60% with a cumulative 57-year
delay.2
But it seems likely that the NDIAs new modelling overstates the increase in participant numbers and overall
costs compared to previous estimates. And unlike the examples above, any increase in cost of the NDIS will
translate very quickly into strong economic gains, through high levels of increased employment and local level
economic activity dispersed throughout local communities.
This is because spending on the NDIS is not simply a cost on one side of a ledger; it is also a critical
component of the service economy, directly creating tens of thousands of jobs and billions in economic
activity, producing vast positive spill overs. The original Productivity Commission report in
2011presented a very compelling argument that the NDIS would produce
large economic returns, but this side of the NDIS is consistently under
reported and poorly enumerated.
The multiplier effect, that is the total amount of direct and indirect
economic activity stimulated by the initial investment, associated
with health and social care spending is extremely high, and any
sub-optimal underinvestment removes from the economy far
more than is “saved” in Federal coffers.
This report discusses, where data is available, some of the issues
surrounding the new NDIA modelling (Section 1). It then goes on
to assess the broad economic activity generated by the NDIS,
including employment and consumption (Section 2), and the potential
costs of limiting NDIS spending at sub-optimal levels (Section 3).
1. https://www.ft.com/content/29667e96-9f15-11e6-891e-abe238dee8e2 2. https://www.abc.net.au/news/2019-12-17/billion-dollar-cost-blowouts-and-delays-hit-defence-projects/11805942
5
We estimate that:
1. The NDIS employs over 270,000 people over 20 different occupations, and contributes to the
employment of tens of thousands more workers indirectly;
2. The economic impact of the scheme is likely very large, even compared to other types of
government spending. A conservative estimate of the multiplier effect of the NDIS would be in the
range of 2.25; and
3. Such a multiplier effect would mean that the economic contribution of the NDIS in 2020-2021 is
around $52.4 billion.
Because the NDIS has such a strong impact on employment and in generating economic activity,
underfunding the scheme has significant costs. We estimate that for every $1 billion that the NDIS is under-
funded, significant negative outcomes occur across the economy including:
1. A drop in employment of around 10,200 jobs, reducing the employment rate by 0.1%;
2. A decline in total economic activity of $2.25 billion; and
3. 0.14% reduction in total GDP, or a 0.22% reduction in the services economy.
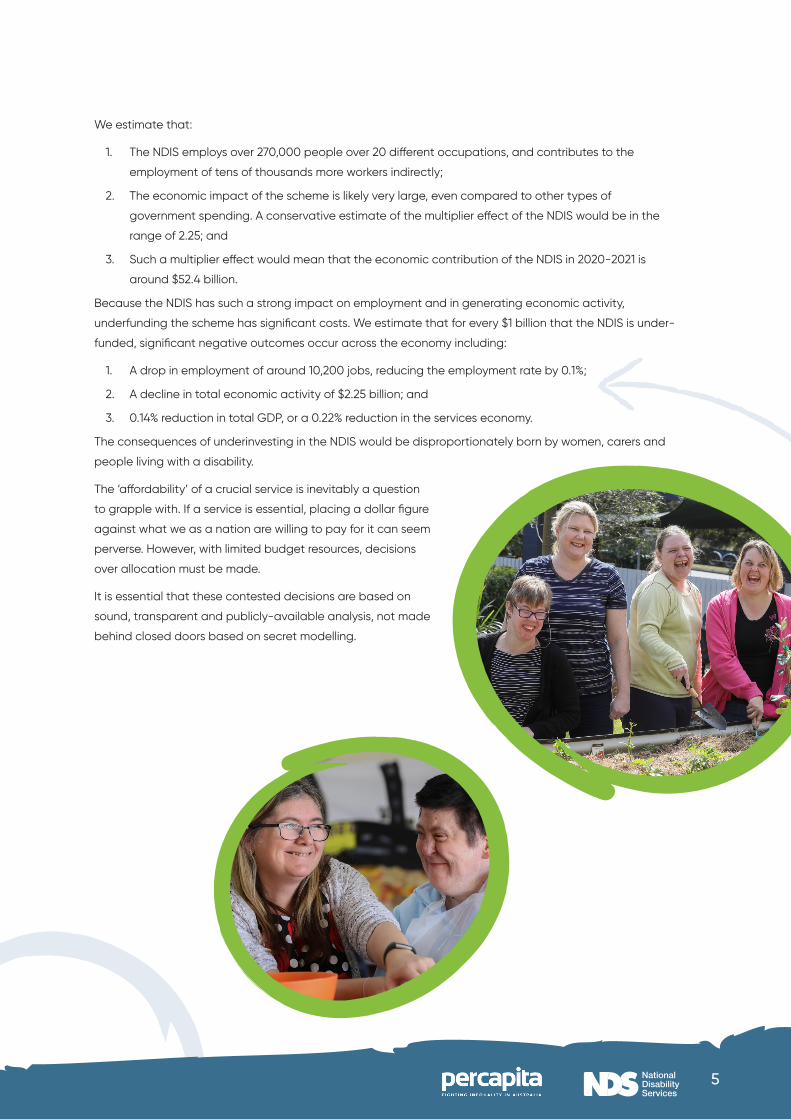
The consequences of underinvesting in the NDIS would be disproportionately born by women, carers and
people living with a disability.
The ‘affordability’ of a crucial service is inevitably a question
to grapple with. If a service is essential, placing a dollar figure
against what we as a nation are willing to pay for it can seem
perverse. However, with limited budget resources, decisions
over allocation must be made.
It is essential that these contested decisions are based on
sound, transparent and publicly-available analysis, not made
behind closed doors based on secret modelling.
6
IntroductionThe National Disability Insurance Scheme (NDIS) was created with the involvement of people with disabilities,
their families and carers to be a transformative social insurance program, fully funded by government. Its
intention is to provide people with disabilities with personalised care and support, controlled by the user, that
will enable them to live securely and safely, and to participate fully in society.
It is therefore critical to understand the NDIS primarily as an essential social service, rather than an economic
program. If the NDIS is reduced in scope, or its purpose compromised through a focus on cost rather than
benefit, the impact on people with disabilities, their families and carers will be immediate and material. Any
reduction in funding for the NDIS will be felt primarily as a loss of agency, safety and security by people with
disabilities.
Put simply, if the services provided by the NDIS are reduced or curtailed, people with disabilities will not get
what they need to achieve their full potential and participate fully in our society – a right that is due to all
people, and the founding purpose of the Scheme.
Yet less than a decade after its establishment, and despite an increase in the Medicare Levy of 0.5% intended
specifically to fund the Scheme, the NDIS is already the subject of misguided and unwarranted cost-cutting
by the Federal Government. The recent attempt to instigate so-called ‘independent assessments’ to restrict
access to the NDIS was indicative of the current government’s approach to the Scheme, which is to see it as a
cost burden rather than an investment in human capital and wellbeing.
The arguments being proffered to justify cost-cutting on the NDIS are spurious, and distort the original
intention of the Scheme. The NDIS was designed to operate on trust: trust that people with disabilities, their
families and carers knew best what was needed to provide agency, safety and security to recipients of the
Scheme.
Recent rhetoric and changes in policy focus from the NDIA and Government risk fundamentally undermining
this trust. For example, in 2020 the NDIA implemented a fraud management process, which encourages
recipients to report instances of suspected fraud by NDIS providers, recipients and community partners, and
actively pursues a debt recovery program in pursuit of payments made to persons allegedly not entitled to
receive them.3
The fraud management process outlined on the NDIS website includes a number of examples of ‘potential
fraud’ against the Scheme, and a long list of behaviours or actions that it alleges participants and providers
may be engaged in, such as ‘collusion with other parties to gain an advantage’, the falsification of documents
‘to support claims’ and even that ‘relatives or Carers, including nominees, [may be] accessing NDIS funds for
their personal use’.
This approach to ‘fraud management’ is indicative of the loss of trust and the foundational purpose of the
NDIS in government policy thinking, and the shift over the last three to five years away from viewing the NDIS
as an essential social service, and towards framing it as a cost burden on the Australian economy.
It is within this context that the Government’s recent attempts to cut spending on the NDIS must be seen.
What follows is an analysis of the recent claims by the Federal Government and the NDIA, most notably in
its Annual Financial Sustainability Report of December 2020, that the cost base of the NDIS will become
‘unsustainable’, and that spending on the Scheme must be ‘reined in’.
3. https://www.ndis.gov.au/about-us/fraud-strategy/reporting-suspected-fraud
7
Our analysis shows that not only is this argument based on questionable and opaque modelling, but that it
fundamentally misunderstands the purpose, and the wider social and economic benefit, of the Scheme.
The initial modelling used to establish the NDIS costs were carried out in 2011 by the Productivity Commission.
At the time, the Commission estimated that a national disability insurance scheme would cover 411,000
participants and cost $13.6 billion (gross) at maturity (Productivity Commission, 2011). The Commission’s 2017
report increased this estimation significantly, both in terms of participant numbers, cost per participant, and
overall cost – the report projected that the NDIS would cover 475,000 participants and cost $22 billion at full
scheme commencement (Productivity Commission, 2017).
Overall though, the report also found that “Based on trial and transition data, NDIS costs are broadly on track
with the NDIA’s long term modelling” (Productivity Commission, 2017, p. 2).
Indeed, lower than expected plan utilisation rates (the amount that users spend of their maximum plan
allowance) have previously led to monies earmarked for the NDIS being underspent over several years. With
plan utilisation rates hovering between 69-75% the federal government recouped billions annually, as much as
$4.6 billion by 2019, with some stakeholders accusing the Federal Government of tightening NDIS spending in
order to achieve their former policy ambition of a budget surplus.4
Issues surrounding the financial sustainability of the NDIS have recently been raised in the July 2021 Annual
Financial Sustainability Report Summary- Interim Update, during a debate over whether highly controversial
independent functional assessments should be brought in for participants.5 In this update considerable
differences between the modelled costs and costs based on uptake so far were raised, with costs forecast to
exceed the Productivity Commissions 2017 by up to 58% by 2030. This led some to believe that independent
assessments were an attempt to reduce Federal Government spending on the NDIS scheme, by covertly
tightening eligibility (Dickinson et al., 2021).
The ASFRDec20 makes several comments which indicate that the NDIA believes that there are participants
in the scheme who are inflating the costs or causing resource misallocation. For example, the report states
that “…there have been some issues with the current resource allocation process, and in particular the lack
of a mechanism for robust assessment of support need” (p21). Statements like this indicate that the NDIA
believe that the current model whereby GPs and participants work together to identify an appropriate plan
are not in line with actual need in the community, and such arguments are used to support the now aborted
independent assessment scheme.
Furthermore, the NDIA’s own NDIS 2019-2020 Annual Report, published in October 2020, reported that
“Scheme projections are in line with the estimates shown in the 2017 Productivity Commission report on
NDIS costs at 2021–22, after allowing for costs not included in the Productivity Commission estimate, such
as the introduction of school transport, personal care in schools, developmental delay and the incomplete
implementation of the National Injury Insurance Scheme.” (p41).
In the context of a perceived attempt on the part of the NDIA and Minister in charge, Linda Reynolds, to enact
cost cutting measures, the new NDIA forecast of a massive blowout was taken with some scepticism among
the disability community.
4. https://www.theguardian.com/australia-news/2019/sep/19/australias-budget-effectively-in-balance-after-46bn-underspend-on-ndis5. https://www.canberratimes.com.au/story/7326059/robo-planning-approach-labor-states-fire-shot-ahead-of-crunch-ndis-meeting/6. Specifically, the report states that a chain ladder analysis, prevalence methodology and decay methodology have been used (p24).
8
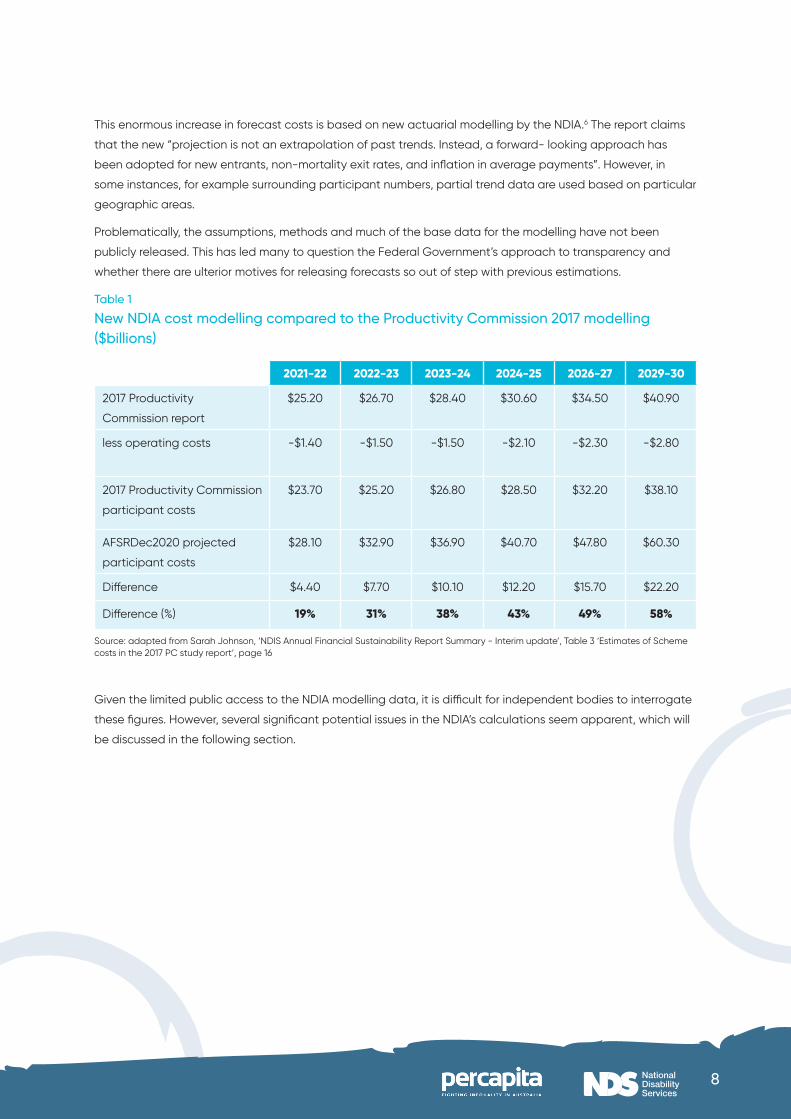
This enormous increase in forecast costs is based on new actuarial modelling by the NDIA.6 The report claims
that the new “projection is not an extrapolation of past trends. Instead, a forward- looking approach has
been adopted for new entrants, non-mortality exit rates, and inflation in average payments”. However, in
some instances, for example surrounding participant numbers, partial trend data are used based on particular
geographic areas.
Problematically, the assumptions, methods and much of the base data for the modelling have not been
publicly released. This has led many to question the Federal Government’s approach to transparency and
whether there are ulterior motives for releasing forecasts so out of step with previous estimations.
Table 1
New NDIA cost modelling compared to the Productivity Commission 2017 modelling ($billions)
2021-22 2022-23 2023-24 2024-25 2026-27 2029-30
2017 Productivity
Commission report
$25.20 $26.70 $28.40 $30.60 $34.50 $40.90
less operating costs -$1.40 -$1.50 -$1.50 -$2.10 -$2.30 -$2.80
2017 Productivity Commission
participant costs
$23.70 $25.20 $26.80 $28.50 $32.20 $38.10
AFSRDec2020 projected
participant costs
$28.10 $32.90 $36.90 $40.70 $47.80 $60.30
Difference $4.40 $7.70 $10.10 $12.20 $15.70 $22.20
Difference (%) 19% 31% 38% 43% 49% 58%
Source: adapted from Sarah Johnson, ‘NDIS Annual Financial Sustainability Report Summary - Interim update’, Table 3 ‘Estimates of Scheme costs in the 2017 PC study report’, page 16
Given the limited public access to the NDIA modelling data, it is difficult for independent bodies to interrogate
these figures. However, several significant potential issues in the NDIA’s calculations seem apparent, which will
be discussed in the following section.
9
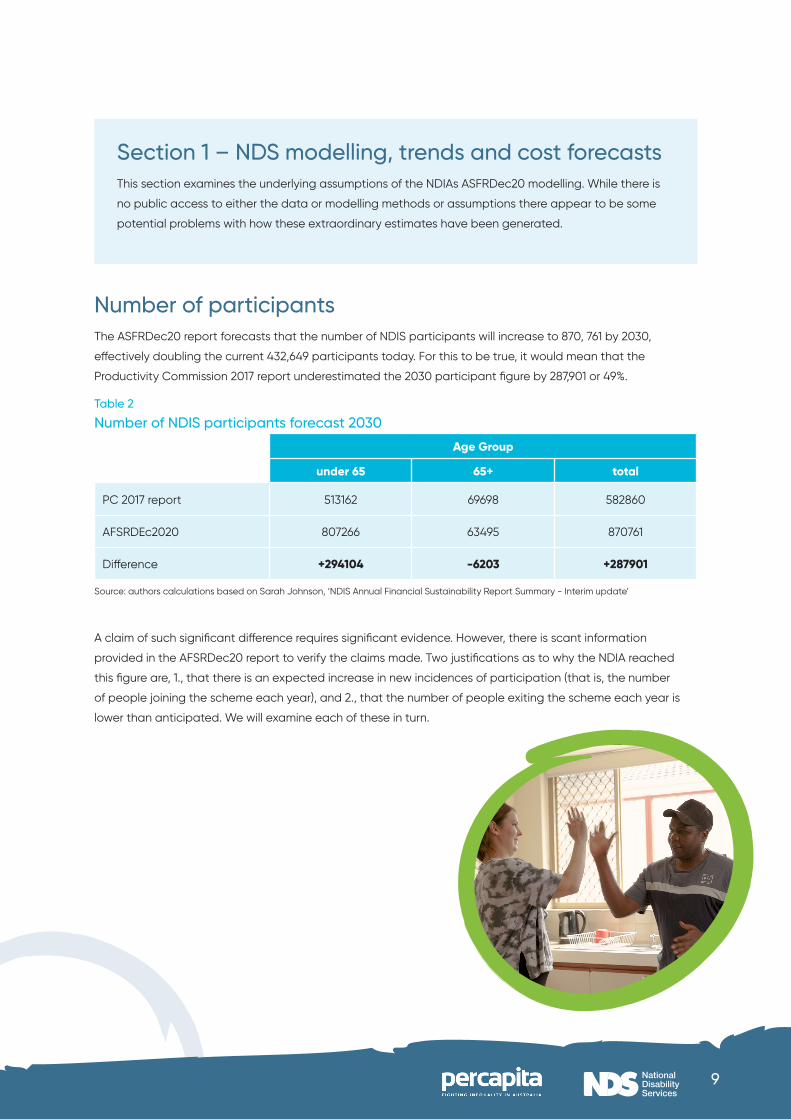
Number of participants The ASFRDec20 report forecasts that the number of NDIS participants will increase to 870, 761 by 2030,
effectively doubling the current 432,649 participants today. For this to be true, it would mean that the
Productivity Commission 2017 report underestimated the 2030 participant figure by 287,901 or 49%.
Table 2
Number of NDIS participants forecast 2030
Age Group
under 65 65+ total
PC 2017 report 513162 69698 582860
AFSRDEc2020 807266 63495 870761
Difference +294104 -6203 +287901
Source: authors calculations based on Sarah Johnson, ‘NDIS Annual Financial Sustainability Report Summary - Interim update’
A claim of such significant difference requires significant evidence. However, there is scant information
provided in the AFSRDec20 report to verify the claims made. Two justifications as to why the NDIA reached
this figure are, 1., that there is an expected increase in new incidences of participation (that is, the number
of people joining the scheme each year), and 2., that the number of people exiting the scheme each year is
lower than anticipated. We will examine each of these in turn.
Section 1 – NDS modelling, trends and cost forecastsThis section examines the underlying assumptions of the NDIAs ASFRDec20 modelling. While there is
no public access to either the data or modelling methods or assumptions there appear to be some
potential problems with how these extraordinary estimates have been generated.
10
Exit ratesThe AFSRDec2020 highlights that the exit rates have been significantly lower in 2020 than was previously
assumed.
The 7+ age category was anticipated to (non-mortality) exit the scheme at a rate of 1.04% per year. However,
for the calendar year 2020, that rate was just over half that at 0.55%, and the under 7 age group exited at a
rate of 0.61% compared to an anticipated 2.01%.
Given the extraordinary events that overtook the country in 2020, we would caution against any long-term
trend forecasting based on 2020 data, particularly where benefit retention is concerned.
People became more risk averse during times of uncertainty, as can be seen in the large increase in household
savings rates in 2020.7 Similar declines in household attitudes toward financial risk were also witnessed during
and after the GFC (see Cardak and Martin, 2019), and potentially in the corporate sector as well.8
NDIS participants may have very logically decided not to exit the scheme, and thereby increase any kind of
uncertainty during the pandemic.
Regardless of the 2020 data, exit rates have not been consistent since the roll out of the scheme. And the
exit rates are likely to be initially erratic and low, particularly in the first few years of roll out. The Productivity
Commission 2017 report states that: “The exit rates included in the NDIS model are long term assumptions.
It may take some years before participants — particularly children — receiving capacity building supports
through the early intervention requirements are in a position to leave the scheme.” (Productivity Commission,
2017, p. 171).
Unfortunately, the NDIA modelling technique for exit rates is far from clear. The ASFRDec2020 states that “[T]he
two drivers in the growth in the number of participants is the rate of new entrants to the Scheme, and the rate
at which participants exit the Scheme” (page 8) but then goes on to say that “[D]espite the recent experience,
lower rates of non-mortality exits have not been adopted in this projection.” (p57)
It is unclear then, what role exit rates play in the changes between the new modelling and previous modelling.
Because of this lack of clarity over the drivers of increased participant numbers, analysing the forecasts is not
possible.
7. https://www.afr.com/policy/economy/consumers-sitting-on-140b-post-pandemic-war-chest-20210730-p58eh38. https://www.rba.gov.au/speeches/2021/sp-so-2021-06-02.html
11
Incidence of participationIf non-mortality exit rates are not changed in the new modelling, it would appear that the AFSRDec20
modelling assumes that the increase in participant numbers is primarily due to higher rates of people with
disabilities entering the scheme. The report states that;
“The increase in projected participant numbers prior to 2030 is mainly attributable to higher assumed
prevalence of developmental delay. After 2030, autism and intellectual disability are the main drivers of
increasing participant numbers, reflecting the transition of children with developmental delay to autism and
intellectual disability. The trajectory is consistent with the increasing trends seen in successive Surveys of
Disability, Caring and Ageing (released by the ABS) but based on Scheme experience is projected to increase
at a faster rate.” (NDIA, 2021, p. 59)
There are several key points to make in relation to this issue. These relate to potential real increases in
participant numbers, and also to potential errors in the new NDIA modelling assumptions.
Firstly, it appears likely that there will be higher participant numbers than the original Productivity Commission
assessment. This is firstly due to poor quality state-level data on disability rates during earlier modelling.
Among disability sector experts there is a broad acknowledgement that state-level data prior to the NDIS did
not capture the true prevalence of disability in the community.
Secondly, this is due to the long history of former disability services being of poor quality and access. This
led to a high level of “unmet need”, with people unable to access their required services, which supressed
perceived rates of need (Ohlin, 1999; Mavromaras et al., 2018).
Thirdly, sector specialists have noted that with the commencement of the NDIS, other Tier 2 services have been
withdrawn. This leads more people with disabilities to seek their services through the NDIS, meaning a transfer
of costs between funding sources, rather than an absolute increase in total disability spending.
However, while there may be greater need than originally anticipated it seems probable that the AFSRDec20
overstates this issue in their trend forecast. These forecasts are based on rates seen in “certain geographical
areas”. What these areas are and why they are chosen is not fully explained in the AFSRDec20 paper.
We assume that this indicates that the new NDIA modelling places greater weight on pilot areas where the
longest trend data is available. This would mean pilot area where all potential participant groups, rather
than age cohorts, were incorporated into the scheme. These areas include Geelong, Newcastle and Barwon
Region.
Other trial areas, such as in South Australia and Tasmania, were cohort based, and thus inappropriate for such
modelling.
However, modelling from these sites may not represent need among the wider population, unless significantly
adjusted. Geelong for example, has a higher rate of Supported Independent Living (SIL) participants than
the wider public. This is due to the commitment of the state government to keep residents of the now closed
Colanda institution close to their former home. Clustering of disabled people with high levels of need is
common, with families moving to where support and medical services are located (See Figure 1).
9. https://www.premier.vic.gov.au/new-disability-housing-ending-institutionalised-care/
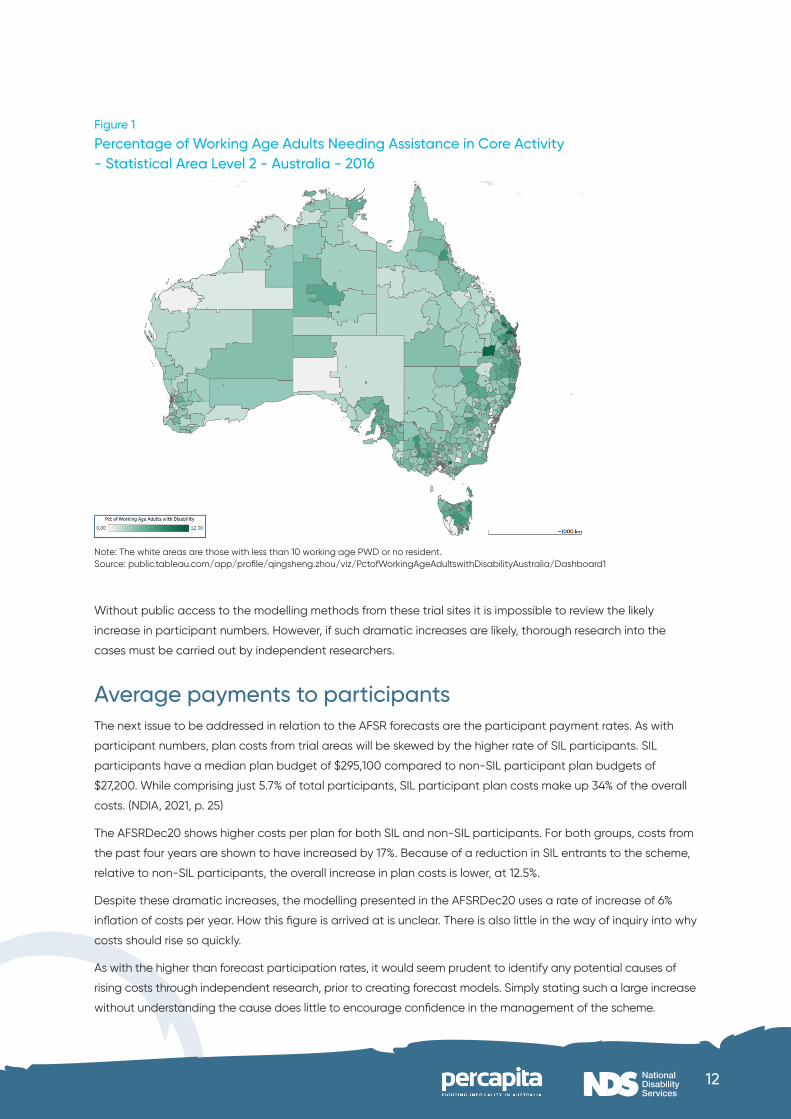
12
Figure 1
Percentage of Working Age Adults Needing Assistance in Core Activity - Statistical Area Level 2 - Australia - 2016
Note: The white areas are those with less than 10 working age PWD or no resident. Source: public.tableau.com/app/profile/qingsheng.zhou/viz/PctofWorkingAgeAdultswithDisabilityAustralia/Dashboard1
Without public access to the modelling methods from these trial sites it is impossible to review the likely
increase in participant numbers. However, if such dramatic increases are likely, thorough research into the
cases must be carried out by independent researchers.
Average payments to participantsThe next issue to be addressed in relation to the AFSR forecasts are the participant payment rates. As with
participant numbers, plan costs from trial areas will be skewed by the higher rate of SIL participants. SIL
participants have a median plan budget of $295,100 compared to non-SIL participant plan budgets of
$27,200. While comprising just 5.7% of total participants, SIL participant plan costs make up 34% of the overall
costs. (NDIA, 2021, p. 25)
The AFSRDec20 shows higher costs per plan for both SIL and non-SIL participants. For both groups, costs from
the past four years are shown to have increased by 17%. Because of a reduction in SIL entrants to the scheme,
relative to non-SIL participants, the overall increase in plan costs is lower, at 12.5%.
Despite these dramatic increases, the modelling presented in the AFSRDec20 uses a rate of increase of 6%
inflation of costs per year. How this figure is arrived at is unclear. There is also little in the way of inquiry into why
costs should rise so quickly.
As with the higher than forecast participation rates, it would seem prudent to identify any potential causes of
rising costs through independent research, prior to creating forecast models. Simply stating such a large increase
without understanding the cause does little to encourage confidence in the management of the scheme.
13
Reduced spending in other budget areasThe introduction of the NDIS means that costs to the tax payer from other services are being reduced. The
scheme was predicted to reduce costs significantly for other areas of government, including:10
• the National Disability Agreement
• Home and Community Care
• residential and community aged care
• aids and appliance schemes
• transport taxi subsidy schemes
• psychiatric disability community supports
Only the Federal Government have the data to produce an analysis of the cross-budgetary savings stemming
from NDIS spending. However, to our knowledge no such analysis has been carried out. To truly understand the
NDIS from a cost benefit perspective, such an accounting exercise is essential.
Employment and incomeThe NDIS generates employment in several ways – within the agency itself, through plan payments to disability
support workers, allied health professionals etc, and through wider webs of economic activity. These include
directly related workers, for example in the manufacture, sale and service of health equipment, and at a
secondary level, in terms of the wider economic activity surrounding NDIS spending. These can include an
increase in demand for goods and services from car maintenance to coffee.
The NDIS creates employment for around 11,550 people, including 4,396 APS employees, 1,692 labour hire
contractors and consultants, and 5,462 people employed by NDIA’s partners (NDIA, 2020b).
There are an estimated 270,000 workers across 20 occupations working in 11,600 providers. These include
disability support workers, allied health professionals and physical therapists.
Section 2 – Economic impacts of the NDIS scheme In this section, we examine the effect of NDIS spending on the economy of Australia. Disability support
spending is not a pure cost, but an investment from which positive economic outcomes are produced.
These benefits can be broadly broken down into three main categories: a reduction in costs for other
government services, an increase in direct employment and economic activity from NDIS spending,
and a broader secondary increase in economic activity stimulated by the NDIS spending. These are
discussed in turn.
10. Take from Productivity Commission 2011
14
Former Unpaid Carers
Given the investment in paid care under the NDIS, a significant number of former unpaid carers will have re-
entered the workforce.
The NDIA Family and Carer Outcomes Reports track entry into the workforce of former unpaid carers. Each
report indicates a significant return/entry to work for the carers and parents of NDIS participants. The 2020
Report found that for carers of 0-14 year-old NDIS participants who joined the Scheme in 2016-17, the
percentage working in a paid job increased by 8.2%, from 44.9% to 53.0% by 2019-20. Of those with a paid job,
the percentage working 15 hours or more per week increased by 6.3% from 79.0% to 85.2%.
For carers of NDIS participants aged 15-24, the outcomes are also large, with the percentage working in a
paid job increased by 4.9%, from 49.4% to 54.4%. Of those with a paid job, the percentage working 15 hours or
more per week increased by 5.1% from 85.1% to 90.2% (NDIA, 2020a)
Entrants from 2019 and 2020 have higher initial work rates, which is likely due to NDIS participants from earlier
years having higher support requirements. This makes estimating the overall impact of the NDIS on the unpaid
carer rate of entrance into work difficult to estimate.
Without full public access to the NDIA data, it is not possible to give a firm estimate as to how many FTE jobs
this return to work would generate. However, the impact is likely to be in the tens of thousands.
Over 71% of carers are women,11 meaning that the enabling of carers to take up paid employment is likely to
have a positive impact on gender equity in workforce opportunity.
Informal Carers
The NDIS funding is not only important because of its direct contribution to GDP. Health programmes impact
people’s educational attainment, the quality of the environment, and their levels of ‘social capital’ (trust in their
neighbours, friends, and family), among others (Reeves, 2013).
In the simplest sense, there is a social effect beyond the traditional fiscal multiplier, a positive externality effect.
This effect pertains to the benefits accrued to the NDIS recipient and their carers both formal and informal.
Informal carers are amongst the most significant contributors to society, with the value of their contribution
estimated to be between 5 and 30 billion dollars annually. But this figure does not take into consideration the
immense value they afford society more broadly. Such estimates only focus on the economic value of hours
worked, not the social capital generated, the human capital value imbued, or the contributions they make
through paid employment or broader productive contributions to society the corollary of this is that economic
evaluations often understate their contributions.
One clear contribution that carers make to society that is disregarded in the NDIS funding debate is their
involvement in paid employment and economic activity. Carers often balance complex carer commitments
with their employment, with many working significant hours while maintaining carer duties.
Notably, however, many find it hard to balance such duties absent of support and have to relinquish career
progression and employment opportunities to maintain their carer duties. This is pertinent given the number of
carers balancing such competing duties.
11. https://www.abs.gov.au/statistics/health/disability/disability-ageing-and-carers-australia-summary-findings/latest-release#data-download

15
There are three elements associated with engaging with paid employment, firstly there is a coordination
challenge and secondly a productivity challenge and thirdly there must be sufficient support to enable labour
market participation. It is important to consider these challenges in the context of the NDIS and the proposed
reduction in funding.
The coordination challenge refers to the carers capacity to co-ordinate competing challenges to ensure
sufficient care and addressing their employment needs. The productivity challenge pertains to the capacity
of the carer to engage in productive work given the challenges associated with their responsibilities while the
third is arguably the most pertinent, receiving sufficient support to engage in viable work.
The provision of NDIS funding coincides with a significant increase in the reliance of carers on wages, up 5.94%
since 2015, with less reliance on other sources of income. This is a positive outcome with carers becoming
engaged with the workforce and participating more in paid employment. This has positive wellbeing benefits
for the carer, and the value to the economy of this increased participation cannot be understated. Reducing
NDIS funding would potentially reverse these substantial improvements and may result in carers finding it
harder to maintain paid employment.
Figure 2
Wage increases, carers versus non carers
0.0%
2.0%
4.0%
6.0%
8.0%
10.0%
12.0%
14.0%
16.0%
Increase in carer income Increase in non carer income
Notably, carer wage levels have increased more quickly than non-carer wages since the commencement of
the NDIS. Carer incomes have increased by 14.3% since 2010, while general wages increased by 10.8% over the
same term. This is in part likely due to a significant increase in DSW award wages. It is also a further sign that
carers are increasingly, able to secure paid employment, which is beneficial to the broader economy.
It is also pertinent to acknowledge that carers, absent of support may not be able to participate in the
economy because they simply lack the viable hours to offer to an employer. This suggests that there may be
a threshold effect based on their number of direct carer hours and or the formal support hours the recipient of
care is able to secure.
16
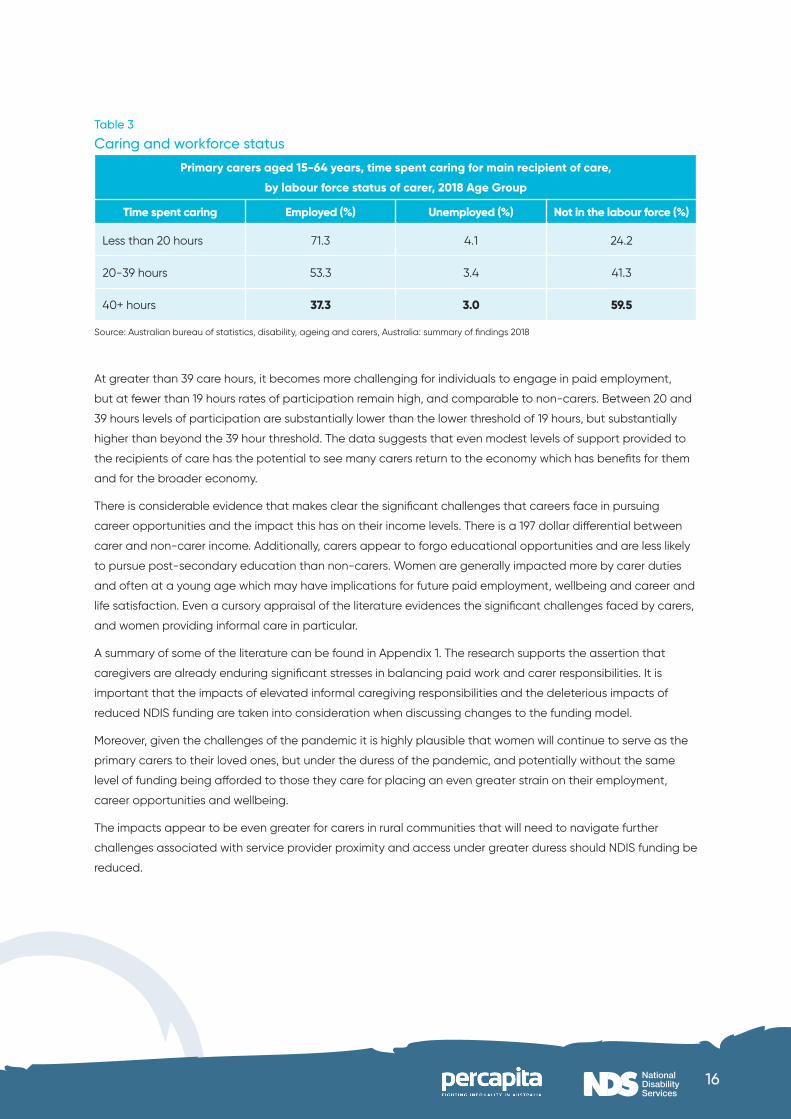
Table 3
Caring and workforce status
Primary carers aged 15-64 years, time spent caring for main recipient of care,
by labour force status of carer, 2018 Age Group
Time spent caring Employed (%) Unemployed (%) Not in the labour force (%)
Less than 20 hours 71.3 4.1 24.2
20-39 hours 53.3 3.4 41.3
40+ hours 37.3 3.0 59.5
Source: Australian bureau of statistics, disability, ageing and carers, Australia: summary of findings 2018
At greater than 39 care hours, it becomes more challenging for individuals to engage in paid employment,
but at fewer than 19 hours rates of participation remain high, and comparable to non-carers. Between 20 and
39 hours levels of participation are substantially lower than the lower threshold of 19 hours, but substantially
higher than beyond the 39 hour threshold. The data suggests that even modest levels of support provided to
the recipients of care has the potential to see many carers return to the economy which has benefits for them
and for the broader economy.
There is considerable evidence that makes clear the significant challenges that careers face in pursuing
career opportunities and the impact this has on their income levels. There is a 197 dollar differential between
carer and non-carer income. Additionally, carers appear to forgo educational opportunities and are less likely
to pursue post-secondary education than non-carers. Women are generally impacted more by carer duties
and often at a young age which may have implications for future paid employment, wellbeing and career and
life satisfaction. Even a cursory appraisal of the literature evidences the significant challenges faced by carers,
and women providing informal care in particular.
A summary of some of the literature can be found in Appendix 1. The research supports the assertion that
caregivers are already enduring significant stresses in balancing paid work and carer responsibilities. It is
important that the impacts of elevated informal caregiving responsibilities and the deleterious impacts of
reduced NDIS funding are taken into consideration when discussing changes to the funding model.
Moreover, given the challenges of the pandemic it is highly plausible that women will continue to serve as the
primary carers to their loved ones, but under the duress of the pandemic, and potentially without the same
level of funding being afforded to those they care for placing an even greater strain on their employment,
career opportunities and wellbeing.
The impacts appear to be even greater for carers in rural communities that will need to navigate further
challenges associated with service provider proximity and access under greater duress should NDIS funding be
reduced.
17
People With a Disability
People aged between 15 and 64 years with a disability have both lower rates of labour force participation
(53.4%) and higher unemployment rates (10.3%) than people without disability (84.1% and 4.6% respectively).
There are 2.1 million Australians of working age with disability. Of these, just under half were employed (47.8%),
compared with 80.3% of people without disability.12
Over the last decade, the gap between employment rates for people reporting a disability compared to those
not reporting a disability has widened. Over 30% of those reporting disabilities assert they find it challenging
securing paid employment. Participation rates in Australia have remained largely stagnant while other OECD
countries evidence much higher rates of participation, and smaller deficits between participation rates of
those reporting disabilities and those who do not. It is however important to not ascribe the deficit to merely
a desire not to participate, the likely impactions of poorer labour market outcomes are an obvious source of
discouragement.
Figure 3
Participation rates and differential
27.0%
27.5%
28.0%
28.5%
29.0%
29.5%
30.0%
30.5%
31.0%
0%
10%
20%
30%
40%
50%
60%
70%
80%
90%
2009 2010 2011 2012 2015 2018
Reporting a disabil ity Not reporting a disability Differential
Source: ABS, Disability, Ageing and Carers, Australia: Summary of Findings 2018
For NDIS participants, trends appear similar or perhaps slightly better. For those who have been in the scheme
for at least two years there have been some increases in employment, including:13
• nine percentage increase from 12% to 21% for participants aged 15-24 years.
• two percentage decrease from 25% to 23% for participants aged 25+ years, which is concerning.
• no change in the rate of employment for participants overall (15 years and older), which remains at 22%.
The rates of employment among people reporting a disability could be increased considerably. A study by
Jensen et al (2005) considered the impact of disability on employment while accounting for demographic
factors. The study identified that when correctly accounting for demographic considerations the level of
employment between those with a disability and those without should be about 5%. The authors asserted that
the divergence was therefore due to other factors.
12. ABS 2018, Disability, Ageing and Carers, Australia: Summary of Findings 201813. (NDIA, 2020b)
18
A subsequent Deloitte (Deloitte Access Economics, 2011) study noted that these differences were due to limited
capacity or systematic factors, so called “removable barriers” to employment. This means that there is still a
great deal of labour force capacity left to be found, which will require greater spending and efforts though the
NDIS and other mechanisms.
In all, there seems to be a significant gap between the level of change in employment for people with
disabilities compared to the Productivity Commission’s 2011 modelling.
Overall economic impact - estimating a fiscal multiplierWhile some of the NDIS funding is money formally spent through different services, the NDIS introduced a
significant amount of new money into the economy. Because of the nature of that spending – at local level, on
small businesses etc. – the impact will have greater impact than other types of government spending. It is well
known in healthcare economics that public health expenditure has significant broad impacts.
While these fiscal multipliers benefit the health sector, a significant employment and economic contributor to
the economy, more than other sectors, the benefits are widespread. This is due to the broad-based impacts of
health spending programs for not just the funding recipient, but also their personal network, and the positive
externalities associated with health expenditure.
These indirect and network effects associated with the NDIS (informal carer workforce participation, NDIS
recipient workforce participation, firm level innovation, and productivity solutions deriving from the NDIS and
the broader ecosystem) should not be understated and underscore the need to viably fund the initiative.
NDIS plan money is frequently spent in local small businesses with typically tight margins. This produces what
economists call “high velocity money”, with money changing hands between economic agents rapidly; a sign
of a healthy market.
The Productivity Commission estimated that by 2050, the collective impact from employment gains “… would
be around a one per cent increase in GDP above its counterfactual level, translating to around $32 billion in
additional GDP (in constant price terms) in that year alone” (Productivity Commission, 2011, p. 941). So far as
we know, no modelling has been done to estimate the total impact of the NDIS on economic activity and
employment based on these initial forecasts. Such modelling should be undertaken by the NDIA using their
wealth of data which is unavailable to outside agencies.
Within the health economics literature, estimates of health spending multipliers range from 0.9 (Furceri and
Zdzienicka (2010)) to 4 (Erceg and Linde (2010). However, Furceri and Zdzienicka (2010) do not account for
the zero lower bound assumption or recessionary interval in full. Given recent trends of low, zero or effectively
negative government borrowing rates mean that zero lower bound assumptions should be incorporated into
any understanding of the economic impact of the NDIS.
19
Many studies notes that multipliers are largest when operating under a zero lower bound assumption (Eggertson
(2010), (Christiano et al. (2011), Erceg and Linde (2010)). Based on these assumptions, estimates of healthcare
spending multipliers range from 2.3 (Eggertson (2010), to 3.7 Christiano et al. (2011), and 4 (Erceg and Linde (2010)).
The direct benefit of the NDIS is likely to exceed the value of expenditure markedly given that health expenditure
multiplier effect is estimated to exceed unity. This is particularly the case during an economic downturn. Research
strongly supports the conclusion that health expenditure has the greatest impact during times of economic
decline and when interest rates are at their lowest, and consequently any decision to reduce NDIS funding would
be contrary to historical evidence supporting such expenditure during times of economic instability.14
Reeves et al (2013) incorporate a zero bound assumption and also account for recessionary effects. Based on
these assumptions they observe a multiplier of 3.61. Given the current condition of the Australian economy,
the likelihood of a continuation of ultra-low borrowing costs and the potential for extended recessionary
conditions we find their modelling compelling.
However, for the sake of conservatism we consider the multipliers derived by Furceri and Zdzienicka (2010) and
Reeves et al (2013). We therefore employ the average of the two estimates to derive a multiplier of 2.25.
Based on this relatively conservative estimate, we posit that the NDIS will in 2020-21 produce economic
activity in the region of $29 billion in addition to that created by the $23.3 billion of NDIS spending; a total of
$52.4 billion.
This figure seems broadly in line with the Productivity Commission’s 2011 forecast for spending at this level.
As the Productivity Commission 2011 report states very clearly, “(t)he bottom line is that benefits of the NDIS
would significantly exceed the additional costs of the scheme.” (p941).
14. See Christiano et al. (2011), Eggertson (2010) and Erceg and Linde (2010)
20
The cost of underinvestingUnderinvesting in the NDIS, at this time of immense uncertainty would imperil disability services providers,
reduce workforce outcomes and create mistrust from providers, participants and their families. It would also
likely increase demand from other government service areas, meaning that “savings” from cost cutting would
be reduced. In short, excessive cost cutting would be self-defeating.
Based on the multiplier outlined above, we find that for every billion dollars the NDIS is underfunded economic
activity is estimated to decline by 2.25 billion dollars. This equates to a 0.22% reduction in services GDP and a
0.14% reduction in overall GDP.15
The impact on the service sector economy of this reduction in activity is not inconsequential particularly at
a time when traditional monetary policy appears to be largely ineffective, given the zero bound interest rate
assumption that has traditionally underlies this approach. It is notable that the RBA has been employing
a strategy of quantitative easing which supports this conclusion. Given that traditional monetary policy is
largely ineffectual at this time, not benefiting from the strong fiscal multiplier effect that derives from health
expenditure appears to be unsound.
The fiscal multiplier is a measure of the extent to which an expenditure generates a fiscal response, and
it is highly plausible that the multiplier effect is at its highest when households are facing greater liquidity
challenges, as many are presently. Consequently, NDIS expenditures appear to be conducive to greater
economic activity and GDP, at a time when traditional mechanisms for stimulus are not plausible.
The impact of the underinvestment in the NDIS on employment is also immensely important, noting that the
impacted employee cohorts are already facing significant challenges, while providing essential frontline care
and support to some of the most vulnerable individuals in society.
Workforce participation should be the emphasis of government efforts, not NDIS funding cutsIt is estimated that for each billion-dollar cut in NDIS funding will result in around 10,270 FTE job losses.
This calculation is based on the conservative weighted multiplier estimate, based on Furceri and Zdzienicka
(2010) and Reeves et al (2013) and the SCHADS Award Level 2, Paypoint 1. The broader estimate of employment
loss is based on the relationship between production and employment as modelled by Okun’s Law. The
determination that losses are to be borne disproportionately by women and the sector is based on data from
the JobOutlook database DESE (2021) and the assumption that the majority of job losses will be within the
DSW cohort.
Section 3 – Economic implications of NDIS funding reductions and cost cutting
15. These estimates are based on the conservative weighted multiplier outlined in the previous section. It is notable that the ‘zero bound’ multiplier estimates of Christiano et al. (2011), Eggertson (2010) and Erceg and Linde (2010) are substantially larger. The multipliers in the noted studies, under a zero lower bound assumption, are estimated as 3.7, 2.3 and 4 respectively. Applying these multipliers, would see an estimated impact of between 2.3 billion and 4 billion dollars per 1 billion dollars the NDIS is underfunded.
21
Women will bear the brunt of these job losses, with women accounting for 80%16. This is a particularly
concerning aspect of the impact of the reduction in NDIS funding levels.
Research strongly suggests that the indirect and network effects of underinvestment in health are likely as
significant as the direct effects. The overall consequences of underinvesting in the NDIS are significant. This
is generally asserted to be due to the benefits to the personal networks of beneficiaries, their carers and the
positive externalities associated with health investment. These indirect benefits coupled with the significant
fiscal and employment benefits underscore the need to invest sufficiently in the NDIS.
The development of a stable workforce requires clear commitment from the government that ongoing decent
work will be available in the sector. More broadly, the development of a stable and secure disability workforce
will also help ease labour supply in similar sectors, particularly aged care and veterans’ care (Department of
Social Services, 2021), providing improved labour market outcomes more broadly across the care sectors.
Any emphasis on funding cuts reflects a misunderstanding of the opportunity to expand the economy through
greater workforce participation.
Critical attention should be afforded not to the reduction in scheme funding but rather encouraging greater
workforce participation in the economy through the scheme. Many countries within the OECD including New
Zealand have achieved vastly higher rates of workforce participation amongst members of their population
with disabilities through inclusive workplace programs, and job readiness and preparation schemes. It is
important to recognise that Australia has historically lagged behind other OECD countries in facilitating
stronger labour market participation amongst individuals with a disability.
If we are able to achieve even modest gains through the NDIS and aligned activities that improve workforce
participation, by approximately 10%, the gains to the economy are likely to exceed 4.5 billion dollars annually.
Reducing NDIS funding will arrest any gains achieved through recent years progress. Notably, this participation
target is lower than comparable OECD countries, if we were able to achieve similar rates to OECD exemplars,
the benefits is likely to equate to more than 10 billion dollars annually. It is apparent that these modest targets
are achievable (Deloitte 2010).
NDIS providersAny major structural adjustment to the funding model provided to the scheme would be inapt given the need
to allow providers time to transition to a more competitive cost and delivery model, where market scrutiny
and competitive forces will result in efficient service delivery and price discovery. Through the demand driven
system, as consumers of disability services seek the most efficient and effective service providers, efficiency
and cost gains will be realised.
The margins of companies providing support to NDIS participants are tight. Utilisation data collected as
part of the TTP (Temporary Transfer Payments)17 requirements suggests that the sector is already achieving
high utilisation rates. This means firstly that the market is performing well in terms of value for money. It also
means that any funding cuts will not be easily accommodated by any excess capacity within service provider,
ultimately this suggests that funding cuts will come at the expense of disability support worker employment.
The scheme is already moving to a more efficient approach through the TTP requirements that necessitate
the publication of service prices to reduce information asymmetries between providers, their rivals and clients.
16. Department of Education Skills and Employment (2021) JobOutlook database 17. Final report – Temporary Transformation Payment Benchmarking Survey National Disability Insurance Agency May 2020
22
Additionally, the NDIS provider database enables easy access to rivalrous services, and promotes efficiencies.
Moreover, the provider participation in the TTP benchmarking survey also hastens the transition from block
funding to the more competitive demand driven approach.
Wage rates within the sector evidence little variation, with wage rates for DSW largely falling within a narrow
band of $26.55 to $32.67 net of outliers18. These figures certainly suggest that the market is evidencing
moderate to strong competition effects.
It is critical that funding certainty is provided to the sector, as research based the TTP data indicates a
significant relationship between implied sector margins at the firm level and the permanent employment rate.
This implies that inadequate or near zero margins, the likely consequence of a major reduction in funding, will
significantly impeded provider capacity to maintain the same level of permanent employment.
Eroding the revenue base of the industry through reductions in the NDIS funding base will exacerbate existing
casualisation trends that will result in poorer service quality, and a diminution of industry capability.
ConclusionThe funding of care-based government services is too often presented as a cost to be worn by working tax
payers. By contrast many other sectors, such as defence, are seen as the harbingers of cutting edge technological
developments, high skilled jobs and broad economic innovation.
But the reality is that the care economy is a far more effective creator of jobs, small business and local-level
spending: estimates for the fiscal multiplier of defence spending range from 0.6 (Barro and Redlick, 2011) to 1.2
(Ramey, 2011); far lower than we estimate for NDIS spending. The NDIS provides rapid spending in local supply
chains, with a heavy focus on personal services. This means that NDIS spending transfers into wages and
supports small businesses at a very high rate compared to other kinds of government spending.
The gendered nature of care work, both paid and unpaid, means that adequate funding of the NDIS supports
female workers and carers returning to work at a particularly high rate. Given the relatively poor female labour
market outcomes in Australia compared to other countries in the OECD (Dawson, Kovac and Lewis, 2020), this is
a significant dividend in itself, and should not be overlooked.
Clearly there are improvements to be made to how the NDIS is administered, and there will be places where
costs can be reduced or benefits increased. The workforce outcomes for people with disabilities for example,
shows a rather obvious gap between the anticipated outcome and how things stand these few years into
the scheme. But any changes must be made in the original spirit of the NDIS which was for a scheme in which
participant decision-making is central.
But effective decision-making cannot be made in the absence of reliable information. The modelling and data
sets used to produce forecasts should be released by the NDIA. This could be limited to trusted parties within
the academic and advocacy community if data security is considered an issue. This will allow for alternate
interpretations and even solutions can be generated with the input of all parties.
18. Final report – Temporary Transformation Payment Benchmarking Survey National Disability Insurance Agency May 2020
23
Bibliography• Barro, R. J. and Redlick, C. J. (2011) ‘Macroeconomic Effects From Government Purchases and Taxes’, The
Quarterly Journal of Economics. Oxford Academic, 126(1), pp. 51–102. doi: 10.1093/QJE/QJQ002.
• Cardak, B. A. and Martin, V. L. (2019) ‘Once in a Lifetime? The Effects of the Global Financial Crisis on
Household Willingness to Take Financial Risk’, Economic Record. John Wiley & Sons, Ltd, 95(311), pp.
442–461. doi: 10.1111/1475-4932.12506.
• Dawson, E., Kovac, T. and Lewis, A. (2020) Measure For Measure: Gender Equality in Australia About Per
Capita.
• Deloitte Access Economics (2011) ‘The economic benefits of increasing employment for people with
disability’, (June). Available at: https://www2.deloitte.com/au/en/pages/economics/articles/economic-
benefits-increasing-employment-for-people-with-disability.html (Accessed: 20 September 2021).
• Department of Social Services (2021) ‘NDIS National Workforce Plan : 2021 – 2025’, (June), pp. 2021–2025.
Available at: https://www.dss.gov.au/sites/default/files/documents/06_2021/ndis-national-workforce-
plan-2021-2025.pdf.
• Dickinson, H. et al. (2021) Avoiding simple solutions to complex problems: Independent Assessments are
not the way to a fairer NDIS.
• Jensen, J. et al. (2005) ‘Work Participation among People with Disabilities: Does the Type of Disability
Influence the Outcome? - Ministry of Social Development’, Social Policy Journal, 24. Available at: https://
www.msd.govt.nz/about-msd-and-our-work/publications-resources/journals-and-magazines/
social-policy-journal/spj24/24-work-participation-among-people-with-disabilities-does-the-type-of-
disability-influence-the-outcome-p134-159.html (Accessed: 20 September 2021).
• Mavromaras, K. et al. (2018) ‘Evaluation of the NDIS Final Report’, (February).
• NDIA (2020a) NDIS Family and Carer Outcomes Report. Available at: https://data.ndis.gov.au/reports-
and-analyses/outcomes-and-goals/family-and-carer-outcomes-report (Accessed: 20 September 2021).
• NDIA (2020b) ‘NDIS Quarterly Report to disability ministers June 2020’, (June).
• NDIA (2021) NDIS Financial Sustainability Report 2020. Available at: https://www.ndis.gov.au/news/6590-
ndis-financial-sustainability-report-release (Accessed: 13 September 2021).
• Ohlin, J. (1999) Unmet Need in Disability Services: Shortfall or Systematic Failure? – Parliament of Australia.
Available at: https://www.aph.gov.au/About_Parliament/Parliamentary_Departments/Parliamentary_
Library/Publications_Archive/CIB/cib9900/2000cib06 (Accessed: 15 September 2021).
• Productivity Commission (2011) Disability Care and Support Productivity Commission. Available at: https://
www.pc.gov.au/inquiries/completed/disability-support/report (Accessed: 13 September 2021).
• Productivity Commission (2017) National Disability Insurance Scheme (NDIS) Costs. Available at: https://
www.pc.gov.au/inquiries/completed/ndis-costs/report (Accessed: 6 September 2021).
• Ramey, V. A. (2011) ‘Can Government Purchases Stimulate the Economy?’, Journal of Economic Literature,
49(3), pp. 673–85. doi: 10.1257/JEL.49.3.673.
• Adair, T., Williams, R. and Taylor, P., 2013. A juggling act: Older carers and paid work in Australia.

24
• Alan Auerbach and Yuriy Gorodnichenko. Measuring the output responses to fiscal policy. American
Economic Journal: Economic Policy, 4(2):1–27, 2012.
• Andrew Mountford and Harald Uhlig. What are the effects of fiscal policy shocks? Journal of Applied
Econometrics, 24(6):960–92, 2009.
• Antonio Spilimbergo, Steve Symansky, and Martin Schindler. Fiscal multipliers. IMF Staff Position Note
SPN/09/11, International Monetary Fund, 2009
• Arksey, H. and Glendinning, C. (2008), Combining Work and Care: Carers’ Decision-making in the Context
of Competing Policy Pressures. Social Policy & Administration, 42: 1-18. https://doi.org/10.1111/j.1467-
9515.2007.00587.x
• Bittman, M., Hill, T. and Thomson, C., 2007. The impact of caring on informal carers’ employment, income and
earnings: a longitudinal approach. Australian Journal of Social Issues, 42(2), pp.255-272.
• Cass, B., Smith, C., Hill, T., Blaxland, M. and Hamilton, M., 2009. Young carers in Australia: understanding the
advantages and disadvantages of their care giving. FaHCSIA Social Policy Research Paper, (38).
• Eric Leeper, Michael Plante, and Nora Traum. Dynamics of fiscal financing in the United States. Journal of
Econometrics, 156(2):304–21, 2010.
• Eric Leeper, Nora Traum, and Todd Walker. Clearing up the fiscal multiplier morass. American Economic
Review, 107(8):2409–54, 2017
• Hussain, R.; Wark, S.; Ryan, P. Caregiving, Employment and Social Isolation: Challenges for Rural Carers in
Australia. Int. J. Environ. Res. Public Health 2018, 15, 2267. https://doi.org/10.3390/ijerph15102267
• Jonathan Heathcote, Kjetil Storesletten, and Gianluca Violante. The macroeconomic implications of rising
wage inequality in the United States. Journal of Political Economy, 118(4):681–722, 2010.
• King, T., Singh, A. and Disney, G., 2021. Associations between young informal caring and mental health:
a prospective observational study using augmented inverse probability weighting. The Lancet Regional
Health-Western Pacific, 15, p.100257.
• Knotek, Edward S. II. “How Useful Is Okun’s Law?” Federal Reserve Bank of Kansas City Economic Review,
Fourth Quarter 2007, 92(4) pp. 73-103.
• Matthew Canzoneri, Fabrice Collard, Harris Dellas, Behzad Diba, Fiscal Multipliers in Recessions, The
Economic Journal, Volume 126, Issue 590, February 2016, Pages 75–108, https://doi.org/10.1111/ecoj.12304
• Okun, Arthur M. ‘’Potential GNP: Its Measurement and Significance,” in Proceedings of the Business and
Economic Statistics Section of the American Statistical Association. Alexandria, VA: American Statistical
Association, 1962, pp. 89-104.
• Parker, et al. 2013 and Sahm, Shapiro, and Slemrod 2010
• Pickard, L., Brimblecombe, N., King, D., and Knapp, M. (2018) ‘Replacement Care’ for Working Carers? A
Longitudinal Study in England, 2013–15. Social Policy & Administration, 52: 690– 709. doi: 10.1111/spol.12345.
• Ramey, V.A. and Zubairy, S., 2018. Government spending multipliers in good times and in bad: evidence from
US historical data. Journal of Political Economy, 126(2), pp.850-901.
• Reeves, A., Basu, S., McKee, M., Meissner, C. and Stuckler, D., 2013. Does investment in the health sector
promote or inhibit economic growth?. Globalization and health, 9(1), pp.1-12.
25
• Robert Barro and Charles Redlick. Macroeconomic effects from government purchases and taxes. Quarterly
Journal of Economics, 126(1):51–102, 2011
• Smith, R., Martin, A., Wright, T., Hulbert, S. and Hatzidimitriadou, E., 2021. Integrated dementia care: A
qualitative evidence synthesis of the experiences of people living with dementia, informal carers and
healthcare professionals. Archives of Gerontology and Geriatrics, p.104471.
• Stuckler, D., Reeves, A. and Mckee, M., 2017. Social and economic multipliers: What they are and why they are
important for health policy in Europe. Scandinavian journal of public health, 45(18_suppl), pp.17-21.
• Veenstra, G., 2000. Social capital, SES and health: an individual-level analysis. Social science & medicine,
50(5), pp.619-629.
• Zhang, W., Sun, H. and L’Heureux, J., 2021. Substitutes or complements between informal and formal home
care in the Canadian longitudinal study on aging: Functional impairment as an effect modifier. Health Policy.
• Eggertsson, G., 2010, “What Fiscal Policy Is Effective at Zero Interest Rates?” NBER Macroeconomics Annual,
Vol. 25, pp. 59–112.
• Erceg, C. J., and J. Lindé, 2010, “Is There a Free Lunch in a Liquidity Trap?” International Finance Discussion
Papers No. 1003 (Washington: U.S. Federal Reserve System).
• DeLong, B.J., and L.H. Summers, 2012, “Fiscal Policy in a Depressed Economy,” presented to Brookings Papers
on Economic Activity, March 2012.
• Dolls, M., C. Fuest, and A. Peichl, 2012. “Automatic Stabilizers and Economic Crisis: US vs. Europe,” Journal of
Public Economics, Vol. 96, pp. 279–94.
• Botero, J., S. Djankov, R. Porta, and F. C. Lopez-De-Silanes, 2004, “The Regulation of Labor,” The Quarterly
Journal of Economics, Vol. 119, No. 4, pp.1339–82.
• Canzoneri, M., F. Collard, H. Dellas, and B. Diba, 2012, “Fiscal Multipliers in Recessions,” Discussion Papers,
Department of Economics 12-04 (Bern: Universität Bern).
• Christiano, L., M. Eichenbaum, and S. Rebelo, 2011, “When is the Government SpendingMultiplier Large?”
Journal of Political Economy, Vol. 119, No. 1, pp. 78–121.
• Jenson J, Sathiyandra. S, Rochford. M, Jones. D, Krishnan. V, McLeod. K, (2005) “Work Participation Among
People with Disabilities: Does the type of disability influence the outcome?” Social Policy Journal of New
Zealand, (24) March.
26
Appendix 1
Study Key Finding
King, T., Singh, A. and Disney, G., 2021.
Associations between young informal
caring and mental health: a prospective
observational study using augmented
inverse probability weighting. The Lancet
Regional Health-Western Pacific, 15,
p.100257.
Significant association between the provision of
informal care at a young age and future mental health
necessitating greater support for young informal carers.
Smith, R., Martin, A., Wright, T., Hulbert,
S. and Hatzidimitriadou, E., 2021.
Integrated dementia care: A qualitative
evidence synthesis of the experiences
of people living with dementia,
informal carers and healthcare
professionals. Archives of Gerontology
and Geriatrics, p.104471.
Given the negative consequences fragmented and
disjointed care can have on people living with dementia
and their families, action is needed to further support the
development of integrated dementia care services.
Zhang, W., Sun, H. and L’Heureux, J.,
2021. Substitutes or complements
between informal and formal home
care in the Canadian longitudinal study
on aging: Functional impairment as an
effect modifier. Health Policy.
The study consistently found that there was a negative
relationship between informal care hours and the
probability of receiving formal home care among middle-
aged and older adults and a negative coefficient of
the interaction term between informal care hours and
functional impairment level.
Bittman, M., Hill, T. and Thomson,
C., 2007. The impact of caring
on informal carers’ employment,
income and earnings: a longitudinal
approach. Australian Journal of Social
Issues, 42(2), pp.255-272.
The analysis shows that working age carers experience
disadvantage. Carers are more likely than non-carers to
reduce their hours of work or exit from the labour force
and earn lower levels of income. In planning for an ageing
population, policies will need to address these negative
effects and privatised costs of caring if the supply of
informal care is to be sustained in the future.
27
Pickard, L., Brimblecombe, N., King, D.,
and Knapp, M. (2018) ‘Replacement
Care’ for Working Carers? A Longitudinal
Study in England, 2013–15. Social Policy
& Administration, 52: 690– 709. doi:
10.1111/spol.12345.
The study found that, where the person cared for did not
receive at least one ‘key service’ (home care, personal
assistant, day care, meals, short-term breaks), the carer
was subsequently more likely to leave employment
because of caring, suggesting that the absence of
services contributed to the carer leaving work. In the
interviews, carers identified specific ways in which services
helped them to remain in employment.
Arksey, H. and Glendinning, C. (2008),
Combining Work and Care: Carers’
Decision-making in the Context of
Competing Policy Pressures. Social Policy
& Administration, 42: 1-18. https://doi.
org/10.1111/j.1467-9515.2007.00587.x
The study focused on rural versus non-rural carers. Key
factors that impact on carers’ decisions are: current
and anticipated financial need; the constraints arising
from receipt of carers’ and other means-tested income
maintenance benefits; personal identity; job opportunities
and scope for flexibility; social services provision; carers’
own health. Distance, travel times and transport are
unique additional challenges for rural carers who (wish to)
work. These difficulties are further intensified when they
intersect with other factors such as the Carer’s Allowance,
the local labour market and social services provision. The
findings are evaluated in terms of the adequacy of current
government policy measures.
Cass, B., Smith, C., Hill, T., Blaxland,
M. and Hamilton, M., 2009. Young
carers in Australia: understanding the
advantages and disadvantages of
their care giving. FaHCSIA Social Policy
Research Paper, (38).
The literature strongly suggests young carers tend
to be located in identifiable socioeconomic–cultural
circumstances, often in low-income families, and in
families of migrant and/or culturally and linguistically
diverse backgrounds where care giving is central to
mobilisation of intergenerational resources and strengths.
The Australian and United Kingdom literature also
emphasises the issue of recognising and making contact
with ‘hidden young carers’, so they are in a position to
access the services and supports available to them
28
Hussain, R.; Wark, S.; Ryan, P. Caregiving,
Employment and Social Isolation:
Challenges for Rural Carers in Australia.
Int. J. Environ. Res. Public Health 2018,
15, 2267. https://doi.org/10.3390/
ijerph15102267
The results show that most rural carers were middle-aged
women supporting a spouse or a child. Unpredictability
associated with providing care exacerbated demands on
carers’ time, with many reporting significant employment
consequences associated with inflexibility and limited job
options in rural locations. Specific issues associated with
travel requirements to assist with care were reported, as
were the impacts of care provision on the respondents’
own personal health. The majority of carers were aware of
the social supports available in their local rural community,
but did not access them, leaving the carers vulnerable to
marginalisation. Problems associated with employment
were noted as resulting in financial pressures and
associated personal stress and anxiety for the caregivers.
While this issue is not necessarily limited to rural areas, it
would appear that the lack of opportunity and flexibility
evident in rural areas would exacerbate this problem
for non-metropolitan residents. The participants also
identified specific barriers to the provision of care in rural
areas, including the significant impact of travel. Access
to support services, such as carer groups, were rarely
accessed due to a mix of factors including inaccessibility,
poor timing and a lack of anonymity. Financially, there
was considerable evidence of hardship, and there is an
urgent need for a comprehensive review of government
and community-based support to better meet the needs
of rural carers.
Adair, T., Williams, R. and Taylor, P., 2013.
A juggling act: Older carers and paid
work in Australia.
The number of mature age Australians balancing work
and informal caring roles will increase in the future. This
will be driven by the policy objective of transferring the
care of older people on to families, and by the increasing
labour force participation, particularly of women.

29
Join the campaign for a strong NDIS
Because Teamwork Works
Teamwork.org.au


![v P ] v X } u [Digital Electronics for IBPS IT-Officer 2014] Input Output A B C False False False False True False True False False True True True Symbol for And gate: Also C= A.B](https://img.pdfslide.net/doc/110x75/5aad019c7f8b9aa9488db79d/v-p-v-x-u-digital-electronics-for-ibps-it-officer-2014-input-output-a-b-c.jpg)