Embed Size (px)
Citation preview

Family Cohesion and Socio-economic status: A preliminary investigation
Antigone Lyberaki, George Papadoudis and Platon Tinios

Family Solidarity and social policy
Social protection functions performed by Informal (family) support systems
Especially in Mediterranean
Household structure and behaviour is not a given
May already reflect adjustment to environment
Cohesion is unobservable –Points in common with health status?

Theorising solidarity: towards quantification?
Need to justify a unidimensionalmeasure: Strong-Weak cohesionLiterature on ‘Strong- weak- family divide’ implicitly supports above viewpoint
Emphasis on geographic divide North SouthCorroborated by SHARE first results

Questions to be (eventually) addressed
Convergence hypothesis: is there a “truly European family model” in the making? [Roussel, 1992].How solid are different family forms and how do they respond to common demographic challenges (ageing for instance)?Are the strong family systems more vulnerable to the effects of demographic ageing? [Reher, 1997, 1998].How do different institutions (labour market, education…) affect the demographic trends via fertility decisions? Role of gender equity and diminishing family size. [McDonald, 2000].
IN SHARE SAMPLE:1. Are there clear geographical patterns in family cohesion?2. Do our data support the “strong/weak” family divide
geographically? Does the Mediterranean family stand out as an exception to a more or less single European rule?
3. Do family ties differ according to income within the same country and across Europe? Are poorer families more or less cohesive than the rest, and where?

A working SHARE-specific definition
12 issues handled by 20 solidarity-linked questions in four dimensions,
1. proximity and co-residence2. frequency of contact3. transfer of time and services/support.4. transfer of funds

Methodology: Intensity and Aggregation
Abstracting from intensityUsed 12 0/1 variablesIntensity observations culture specificIn some cases used cut-offs
‘Logical missing values’Solidarity scores rebased such as 0<s<1
Aggregation by weighting (value-based)Technique from deprivation analysis
Weight=frequency. (You miss more what is widespread)Thought more transparent than pure statistical weights
Results sensitive to weighting and other technical issues

Family Cohesion composite index
Country FC FC bottom quintile
FC top quintile
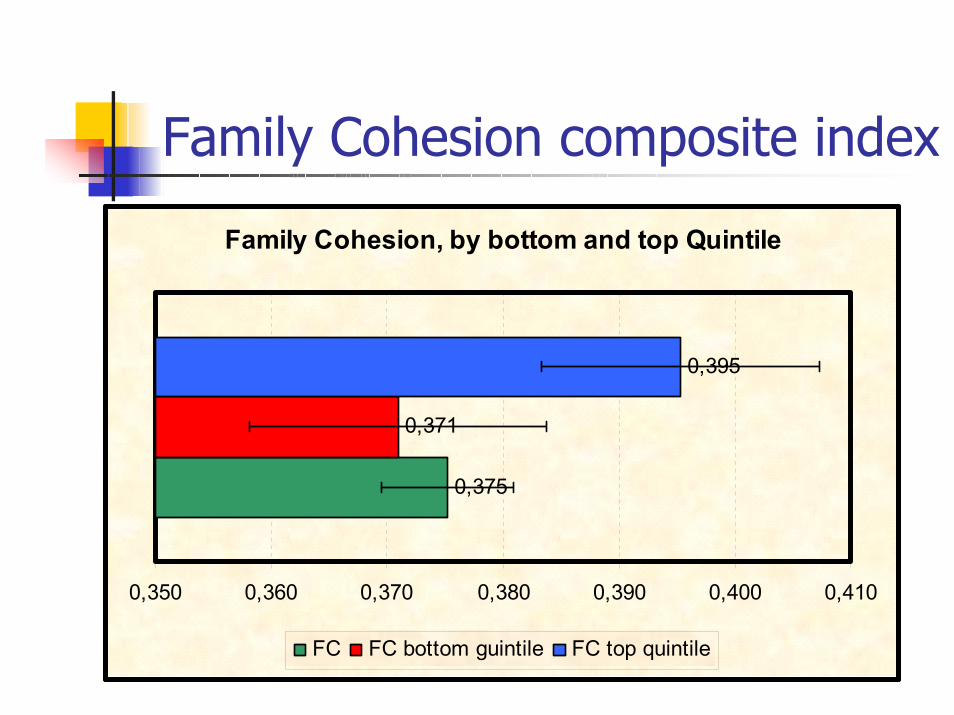
austria 0,327 0,305* 0,347* germany 0,328 0,320 0,372* sweden 0,371 0,313* 0,431* the_neth 0,360 0,355 0,380* spain 0,451 0,468* 0,456 italy 0,437 0,434 0,425 france 0,335 0,340 0,350* denmark 0,358 0,274* 0,442* greece 0,445 0,441 0,460* switzerl 0,336 0,323 0,353 average 0,375 0,371 0,395*
Family Cohesion composite index
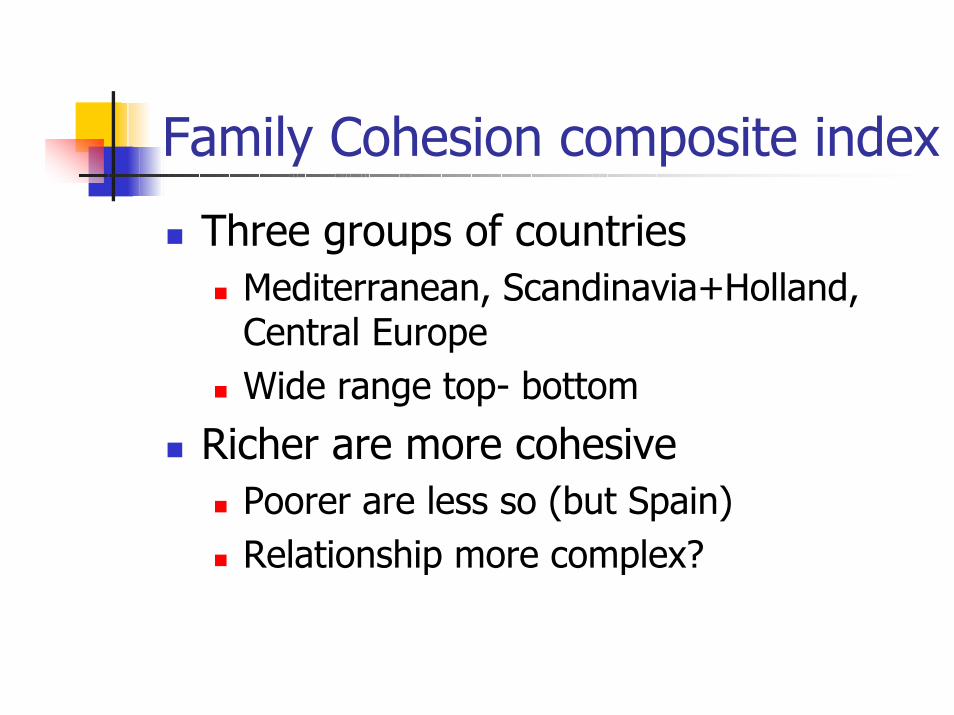
Three groups of countriesMediterranean, Scandinavia+Holland, Central EuropeWide range top- bottom
Richer are more cohesivePoorer are less so (but Spain)Relationship more complex?
Family Cohesion composite index
Family Cohesion, by bottom and top Quintile
0,375
0,371
0,395
0,350 0,360 0,370 0,380 0,390 0,400 0,410
FC FC bottom guintile FC top quintile

Family cohesion by CountryFamily Cohesion Index, by country
0,451 0,445 0,437
0,371 0,360 0,3580,336 0,335 0,328 0,327
0,25
0,30
0,35
0,40
0,45
0,50
ES GR IT SE NL DK CH FR DE AT
Family cohesion and need indicators
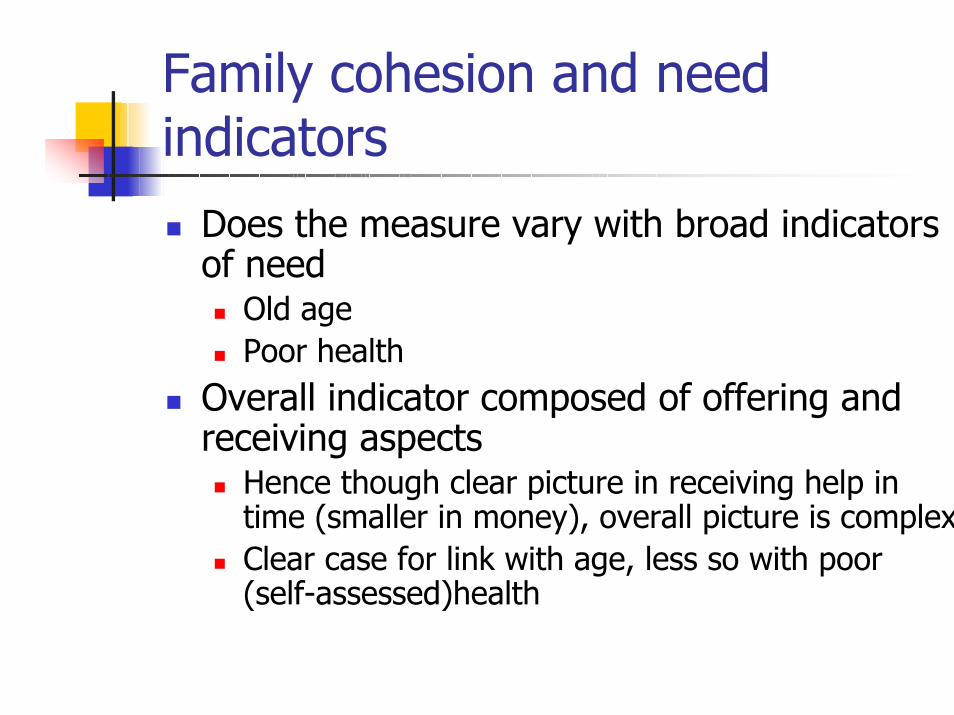
Does the measure vary with broad indicators of need
Old agePoor health
Overall indicator composed of offering and receiving aspects
Hence though clear picture in receiving help in time (smaller in money), overall picture is complexClear case for link with age, less so with poor (self-assessed)health
Family cohesion and need indicators
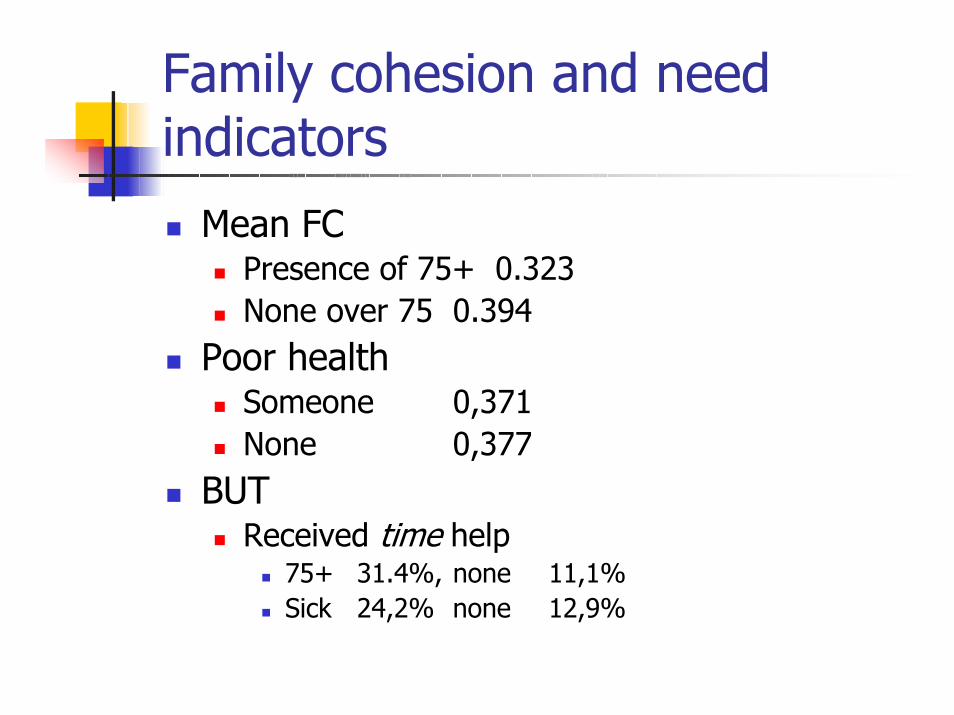
Mean FCPresence of 75+ 0.323None over 75 0.394
Poor healthSomeone 0,371None 0,377
BUTReceived time help
75+ 31.4%, none 11,1%Sick 24,2% none 12,9%

Sub-indices: a mixed picture Family Cohesion Sub-indeces, by Country
0,0
0,1
0,2
0,3
0,4
0,5
0,6
0,7
ES GR IT SE NL DK CH FR DE AT
Proximity Contact Time-transfer Financial-transfer

SubindicesIn all cases Mediterranean stands outSome effects operate in diverse directions in the various subindices (hence aggregation important)
BY Income class (Top/ bottom quintile)Proximity higher for the poorer
Solidarity mechanism?Contact higher for the richerTime transfer higher for the richer
Intensity may show differencesIn Mediterranean time transfers less frequent but of greater intensity
Financial transfer higher for the richer

Conclusions??Family solidarity is potentially a major discriminant.
It may go some way towards explaining North-South divide. Link to nature of the welfare state?
Take analysis forwardIntensity factorsOther aggregation mechanismsModeling family structureCohort effectsAbility – need effects separated

SHARE- Family cohesion paper Lund Conference September 2005 Family cohesion and socioeconomic status: A preliminary investigation Antigone Lyberaki, George Papadoudis and Platon Tinios1 1. Introduction Family cohesion and family solidarity ties are elusive concepts often quoted in a variety of contexts and with a multitude of meanings. This testifies in a sense to their embodied significance: the way in which the relationship between the family group and its members manifests itself has implications for the way society itself functions. Therefore politicians and public planners should consider the nature of existing family systems when designing social policies. Given the historical importance of family solidarity, the role of social protection has often been to fill gaps left by informal protection systems [Esping Andersen…]. This indeed has been the case with the so-called Mediterranean Welfare States in the well-known welfare state typologies [developed by G. Esping Andersen and M. Ferrera…]. In the context of framing social policy, the role of the welfare state, particularly in Mediterranean countries is seen as assisting what the family already does in its informal support role; equivalently, to fill the gaps as informal support networks recede as a consequence of urbanization. (See EU Joint Inclusion Report 2002). Standard economic analysis takes the household as the unit of analysis, and deals with it as it comes. However, the structure of the household itself may be a reflection of (or a reaction to) socio-economic patterns and conditions. Agglomeration of family members within the same household may constitute a rational way of dealing with socio-economic challenges as much as reflecting culturally and historically formulated values and attitudes. Therefore, looking more closely into the relationship between household structure and socio-economic characteristics may tell interesting stories of causality. Some equivalent analytical issues arise in the case of health status and or general attitudes pertaining to allegiances, obligations and identity-related roles. In this sense, household structure and other manifestations of solidarity are manifestations of a an unobservable variable – family cohesion. This unobervable may affect many relationships (economic but also non-economic ones) in the data, in the same way that, say health status, does. 1 Antigone Lyberaki is Professor of Economics, Panteion University Athens. George Papadoudis is a Researcher, Panteion University. Platon Tinios teaches at Piraeus University, Piraeus.
1

Hence it seems important to explore the notion of family solidarity/cohesion, in the hope of arriving at an operational, data-based, summary measure of family solidarity, that can be used to inform other analyses. In this way, the analysis is similar to using various diverse pieces of evidence to derive a single ‘objective’ measure of health status. This paper initiates such a search by examining in a preliminary way some of the manifestations of family cohesion in the SHARE data and exploring some interim results regarding the construction of a family cohesion index. To derive some ‘feel’ for the issues and the spatial characteristics of the measure, its links with socioeconomic status are explored in a little greater detail. 2. Theorizing family solidarity- Towards quantification To derive a measure of family cohesion, presupposes that such a unidimensional measure is, in principle at least, feasible and has meaning. The literature on the ‘strong’ or weak family divide literature has this key characteristic and can serve as a motivation underpinning a family cohesion unitary measure. The unquestionable variety of existing family forms has been often represented in the “strong-weak” family divide literature. “Strong family” exists where the family group has had priority over the individual while the opposite holds in the case of “weak family” systems. The two systems have a geographical dimension as well: The former is prevalent in the Mediterranean countries while the latter in the Anglo-Saxon world [Reher, 1997, 1998]. When examined more closely, however, the dividing lines become more blurred: Ireland, and differences within countries illustrate greater variety than implied prima faciae. ….. Family cohesion is a way of describing “strength” and “weakness” without reverting to two extreme family systems. It is a measure of the strength and resilience of family loyalties and allegiances, expressed in residence patterns, proximity of contact, transfer of funds and exchange of services and support. Earlier findings reported in the First Results Book of SHARE [M. Kohli et al; C. Attias-Donfut et al;, 2005] demonstrate that there is not only a “weak” “strong” dichotomy but also a North-South gradient in family structure, as well as important regional differences within countries. This is reflected in the frequency of contact and the rates of co-residence [Kohli, Kunenmund & Ludicke, 2005]. In a similar vain, Attias-Donfut et al. argued that the high rates of co-residence in the southern countries imply that family support is focused around the immediate kin group inside the household and is performed almost exclusively by women [Attias-Donfut, Ogg & Wolff, 2005]. With respect to intergenerational financial transfers, the same authors argue that there exists a North/south variation in the composition of the networks of support recipients: while younger respondents receive more in the North, older respondents receive more in the South, reflecting the differences in welfare systems at work [ibid.].
2

Different historical, institutional and cultural trajectories have undoubtedly contributed to the variety of existing family forms (size, loyalties, allegiances, authority, economic decisions, attitudes…). Contemporary families however are faced with a more or less common set of challenges (ageing, for instance). When looking ahead, crucial questions seek plausible hypotheses:
Is there some process of convergence under way which will eventually render the family similar (or more similar) everywhere in Europe? (is there a “truly European family model” in the making?) [Roussel, 1992]. How solid are different family forms and how do they respond to
common demographic challenges (ageing for instance)? Are the strong family systems more vulnerable to the effects of
demographic ageing? [Reher, 1997, 1998]. How do different institutions (labour market, education…) affect the
demographic trends via fertility decisions? In other words, is the pace of diminishing family size linked to the institutional conjecture outside the family sphere and in particular to the fit between gender equity and real opportunities outside the family? [McDonald, 2000].
Addressing all the above questions is a very complex task, which lies outside the scope of this paper, notwithstanding that it appears that the SHARE data can be extremely useful in shedding light on these issues. What we attempt to do is tackle some of the above questions on the basis of the available SHARE data. Our intention is to examine family cohesion across Europe and within different income groups. Whilst accepting that there is no single and definitive account of family cohesion definition, our more modest aim is to move towards a working definition of family cohesion, encompassing a number of variables:
a. proximity and co-residence b. frequency of contact c. transfer of time and services/support. d. transfer of funds
Because “strength” or “solidity” of family loyalties and allegiances is expressed in two critical moments of transition (when young family members leave their parents´ home in order to settle on their own and –more crucially in our case- the ways in which the family organizes support for its most vulnerable members), we intend to look in greater detail at the dynamics of support given to the older and less healthy family members. Are there clear geographical patterns in family cohesion? Do our data support the “strong/weak” family divide geographically? Does the Mediterranean family stand out as an exception to a more or less single European rule? Do family ties differ according to income within the same country and across Europe? Are poorer families more or less cohesive than the rest, and where? 3. Measuring solidarity and family cohesion Description of variables
3
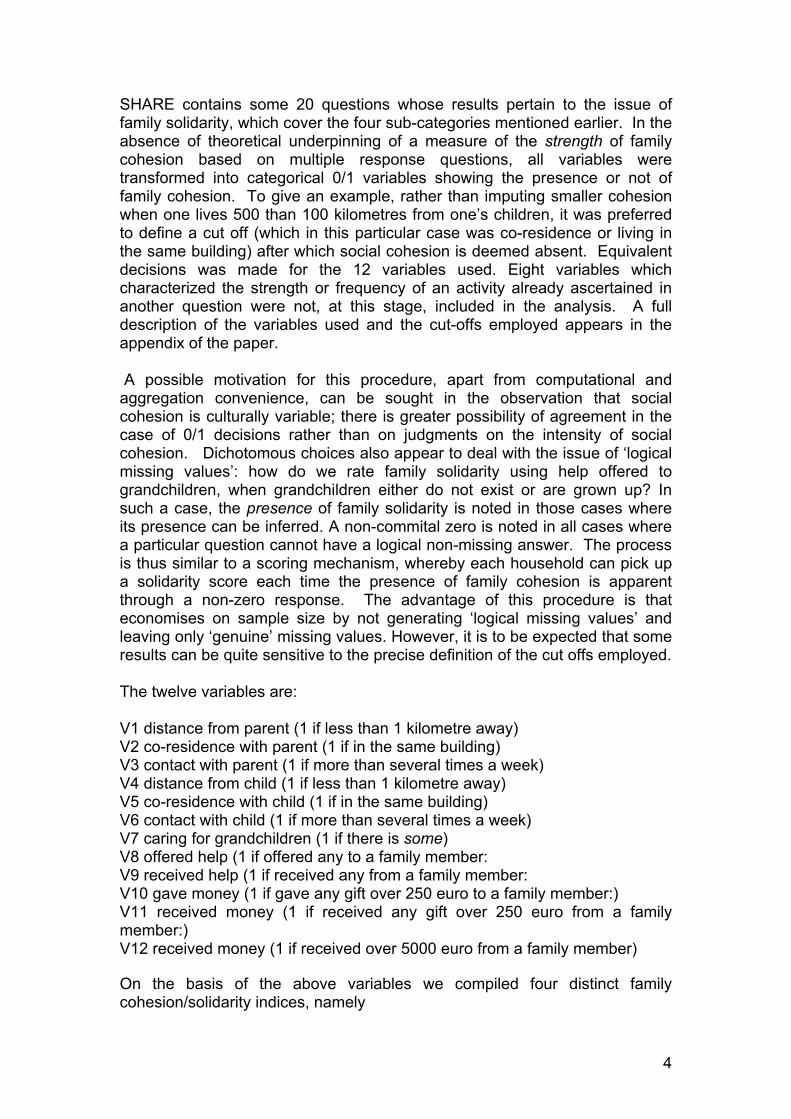
SHARE contains some 20 questions whose results pertain to the issue of family solidarity, which cover the four sub-categories mentioned earlier. In the absence of theoretical underpinning of a measure of the strength of family cohesion based on multiple response questions, all variables were transformed into categorical 0/1 variables showing the presence or not of family cohesion. To give an example, rather than imputing smaller cohesion when one lives 500 than 100 kilometres from one’s children, it was preferred to define a cut off (which in this particular case was co-residence or living in the same building) after which social cohesion is deemed absent. Equivalent decisions was made for the 12 variables used. Eight variables which characterized the strength or frequency of an activity already ascertained in another question were not, at this stage, included in the analysis. A full description of the variables used and the cut-offs employed appears in the appendix of the paper. A possible motivation for this procedure, apart from computational and aggregation convenience, can be sought in the observation that social cohesion is culturally variable; there is greater possibility of agreement in the case of 0/1 decisions rather than on judgments on the intensity of social cohesion. Dichotomous choices also appear to deal with the issue of ‘logical missing values’: how do we rate family solidarity using help offered to grandchildren, when grandchildren either do not exist or are grown up? In such a case, the presence of family solidarity is noted in those cases where its presence can be inferred. A non-commital zero is noted in all cases where a particular question cannot have a logical non-missing answer. The process is thus similar to a scoring mechanism, whereby each household can pick up a solidarity score each time the presence of family cohesion is apparent through a non-zero response. The advantage of this procedure is that economises on sample size by not generating ‘logical missing values’ and leaving only ‘genuine’ missing values. However, it is to be expected that some results can be quite sensitive to the precise definition of the cut offs employed. The twelve variables are: V1 distance from parent (1 if less than 1 kilometre away) V2 co-residence with parent (1 if in the same building) V3 contact with parent (1 if more than several times a week) V4 distance from child (1 if less than 1 kilometre away) V5 co-residence with child (1 if in the same building) V6 contact with child (1 if more than several times a week) V7 caring for grandchildren (1 if there is some) V8 offered help (1 if offered any to a family member: V9 received help (1 if received any from a family member: V10 gave money (1 if gave any gift over 250 euro to a family member:) V11 received money (1 if received any gift over 250 euro from a family member:) V12 received money (1 if received over 5000 euro from a family member) On the basis of the above variables we compiled four distinct family cohesion/solidarity indices, namely
4

Proximity index (V1, V2, V4, V5) Contact index (V3, V6) Time transfer index (V7, V8, V9) Money transfer index (V10, V11, V12).
A further issue is the aggregation problem, i.e. in what way to derive a single measure from the twelve different measurements available. Such an issue can be dealt with purely statistical methodology, such as principal components or factor analysis. At this relatively early stage of the analysis, though, it was felt that statistically computed loading factors would subtract from transparency and would make interpretation harder. (A similar process was followed by Callan et al (1992) The other route is to assign openly subjective weights to each observable variable. One technique that has been used in the analysis of economic deprivation and basic needs departs from the observation that the more widespread is the possession of a particular characteristic or economic good, the more painful for the individual to be deprived of it. This would weight each observation with a measure of how widespread any characteristic is, a first approximation would be the frequency of the characteristic in the national population2. A final issue has to do with logical missing values. A household may be able to ‘score’ on all 12 dimensions, whereas another may be logically able to score on only, say, 8. Observations are rebased by expressing the (weighted) index as the score as a percentage of the maximum possible score for that specific household. This rebasing results in all observations lying within the range of 0 (no solidarity) and 1 (full solidarity). The resulting index can serve as a useful shorthand measure of family cohesion in the SHARE sample. Thus, the composite cohesion/solidarity index is a compilation of the four indices and takes the following form: FC=Σ [m_Vi*Vi] / Σ [max(m_Vi*Vi)] where i=1…12 The values of m_Vi are calculated as the simple country-by-country frequencies, allowing for logical missing values. The values of the multipliers appear in Appendix 2. Given the interest in the link between family cohesion and income, the exact income concept used is crucial. Given that one of the issues of interest is coresidence of the generations, a crucial decision is that equivalence scales. For want of an alternative, the OECD revised equivalence scales were used. These equivalence scales deal with the issue of children but do not address the issues of co-habiting with aged people, which are likely to be at least as important. Thus the possibility arises of under-correcting for household size. In other words, it is possible that households with cohabiting elderly people will be judged systematically better off.
2 This process will have the by-product of amplifying national differences.
5

In order to get a feel of the influence of income, cross- tabulations report the value of the solidarity index for the richest 20% and the poorest 20% for each country. 4. Some preliminary results a.Family cohesion/solidarity composite index Table 1 Family Cohesion index by country, entire sample, richer 20% and poorer 20%
95% confidence interval for FC
Country FC FC bottom quintile
FC top quintile
Lower Upper austria 0,327 0,305* 0,347* 0,314 0,339germany 0,328 0,320 0,372* 0,317 0,338sweden 0,371 0,313* 0,431* 0,362 0,381the_neth 0,360 0,355 0,380* 0,350 0,369spain 0,451 0,468* 0,456 0,439 0,464italy 0,437 0,434 0,425 0,418 0,455france 0,335 0,340 0,350* 0,323 0,348denmark 0,358 0,274* 0,442* 0,345 0,371greece 0,445 0,441 0,460* 0,434 0,457switzerl 0,336 0,323 0,353 0,320 0,353average 0,375 0,371 0,395* 0,369 0,381 Three groups of countries can be distinguished, with the Mediterranean group exemplifying the highest family cohesion (Spain, Greece, Italy in this order), and the central European the less (Austria, Germany, France and Switzerland). The Scandinavian countries and Holland, while being lower (as would have been expected) than the Mediterranean score rather highly. In general one can say that the range that solidarity can take through Europe is rather wide: the gap between the highest country (Spain) and the lowest (Austria) is of the order of 37%. Turning to the relationship with income, the propensity to exhibit family solidarity can be generally seen to increase with income. The richest 20% (with the exception of Italy) is associated with greater solidarity, in all but two cases significantly so. The poorer 20% tends to show less solidarity, though the difference is statistically significant in only four cases (AT, ES, DK, SE). The case of Spain stands out as a caution against generalization: in Spain the poor are more likely to be solidary and by a large margin. The Spanish case reminds us that in a univariate analysis, income stands as a proxy for all other excluded factors (it is a reduced form)3. It would be unlikely if the underlying structural relationships could be evidenced in a simple univariate descriptive exercise such as the one attempted here. The intricate pattern uncovered can only mean that the relationship merits much more attention. 3 Plus there is the factor of equivalence scales discussed earlier.
6

The information of Table 1 for the SHARE population as a whole is presented in diagram form as follows, along with the ranges taken of each country. Diagram 2 presents histograms by country, noting the spread of values for the two income groups used.
Family Cohesion, by bottom and top Quintile
0,375
0,371
0,395
0,350 0,360 0,370 0,380 0,390 0,400 0,410
FC FC bottom guintile FC top quintile
Family Cohesion Index, by country
0,451 0,445 0,437
0,371 0,360 0,3580,336 0,335 0,328 0,327
0,25
0,30
0,35
0,40
0,45
0,50
ES GR IT SE NL DK CH FR DE AT
b. Needy households and family solidarity Family solidarity may be expected to respond to objective ‘needs’ for this solidarity. These can be taken to be the presence of a household member older than 75, as well as the presence of a person who assesses him- or herself to be in ‘bad’ or ‘very bad’ health. The link under examination is particularly important in examining family solidarity and cohesion as a complement to social protection systems.
7

Table 2. Family cohesion index: presence of aged 75+ or members in poor health Country Household
Member over 75
Noone over 75
Member in Poor
health
No such member
austria 0,289 0,340 0,332 0,325germany 0,307 0,335 0,332 0,325sweden 0,270 0,412 0,313 0,383the_neth 0,257 0,392 0,321 0,372spain 0,413 0,467 0,460 0,447italy 0,373 0,458 0,422 0,444france 0,268 0,363 0,317 0,344denmark 0,229 0,401 0,334 0,366greece 0,400 0,460 0,442 0,447switzerl 0,264 0,359 0,344 0,336mean 0,323 0,394 0,371 0,377 Table 2 looks at the value of the index FC, distinguishing the population accordingly as they show signs of need. The presence of someone in ill health is not associated with notable responses. Only in Sweden and Holland are there differences exceeding 5 percentage points, with the presence of ill people leading to a decrease in solidarity. Decreased ability to offer help obviously outweighs increased need to receive help. (The caution of interpreting reduced forms would also apply). On the contrary, table 2 shows important differences in the presence of individuals over 75 years of age. The presence of such an individual leads to a decrease in measured solidarity. Given the importance of proximity indicators in the weighting scheme, this finding maybe associated with more intensive use of old age homes and other care facilities for the very old. Equally it may point to inherent drawbacks in the precise measure employed. Households in the needy groups are naturally hindered in their capacity to offer help, but may be expected to be receiving help to a far greater extent. Table 3: Received help in presence of members aged 75+ Received help in time Received help in money
(250 euros) Received help in money
(5000 euros) Country Household
Member over 75
Noone over 75
Household Member over 75
Noone over 75
Household Member over 75
Noone over 75
austria 31,9% 18,1% 5,9% 7,9% 9,1% 17,9%germany 41,8% 15,0% 5,3% 6,8% 17,3% 28,1%sweden 33,2% 13,2% 2,3% 6,8% 22,1% 40,2%the_neth 27,6% 12,1% 1,7% 3,2% 16,2% 25,6%spain 20,6% 8,1% 5,8% 3,3% 14,7% 17,8%italy 20,3% 8,3% 2,2% 4,4% 6,9% 16,8%france 34,6% 6,9% 2,6% 3,5% 19,5% 25,0%denmark 28,5% 19,5% 2,1% 7,5% 23,0% 38,2%greece 46,0% 14,1% 16,2% 8,9% 20,9% 24,4%switzerl 21,2% 11,9% 6,2% 4,3% 35,9% 46,1%mean 31,4% 11,1% 4,3% 5,2% 15,9% 24,4%
8

Table 4: Received help in presence of members in poor health Received help in time Received help in money
(250 euros) Received help in money
(5000 euros) Country Member in
Poor health
No such member
Member in Poor
health
No such member
Member in Poor
health
No such member
austria 27,3% 19,7% 5,5% 8,0% 11,9% 16,9%germany 31,8% 16,5% 6,2% 6,5% 19,2% 28,7%sweden 30,1% 16,7% 4,1% 5,8% 23,7% 37,4%the_neth 21,2% 14,1% 3,0% 2,9% 15,5% 25,9%spain 17,1% 8,2% 4,7% 3,5% 14,9% 18,1%italy 15,4% 9,3% 3,4% 4,1% 11,4% 15,8%france 25,1% 10,3% 2,1% 3,8% 16,4% 26,7%denmark 29,4% 19,2% 4,1% 6,8% 29,8% 36,0%greece 33,6% 17,1% 13,9% 9,4% 17,7% 25,8%switzerl 23,5% 12,5% 4,1% 4,9% 32,9% 45,4%mean 24,2% 12,9% 4,7% 5,1% 16,4% 24,9% This expectation is borne out by tables 3 and 4, which look at only the variables connected with aid received, whether in time, or money. Turning to the analysis of the aged first (table 3), we see that there are very important differences in receiving help in time. Help in cash is important towards older households in the two Mediterranean countries that acknowledge a pension adequacy problem – viz Greece and Spain. Receiving sums in excess of €5000, given that they represent legacies are more important to younger households. Similar, though less marked, patters on help received appear in table 3 which distinguishes the situation for households with members in ill health and those without. Though in almost all cases this creates an offer of personal time help, significant cash transfers towards those in poor health are noted only in Greece. Turning to the influence of education, the patterns noted in income reassert themselves. c. The 4 sub-indices (proximity, contact, time and money transfers) Family solidarity is composed of four subindices for four general areas, proximity, contact, time transfers and financial transfers. The analysis proceeds to examine each in turn.
9
Family Cohesion Sub-indeces, by Country
0,0
0,1
0,2
0,3
0,4
0,5
0,6
0,7
ES GR IT SE NL DK CH FR DE AT
Proximity Contact Time-transfer Financial-transfer
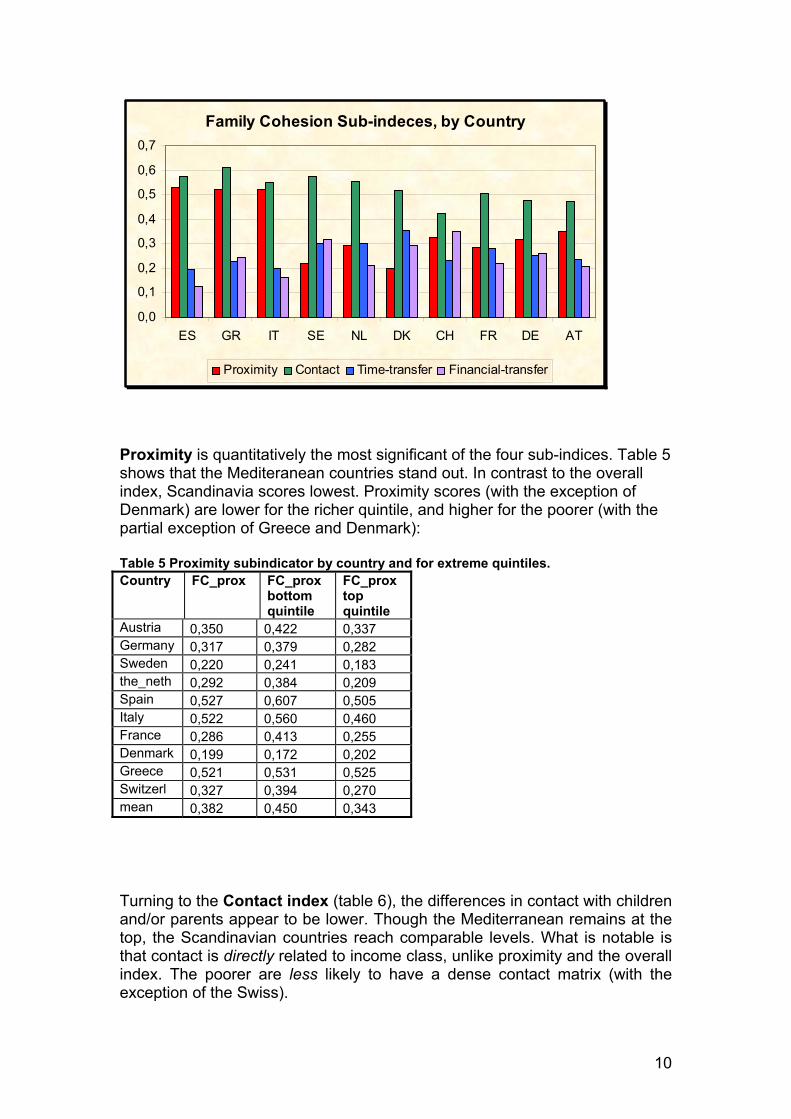
Proximity is quantitatively the most significant of the four sub-indices. Table 5 shows that the Mediteranean countries stand out. In contrast to the overall index, Scandinavia scores lowest. Proximity scores (with the exception of Denmark) are lower for the richer quintile, and higher for the poorer (with the partial exception of Greece and Denmark): Table 5 Proximity subindicator by country and for extreme quintiles. Country FC_prox FC_prox
bottom quintile
FC_prox top quintile
Austria 0,350 0,422 0,337 Germany 0,317 0,379 0,282 Sweden 0,220 0,241 0,183 the_neth 0,292 0,384 0,209 Spain 0,527 0,607 0,505 Italy 0,522 0,560 0,460 France 0,286 0,413 0,255 Denmark 0,199 0,172 0,202 Greece 0,521 0,531 0,525 Switzerl 0,327 0,394 0,270 mean 0,382 0,450 0,343 Turning to the Contact index (table 6), the differences in contact with children and/or parents appear to be lower. Though the Mediterranean remains at the top, the Scandinavian countries reach comparable levels. What is notable is that contact is directly related to income class, unlike proximity and the overall index. The poorer are less likely to have a dense contact matrix (with the exception of the Swiss).
10

Table 6 Contact subindicator by country and for extreme quintiles. Country FC_cont FC_cont
bottom quintile
FC_cont top quintile
austria 0,471 0,378 0,500 germany 0,476 0,491 0,518 sweden 0,575 0,532 0,629 the_neth 0,552 0,533 0,595 spain 0,574 0,524 0,617 Italy 0,550 0,512 0,575 france 0,504 0,505 0,522 denmark 0,517 0,463 0,601 greece 0,612 0,606 0,647 switzerl 0,422 0,378 0,403 mean 0,521 0,504 0,554 The intergenerational time transfer index (table 7) takes its lowest value in the Mediterranean countries and its highest in Denmark, Sweden and the Netherlands. With the exception of Greece, all countries seem to have higher time transfer in richer rather than poorer households. Table 7 Time transfer subindicator by country and for extreme quintiles. Country. FC_ttr FC_ttr
bottom quintile
FC_ttr top quintile
austria 0,235 0,197 0,255 germany 0,250 0,219 0,300 sweden 0,303 0,242 0,341 the_neth 0,302 0,259 0,344 spain 0,197 0,177 0,200 italy 0,200 0,166 0,211 france 0,282 0,263 0,291 denmark 0,354 0,246 0,462 greece 0,227 0,245 0,208 switzerl 0,233 0,223 0,262 mean 0,244 0,215 0,268 These findings do not account for the length of care and support time exchanged. In other words, they illustrate the incidence of time offered and received (as a 0/1 variable), abstracting from its length and intensity. If intensity of care , for those with positive responses, is examined, the picture in table 8 emerges. As can be seen, the overall impression, as well as the country rankings differ considerably from those in table 7: The share of individuals receiving help in countries of the South may be smaller, but when help is received, it is much more substantive. This observation raises the point that the care received may be qualitatively different in the two environments. To take this point on board the measurement of family cohesion must be extended to encompass questions of intensity.
11
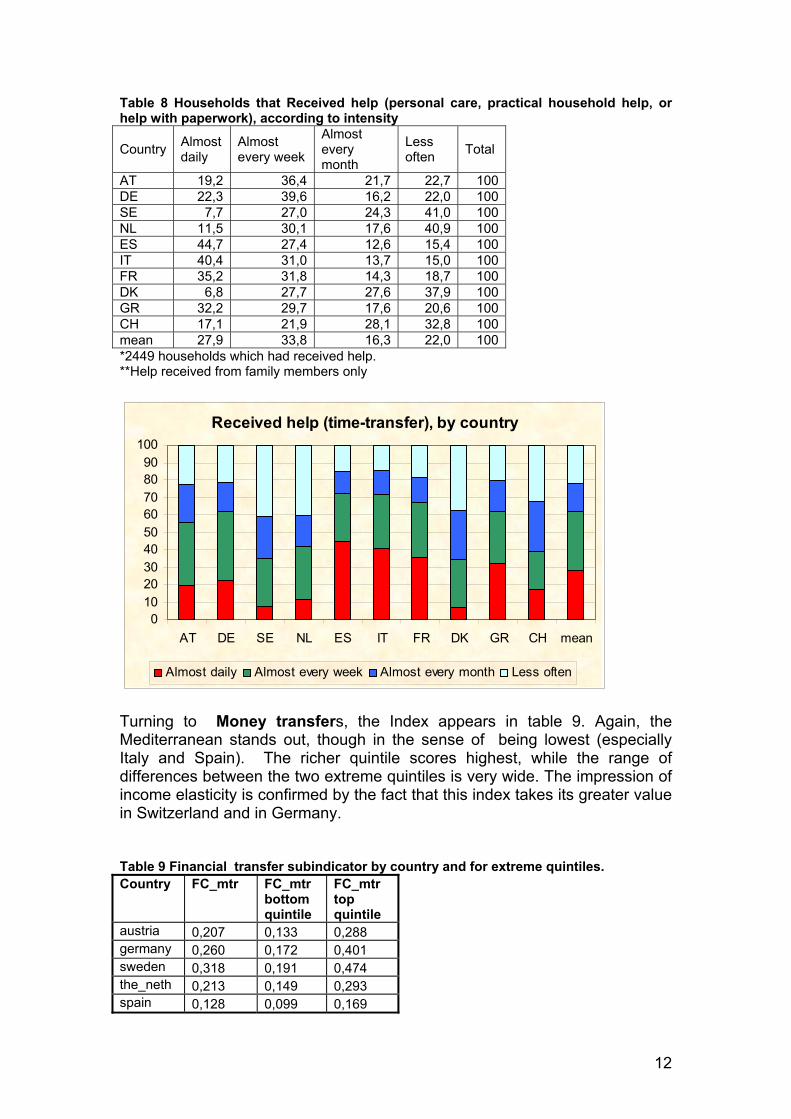
Table 8 Households that Received help (personal care, practical household help, or help with paperwork), according to intensity
Country Almost daily
Almost every week
Almost every month
Less often Total
AT 19,2 36,4 21,7 22,7 100DE 22,3 39,6 16,2 22,0 100SE 7,7 27,0 24,3 41,0 100NL 11,5 30,1 17,6 40,9 100ES 44,7 27,4 12,6 15,4 100IT 40,4 31,0 13,7 15,0 100FR 35,2 31,8 14,3 18,7 100DK 6,8 27,7 27,6 37,9 100GR 32,2 29,7 17,6 20,6 100CH 17,1 21,9 28,1 32,8 100mean 27,9 33,8 16,3 22,0 100*2449 households which had received help. **Help received from family members only
Received help (time-transfer), by country
0102030405060708090
100
AT DE SE NL ES IT FR DK GR CH mean
Almost daily Almost every week Almost every month Less often
Τurning to Money transfers, the Index appears in table 9. Again, the Mediterranean stands out, though in the sense of being lowest (especially Italy and Spain). The richer quintile scores highest, while the range of differences between the two extreme quintiles is very wide. The impression of income elasticity is confirmed by the fact that this index takes its greater value in Switzerland and in Germany. Table 9 Financial transfer subindicator by country and for extreme quintiles. Country FC_mtr FC_mtr
bottom quintile
FC_mtr top quintile
austria 0,207 0,133 0,288 germany 0,260 0,172 0,401 sweden 0,318 0,191 0,474 the_neth 0,213 0,149 0,293 spain 0,128 0,099 0,169
12

italy 0,161 0,066 0,256 france 0,220 0,117 0,291 denmark 0,291 0,169 0,393 greece 0,244 0,196 0,317 switzerl 0,349 0,275 0,457 mean 0,216 0,133 0,313 4. Conclusions & Possible extensions of the analysis on family cohesion and solidarity The overall impression gleaned from this very preliminary exploration is that family solidarity is a factor which may not be ignored: the range of between country variation is very wide. The persistence of findings of a north-south divide would probably signify that the structure of the family and family cohesion is an important explanatory variable which needs to find its place. Countries in this analysis seem to fall in three groups: The Mediterranean where solidarity is strongest, followed by the Northern countries (and Holland) and finally the remaining Continental countries. A full explanation of this grouping cannot be offered at this stage; possibilities could be the interplay between traditional family patters which persist in the South combined with characteristics of the social protection system. This paper can be seen as a tour d’horizon of the issue of family cohesion. The analysis needs to be taken forward in a number of respects: incorporating intensity and quantitative factors, using statistical aggregation techniques, examining the determinants of family cohesion both from the ability to offer help and the need to receive, modeling family structure, including age and cohort effects, etc. A fuller analysis can be brought to bear on a number of specific hypotheses involving solidarity
1. Ways in which intergenerational transfers of wealth take place (timing, amount.) in terms of the life-cycle. A North-South gradient in this phenomenon may be attributable to solidarity factors.
2. How solid and unchangeable are solidarity characteristics over time? Are such characteristics cohort-related across countries?
3. Links between family solidarity patterns and characteristics of social protection and particularly pension systems.
4. Income-elasticity solidarity: more or less propensity to solidarity as incomes rise (and socio-economic status improved).
5. Housing demand: two way process. Solidarity is affected by interest rates and housing adequacy (size of accommodation, availability of space dictates co-residence) therefore the operation of the housing market has important implications for the incidence and dynamics of solidarity. Thus, solidarity may either reflect cohesion or a failure in the housing market or both.
13

6. The role of family solidarity in job search for labour force entrants: Timing of first job acquisition and exit from employment.
14

Appendix I
Variable descriptions Variable Name Short Description
V1 np2 DN030_ WHERE DOES PARENT LIVE Cut off answer 3. “Less than 1 kilometre away”
V2 crp DN030 WHERE DOES PARENT LIVE Cut off answer 2. “In the same building”
V3 cp2 DN032_ PERSONAL CONTACT WITH PARENT DURING PAST 12 MONTHS Cut off answer 2. “Several times a week”
V4 nc2 CH007_ WHERE DOES CHILD N LIVE Cut off answer 3. “Less than 1 kilometre away”
V5 crc CH007_ WHERE DOES CHILD N LIVE Cut off answer 2. “In the same building”
V6 cc2 CH014_ CONTACT WITH CHILD Cut off answer 2. “Several times a week”
V7 tcgc SP014_ LOOK AFTER GRANDCHILDREN Yes or No
V8 gaveh SP008_ GIVEN HELP IN THE LAST TWELVE MONTHS Yes or No
V9 rech SP002_ RECEIVED HELP FROM OTHERS Yes or No
V10 gavem250 FT002_ GIVEN FINANCIAL GIFT 250 Yes or No
V11 recm250 FT009_ RECEIVED FINANCIAL GIFT OF 250 Yes or No
V12 recm5000 FT015_ EVER RECEIVED GIFT OR INHERITED MONEY 5000 Yes or No
15

Appendix II
Aggregation weights used: Frequencies of positive answers amongst non-missing observations by country
Country m_nc2 m_np2 m_cc2 m_cp2 m_tcgc m_gavem250 m_recm250 m_recm5000 m_gaveh m_rech m_crc m_crpMultiplied by V4 V1 V6 V3 V7 V10 V11 V12 V8 V9 V5 V2AT 0,440 0,076 0,573 0,151 0,309 0,272 0,074 0,156 0,200 0,216 0,324 0,030 DE 0,404 0,075 0,582 0,157 0,298 0,307 0,064 0,253 0,256 0,219 0,293 0,027 SE 0,288 0,046 0,691 0,190 0,353 0,328 0,055 0,351 0,335 0,189 0,153 0,004 NL 0,373 0,049 0,675 0,190 0,374 0,218 0,029 0,234 0,322 0,158 0,213 0,004 ES 0,664 0,114 0,731 0,184 0,291 0,091 0,040 0,169 0,117 0,118 0,484 0,030 IT 0,620 0,096 0,720 0,200 0,282 0,197 0,039 0,143 0,171 0,113 0,524 0,040 FR 0,362 0,049 0,624 0,182 0,377 0,233 0,033 0,234 0,266 0,149 0,245 0,010 DK 0,263 0,048 0,623 0,188 0,414 0,279 0,061 0,345 0,401 0,217 0,142 0,007 GR 0,642 0,120 0,787 0,255 0,267 0,300 0,106 0,235 0,198 0,217 0,508 0,050 CH 0,410 0,058 0,534 0,159 0,244 0,260 0,048 0,437 0,281 0,141 0,300 0,024
16

References Attias-Donfut, C., Ogg, J. & F.C. Wolff (2005), “Family Support” in Borsch-Supan et al. (eds.) Health, Ageing and Retirements in Europe, first results from SHARE, MEA Publication Attias-Donfut, C., Ogg, J. & F.C. Wolff (2005), “Financial Transfers” in Borsch-Supan et al. (eds.) Health, Ageing and Retirements in Europe, first results from SHARE, MEA Publication Callan T., Nolan B., Whelan B., Whelan C., και Williams J. (1996) Poverty in the 1990s: Evidence from the 1994 Living in Ireland Survey, Oak Tree Press, Dublin Esping-Andersen G. (ed.) (1990), The Three Worlds of Welfare Capitalism, Polity Press Esping-Andersen G. (ed.) (1996), Welfare States in Transition: National Adaptations in Global Economies, London, Sage Ferrera, M. (1996), “The Southern Model of Welfare in Social Europe”, Journal of European Social Policy, 6 (1) Kohli, M. Kunemund, H. & J. Ludicke (2005), “Family structure, proximity and contact”, in Borsch-Supan et al. (eds.) Health, Ageing and Retirements in Europe, first results from SHARE, MEA Publication McDonald, P. (2000), “Gender Equity, Social Institutions and the Future of Fertility”, Journal of Population Research, May. Reher, D.S. (1998), “Family Ties in Western Europe: Persistent Contrasts”, Population and Development Review, Vol. 24, no. 2 (June) Roussel, L. (1992) “La famille en Europe occidentale: divergences et covergences”, Population, 47, no. 1.
17