Embed Size (px)
Citation preview
Family Court Statistics Quarterly April to June 2015 Ministry of Justice Statistics bulletin
Published 24 September 2015
Contents
Contents 1
Introduction 2
Key Findings 4
Section 1 - The Family Justice System 6
Section 2 - Public Law 7
Section 3 - Private Law 11
Section 4 - Legal representation 13
Section 5 - Matrimonial matters 16
Section 6 - Domestic violence remedy Orders 19
Section 7 - Forced Marriage Protection Orders 20
Section 8 - Adoptions 21
Section 9 – The Mental Capacity Act 22
Section 10 – The Probate Service 25
Contacts 27

Family Court Statistics Quarterly April to June 2015
Introduction
This statistical bulletin presents statistics relating to family courts, which were previously published within Court Statistics Quarterly.
It presents statistics on activity in the family courts of England and Wales and provides provisional figures for the latest quarter (April to June 2015) with accompanying commentary and analysis. The figures give a summary overview of the volume of cases dealt with by these courts over time, with statistics also broken down for the main types of case involved.
The statistics in this bulletin are used to monitor court workloads, to assist in the development of policy, and their subsequent monitoring and evaluation.
Information on civil cases can be found here:
https://www.gov.uk/government/collections/civil-justice-statistics
Information on criminal cases can be found here:
https://www.gov.uk/government/collections/criminal-justice-statistics-quarterly
Information on publicly funding legal services is now published by the Legal Aid Agency and can be found here:
https://www.gov.uk/government/collections/legal-aid-statistics
There is also a separate Guide to Family Court Statistics published alongside this publication which provides definitions for the terms used in this report, information regarding the symbols and conventions used in the bulletin, as well as information about the systems and data sources used to compile the statistics.
The structure and content of this report are continually being reviewed to reflect user requirements. If you have any feedback about the report generally, please contact the production team using the contact details at the back of this report.
Following last quarter’s publication of the paper requesting user feedback on our proposed changes to how case progression is measured and presented, we are now collating the responses and will publish the results later this month.
Earlier editions of this publication can be found at:
www.gov.uk/government/collections/court-statistics-quarterly
There are a number of CSV files that support this publication, in the accompanying zip file. Further information about these files can be found in the word document ‘Guide to Family Justice - Guide to national and court-
2
Family Court Statistics Quarterly April to June 2015
level information.doc’, which is also included in the zip file. The CSV files contain:
Selected summary of family cases by Designated Family Judge area and region.
Additional breakdowns and further details for each of the ‘main tables’ published alongside this document.
The next edition of Family Court Statistics Quarterly is scheduled to be published on 17 December 2015, covering the period July to September 2015.
Users of the statistics
The main users of these statistics are Ministers and officials in central government responsible for developing policy with regard to family justice. Other users include the central government departments, and various voluntary organisations with an interest in family justice. The data also feed into statistics produced by the Office for National Statistics, such as public sector productivity.
3
Family Court Statistics Quarterly April to June 2015
Key Findings
This report presents statistics on activity in the family courts of England and Wales in the second quarter of 2015 (April to June).
The number of cases that started in family courts in England and Wales in April to June 2015 rose 4% to 59,908 compared to the equivalent quarter of 2014, but the recent trend remains steadily flat. Nearly half of new cases are divorce cases.
The average time for the disposal of a care or supervision application made in April to June 2015 was 29 weeks, and the trend over the past year has remained stable at this level.
56% of care or supervision proceedings were disposed of within 26 weeks, following on from the 26 week time limit for completing these cases introduced in the Children and Families Act 2014.
There has been a decrease in the timeliness for private law cases overall in the last year – trend seen post-LASPO reforms during 2013 and early 2014 now seems to be reversing with timeliness returning to pre-LASPO levels.
There has been a general upward trend in the number of applications for non-molestation domestic violence remedy orders since the end of 2012, but there has been a drop since the end of 2014 suggesting that the trend may be stabilising.
There has also been a general upward trend in the number of adoption orders issued since 2012 rising to an all-time high in July-September 2014, but in the most recent quarters, the number of orders has dropped.
There has been a gradual upward trend in the total number of applications and orders made under the Mental Capacity Act 2005.
Applications relating to deprivation of liberty increased from 109 in 2013 to 525 in 2014. In the first six months of 2015, there have already been 624 applications. This follows the Supreme Court decision on 19 March 20141 whereby it was considered a person could be deprived of their liberty in their own home, sheltered accommodation etc, and not just the nursing homes and hospitals which were previously covered.
1 P v Cheshire West and Chester Council and P and Q v Surrey County Council [2014] UKSC 19
4
Family Court Statistics Quarterly April to June 2015
There were 128,804 Lasting Powers of Attorney (LPAs) in April to June 2015, the highest quarterly figure since records began and an increase of 50% since the same quarter in 2014. This is largely due to increased publicity and new online forms which have been introduced to make it simpler and faster to apply for LPAs.
5
Family Court Statistics Quarterly April to June 2015
Section 1 - The Family Justice System
Until 22 April 2014, family cases were dealt with at Family Proceedings Courts (which were part of the magistrates’ courts), at county courts or in the Family Division of the High Court. From 22 April 2014, all family cases are now dealt with in the Single Family Court.
Family courts deal with cases such as: parental disputes, local authority intervention to protect children, matrimonial cases such as divorce petitions, the financial provisions for children after divorce or relationship breakdown, domestic violence remedies and adoption.
Total family court case caseload (Table 1)
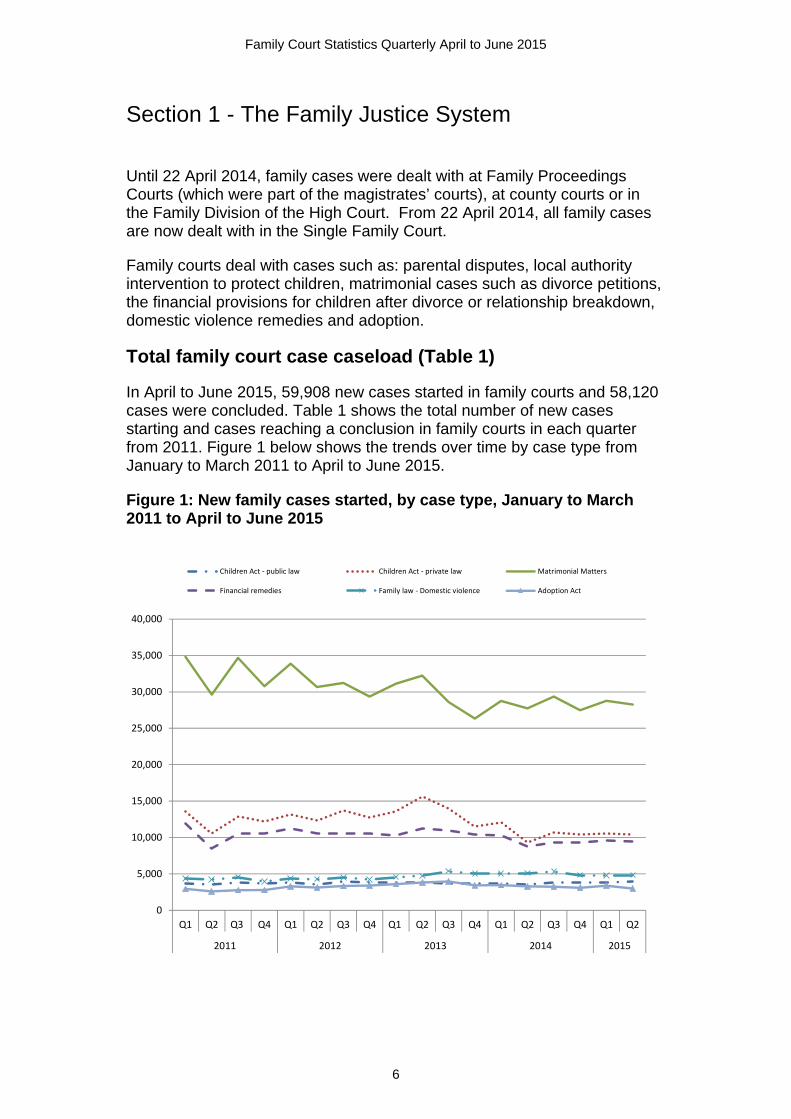
In April to June 2015, 59,908 new cases started in family courts and 58,120 cases were concluded. Table 1 shows the total number of new cases starting and cases reaching a conclusion in family courts in each quarter from 2011. Figure 1 below shows the trends over time by case type from January to March 2011 to April to June 2015.
Figure 1: New family cases started, by case type, January to March 2011 to April to June 2015
0
5,000
10,000
15,000
20,000
25,000
30,000
35,000
40,000
Q1 Q2 Q3 Q4 Q1 Q2 Q3 Q4 Q1 Q2 Q3 Q4 Q1 Q2 Q3 Q4 Q1 Q2
2011 2012 2013 2014 2015
Children Act ‐ public law Children Act ‐ private law Matrimonial Matters
Financial remedies Family law ‐ Domestic violence Adoption Act
6

Family Court Statistics Quarterly April to June 2015
Section 2 - Public Law
Public law cases are those brought by local authorities or, very rarely, an authorised person to protect the child and ensure they get the care they need. They can apply for a range of different orders. Types of order include a care or supervision order which determines whether the child should be looked after or supervised by the local authority, or an emergency protection order which allows an individual or local authority to take a child away from a place where they are in immediate danger to a place of safety.
Following the publicity surrounding the Baby P case, the number of children involved in public law applications made by local authorities jumped in 2009 from around 20,000 to almost 26,000 per year. This had subsequently increased to nearly 30,000 per year. Figures have remained fairly steady at around 7,000 per quarter, with 7,394 children involved in public law applications in April to June 2015 (Figure 2).
The number of applications made, which can cover more than one child, was 4,238 in April to June 2015 – on average, there were 1.7 children involved in each application. More than one application may be made during the life of a case. The numbers of cases started in April to June 2015 was 3,892 (Table 2).
Figure 2: Public law applications: number of children involved, number of application events and number of cases started, January to March 2011 to April to June 2015
0
1,000
2,000
3,000
4,000
5,000
6,000
7,000
8,000
Q12011
Q22011
Q32011
Q42011
Q12012
Q22012
Q32012
Q42012
Q12013
Q22013
Q32013
Q42013
Q12014
Q22014
Q32014
Q42014
Q12015
Q22015
Nu
mb
er o
f ap
pli
cati
on
s / e
ven
ts /
cas
es s
tart
ed
Children involved in applications Application events Cases started
There were 9,582 children involved in public law orders made in April to June 2015. The number of orders made is generally higher than the number of applications made, as some orders relate to applications made in an earlier time period, and an application for one type can result in an order or orders of a different type being made.
7
Family Court Statistics Quarterly April to June 2015
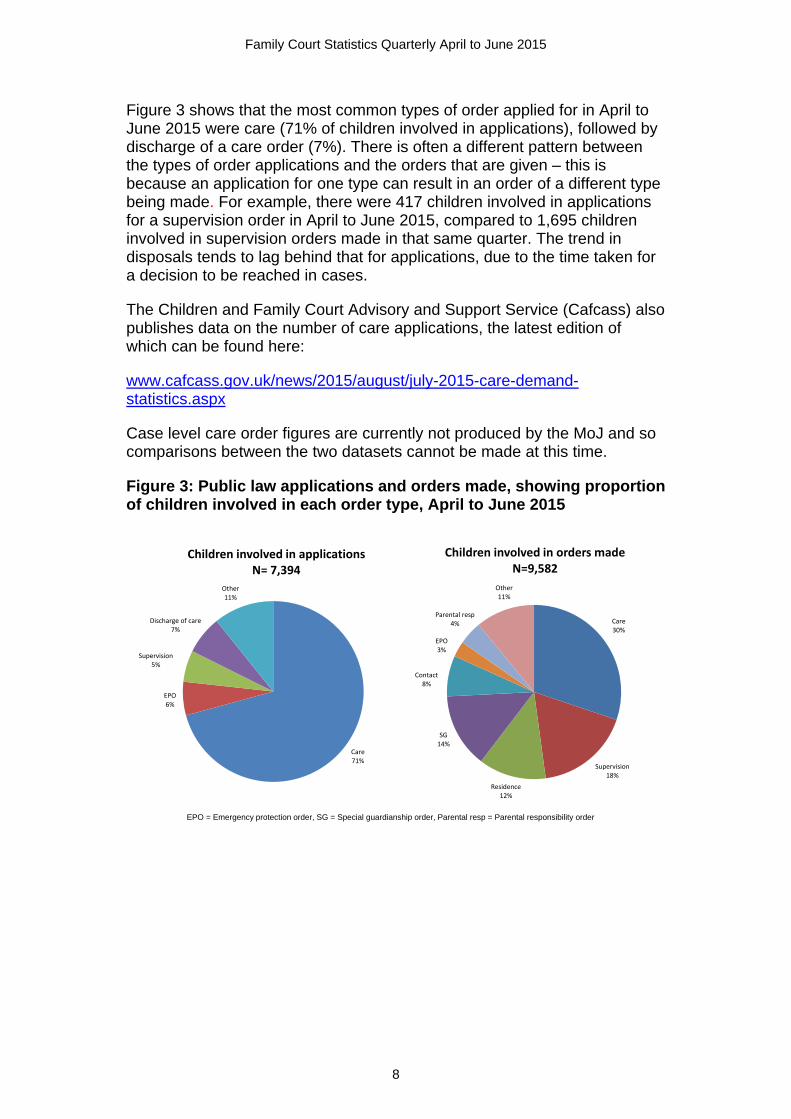
Figure 3 shows that the most common types of order applied for in April to June 2015 were care (71% of children involved in applications), followed by discharge of a care order (7%). There is often a different pattern between the types of order applications and the orders that are given – this is because an application for one type can result in an order of a different type being made. For example, there were 417 children involved in applications for a supervision order in April to June 2015, compared to 1,695 children involved in supervision orders made in that same quarter. The trend in disposals tends to lag behind that for applications, due to the time taken for a decision to be reached in cases.
The Children and Family Court Advisory and Support Service (Cafcass) also publishes data on the number of care applications, the latest edition of which can be found here:
www.cafcass.gov.uk/news/2015/august/july-2015-care-demand-statistics.aspx
Case level care order figures are currently not produced by the MoJ and so comparisons between the two datasets cannot be made at this time.
Figure 3: Public law applications and orders made, showing proportion of children involved in each order type, April to June 2015
Care71%
EPO6%
Supervision5%
Discharge of care7%
Other11%
Children involved in applicationsN= 7,394
Care30%
Supervision18%
Residence12%
SG14%
Contact8%
EPO3%
Parental resp4%
Other 11%
Children involved in orders madeN=9,582
EPO = Emergency protection order, SG = Special guardianship order, Parental resp = Parental responsibility order
8
Family Court Statistics Quarterly April to June 2015
Timeliness of care proceedings
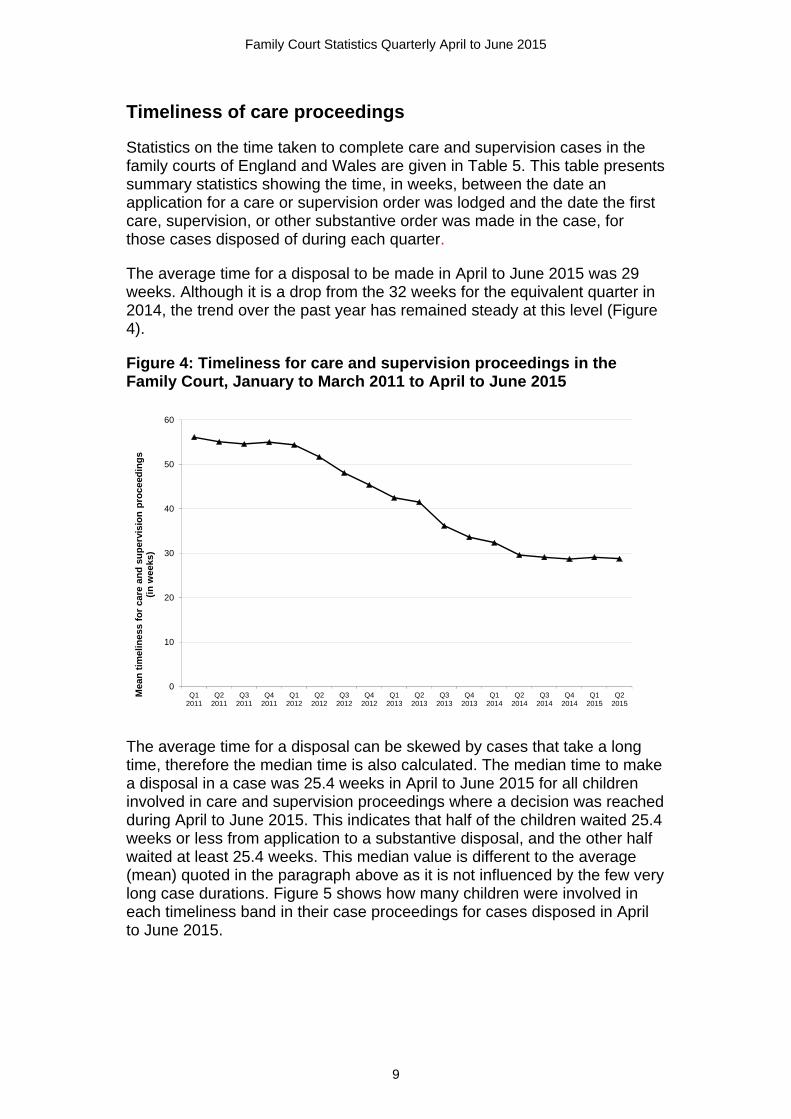
Statistics on the time taken to complete care and supervision cases in the family courts of England and Wales are given in Table 5. This table presents summary statistics showing the time, in weeks, between the date an application for a care or supervision order was lodged and the date the first care, supervision, or other substantive order was made in the case, for those cases disposed of during each quarter.
The average time for a disposal to be made in April to June 2015 was 29 weeks. Although it is a drop from the 32 weeks for the equivalent quarter in 2014, the trend over the past year has remained steady at this level (Figure 4).
Figure 4: Timeliness for care and supervision proceedings in the Family Court, January to March 2011 to April to June 2015
0
10
20
30
40
50
60
Q12011
Q22011
Q32011
Q42011
Q12012
Q22012
Q32012
Q42012
Q12013
Q22013
Q32013
Q42013
Q12014
Q22014
Q32014
Q42014
Q12015
Q22015
Mea
n t
imel
ines
s fo
r ca
re a
nd
su
per
visi
on
pro
ceed
ing
s (i
n w
eeks
)
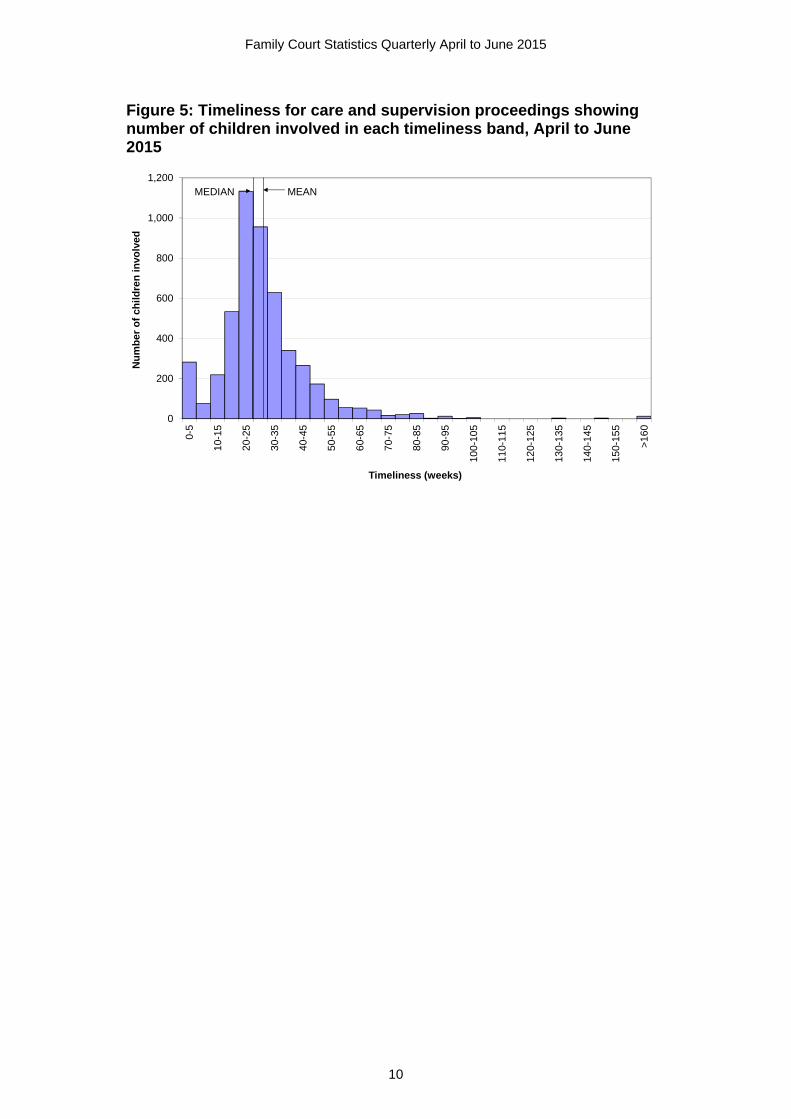
The average time for a disposal can be skewed by cases that take a long time, therefore the median time is also calculated. The median time to make a disposal in a case was 25.4 weeks in April to June 2015 for all children involved in care and supervision proceedings where a decision was reached during April to June 2015. This indicates that half of the children waited 25.4 weeks or less from application to a substantive disposal, and the other half waited at least 25.4 weeks. This median value is different to the average (mean) quoted in the paragraph above as it is not influenced by the few very long case durations. Figure 5 shows how many children were involved in each timeliness band in their case proceedings for cases disposed in April to June 2015.
9
Family Court Statistics Quarterly April to June 2015
Figure 5: Timeliness for care and supervision proceedings showing number of children involved in each timeliness band, April to June 2015
0
200
400
600
800
1,000
1,2000-
5
10-
15
20-
25
30-
35
40-
45
50-
55
60-
65
70-
75
80-
85
90-
95
100-
105
110-
115
120-
125
130-
135
140-
145
150-
155
>16
0
Nu
mb
er o
f ch
ild
ren
invo
lved
Timeliness (weeks)
MEDIAN MEAN
10
Family Court Statistics Quarterly April to June 2015
Section 3 - Private Law
The number of Private law cases started in April to June 2015 was 10,494, up 13% compared to the equivalent quarter in 2014 when cases started were at an all-time low.
In comparison, for cases disposed there was an increase of 7% in April to June 2015 (13,081) compared to the equivalent quarter in 2014 (12,261). This is because the trend in cases disposed tends to lag behind that for cases started due to the time taken for a decision to be reached in cases. Please note there was an increase in the number of private law cases in quarter 3 (July to September) 2014 due to an audit by HMCTS of all open private law cases.
The Children and Family Court Advisory and Support Service (Cafcass) also publishes (England only) data on the number of private law cases started, the latest edition of which can be found here:
www.cafcass.gov.uk/news/2015/august/july-2015-private-law-demand-statistics.aspx
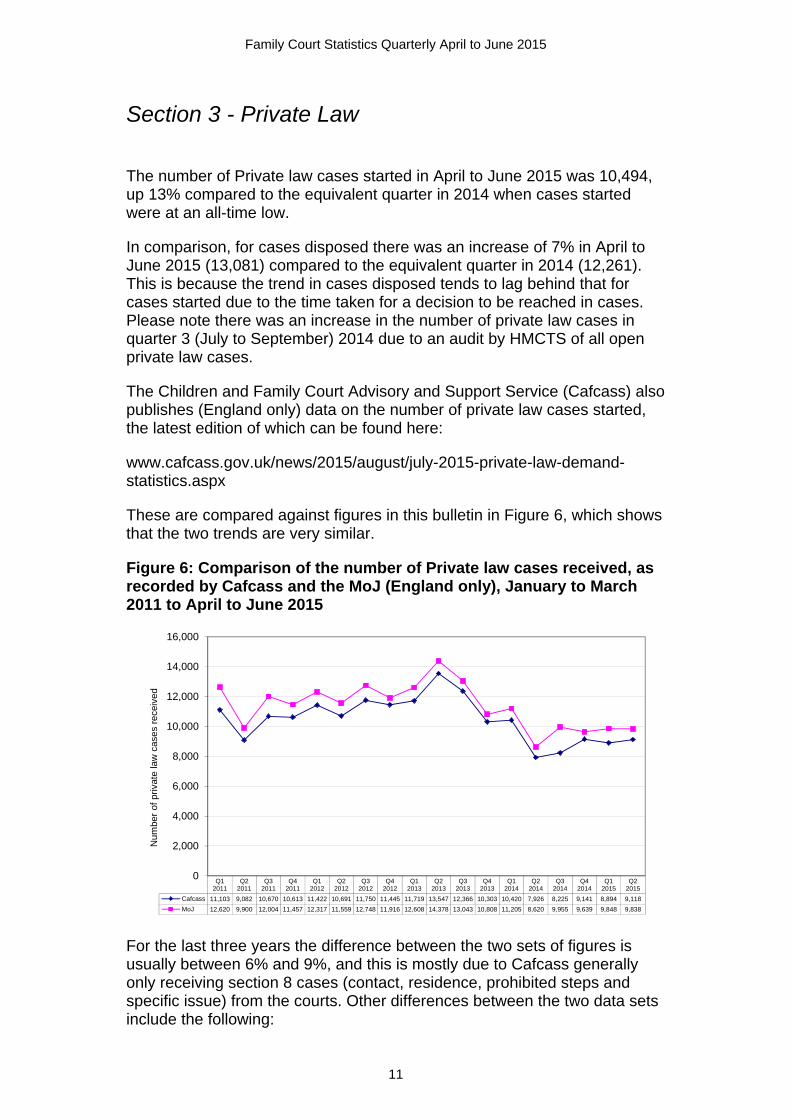
These are compared against figures in this bulletin in Figure 6, which shows that the two trends are very similar.
Figure 6: Comparison of the number of Private law cases received, as recorded by Cafcass and the MoJ (England only), January to March 2011 to April to June 2015
Q12011
Q22011
Q32011
Q42011
Q12012
Q22012
Q32012
Q42012
Q12013
Q22013
Q32013
Q42013
Q12014
Q22014
Q32014
Q42014
Q12015
Q22015
Cafcass 11,103 9,082 10,670 10,613 11,422 10,691 11,750 11,445 11,719 13,547 12,366 10,303 10,420 7,926 8,225 9,141 8,894 9,118
MoJ 12,620 9,900 12,004 11,457 12,317 11,559 12,748 11,916 12,608 14,378 13,043 10,808 11,205 8,620 9,955 9,639 9,848 9,838
0
2,000
4,000
6,000
8,000
10,000
12,000
14,000
16,000
Num
ber
of p
rivat
e la
w c
ases
rec
eive
d
For the last three years the difference between the two sets of figures is usually between 6% and 9%, and this is mostly due to Cafcass generally only receiving section 8 cases (contact, residence, prohibited steps and specific issue) from the courts. Other differences between the two data sets include the following:
11

Family Court Statistics Quarterly April to June 2015
Section 8 cases where all of the issues are dealt with on the day (called 'urgent without notice' applications) should not be sent to Cafcass.
Section 8 cases which are not listed within the Private Law Programme (PLP) and do not have a first hearing dispute resolution appointment (FHDRA) should also not be sent to Cafcass.
Certain non-section 8 cases can be sent to Cafcass if the subject child is a party to ongoing proceedings (and a Cafcass officer has been appointed as the children’s guardian) or the court is directed to do so by a judge or legal advisor.
This means that the two sets of figures cannot be accurately matched as it is impossible to identify the various situations described above from administrative data sources (particularly the 'urgent without notice' applications).
Timeliness of private law cases
Table 6 shows that from the middle of 2012 to April to June 2014, for private law cases overall the average time to first definitive disposal had been on a slight upward trend. In the most recent quarters, this trend appears to be reversing with the average time to first disposal at 14.7 weeks for April to June 2015 (down 2.5 weeks from the equivalent quarter in 2014).
For more details on the timeliness in private law cases please see Section 4 below.
12
Family Court Statistics Quarterly April to June 2015
Section 4 - Legal representation
Figures on the legal representation of parties in family-related court cases are shown in Table 6. This gives the number of disposals made during each quarter and the average duration between application and first substantive disposal, for divorce, public law, private law, adoption and domestic violence cases, according to whether the applicant(s), respondent(s), both or neither had legal representation during the case.
A further breakdown of Table 6 by region is published in the CSV files that accompanies this publication.
The legal representation status reflects whether the applicant/respondent's legal representative has been recorded or left blank within FamilyMan, the family court case management system. Therefore, parties recorded as without legal representation are not necessarily self-representing litigants in person - for example, Table 6 suggests that for half of the divorce cases not involving financial remedies disposed, neither party had legal representation. However, further analysis shows that these were uncontested cases and about 98 to 99% of them did not have a single hearing.
Legal Aid, Sentencing and Punishment of Offender Act, 2012
The implementation of the Legal Aid, Sentencing and Punishment of Offenders Act (LASPO) in April 2013 made changes to the scope and eligibility of legal aid.
The Legal Aid Agency (LAA - formerly the Legal Services Commission) collects statistics on those applying for legal aid, and figures on the number applications received and certificates granted by various Family categories have been published in their annual and quarterly statistical reports which can be found here:
https://www.gov.uk/government/collections/legal-aid-statistics
From April 2013, legal aid is now only available for private family law cases (such as contact or divorce) if there is evidence of domestic violence or child abuse and child abduction cases. Legal aid remains available for public family law cases (such as adoption).
The full details of the LASPO Act can be found here: www.legislation.gov.uk/ukpga/2012/10/enacted
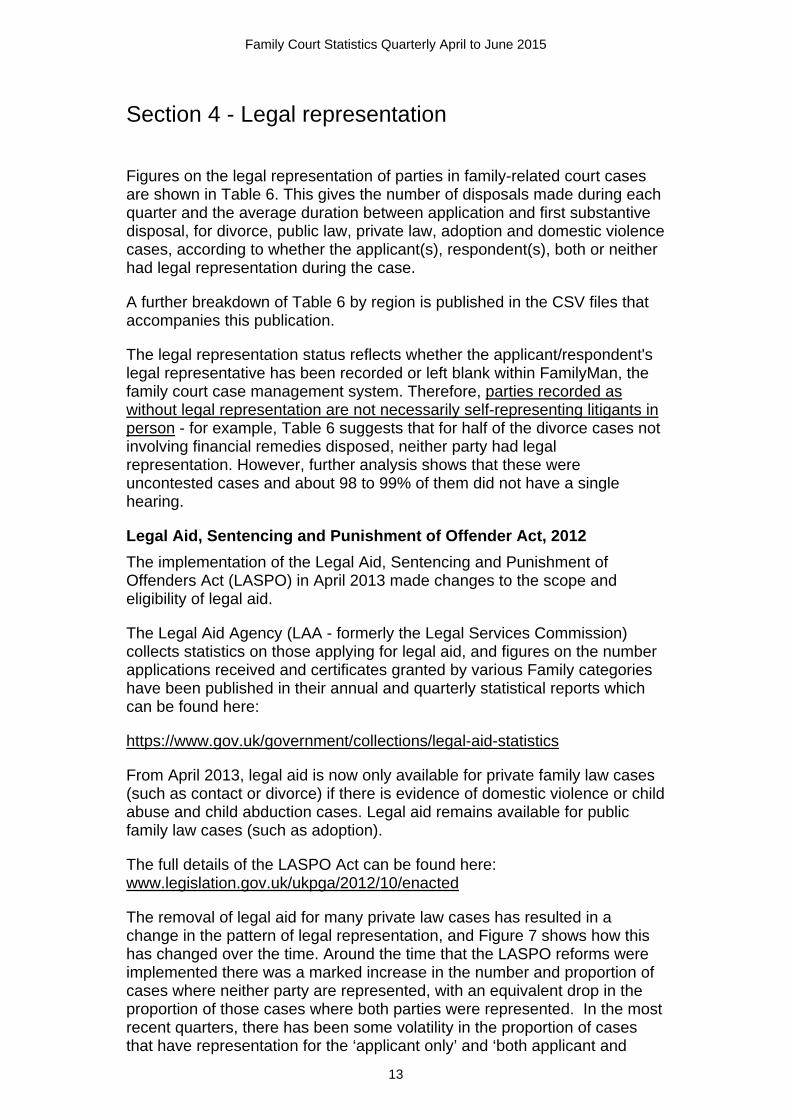
The removal of legal aid for many private law cases has resulted in a change in the pattern of legal representation, and Figure 7 shows how this has changed over the time. Around the time that the LASPO reforms were implemented there was a marked increase in the number and proportion of cases where neither party are represented, with an equivalent drop in the proportion of those cases where both parties were represented. In the most recent quarters, there has been some volatility in the proportion of cases that have representation for the ‘applicant only’ and ‘both applicant and
13
Family Court Statistics Quarterly April to June 2015
respondent’ representation – both appear now to be in line with the overall general trend. Quarter on quarter changes should be treated with caution.
Figure 7: Proportion of parties in private law cases with legal representation, January to March 2011 to April to June 2015
22%
37%
10%
31%
0%
10%
20%
30%
40%
50%
60%
Jan-Mar
Apr-Jun
Jul-Sept
Oct-Dec
Jan-Mar
Apr-Jun
Jul-Sept
Oct-Dec
Jan-Mar
Apr-Jun
Jul-Sept
Oct-Dec
Jan-Mar
Apr-Jun
Jul-Sept
Oct-Dec
Jan-Mar
Apr-Jun
2011 2012 2013 2014 2015
% o
f P
riva
te L
aw c
as
es b
y le
ga
l re
pre
sen
tati
on
Both Applicant and Respondent Applicant only Respondent only Neither Applicant nor Respondent
Timeliness of cases by legal representation
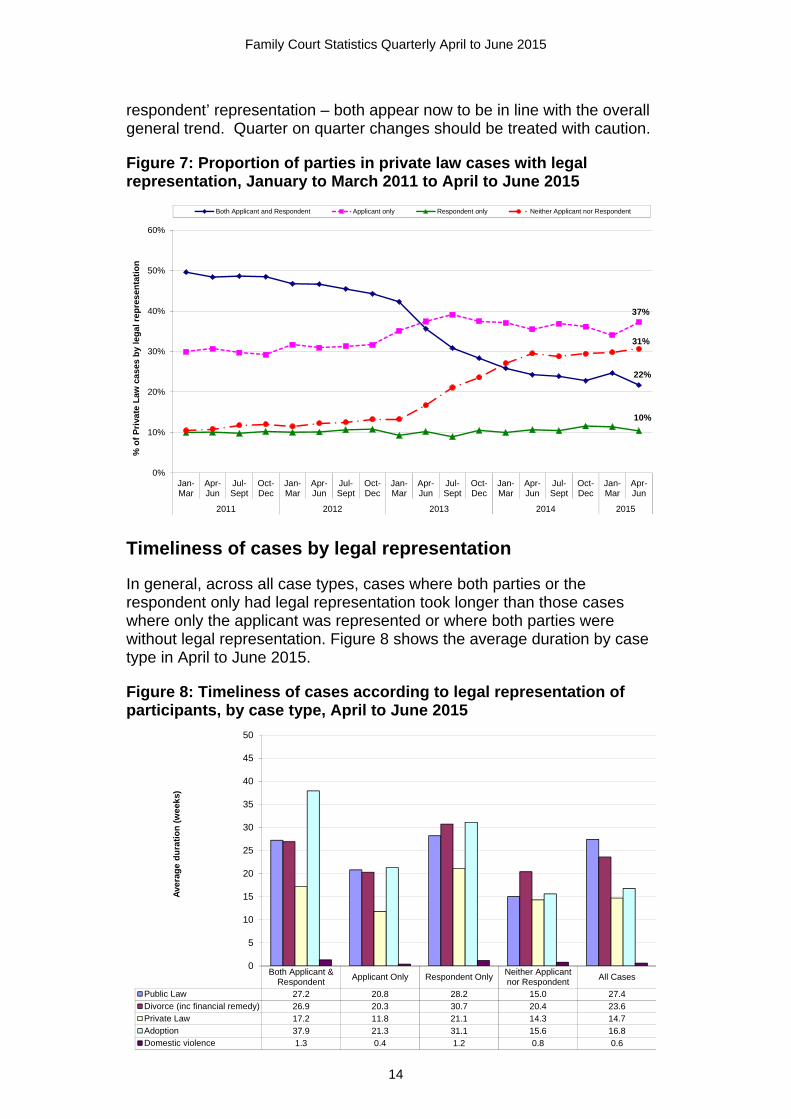
In general, across all case types, cases where both parties or the respondent only had legal representation took longer than those cases where only the applicant was represented or where both parties were without legal representation. Figure 8 shows the average duration by case type in April to June 2015.
Figure 8: Timeliness of cases according to legal representation of participants, by case type, April to June 2015
Both Applicant &Respondent
Applicant Only Respondent OnlyNeither Applicantnor Respondent
All Cases
Public Law 27.2 20.8 28.2 15.0 27.4Divorce (inc financial remedy) 26.9 20.3 30.7 20.4 23.6Private Law 17.2 11.8 21.1 14.3 14.7Adoption 37.9 21.3 31.1 15.6 16.8Domestic violence 1.3 0.4 1.2 0.8 0.6
0
5
10
15
20
25
30
35
40
45
50
Ave
rag
e d
ura
tio
n (
we
eks)
14
Family Court Statistics Quarterly April to June 2015
The average duration across the representation groups for public law steadily fell since the middle of 2012 until the last twelve months when it has remained fairly steady. For adoption cases overall average duration has remained fairly constant over recent years. Note that adoption timeliness in Q3 2014 was higher because of a data cleansing exercise in some regions which administratively closed old cases.
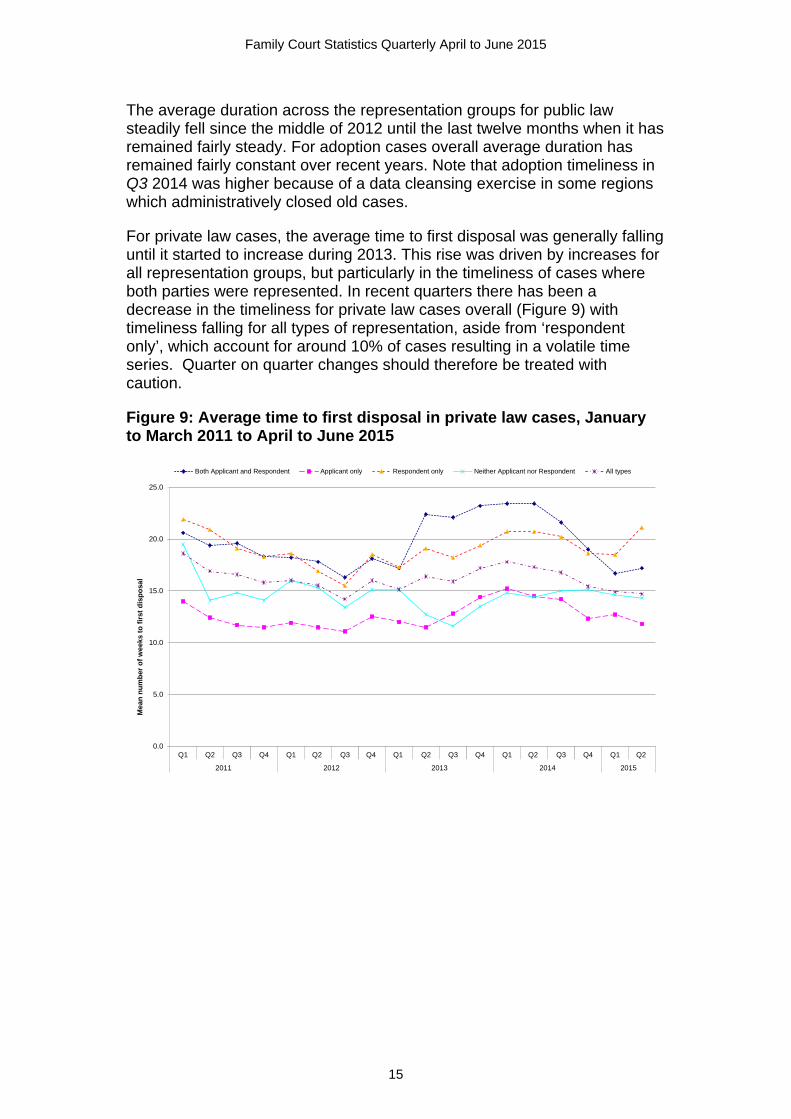
For private law cases, the average time to first disposal was generally falling until it started to increase during 2013. This rise was driven by increases for all representation groups, but particularly in the timeliness of cases where both parties were represented. In recent quarters there has been a decrease in the timeliness for private law cases overall (Figure 9) with timeliness falling for all types of representation, aside from ‘respondent only’, which account for around 10% of cases resulting in a volatile time series. Quarter on quarter changes should therefore be treated with caution.
Figure 9: Average time to first disposal in private law cases, January to March 2011 to April to June 2015
0.0
5.0
10.0
15.0
20.0
25.0
Q1 Q2 Q3 Q4 Q1 Q2 Q3 Q4 Q1 Q2 Q3 Q4 Q1 Q2 Q3 Q4 Q1 Q2
2011 2012 2013 2014 2015
Me
an n
um
ber
of
we
eks
to f
irs
t d
isp
osa
l
Both Applicant and Respondent Applicant only Respondent only Neither Applicant nor Respondent All types
15

Family Court Statistics Quarterly April to June 2015
Section 5 - Matrimonial matters
Table 7 provides the numbers of petitions and decrees granted for divorce, annulment and judicial separation in England and Wales. The CSV file that accompanies this publication provides additional information on matrimonial proceedings such gender of petitioner and whether children were involved or not.
Over 99% of petitions filed for matrimonial proceedings are for divorce. There are small numbers of annulments and judicial separations. The number of divorces is fairly stable at around 30,000 per quarter.
In addition to caseload, there are also divorce case progression figures presented in this publication. A summary of divorce case progression can be found in Table 8 – it shows the number and proportion of divorce cases commencing in each quarter since 2003 that had reached certain stages by the end of June 2015.
The table also includes an estimation of the final numbers of cases that will reach each stage (decrees nisi, decrees absolute, financial remedy applications, financial remedy orders, hearings, injunction applications and injunction orders). Based on this estimation, around 90% of divorce petitions eventually proceed to a decree absolute. Financial remedy applications and orders are eventually made in just over a third cases, and hearings take place in just over 10% of cases. Figure 10 illustrates these trends. This estimation has been based on the paper “Generalised estimation method for the number of cases that reach any stage in the court process in civil justice” published on page 68 of A Guide to Court and Administrative Justice Statistics2.
We recently conducted a consultation on our proposed changes to how case progression is measured and presented - we are now collating the responses and will publish the results later this month.
2 https://www.gov.uk/government/statistics/guide-to-court-and-administrative-justice-statistics
16

Family Court Statistics Quarterly April to June 2015
Figure 10: Estimated case progression of divorce cases, January to March 2009 to April to June 2015
0
5,000
10,000
15,000
20,000
25,000
30,000
35,000
2009Q1
2009Q2
2009Q3
2009Q4
2010Q1
2010Q2
2010Q3
2010Q4
2011Q1
2011Q2
2011Q3
2011Q4
2012Q1
2012Q2
2012Q3
2012Q4
2013Q1
2013Q2
2013Q3
2013Q4
2014Q1
2014Q2
2014Q3
2014Q4
2015Q1
2015Q2
Nu
mb
er o
f d
ivo
rce
case
s
Decrees Absolute
Financial Remedy Orders
Hearings
Financial remedy
During a divorce, a marriage annulment, or a judicial separation, or the dissolution of a civil partnership, there may still be a need for the court to settle disputes over money or property. The court can make a financial remedy order, formerly known as ‘ancillary relief’. These orders include dealing with the arrangements for the sale or transfer of property, maintenance payments, a lump sum payment or the sharing of a pension. Orders for financial provision other than for financial remedy are not dependent upon divorce proceedings and may be made for children.
There were 10,410 applications in April to June 2015, 4% higher than a year earlier.
In April to June 2015, there were 9,745 financial remedy disposals, down 6% on the equivalent quarter in 2014, continuing the recent downward trend. During this latest period, 65% of disposals were uncontested, 26% were initially contested, and 9% were contested throughout (Table 9).
In April to June 2015, property adjustment orders and lump sum orders each accounted for about a third of the total financial remedy disposal types (Table 10). Figure 11 provides a breakdown of all disposal types for the latest quarter.
17

Family Court Statistics Quarterly April to June 2015
Figure 11: Financial remedy disposal types, April to June 2015
Periodical payments13%
Lump sum orders32%
Property adjustment orders29%
Pension sharing orders11%
Pension attachment orders4%
Secure provision orders6%
Maintenance pending suit3%
Application dismissed2%
18

Family Court Statistics Quarterly April to June 2015
Section 6 - Domestic violence remedy Orders
A range of people can apply to the court for a domestic violence remedy order: spouses, cohabitants, ex-cohabitants, those who live or have lived in the same household (other than by reason of one of them being the other’s employee, tenant, lodger or boarder), certain relatives (for example, parents, grandparents, in-laws, brothers, sisters), and those who have agreed to marry one another.
Two types of order can be granted:
a non-molestation order, which can either prohibit particular behaviour or general molestation by someone who has previously been violent towards the applicant and/or any relevant children; and,
an occupation order, which can define or regulate rights of occupation of the home by the parties involved.
Figure 12: Applications for domestic violence remedy orders, January to March 2008 to April to June 2015
0
1,000
2,000
3,000
4,000
5,000
6,000
Q1 Q2 Q3 Q4 Q1 Q2 Q3 Q4 Q1 Q2 Q3 Q4 Q1 Q2 Q3 Q4 Q1 Q2 Q3 Q4 Q1 Q2 Q3 Q4 Q1 Q2 Q3 Q4 Q1 Q2
2008 2009 2010 2011 2012 2013 2014 2015
Nu
mb
er o
f d
om
est
ic v
iole
nc
e a
pp
lica
tio
ns
Non-Molestation Occupation
As shown in Figure 12, the number of occupation applications has shown a slight decline over recent quarters. Whilst the general trend in the number of non-molestation applications has been increasing since the end of 2012, there has been a drop in recent quarters, with April to June 2015 down 5% from the equivalent quarter in 2014.
19
Family Court Statistics Quarterly April to June 2015
Section 7 - Forced Marriage Protection Orders
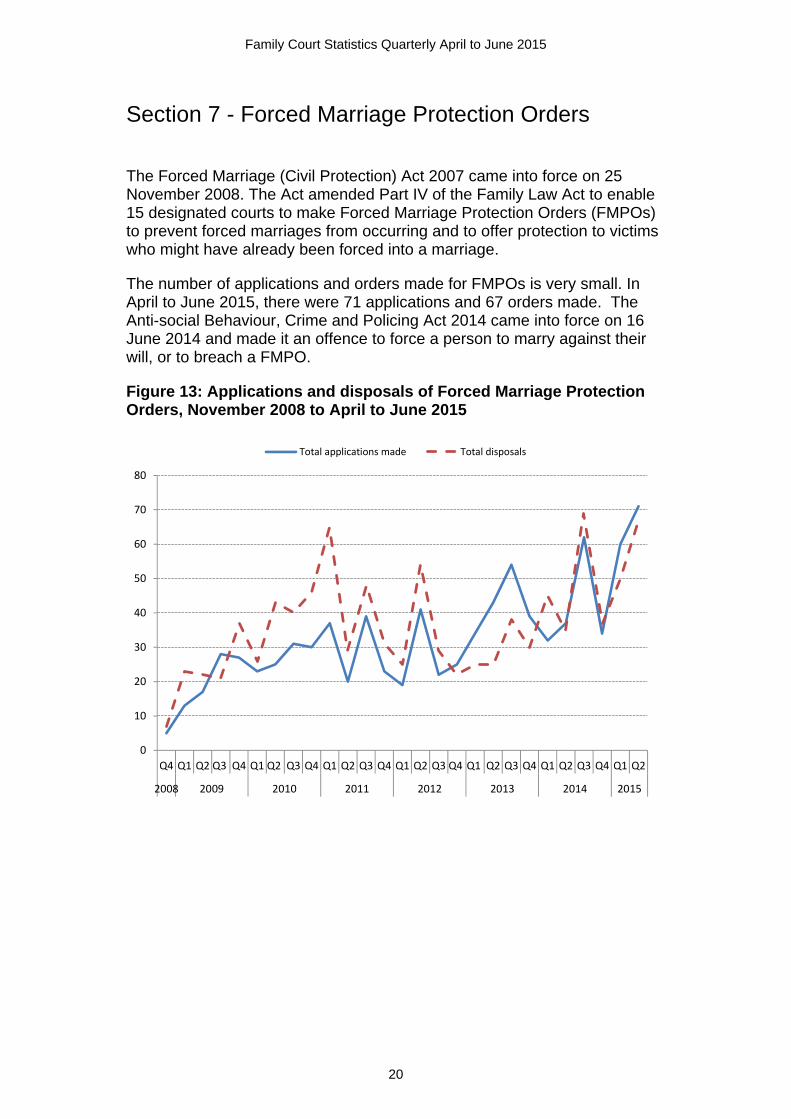
The Forced Marriage (Civil Protection) Act 2007 came into force on 25 November 2008. The Act amended Part IV of the Family Law Act to enable 15 designated courts to make Forced Marriage Protection Orders (FMPOs) to prevent forced marriages from occurring and to offer protection to victims who might have already been forced into a marriage.
The number of applications and orders made for FMPOs is very small. In April to June 2015, there were 71 applications and 67 orders made. The Anti-social Behaviour, Crime and Policing Act 2014 came into force on 16 June 2014 and made it an offence to force a person to marry against their will, or to breach a FMPO.
Figure 13: Applications and disposals of Forced Marriage Protection Orders, November 2008 to April to June 2015
0
10
20
30
40
50
60
70
80
Q4 Q1 Q2 Q3 Q4 Q1 Q2 Q3 Q4 Q1 Q2 Q3 Q4 Q1 Q2 Q3 Q4 Q1 Q2 Q3 Q4 Q1 Q2 Q3 Q4 Q1 Q2
2008 2009 2010 2011 2012 2013 2014 2015
Total applications made Total disposals
20

Family Court Statistics Quarterly April to June 2015
Section 8 - Adoptions
An adoption order made by a court extinguishes the rights, duties and obligations of the natural parents or guardian and vests them in the adopters. On adoption, the child becomes for virtually all purposes in law the child of its adoptive parents and has the same rights of inheritance of property as any children born to the adoptive parents. Most adoptions in the UK are ‘standard’ adoptions. Data is also provided on other adoptions, which include foreign adoptions, convention adoptions and standard adoptions that include a foreign element. An adoption order is preceded by a placement order which allows a local authority to place a child with prospective adopters, unless parental consent has been given for the placement.
In April to June 2015, there were 1,164 applications made for a placement order and 1,486 applications made for an adoption order (Table 13).
During April to June 2015, there were 1,627 adoption orders issued, similar to that for the equivalent quarter last year. In 72% of these, the adopters were a male/female couple, while in 13% the adopter was a sole applicant. In a further 7% of orders, the adopter was a step-parent and in 8% the adopters were a same-sex couple (Figure 14). Figures on the sex and age band of adopted children can be found in Table 14 and timeliness figures can be found in Table 6. A wider range of breakdowns for adoption applications and orders, for example by type of order, can be produced from the accompanying CSV file.
Figure 14: Adoption orders issued, by adopter, January to March 2011 to April to June 2015
0
200
400
600
800
1,000
1,200
1,400
1,600
1,800
Q12011
Q22011
Q32011
Q42011
Q12012
Q22012
Q32012
Q42012
Q12013
Q22013
Q32013
Q42013
Q12014
Q22014
Q32014
Q42014
Q12015
Q22015
Nu
mb
er
of
ado
pti
on
ord
ers
issu
ed
Male/ female couple Sole applicant Step parent Same sex couple All adopters
21
Family Court Statistics Quarterly April to June 2015
Section 9 – The Mental Capacity Act
The Mental Capacity Act 2005 provides a statutory framework to empower and protect vulnerable people who are not able to make their own decisions. The Act makes it clear who can take decisions, in which situations, and how they should go about this. It enables people to plan ahead for a time when they may lose capacity.
When the Mental Capacity Act 2005 came into force on 1 October 2007, the role and function of the Court of Protection (CoP) changed, and in addition, the Office of the Public Guardian (OPG) was established. The OPG, an executive agency of the Ministry of Justice, supports the Public Guardian in registering Enduring Powers of Attorney (EPA), Lasting3 Powers of Attorney (LPA) and supervising Court of Protection appointed Deputies.
For more information on the roles of these specialised courts please see A Guide to Family Court Statistics that is published alongside this publication.
Court of Protection (Tables 15 and 16)
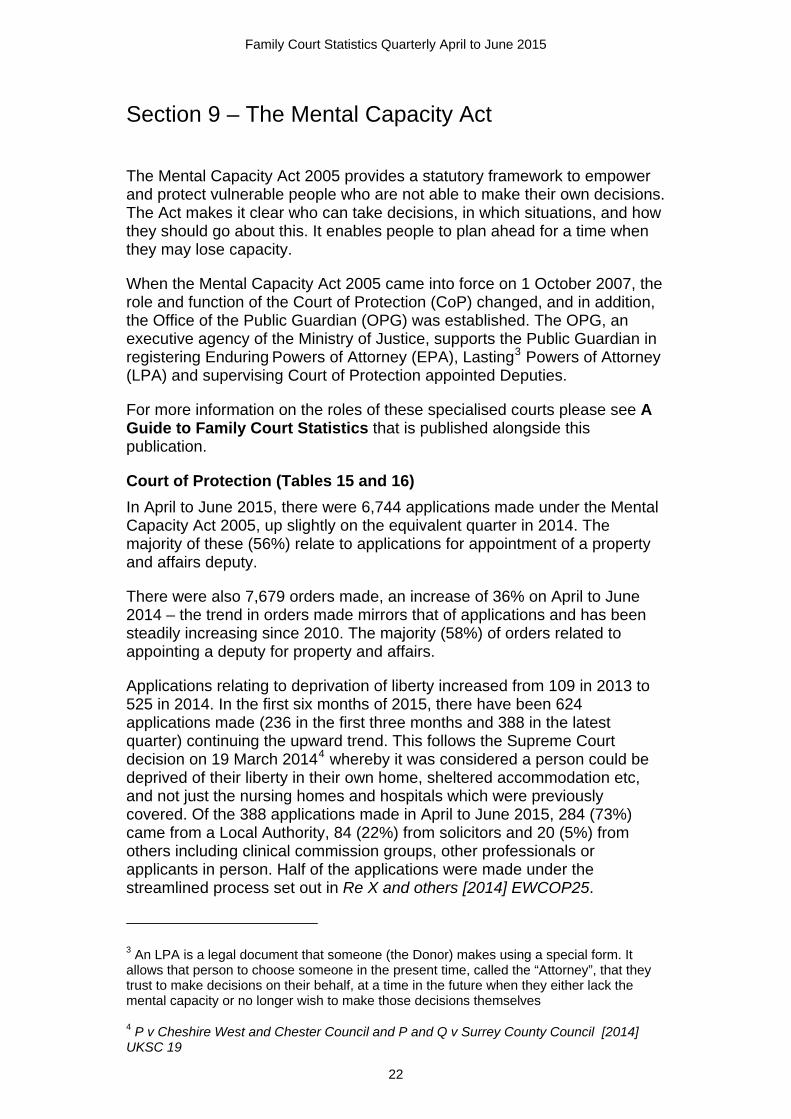
In April to June 2015, there were 6,744 applications made under the Mental Capacity Act 2005, up slightly on the equivalent quarter in 2014. The majority of these (56%) relate to applications for appointment of a property and affairs deputy.
There were also 7,679 orders made, an increase of 36% on April to June 2014 – the trend in orders made mirrors that of applications and has been steadily increasing since 2010. The majority (58%) of orders related to appointing a deputy for property and affairs.
Applications relating to deprivation of liberty increased from 109 in 2013 to 525 in 2014. In the first six months of 2015, there have been 624 applications made (236 in the first three months and 388 in the latest quarter) continuing the upward trend. This follows the Supreme Court decision on 19 March 20144 whereby it was considered a person could be deprived of their liberty in their own home, sheltered accommodation etc, and not just the nursing homes and hospitals which were previously covered. Of the 388 applications made in April to June 2015, 284 (73%) came from a Local Authority, 84 (22%) from solicitors and 20 (5%) from others including clinical commission groups, other professionals or applicants in person. Half of the applications were made under the streamlined process set out in Re X and others [2014] EWCOP25.
3 An LPA is a legal document that someone (the Donor) makes using a special form. It allows that person to choose someone in the present time, called the “Attorney”, that they trust to make decisions on their behalf, at a time in the future when they either lack the mental capacity or no longer wish to make those decisions themselves
4 P v Cheshire West and Chester Council and P and Q v Surrey County Council [2014] UKSC 19
22
Family Court Statistics Quarterly April to June 2015
The Health and Social Care Information Centre (HSCIC) collects data from councils with social services responsibilities on deprivation of liberty at a case level on an annual5 and quarterly6 basis. Section 16 of the Mental Capacity Act (MCA) and Re X cases are new and considered by the court but not by Local Authorities first. Those cases which come under section 21A of the MCA 2005 are seen as appeals to the court of those who have already been assessed for deprivation of liberty and are likely to have been included in HSCIC figures.
Figure 15: Applications and orders made under the Mental Capacity Act, January to March 2008 to April to June 2015
0
1,000
2,000
3,000
4,000
5,000
6,000
7,000
8,000
9,000
Jan-
Ma
r
Apr
-Ju
n
Jul-S
ep
Oct
-De
c
Jan-
Ma
r
Apr
-Ju
n
Jul-S
ep
Oct
-De
c
Jan-
Ma
r
Apr
-Ju
n
Jul-S
ep
Oct
-De
c
Jan-
Ma
r
Apr
-Ju
n
Jul-S
ep
Oct
-De
c
Jan-
Ma
r
Apr
-Ju
n
Jul-S
ep
Oct
-De
c
Jan-
Ma
r
Apr
-Ju
n
Jul-S
ep
Oct
-De
c
Jan-
Ma
r
Apr
-Ju
n
Jul-S
ep
Oct
-De
c
Jan-
Ma
r
Apr
-Ju
n
2008 2009 2010 2011 2012 2013 2014 2015
Applications Orders
Office of the Public Guardian (Table 17)
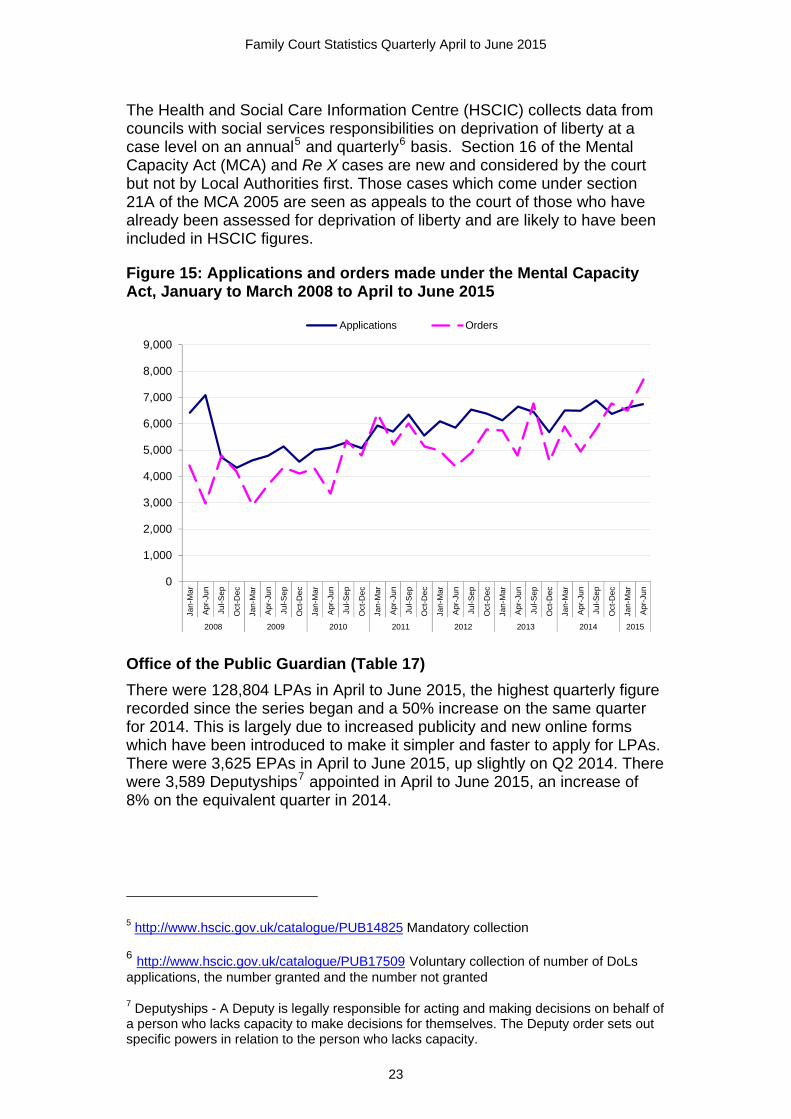
There were 128,804 LPAs in April to June 2015, the highest quarterly figure recorded since the series began and a 50% increase on the same quarter for 2014. This is largely due to increased publicity and new online forms which have been introduced to make it simpler and faster to apply for LPAs. There were 3,625 EPAs in April to June 2015, up slightly on Q2 2014. There were 3,589 Deputyships7 appointed in April to June 2015, an increase of 8% on the equivalent quarter in 2014.
5 http://www.hscic.gov.uk/catalogue/PUB14825 Mandatory collection
6 http://www.hscic.gov.uk/catalogue/PUB17509 Voluntary collection of number of DoLs applications, the number granted and the number not granted
7 Deputyships - A Deputy is legally responsible for acting and making decisions on behalf of a person who lacks capacity to make decisions for themselves. The Deputy order sets out specific powers in relation to the person who lacks capacity.
23

Family Court Statistics Quarterly April to June 2015
Figure 16: Powers of attorney received, January to March 2008 to April to June 2015
0
20,000
40,000
60,000
80,000
100,000
120,000
140,000Ja
n-M
ar
Apr
-Ju
n
Jul-S
ep
Oct
-De
c
Jan-
Ma
r
Apr
-Ju
n
Jul-S
ep
Oct
-De
c
Jan-
Ma
r
Apr
-Ju
n
Jul-S
ep
Oct
-De
c
Jan-
Ma
r
Apr
-Ju
n
Jul-S
ep
Oct
-De
c
Jan-
Ma
r
Apr
-Ju
n
Jul-S
ep
Oct
-De
c
Jan-
Ma
r
Apr
-Ju
n
Jul-S
ep
Oct
-De
c
Jan-
Ma
r
Apr
-Ju
n
Jul-S
ep
Oct
-De
c
Jan-
Ma
r
Apr
-Ju
n
2008 2009 2010 2011 2012 2013 2014 2015
Number of EPAs Received Number of LPAs Received
Of LPAs registered in April to June 2015, 39% were for males – see Table 18. The most common age group applying for an LPA is 81-90 years, as shown in Figure 17.
Figure 17: Age of LPA donors registered as at end of June 2015
0
100,000
200,000
300,000
400,000
500,000
600,000
18-30 31-40 41-50 51-60 61-70 71-80 81-90 91-100 100-110
Nu
mb
er o
f L
PA
s
Age group of LPA applicants
24
Family Court Statistics Quarterly April to June 2015
Section 10 – The Probate Service
When a person dies somebody has to deal with their estate (money property and possessions left) by collecting in all the money, paying any debts and distributing what is left to those people entitled to it. Probate is the court’s authority; given to a person or persons to administer a deceased person’s estate and the document issued by the Probate Service is called a Grant of Representation8. This document is usually required by the asset holders as proof to show the correct person or persons have the Probate Service’s authority to administer a deceased person’s estate.
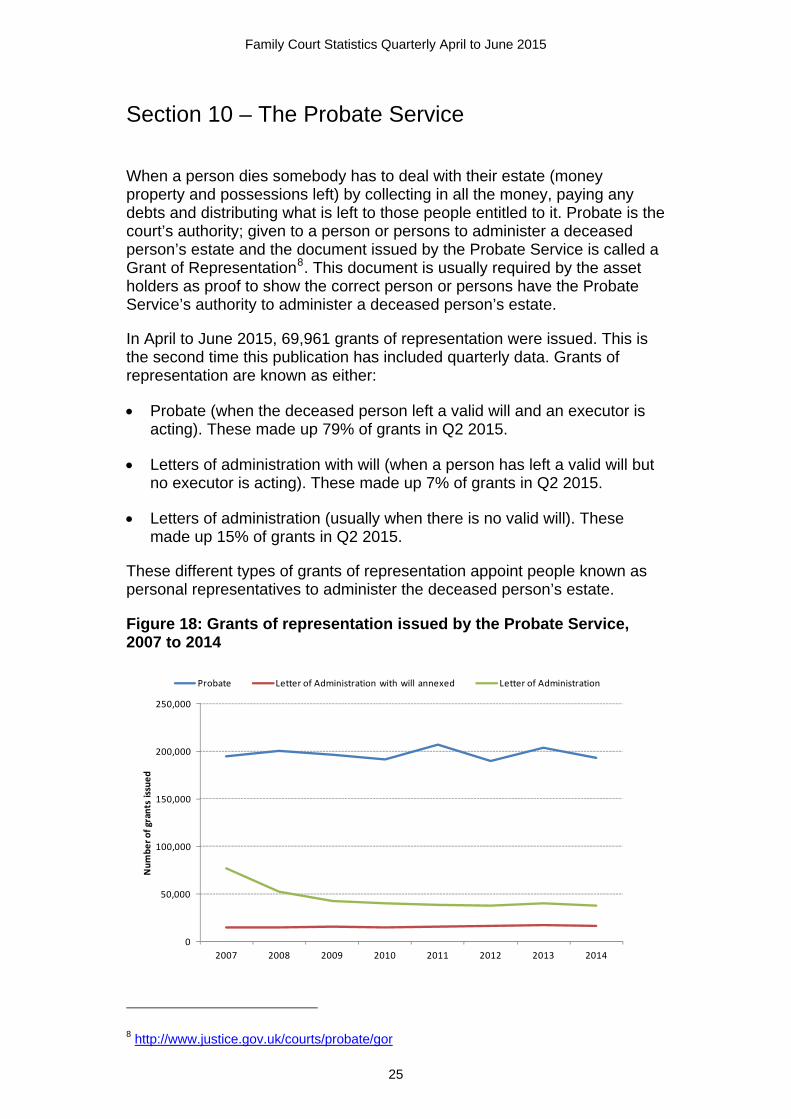
In April to June 2015, 69,961 grants of representation were issued. This is the second time this publication has included quarterly data. Grants of representation are known as either:
Probate (when the deceased person left a valid will and an executor is acting). These made up 79% of grants in Q2 2015.
Letters of administration with will (when a person has left a valid will but no executor is acting). These made up 7% of grants in Q2 2015.
Letters of administration (usually when there is no valid will). These made up 15% of grants in Q2 2015.
These different types of grants of representation appoint people known as personal representatives to administer the deceased person’s estate.
Figure 18: Grants of representation issued by the Probate Service, 2007 to 2014
0
50,000
100,000
150,000
200,000
250,000
2007 2008 2009 2010 2011 2012 2013 2014
Number of grants issued
Probate Letter of Administration with will annexed Letter of Administration
8 http://www.justice.gov.uk/courts/probate/gor
25

Family Court Statistics Quarterly April to June 2015
In April to June 2015, 63% of applications were made by solicitors and 37% were personal applications.
Current structure of the Probate Service
The Probate Service is currently made up of:
The Principal Registry in London
11 District Probate Registries
18 Probate Sub-Registries situated throughout England and Wales
In April to June 2015, 6% of grants were issued by the Principal Registry and 94% by District Registries and Sub-Registries.
When a probate case is contested, The Chancery Division of the High Court deals with the matter. See the Guide to Court and Administrative Justice Statistics for more information on The Chancery Division. There were 21 contested cases in April to June 2015.
26
Family Court Statistics Quarterly April to June 2015
27
Contacts
Press enquiries on the contents of this bulletin should be directed to the MoJ or HMCTS press offices:
Hugo Biggs Tel: 020 3334 3514 Email: [email protected]
Mark Kram Tel: 020 3334 6697 Email: [email protected]
Other enquiries about these statistics should be directed to the Justice Statistics Analytical Services division of the MoJ:
Bridgette Miles Ministry of Justice 102 Petty France London SW1H 9AJ Tel: 020 3334 4571 Email: [email protected]
General enquiries about the statistics work of the MoJ can be emailed to [email protected]
General information about the official statistics system of the UK is available from http://statisticsauthority.gov.uk/about-the-authority/uk-statistical-system
© Crown copyright Produced by the Ministry of Justice
Alternative formats are available on request from [email protected]