Embed Size (px)
Citation preview

Family Fitness Zones Increase MVPA
Deborah Cohen, Terry Marsh,Stephanie Williamson, Thom McKenzie,
and Daniela Golinelli
February 2011

2
Background
• With funding from numerous sources, the Trust for Public Land worked with the County and City of Los Angeles to install Fitness Zone equipment
• RWJ Active Living Research Program provided funding to RAND to evaluate their impact on physical activity in 12 parks

3

4
Study Questions
• How well is the TPL fitness equipment used after installation?– Which age, gender, race/ethnic groups use it?– How often do they use it?– Do they use it correctly?
• Do more people use the park (Fitness Zones plus other activity areas)?– Are they more physically active than when the
equipment was not available?
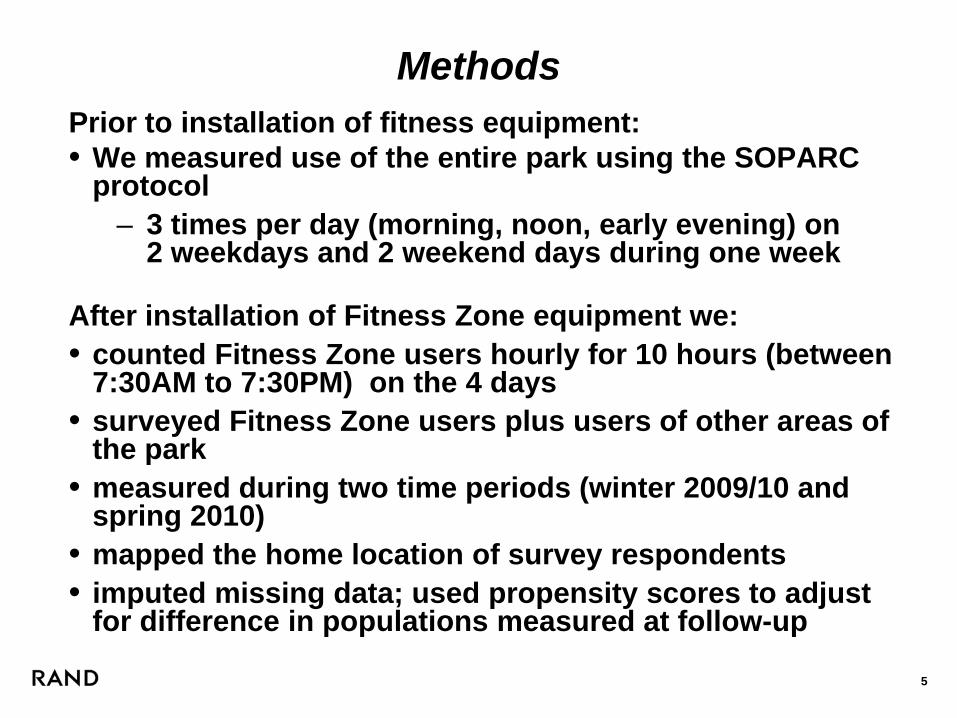
5
MethodsPrior to installation of fitness equipment:• We measured use of the entire park using the SOPARC
protocol – 3 times per day (morning, noon, early evening) on
2 weekdays and 2 weekend days during one week
After installation of Fitness Zone equipment we:• counted Fitness Zone users hourly for 10 hours (between
7:30AM to 7:30PM) on the 4 days • surveyed Fitness Zone users plus users of other areas of
the park • measured during two time periods (winter 2009/10 and
spring 2010)• mapped the home location of survey respondents• imputed missing data; used propensity scores to adjust
for difference in populations measured at follow-up

6
Park Characteristics
Park Countyor City
1-mile Population Estimate (2000)
Acres % Hispanic % Black % Poverty
48th
Street*City 64,409 1 67.9 30.1 39.8
Alondra* County 37,962 15.6 (84) 42.7 9.9 15.5
Athens County 24,192 20 52.1 45.4 31.7
Cerritos* County 26,391 14.4 (56) 19.3 8.4 6.8
Gilbert* City 72,292 18 81.5 17.4 41.5
Ladera County 33,213 15.9 19.1 68.6 14.9
Pathfinder County 7,581 29 25.9 1.9 8.0
Salazar City 42,278 8.4 97.3 0.3 61.5
Slauson* City 48,529 3.6 83.6 14.8 41.5
South* City 70,060 18 78.6 20.4 41.0
Steinmetz County 19,978 12.8 52.1 1.4 11.9
Trinity City 44,678 2 89.5 8.2 37.5
Average 40,964 14.4 59.1 18.9 29.3* Parks with an increase in use after FZ were installed.
7
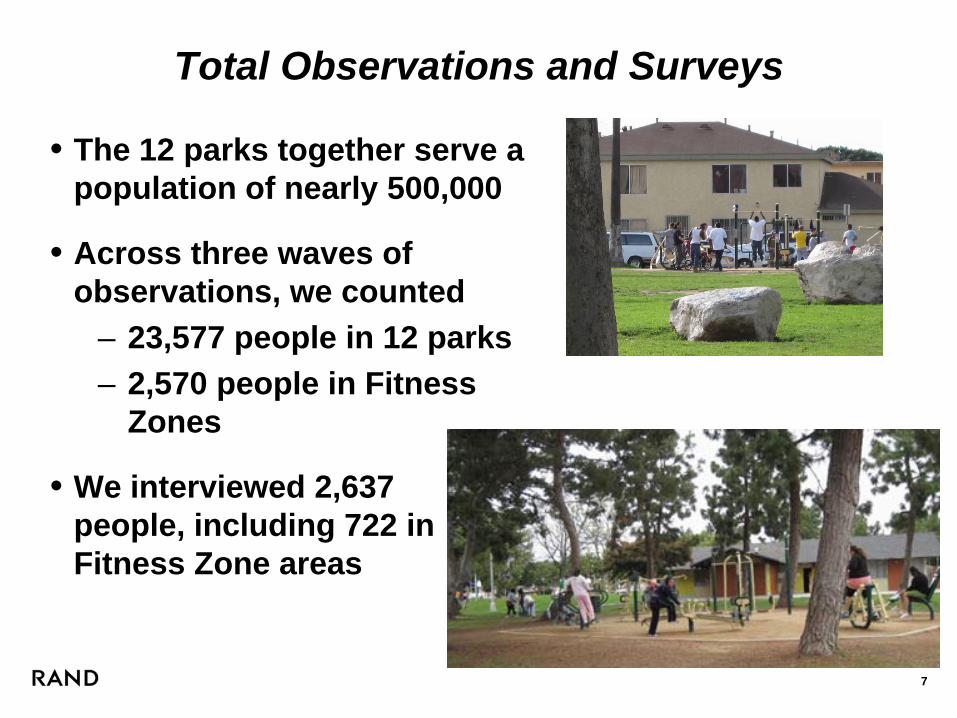
Total Observations and Surveys
• The 12 parks together serve a population of nearly 500,000
• Across three waves of observations, we counted
– 23,577 people in 12 parks– 2,570 people in Fitness
Zones
• We interviewed 2,637 people, including 722 in Fitness Zone areas

8
Characteristics of Fitness Zone Usersvs. Others in Park
Interviewed at Baseline
Interviewed in Fitness Zone, 1st Follow-up
Interviewed in Fitness Zone, 2nd Follow-up
Total 742 377 345Male 45.6% 40.3% 37.7%Female 54.4% 59.7% 62.3%Latino 74.1% 78.2% 81.2%African American 8.5% 8.0% 10.1%
White 12.1% 5.0% 4.1%Asian/Other 0.8% 8.8% 4.6%Adults 91.3% 95.1% 96.2%Seniors 8.7% 4.9% 3.8%

9
Which Age and Gender Groups Use the FZ?
0%
10%
20%
30%
40%
50%
60%
70%
Male Female Children Teenagers Adults Seniors
Baseline (Entire Park)
1st Follow-up (Fitness Zone Only)

10
Ethnicity/Race
0%
10%
20%
30%
40%
50%
60%
70%
80%
Latino White African American Other
Baseline (EntirePark)1st Follow-up(Fitness Zone Only)

11
On Average, 5% of Park Users Werein the Fitness Zones

12
Fitness Zone Equipment Is Used All Day Long(Average Users Observed in One Scan Each Hour)

13
Fitness Zone Use Varies Less Than Total Park Use by Day of the Week

14
Percentage Coming to the Park Solely to Use Fitness Zone Equipment
*Propensity score analysis confirms increase in new users at first follow-up (+2.3%=53% increase)
*controls for age, race, gender, ethnicity, distance from the park, participation in park activities, physical activity at work
0
10
20
30
40
50
60
70
80
Park Users Fitness Zone Users
Perc
ent
1st FU 2nd FU

15
Is Equipment Used Correctly?
• Proper use of Fitness Zone equipment improved over time– 65.1% were observed using the equipment properly in
the 1st follow-up compared to 71.1% in 2nd follow-up• Sit-up bench (33.8%) and
leg curl (40.5%) were least likely to be used correctly
• Horizontal bars and stationary bike were most likely to be used correctly (100%)

16
Which Equipment Is Used Most?
* Only 1 park with Stationary Bike (Alondra)

17
Distance Fitness Zone Users Live from Park(1st and 2nd Follow-up Combined)
Average: 0.85 milesRange: 0.002 – 15.6 miles
Average: 1.07 milesRange: 0.002 – 20.6 miles

18
Time Spent in Fitness ZonesVersus Time in the Park
(1st Follow-up)
19
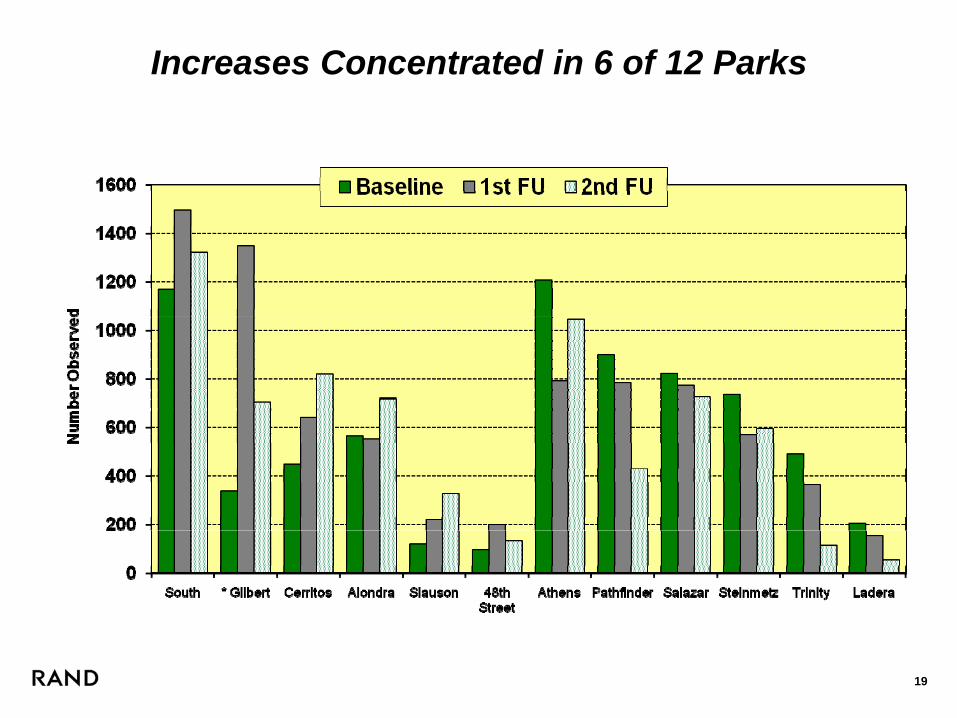
Increases Concentrated in 6 of 12 Parks

20
Population Density Differs in Overall Use Between Parks With and Without Increases
Increased use No increase
Number of parks with an increase in use
6 6
Average acreage 11.8 14.7
Average population density 53,274 28,653
% Latino in population 62.3% 56.0%
% Black in population 16.8% 20.9%
County vs city parks 4 city 4 county
% population in poverty 31.0% 27.6%

21
Total METs (12 Parks)1 MET = Energy at rest for 1 hour
1.5 = Sedentary, 3.0 = Walking, 6.0 = Vigorous

22
METs Increased in 7 of 12 Parks

23
Percent Change in METs

24
Cost-Effectiveness is FavorableAssumptions:• $45,000 per zone for 15 years or $3000/year• If maintenance is $2000 per year, annual cost is
$5000• Assume that average METs expended between
time 1 and 2 holds for 12 hours/day, 7 days/week, 48 weeks/ year
• Cost per MET is $0.09/MET per FZ• For adults, less than $0.50/MET is considered
cost-effective; thus FZ more cost-effective than many other evaluated physical activity interventions

25
Summary• Fitness Zones provided benefits in some parks
– Attracted new park users initially– Used throughout the day, though not all equipment used
equally – FZ users exercised more and used park more frequently than
other park users
• Greater increase in parks with greater population density– Increase in total energy expended– Park users reported that they increase exercise and visited
parks more often
• Park users reported equipment well maintained, instructions clear
• Fitness Zones can provide cost-effective approach to increasing physical activity in some parks

26
Limitations
• Calculations of Fitness Zone use underestimate actual use, since scans are hourly, and Fitness Zone users stay shorter amounts of time than other park users
• Baseline at one park had to be estimated, considered too dangerous before FZ installed
• Currently uncertain whether changes due to secular trends
• Future analyses will compare overall park use with similar parks that did not get Fitness Zones

27
Conclusions
• Fitness Zones are an important addition, especially to small parks
• Recommend installing equipment most favoredby users
• Should add outreach efforts to increase equipment use

28
Thanks to the Promotoras
All data were collected by the Promotoras of AltaMed
and
Thanks to the RWJF Active Living Research ProgramandNational Heart Lung and Blood Institute, NIH