Embed Size (px)
Citation preview

© copyright
Family, Population, and Sustainable Development
Dr. Maria Sophia Aguirre Department of Business and Economics
The Catholic University of America
International Congress on Family and Society Universitat Internacional de Catalunya (UIC)
May 15-17, 2008

© copyright
Is the Family Relevant for Economic Development?
§ Some would argue that the family is key because:
Ø The earth is limited Ø The family is a hostile place for women and children Ø Large families threaten countries’ stability
§ Others argue that the family is key because:
Ø Healthy families are needed for the economy to fulfill its purpose. Therefore it is a reference point for policy
Ø Growth of the population does not equal poverty Ø The aging population “trap” threatens sustainable
economic growth and development

© copyright
How Does the Family Fit in the Economy?
Basic Activities Means Used Role of the Family
Purpose
Production Resources Human Capital Basic Needs
Exchange Market Human, Moral, Social Capital
Profit
Consumption Optimization and Distribution
Appropriate distribution
Wellbeing (welfare)

© copyright
Ø There is a positive correlation between ü human capital, infrastructure and economic growth ü healthy institutions and economic development ü health and income per capita
Ø These positive correlations reflect an essential causal link running from human capital to ü healthy institutions (social capital) ü infrastructure and technology
Ø Life expectancy is a significant predictor of economic growth
We know from economic analysis that in economic development

© copyright
Life Expectancy at Birth
Source: Human Development Report, 2007, Table 1
Sub-Saharan Africa
South Asia
Arab States
Central, Eastern Europe
& CIS
East Asia & Pacif ic
Latin America & Caribbean
High Income OECD
0
20
40
60
80
10029.8 years
© copyright
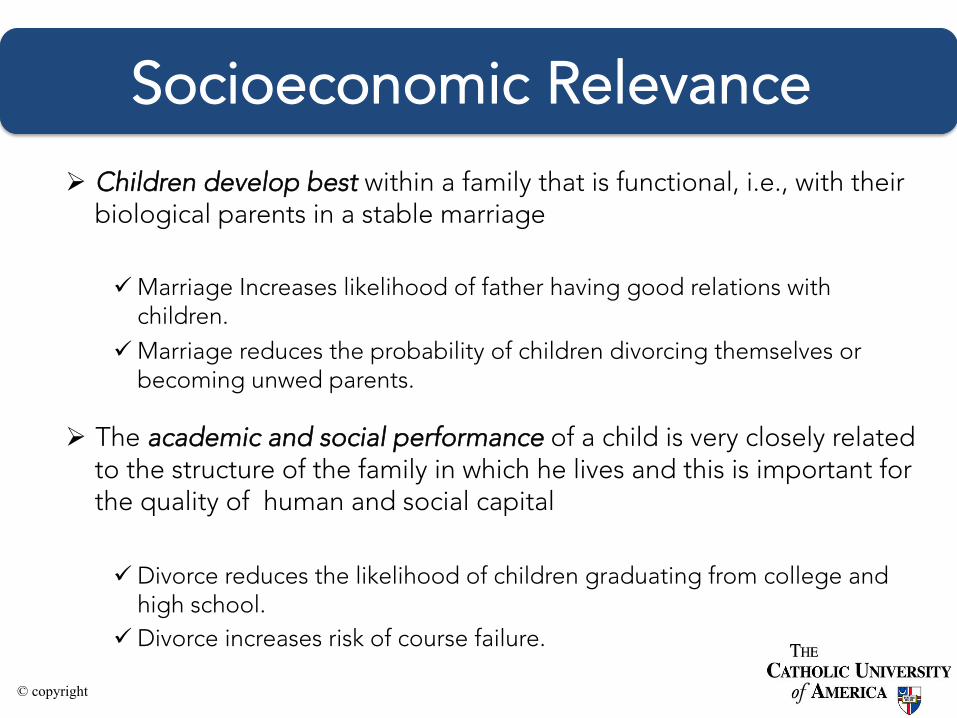
Socioeconomic Relevance Ø Children develop best within a family that is functional, i.e., with their
biological parents in a stable marriage
ü Marriage Increases likelihood of father having good relations with children.
ü Marriage reduces the probability of children divorcing themselves or becoming unwed parents.
Ø The academic and social performance of a child is very closely related to the structure of the family in which he lives and this is important for the quality of human and social capital
ü Divorce reduces the likelihood of children graduating from college and high school.
ü Divorce increases risk of course failure.

© copyright
• The psychological stability and health of a child is closely related to healthy families and this is important for worker productivity and government finances
ü Children enjoy better physical health, on average, than other family forms.
ü Sharply reduces infant mortality. ü Increases life expectancy, especially for men ü Associated with reduce abuse of alcohol, and substance abuse for
adults and teens. ü Associated with better health and lower probability of injuries for both
men and women. ü Lower levels of physiological distress and mental illness. ü Mothers have lower levels of depression than single or co-habiting
mothers.

© copyright
Ø The breakdown of the family is a symptom of a sick and weak society
ü Abuse of women is 25 times more likely to occur in an irregular family. ü Men who have witnessed domestic violence are three times more likely to
abuse their own wives and children. ü Substance abuse and teen-age pregnancy is higher in broken families. ü Women and children of broken families have a higher probability of living in
poverty. ü Increase of the social welfare expenditures burden. ü Higher levels of suicide. ü Boys from single parents have are more likely to engaged in delinquent and
criminal behavior

© copyright
Percentage of Families that are in Poverty by Family Structure and Ethnicity, 2006
Source: Annual Demographic Survey, Poverty in the U.S.: US Census Bureau, August 2007, Table POVO2.
5.2
26.5
9.1
39.1
9.4
39.1
14.4
36.9
0
10
20
30
40
50
60
70
Married Single Married Single Married Single Married Single
White Asian and Pacific Black Hispanic

© copyright
Percentage of Women who are in Poverty by Family Structure and Ethnicity, 2006
Source: Annual Demographic Survey, Poverty in the U.S.: US Census Bureau, August 2007, Table POVO3.
Percentage of Women who are in Poverty by Family Structure and Ethnicity
6.6
33.5
11.5
44.3
16.7
42.1
7.6
25.3
05
101520253035404550
Married Single Married Single Married Single Married Single
White Black Hispanic Asian

© copyright
Percentage of Children who are in Poverty by Family Structure and Ethnicity, 2006
Source: Annual Demographic Survey, Poverty in the U.S.: US Census Bureau, August 2007, Table POV21.
Percentage of Women who are in Poverty by Family Structure and Ethnicity
7.5
37.8
12
49.7
18.5
47.2
9.2
36.2
0102030405060
Married Single Married Single Married Single Married Single
White Black Hispanic Asian

© copyright
Developed Countries Welfare Expenditures vs. Developing Countries Debt in 2007
Source: CIA World Handbook, 2008
1250
867
404
433
89.9
221
140
3416
70235
0 200 400 600 800 1000 1200 1400
US
Germany
France
UK
Spain
Brazil
Mexico
Nigeria
Million of Dolalrs
DebtWelfare Expenditures

© copyright
The family faces serious health and poverty problems, especially in the developing world
• Lack of income and assets to attain basic needs: ü Human assets ü Natural assets ü Physical assets ü Financial assets ü Social assets ü Aging security
• Vulnerability to adverse shocks are linked to an inability to cope with them

© copyright
Environmental Health, Welfare and Living Conditions in Low Income vs Developed Countries
Indicator % access House Connection: water 48 / 99 House Connection: sewerage 46 / 99
House Connection: electricity 62 / 100 Access to Improve Water Sources 61 / 100 Access to Sanitation 43 / 100 Solid waste disposal: landfill or incinerated 31 / 78 Solid waste disposal: other (dump,recycled,etc.) 66 / 22 Paved Road 19 / 94 Literacy 53.6 / 100 Under-five mortality (per 1000) 153 / 6 Public Expenditures on Health (%GDP) 1.5/ 6.2
Sources: World Bank, UN, 2006

© copyright
Causes of Death in Women and Men, 2005
WHO, World Health Report, 2007 , Projected deaths by region, sex and cause for 2005, 2015, 2030.
5 million new cases per year
8 million new cases per year
300-500 million new cases per year

© copyright
One-Year-Olds Fully Immunized
Source: Human Development Report, 2007, Table 6
Latin America
& Caribbean
South Asia
Central, Eastern Europe & CIS
East Asia & Pacific
Arab States
Sub-Saharan Africa
0
20
40
60
80
100
120
TuberculosisMeasles
20% Decrease Tuberculosis Immunizations
33% Decrease Measles Immunizations

© copyright
Infant Mortality Rates
Source: Human Development Report, 2007; Table 10
Sub-Saharan Africa
South Asia
Arab States
East Asia & Pacif ic
Latin America
& Caribbean
Cental, Eastern Europe
& CIS
High-income OECD
0
20
40
60
80
100
120
95.9% Decrease

© copyright
Low Cost Effective Interventions Cost of Treatment and (annual cost per capita)
US Dollars
Treatment Costs Effectiveness
Chemotherapy for TB (6 months ) $20.00 ($0.60)
95%
Contraceptives (HIV) $14.00 ($1.90)
99% (85%-95%)
Hydration salts for Diarrhea
$0.33 ($1.60)
95%
Pneumonia Antibiotics (5 days antibiotics) $0.27 High
Measles (1 dose of vaccine) $0.26 ($0.50)
98%
Malaria Pills / Nets
$1 / $0.5 ($0.05/$4.5)
100%
Sources: CDS, WHO

© copyright
Ø Cost of malaria to African countries is 1.3% of GDP per year, productivity of the worker is reduced by 60%. Direct and indirect costs of malaria in sub-Saharan Africa in term of overall GDP is equivalent to a loss of $100 billion annually.
Ø 75% of TB infections and deaths occur in the 15-54 year age group (the most productive group). 20%-30% of Income is lost due to TB.
Ø AIDS places seventh among the leading causes of death. The main mode of transmission are homosexual and heterosexual promiscuity and injected-drug-use (IDU) (all high risk behavior).
Ø Majority of maternal deaths are due to poor access to health care (1.9% of female death)
Sources: Scaling Up the Response to infectious Diseases, 2002 and RBM 38, WHO, 2005

© copyright
Solutions often Proposed
Ø Outlined in the 8 UN Millennium Development Goals.
Ø Population control ü Aging population trap
Ø “Safe sex” and antiretroviral drugs. ü Condoms are not the answer to HIV and increases the
risk of contracting AIDS (British Medical Journal (2008), Chin (2007)
ü Not a solution for IUD and Heterosexual transmission ü Access to family planning increases sexual promiscuity
(Kaiser 2000, Paton 2002, USAID 2002)

© copyright
The Population Control Argument
§ First: rapid growth in population means the spread of poverty and aggravates conditions such as as poor health, malnutrition, illiteracy, and unemployment (Bucharest, 1974)
§ Second: population threatens government stability in developing countries, and encourages confrontation between developed and developing countries (Memorandum 200)
§ Third: it pushes future generations to scarcity, and an unsustainable environment carrying capacity (Rio, 1992)
§ Fourth: it sees population growth to be symptomatic of the larger problem of women's oppression—the more children a woman has, the less opportunity she has for her own self-actualization and development (Cairo, 1994 and Beijing, 1995)

© copyright
Aging Trap Ø Social security system funding: the family cannot support
the elderly Ø Competition between the younger and older people Ø Early retirement Ø To provide for the economic needs of the elderly, there is a
reduction of funding allocated to training new generations Ø The transmission of cultural, scientific, technical, artistic,
moral, and religious goods is endangered: "moroseness” results. Add to this immigration.
Ø Saving rates are affected by a society's age structure, mirroring the change in an individual's saving rate over the life cycle.

© copyright
Speed of Population Aging
Number of years for % of population aged 65 and over to rise from 7% to 14%
115
85
73
69
65
53
47
45
45
41
26
27
27
25
24
23
23
22
21
20
France
Sweden
Australia
United States
Canada
Hungary
Poland
United Kingdom
Spain
Azerbaijan
Japan
China
Singapore
Chile
Jamaica
Sri Lanka
Tunisia
Thailand
Brazil
Colombia
Source: US Census Bureau, 2000

© copyright
Expenditure on Grant-Financed Development Activities of the United Nations System by Sector
(Percentage of Total)

© copyright
0
5
10
15
20
25
1990
1991
1992
1993
1994
1995
1996
1997
1998
1999
2000
2001
2002
2003
2004
Year
Per
centa
ge
of
Tota
l
Population Education
Expenditures on Grant-Financed Development Activities of the United Nations System by Sector
Source: Compiled from Comprehensive Statistical Data on Operational Activities for Development, years 1990-2006.

© copyright
SUSTAINABLE GROWTH REQUIRES
ü Savings ü Wealth ü Investment: Physical and Human Capital

© copyright
0
5000000
10000000
15000000
20000000
25000000
Less than high school High school Some College College
Married Single-parent Co-habiting
Average of NETWORTH
EDCL
MARRIED
Average Net Worth within the USA per Education Level
Sources: Aguirre (2007)
253%
333%

© copyright
Average Net Worth in USA per Age Classification
0
5000000
10000000
15000000
20000000
25000000
30000000
35000000
40000000
Married Single-parents Co-habiting
<3535-4445-5455-6465-74>75
Average of NETWORTH
MARRIED
AGECL

© copyright
Average Net Wealth in Canada
per Family Structure
Wealth in Canada
0
20,000
40,000
60,000
80,000
100,000
120,000
140,000
160,000
Married Co-Habiting Single-Parent
Marital Status
Can
adia
n D
olla
rs
WealthHousing
155% 250%

© copyright
0
50,000
100,000
150,000
200,000
250,000
Less HS HS Terciary College
Level of Education
Ca
na
dia
n D
olla
rs
MarriedNot-Married 242%
Net Wealth in Canada

© copyright
Percentage of Head of Households that Report Owning Property and Holding Savings
0.00%
10.00%
20.00%
30.00%
40.00%
50.00%
60.00%
70.00%
Unions Married Separated Divorced Widowed
Own HomeHold Savings
Source: ENEI (2004)

© copyright
Level of Education of the Head of Household per Race and Family Structure
0102030405060708090
LAD INDIG LAD INDIG LAD INDIG LAD INDIG LAD INDIG LRACE INDIG
Unions Married Separated Divorce Widows Single Parents
Family Structure
Per
cent
age
of H
ouse
hold
s
No-education Grade School High School
Terciary College Graduate
Sources: ENEI (2004)

© copyright
Children School Attendance by Family Structure
0
1000
2000
3000
4000
5000
6000
7000
8000
Unions Marriage Separated Divorce Widows
Family Structure
Head
Cou
nt
IndigenousLadino
Sources: ENEI (2004)

© copyright
How Government Policies Can Help: Some Examples
Ø Legislation that supports families vis a vis other types of living styles
Ø Programs that support and promote healthy marriages and stable families
Ø Changes in family subsidies/penalties for children
Ø Parental leaves, work structure
Ø Promotion and protection of the family as a means to eradicate poverty, especially the feminization of poverty
Ø Programs directed towards fostering functional societies and markets, where corruption is not a fundamental part of governmental operations.

© copyright
Education • Transfer all government aid throughout voucher system
• Differentiate voucher, targeting more resources to the most needed (with higher cost of education)
• Spread out info about the key role of family within society and effect on educational outcomes
• Enhance parents’ owes and rights to educate their children (e.g areas such as sexual education)
• Allow parents (and or teachers) to get engage in municipal school management

© copyright
Competitive Funds
• Prevent domestic violence and enhance health family relationships
• Sexual education programs designed and chosen at school level by parents and teachers
• Pre-marriage orientation • Support programs for couple in crisis • Programs aim to prevent alcoholism and
drug abuse

© copyright
Conclusion Ø The family is a necessary good for economic
development: it should be promoted and protected if poverty reduction wants to be achieved.
ü Children develop in the best way within a family that is functional, i.e., with his biological parents in a stable marriage.
ü The breakdown of the family: damages the economy and the society since human, moral, and social capital is reduced and social costs increased.

© copyright
Ø The Neo-Malthusian approach is seriously flawed on many levels and policy actions based on such assumptions are inefficient and damage real sustainable development. They lead to:
ü Aging trap: one child policy ü Weakening of the family ü Health problems ü Financial burden for government
Ø Some of the recent reevaluations of family policies in developed countries seem to point in the right direction.

© copyright
Ø Family structure is relevant for wealth. This happens to be the case after other characteristics are controlled by.
Ø The impact of children on family wealth is best within marriage.
Ø Evidence seems to hold across countries. In socialized market economies the negative impacts seem to be mitigated but not eliminated.
Ø Life-cycle theory of savings seems to be supported by empirical evidence.
Ø Healthy family structures support private property.