Embed Size (px)
Citation preview
Population Pyramid Research Project
Part 1: Online research
Procedure:
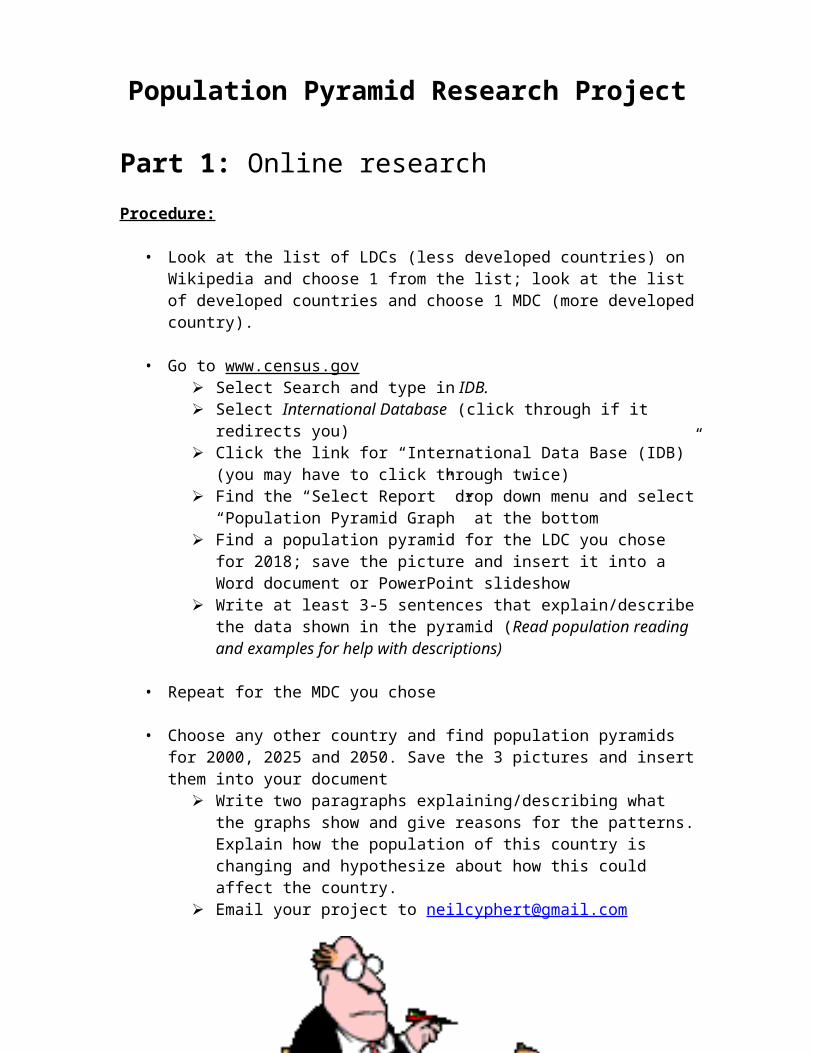
• Look at the list of LDCs (less developed countries) on Wikipedia and choose 1 from the list; look at the list of developed countries and choose 1 MDC (more developed country).
• Go to www.census.gov Select Search and type in IDB. Select International Database (click through if it redirects you) Click the link for “International Data Base (IDB)” (you may have to
click through twice) Find the “Select Report” drop down menu and select “Population
Pyramid Graph” at the bottom Find a population pyramid for the LDC you chose for 2018; save the
picture and insert it into a Word document or PowerPoint slideshow Write at least 3-5 sentences that explain/describe the data shown in
the pyramid (Read population reading and examples for help with descriptions)
• Repeat for the MDC you chose
• Choose any other country and find population pyramids for 2000, 2025 and 2050. Save the 3 pictures and insert them into your document
Write two paragraphs explaining/describing what the graphs show and give reasons for the patterns. Explain how the population of this country is changing and hypothesize about how this could affect the country.
Email your project to [email protected]
Part 2: Family Research
Making an Age Pyramid
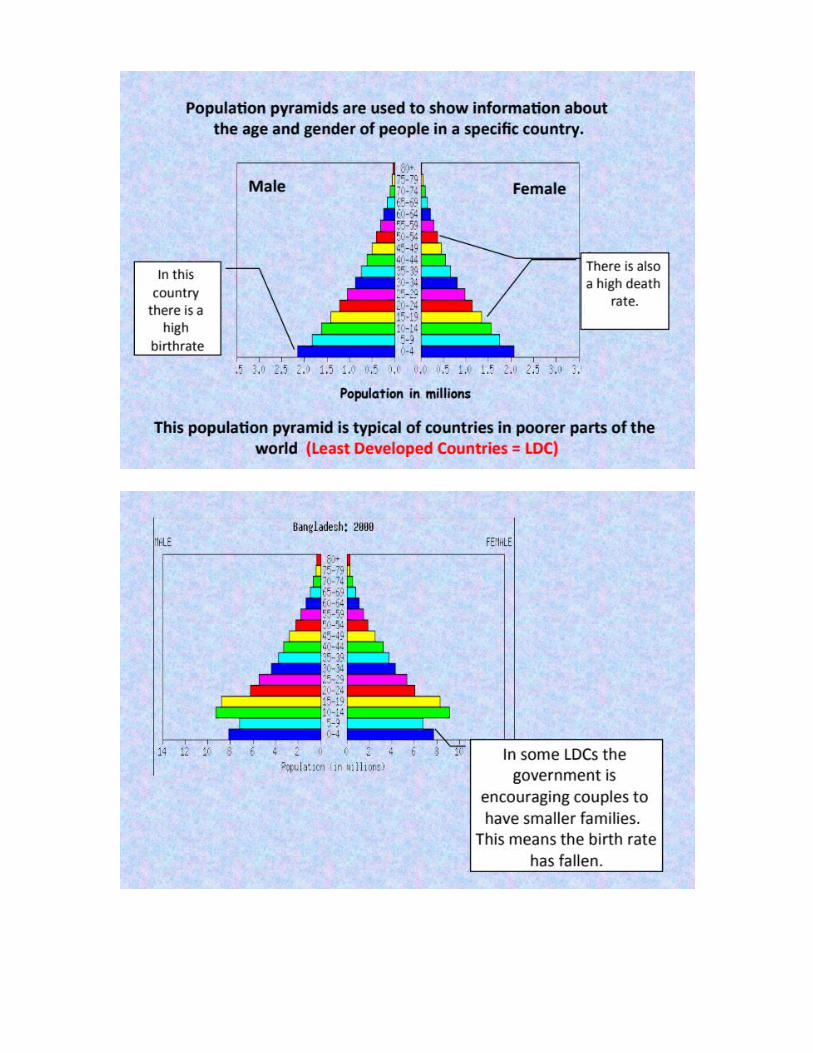
Population growth is affected by age structure the number of people in different age groups as well as by the numbers of births and deaths. Age structure is usually illustrated by an age pyramid, a graph in which horizontal bars represent the percentage of the population in each age groups. Males are shown on the left and females on the right. The ages (or in some cases the year of birth) for each bar is listed along the vertical axis of the graph, usually in five-year intervals. Each age group is called a cohort. The longer a bar is, the greater the proportion of people in that age group.
Procedure:
1. Collect information to complete the family population form on the next page. Find out the age and sex of each member of your extended family, beginning with your grandparents. Include all of your aunts and uncles and all of the people in your generation, like your brothers, sisters, and cousins. If you don’t know exact ages, you should estimate as best as you can.
2. Create an age structure diagram of your extended family. You should hand-draw the diagram using graph paper.
Discussion Questions: put your answers on the back of your age structure diagram
1. What is the percentage of people under 20? Over 60? Is the population of your family a young, growing one, declining one, or a stable one?
2. Is there evidence in your diagram of the baby boom that followed World War II (1946-1964)? If so, is there evidence of the effect of this baby boom in more recent years?
3. Describe any changes that have occurred in your family size over generations. Does anything stand out to you?
4. How does your pyramid compare to that for the United States? If the United States is now at, or slightly below, the replacement level, why is the population of the country still growing? Note: replacement level fertility is 2.1 children born per woman, this can be translated as 2 children per woman to replace both parents. The extra 0.1 accounts for the small number of children who do not survive to reproductive age.
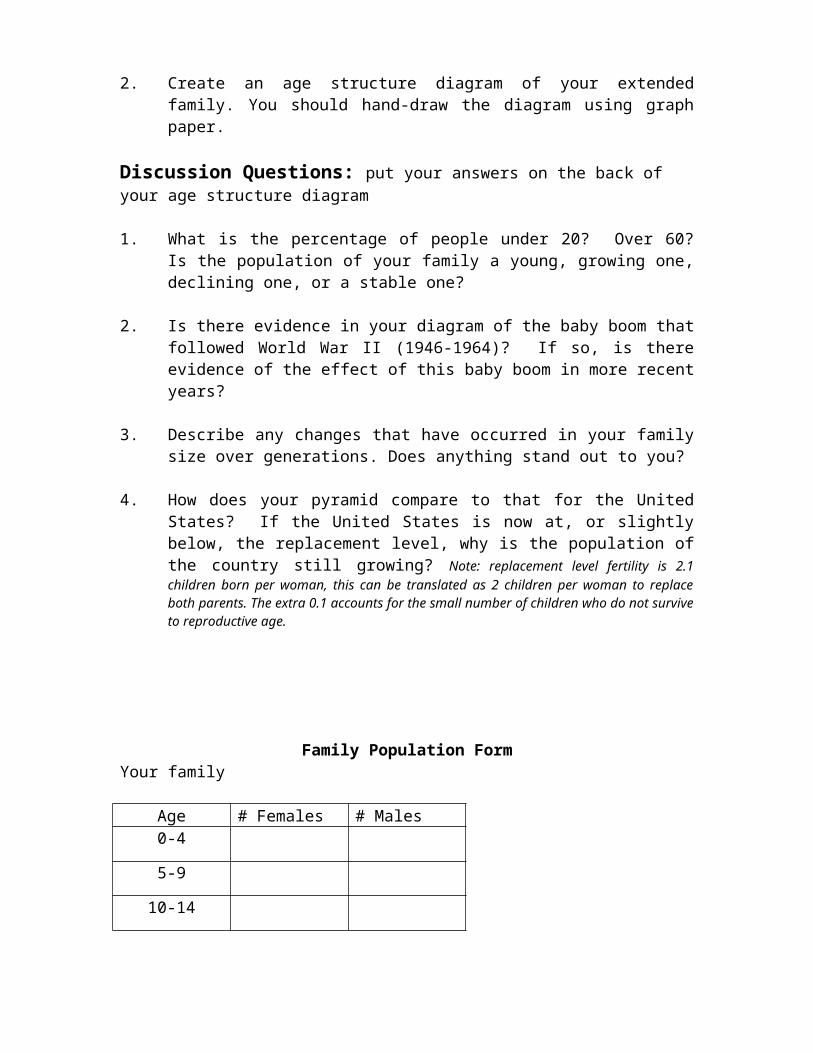
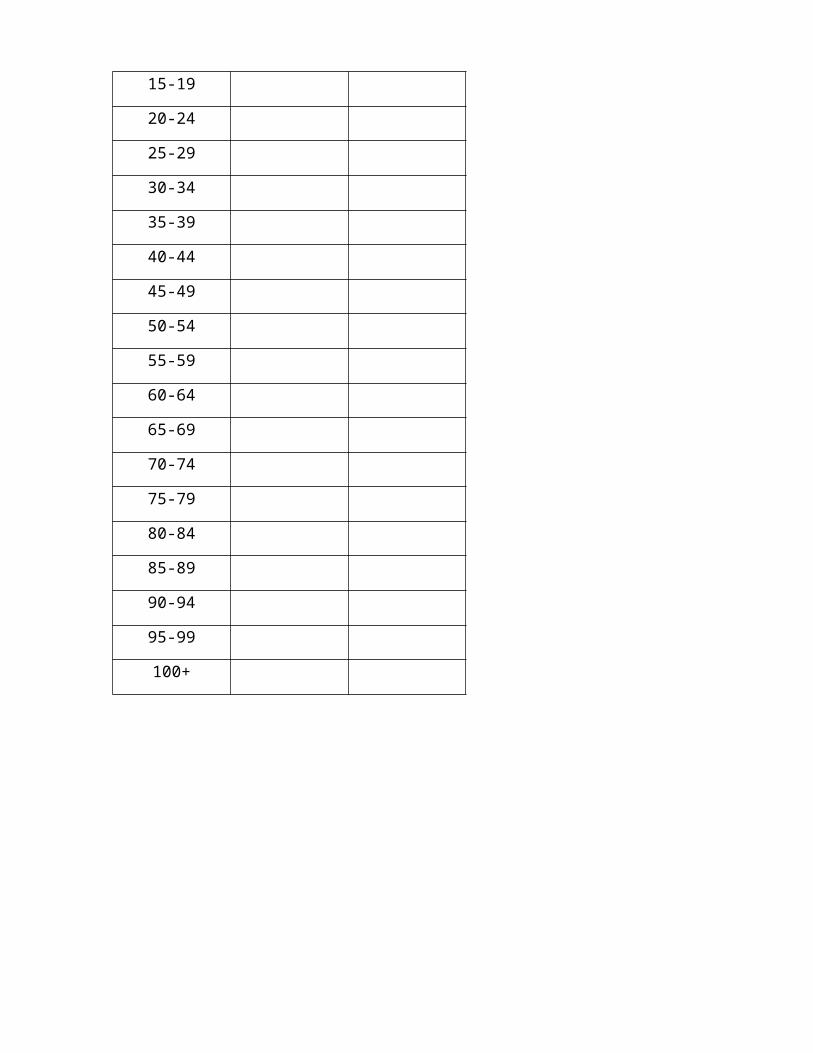
Family Population FormYour family
Age # Females # Males0-4
5-9
10-14
15-19
20-24
25-29
30-34
35-39
40-44
45-49
50-54
55-59
60-64
65-69
70-74
75-79
80-84
85-89
90-94
95-99
100+